王圆圆 , 郭徵, 李贵才, 郭兆迪
国家卫星气象中心,北京 100081
WANG Yuanyaun, GUO Zheng, LI Guicai, GUO Zhaodi
收稿日期: 2016-11-25
修回日期: 2017-04-5
网络出版日期: 2017-08-07
版权声明: 2017 《地理学报》编辑部 本文是开放获取期刊文献,在以下情况下可以自由使用:学术研究、学术交流、科研教学等,但不允许用于商业目的.
基金资助:
作者简介:
作者简介:王圆圆(1981-), 女, 安徽六安人, 博士, 副研究员, 主要从事生态环境遥感应用研究。E-mail: wangyuany@cma.gov.cn
展开
摘要
高精度、长时间序列、空间连续的降水产品是气候分析、水文模拟等众多研究领域中的重要输入。近期欧洲研究人员融合了3种不同类型的降水数据:站点观测、遥感产品、再分析资料,制作了全球1979-2014年3小时一次0.25°空间分辨率的降水产品(Multi-Source Weighted-Ensemble Precipitation, MSWEP),凭借高时空分辨率及其对多源信息的挖掘和融合,该产品一经发布即受到广泛关注。本文利用三峡库区及附近地区气象站点的降水资料对MSWEP月降水数据进行评估,采用广义加性模型算法(General Additive Model,GAM)融合站点降水空间插值结果和MSWEP产品,对三峡库区融合后降水进行分析。主要结论为:① 降水估算精度呈现冬春季偏高、夏秋季偏低的特征,MSWEP产品与站点插值方法具有互补性,前者对夏秋季降水估算精度更高,后者对冬春季降水估算精度更高;② GAM算法可以充分发挥站点插值和MSWEP数据各自的优势,提高区域降水估算精度,与融合前相比,均方根误差减少了17%~50%,相关系数r提高了10%~30%;③ 2003年库区蓄水前后降水变化的主要特征有:库区中部长江以南地区汛期降水(5-10月)下降,库区西部干季(1-4月,11-12月)降水增加,库区外围西北部(大巴山地区)汛期降水增加,降水空间格局异质性增加,干季降水占全年降水比例升高。
关键词:
Abstract
Long time-series, spatially-contiguous and accurate precipitation products are one of the most important inputs for various studies, including climate change detection, hydrological modelling, drought monitoring, etc. However, due to its high spatio-temporal variability, precipitation is one of the meteorological elements that are most difficult to estimate. Recently, a new global gridded precipitation dataset that merges gauge measurements, satellite products, and reanalysis data, has been produced. Owing to its high spatial resolution, long time span, and comprehensive combination of different precipitation data sources, MSWEP data have received wide attention since its release. In this study, we first evaluated accuracy of MSWEP monthly precipitation using local gauge measurements in the Three Gorges Dam region, then produced more accurate precipitation data by combining MSWEP and gauge measurements with the GAM (Generalized Additive Model) method, and finally analysed precipitation changes before and after the dam water level rose to 135 m in June 2003. Main conclusions are drawn as follows. (1) No matter what methods are used, estimation accuracy of precipitation shows strong seasonality: more accurate in cold-dry season (spring and winter), while less accurate in hot-wet season (summer and autumn). Gauge measurement and MSWEP are complementary, with the former being more accurate in cold-dry season and the latter being more accurate in hot-wet season. (2) GAM can take advantages of both gauge measurements and MSWEP with flexibility and achieve more accurate precipitation estimation (rmse decreases by 17%-50%, and r increases by 10%-30%). There are still great seasonal variations in accuracy, with rmse being 8-20 mm in spring and winter and 20-50 mm in summer and autumn. (3) Based on the precipitation estimation results obtained in step 2, we found the following phenomena after the water level rose to 135 m in 2003: 1) dam regions south of the Yangtze River show a precipitation reduction over May-October; 2) dam regions in the western part show a precipitation increase over November-April; 3) The northwestern part outside core dam regions shows a precipitation increase over May-October, which is consistent with the results of other studies; 4) precipitation shows an increase in spatial heterogeneity, but a slight decrease in seasonality conveyed by an increase in proportion of precipitation in dry season.
Keywords:
由于较高的时空异质性,降水是最难估算的气象变量之一[1-3]。目前获取降水信息的主要方法包括:雨量计观测、地基降水雷达、卫星数据反演、数值预报模式模拟等,这些方法在观测原理、算法精度、产品时空分辨率和覆盖范围等方面存在巨大差异和互补性[4]。融合多源信息,获取高精度、长时间序列、空间连续的降水产品已成为众多研究领域(气候分析、水文模拟、生态监测等)中的热点之一[4-7]。近期,欧洲研究人员[4]制作了1979-2014年全球3小时一次的0.25°分辨率的降水产品(Multi-Source Weighted-Ensemble Precipitation, MSWEP),该产品根据站网密度、卫星降水反演精度、数值预报降水精度,适时调整权重,再通过加权平均的方式融合上述3种降水的结果,利用全球125个通量塔的降水观测作为独立样本进行检验,结果表明MSWEP的精度高于其他常用降水产品(WFDEI-CRU,GPCP-1DD, TMPA 3B42,CPC unified)。目前已有多名学者正在利用MSWEP数据开展水文模拟、气候变化等方面的研究。
三峡地区地形复杂,人类活动强度大,景观破碎度高,作为世界最大的水电工程——三峡水库修建后,原本有植被覆盖的陡峭山坡被平坦水域所代替,下垫面的变化如何影响当地及周边地区的降水,一直是众多学者关注和研究的对象[8-14]。部分学者认为三峡水库建立后,会增加库区气候的海洋性特征,对极端天气事件的影响不明显[13],对降水的影响也不明显[8-9]或仅限于近库区[11];但也有学者认为三峡水库的气候影响不只局限于库区周边数十公里范围,而是可以扩展到数百公里以外的区域,Wu等[10]利用TRMM数据和MM5模型模拟,发现2003年三峡水库蓄水后,北部秦岭大巴山地区的降水增加,而水库邻近地区降水减少;Xiao等[12]利用站点长时间序列(1960-2005年)的观测数据,认为Wu等[10]观测到的现象没有超出降水的自然变化范畴,无法证明是三峡水库的影响。
上述研究中除利用数值模拟技术,主要依赖2种降水数据:站点观测和卫星产品。站点降水虽然精度高,但代表性差,尤其是对于地形复杂的三峡地区;卫星降水产品空间分辨率高,可以进行大面积的整体观测,但时间序列短(1998年至今),精度有限,因此很有必要将站点和卫星数据结合起来,分析三峡库区降水的变化特征。目前常用的方法是利用站点降水对卫星降水进行线性标定,但由于卫星降水误差具有明显的季节性和空间分布特征(例如,对于冬季降水、弱强度降水、地形复杂或高纬度地区,卫星降水误差较大)[15],简单的线性标定无法取得令人满意的效果。近期,广义加性模型(General Additive Model, GAM)正受到学者日益关注[16],GAM具有良好的灵活性、非线性以及对空间数据的平滑处理能力,可以自适应的调整站点插值结果和卫星产品的权重,对两者进行有效融合,前人已开展多项研究,如基于遥感数据估算气温[17]、估算辐射[18-19]、评估滑坡可能性[20]等,结果表明GAM精度高、过学习风险小,是值得推广应用的方法。
本文的研究目的是将最新降水产品(MSWEP)用于三峡库区降水特征分析。首先基于气象站点降水观测数据评估了MSWEP在三峡地区的误差,而后利用GAM算法融合了MSWEP和站点插值降水结果,最后基于融合后的高精度区域降水数据,分析三峡库区在2003年水库蓄水前后的降水变化。本文和以往基于卫星降水的分析相比,在保持高空间分辨率(0.25°)的同时大大延长了时间序列(1979-2014年),利用GAM算法充分发挥台站和卫星数据的优势,提高了降水数据精度。本文研究结论不仅为三峡库区降水变化特征提供了新的信息,也为MSWEP降水产品在局地的精度提供参考。
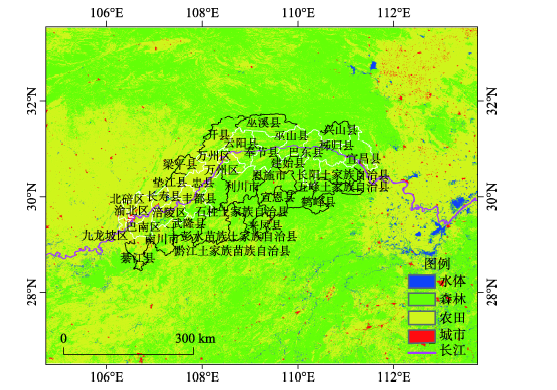
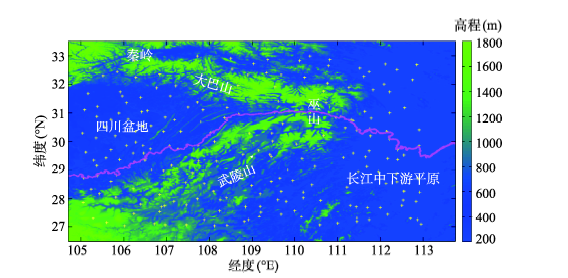
研究区域如图1所示,地理范围:33.375°N~26.625°N、104.875°E~113.625°E(网格中心的经纬度),研究区包含了三峡库区及周边地区,选择如此大的范围一方面是为了增加区域内站点数量,另一方面是为了观察库区和周边区域在降水变化特征方面是否有明显不同。三峡库区的范围大致位于32°N~28°N、106°E~112°E,库区内共有34个县(区),靠近库区的沿江县(区)有12个(白色矢量),其余22个为远库区县(区)(黑色矢量)。根据长江两岸地表特征,可以将库区分为两段,重庆至万州为西段,该段区域内长江走向为西南—东北方向,长江北岸地形平坦,以农田覆盖为主,长江南岸地形略有起伏,地表覆盖为农田、森林交错。从云阳至宜昌为东段,该段内长江走向开始水平向东而后向东南倾斜,长江两岸均为浓密的森林,峡谷地形突出。长江离开库区东段以后,来到地势平坦地区,农田为主要土地覆盖。三峡库区在2003年6月蓄水,水位由66 m涨至135 m。图2显示了研究区的地形图、主要山脉和220个气象站点位置。可以看出,站点的分布比较均匀,两两站点之间距离的平均值是380 km。
图1 研究区2006年MODIS土地覆盖图及库区县位置
Fig. 1 Land cover of the study region (MCD12 product in 2006) as well as the boundaries of counties located near the Yangtze River
图2 研究区高程、站点分布和主要山脉
Fig. 2 DEM, meteorological stations network, and main mountains of the study region
MSWEP数据:1979年1月至2014年12月MSWEP数据产品,空间分辨率为0.25°,时间分辨率为月(原始数据为3小时一次,处理为月累计降水)。根据研究范围,提取研究区内格点上MSWEP降水数据时间序列。MSWEP数据的生成过程和下载地址请参考 文献[4]。
气象站点数据:从国家气象信息中心的数据库中获取了三峡库区及周边范围内的220个气象站点1979年1月-2014年12月的月降水数据,根据站点经纬度确定其所属的0.25°格点,并提取该格点上MSWEP月降水数据,用于对比分析。
2.3.1 三峡库区站点降水插值和MSWEP数据的精度对比 尽管MSWEP数据已包括了站点的降水观测信息[4],但只利用了全球的一小部分站点,在局部区域如果有更密集的气象台站(如本研究区有220个气象站),利用插值算法也可以得到空间连续的降水数据,那么MSWEP降水数据和区域降水插值结果比较,谁的精度更高?
为了对此进行分析,本文针对每个站点每个月提取了3种降水数据,分别是:① 该站点对应格点上的MSWEP月降水数据
2.3.2 基于GAM方法融合站点观测和MSWEP数据 由于区域插值算法和MSWEP降水数据具有很强的互补性,本文利用GAM算法融合了两种降水信息,模型的形式为:
式中:x1、x2分别为站点经纬度;
目标函数由模型误差和模型复杂度两部分组成,
利用站点每月的降水数据和经纬度可以拟合得到一个GAM模型,将区域的经纬度和该月MSWEP数据输入到模型中,则可以得到区域在该月融合后的降水数据。从模型的结构中可以看出来,融合后的降水数据综合了局部样条平滑插值和MSWEP线性函数两部分信息,两者的权重由他们与站点实测降水的接近程度决定,这种融合策略比单纯基于地理位置的插值或是利用站点降水修订MSWEP的方法要更具有优势。
为了对GAM模型精度有客观的评价,本文采取了留一法(Leave One Out, LOO)计算误差。针对某年某月的降水数据,每次选择一个站点作为检验,用剩下的站点建立GAM模型,而后用该模型估算检验站点的降水数据,如此迭代,直到所有站点的月降水数据都曾被用作检验样本,具有GAM模型估算的降水数据,将此估算值和真实值对比,即可评价GAM算法的精度。
2.3.3 三峡库区的降水特征分析 基于GAM融合后的降水数据提取降水特征,为了突出水库蓄水的影响,将数据分为2个时期:1979-2002年和2003-2014年,对前期、后期降水的多年平均值、Mann-Kendall变化斜率等进行统计[22]。由于研究区域的降水主要集中在夏季,在不同季节降水的空间格局差异巨大,且估算误差也明显不同,因此,本文将一年分为2个时期,5-10月为汛期,1-4月以及11月、12月为干季,对汛期和干季的降水特征分别统计。
本研究时间跨度较大,在近36年的时间里,人类活动、地表覆盖/利用状况都发生很大变化,很有可能对降水的空间均匀性造成影响,对此,本文计算了降水空间均匀性的分布图,每个格点的空间均匀性定义为该格点年降水时间序列和周边8个相邻格点(3×3窗口内)平均年降水时间序列的相关系数的平方(R2),如果R2很大,说明该格点可以很好的解释周边降水的年际变化,对周边降水有较好代表性,即降水的空间均匀性较高;如果R2很小,则表明该格点的降水时间序列与周边差异较大,空间代表性较差,降水的空间均匀性偏低。该方法曾被用于计算站点观测对周围气象参数的解释方差,以评估站点的代表性[23-24]。
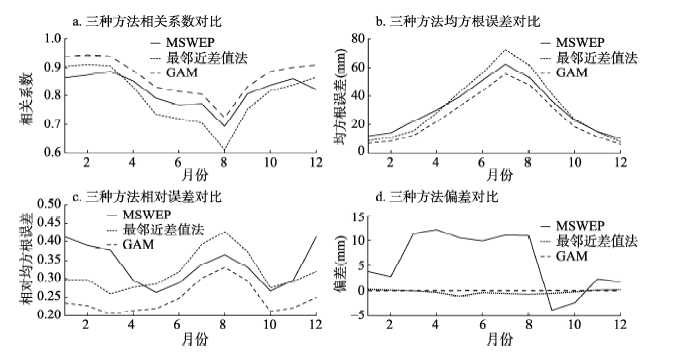
MSWEP和最近邻插值方法估算站点月降水量的精度如图3所示,为了体现精度的季节变化,本文统计了误差变量在1979-2014年期间的月均值,从图3a、3b中可以发现这两种方法都是在冬春季效果更好(r = 0.85~0.9,rmse=10~30 mm),在夏秋季效果更差(r = 0.7~0.8,rmse = 40~70 mm),但这两种方法的优势体现在不同季节,冬春季时插值方法优于MSWEP,而夏秋季时却是MSWEP优于插值方法,这和降水的季节分配、空间格局紧密相关。冬春季对流降水偏少,降水的空间均匀度较高,有助于提高插值算法的精度,而受地面上时有冰雪且小雨偏多的影响,遥感降水产品误差较大,从图3c中可看出,由于冬春季降水量少,MSWEP的相对rmse可达40%,明显高于插值算法(一般在30%以内),上述结果也表明在MSWEP数据的生成中,虽然冬季降水信息主要依赖于站点资料和再分析资料[4],但精度仍然不甚理想。夏秋季对流降水偏多,降水量大且空间异质性高,空间插值算法难以准确表达降水的空间格局,而遥感产品却可以通过对区域的全面观测获取更准确的降水信息。除季节影响外,MSWEP和地面站点观测的尺度不匹配也是造成误差的主要原因之一。
图3 MSWEP降水、最近邻插值和GAM估算精度的对比
Fig. 3 Accuracy comparison among MSWEP, Nearest Neighbour, and GAM estimation results
图3d显示了平均偏差的季节变化,可以看出,插值算法的平均偏差较小,并且几乎不随季节发生变化,相反,MSWEP具有明显的偏差,且这种偏差具有季节性,具体而言,3-8月,MSWEP比实测数据高出10~12 mm,在1-2月和11-12月,MSWEP比实测数据高出2~4 mm,而在9-10月,MSWEP比实测数据平均低2~4 mm。MSWEP或遥感降水相对于站点降水的高估现象,在其他类似研究中也有描述[14],但9-10月份出现低估,此前并没有相关研究发现,这值得进一步探讨,秋汛是三峡库区的主要气象灾害之一,MSWEP的低估可能与秋季降水类型、大气条件有关(秋季发生连阴雨、持续时间长,但雨强不大)。
图3中显示了利用GAM方法融合降水的误差,与MSWEP产品和最近邻插值相比,融合降水的rmse减少了17%~50%,r提高了10%~30%,尽管精度提高明显,精度的季节特征并没有发生变化,仍然是夏秋季降水的估算误差较大(rmse = 20~50 mm,r = 0.75~0.85,相对rmse = 25%~33%),而冬春季降水估算误差较小(rmse = 8~20 mm,r = 0.9~0.95,相对rmse = 20%~25%)。
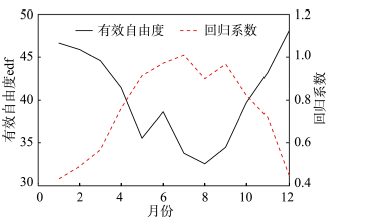
融合后降水精度的提高源于GAM算法充分地发挥了插值算法和MSWEP数据各自的优势,这一点可以从样条函数的有效自由度(edf)以及MSWEP的回归系数中可以看出(图4),在冬春季,样条函数的edf较高(超过45),而MSWEP系数偏小(明显小于1),表明样条函数拟合的数据分布格局有丰富的细节,MSWEP产品对融合降水的影响偏小;在夏秋季,样条函数的edf偏低(低于35),MSWEP偏大(更接近于1),表明样条函数拟合的格局非常概括化,降水估算信息更多来自于MSWEP产品。
图4 GAM模型中样条函数有效自由度(edf)和MSWEP的回归系数值的月均值
Fig. 4 Monthly mean values for edf and linear coefficients obtained in fitting GAM models
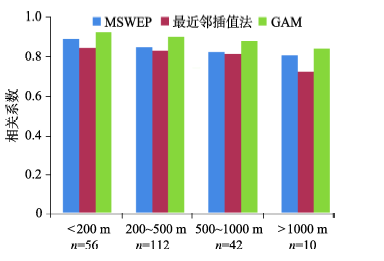
地形影响降水,降水估算精度可能和高程有关,为了体现两者的关系,本文计算了每个站点年降水观测值与估算值的相关系数,而后按照高程将站点分成4组(< 200 m,200~500 m,500~1000 m,> 1000 m),统计每组站点相关系数的平均值(图5)。随着高程的增加,估算精度也略有下降,这可能和山区降水的时空异质性更高有关。MSWEP的效果优于最邻近差值法,尤其在站点稀少的高海拔地区(> 1000 m),MSWEP的优势更加明显,这说明站点个数是限制最邻近差值法的重要影响因子。当利用GAM算法融合MSWEP和站点降水时,精度进一步提高,与MSWEP相比,GAM的r值提高了4%~7%,最明显的是在海拔居中的区域(200~1000 m),间接说明低海拔和高海拔处降水估算精度改进的余地较小。
图5 不同海拔区域三种方法估算精度的对比(n值为站点个数)
Fig. 5 Accuracy comparison among different elevation groups (n is the number of stations in each group)
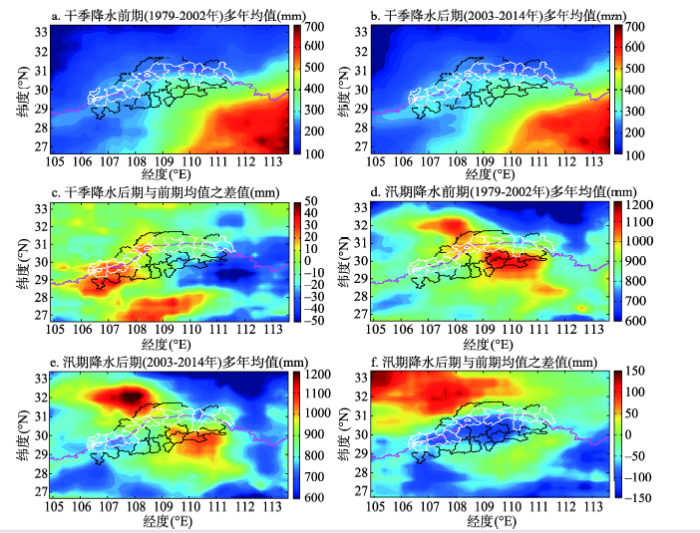
3.4.1 降水均值 降水均值空间格局具有如下特征:汛期和干季的降水格局明显不同(图6a、6d),干季降水更为均匀,从东南往西北方向逐渐降低,有明显的分带性特征;汛期降水格局更为复杂,有一条东南—西北方向的降雨带,雨带上的降水量明显高于两侧,而且雨带上有两个降雨高值中心,分布在长江两岸。由于汛期降水量大,年总降水量的格局基本由汛期降水格局决定。
图6 干季和汛期多年平均降水在水库蓄水前后的空间格局及其变化
Fig. 6 Mean precipitation in dry and wet season and the precipitation changes before and after dam water level rose to 135 m
汛期降水变化格局:汛期降水格局在蓄水前后发生了明显变化(图6d、6e、6f),位于长江南岸的降水高值区域空间范围明显缩小、强度减弱,而位于长江北岸的降水高值中心空间范围明显扩大、强度增强,这导致了原本比较连续的东南—西北方向的雨带在靠近长江地区出现了间断。从汛期的降水变化图上可以看出,西北区域(大巴山地区)降水增加,中部、南部区域降水减少。三峡库区内部汛期降水以下降为主,下降最明显的是库区内长江以南地区。汛期降水的减少可能是大量水域在夏季升温缓慢,导致上升对流减少、下沉的大气增多,更容易驱散水汽所造成 [9]。由于汛期降水量明显高于干季,所以汛期降水的变化格局也主导了全年降水的变化格局,受篇幅限制,此处没有显示年降水变化图。
干季降水变化格局:干季降水在蓄水前后也发生了较大变化(图6a、6b、6c),从前后降水差异图上可以看出,蓄水后干季降水在东部地区下降,在南部及西南部地区上升,从变化数值上看,南部的变化幅度高于北部地区(这与南部的干季降水量较大有关)。对于三峡库区内部,除东部小部分地区干季降水略有下降外,大部分区域都表现为上升,尤其是在库区西部,干季降水量明显增多。库区西部为重庆地区,城市快速扩张,干季热岛效应更为明显,可能是导致降水增加的一个原因。
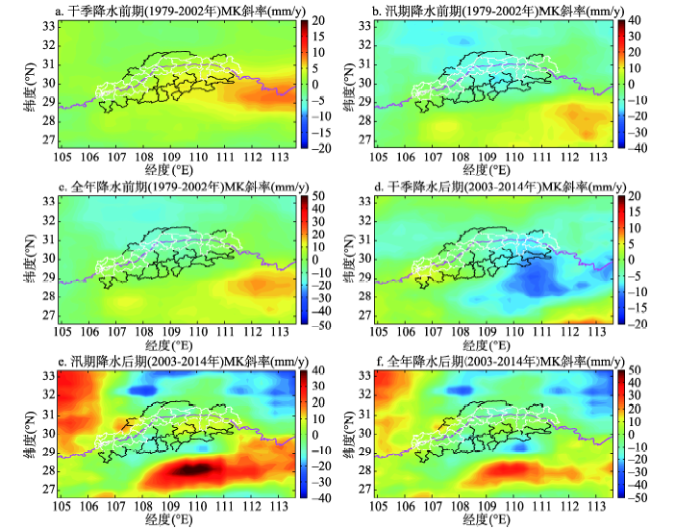
3.4.2 降水变化趋势 图7显示了干季、汛期、全年降水量在水库蓄水前后的MK斜率的分布格局,从中可以看出以下特征。
图7 干季、汛期、全年降水变化MK斜率在蓄水前后的分布格局
Fig. 7 MK trends of precipitation in dry season, wet season, and the whole year before and after dam water level rose to 135 m
在蓄水前,干季、汛期、全年降水的变化斜率具有较为均匀的空间分布格局(图7a、7b、7c),而在蓄水后,汛期和全年降水变化斜率的空间分布有明显的异质性,正负斜率在空间分布上有相互交错(图7d、7e、7f)。从斜率数值变化上看,干季降水由前期的正斜率为主变为后期的负斜率为主(图7a、7d),说明前期的湿润化趋势转化为后期的干燥化趋势;对库区内部而言,西部干季降水在后期增加明显,东部干季降水由前期的增加转为后期的下降。
汛期降水前期斜率值明显低于后期(图7b、7e),说明后期变化更为剧烈(这与后期数据序列较短也有关);从格局上看,前期汛期降水为北降南升的格局,后期则更为复杂,西北、东南以上升为主,东北以下降为主;对于三峡库区而言,除西南部汛期降水斜率变化较小外,其他地区的斜率都出现了增加,意味着后期与前期相比,湿润化的趋势更为显著。
全年降水变化斜率格局与汛期降水类似。库区内部的斜率变化整体以平缓上升为主,说明后期与前期相比,全年降水朝着更加湿润的趋势发展。
3.4.3 降水季节分配 由于干季和汛期降水的变化趋势不同,造成了降水的季节分配也出现很大变化,对此计算了干季降水占全年降水的比例,从图8中可以看出,蓄水前,干季降水比例从东南向西北呈递减趋势,数值从0.5下降至0.15左右,库区内干季降水比约为0.25~0.30。在水库蓄水后,整个库区内部的干季降水比例都有所增加,且库区西南部的增加幅度最大。从降水均值变化中可以看出(图6),库区西南部干季降水增加、库区其他地区汛期降水减少,是造成整个库区干季降水占全年降水比例提高的主要原因。
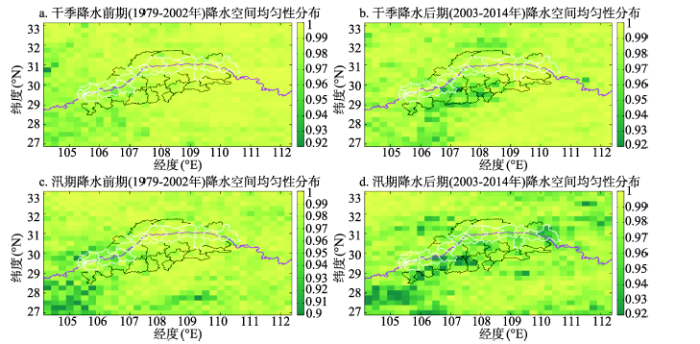
3.4.4 降水空间均匀性变化 降水的空间格局与降水类型有关,也会受到地表覆盖、景观格局、地形等因素的影响,图9显示了水库蓄水前后降水空间均匀性的分布,对比分析可以看出如下特征。
图8 干季降水比例及其蓄水前后变化
Fig. 8 Proportion of precipitation in dry season before and after dam water level rose to 135 m
图9 干季、汛期降水空间代表性在蓄水前后的分布
Fig. 9 Spatial homogeneity of precipitation in dry season and wet seasons before and after 2003
干季降水相比于汛期降水有更强的空间均匀性,这很好的解释了为何空间插值算法在干季的降水估算精度更高。干季绝大部分地区的降水均匀性都非常高,只有西南地区偏低,这与该地区地表覆盖多样、景观上森林和农田交错分布有关。汛期降水的空间均匀性明显偏低,而且格局也更为复杂,和干季一样,西南地区相对其他地区而言,降水异质性更高。
在蓄水以后,干季和汛期的空间均匀性都明显降低,格局也更加复杂化,干季降水空间均匀性下降的区域主要位于中部偏西南,汛期降水均匀性下降明显的区域为西南东北方向穿过库区的带状区域,尤其是在长江以南。与库区外围相比,库区内部的均匀性下降的幅度更大。
本文分析的数据是利用GAM算法融合了站点观测和MSWEP降水产品的结果,虽然比直接使用MSWEP或空间插值数据的精度要高,但误差仍是难以避免的,误差基本特征是汛期高于干季、山区高于平原。融合降水数据在汛期主要依赖MSWEP的信息,在干季主要依赖站点降水的观测,这种灵活性是融合降水精度更高的主要原因,同时也体现了MSWEP和站点降水是彼此无法替代的,虽然MSWEP融合了站点、遥感、再分析资料,但当局部地区有比较密集的站点时,充分利用站点观测信息是非常有必要的,而且利用的方式不能仅仅局限于用站点观测去标定MSWEP数据,本文在开始也尝试了这样的标定方法,发现其精度明显低于GAM融合算法。
大坝蓄水后,汛期的降水空间格局发生显著变化,原本较为连续的东南-西北方向的雨带在三峡库区出现了中断,库区长江以南地区降水明显下降,库区外西北部降水明显增加。对于干季而言,降水空间格局变化不大,仍然保持东南向西北逐渐递减的趋势,但库区内部西南地区干季降水增加明显。受汛期降水减少或干季降水增加的影响,库区干季降水占全年降水的比例增加,即降水的季节分配更为均衡。然而大坝蓄水后,库区内部降水的空间异质性明显增加,这可能与地表破碎度增加有关,也可能与不同地表覆盖对气候变化的响应特征不一致有关,空间异质性高表明降水的年际变化特征更具局地性,单个格点对周围降水的代表性下降,不同区域的降水会朝着更加不同的方向变化,进一步造成深远的影响。
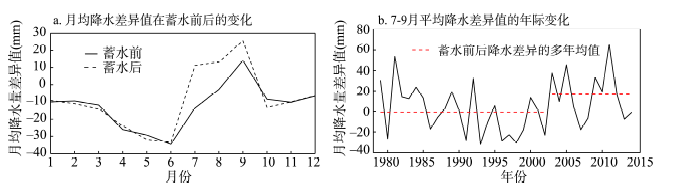
三峡水库的气候效应一直受到科学界和公众的持续关注,最初多数研究都认为三峡水库的气候影响只局限在江面附近,2006年Wu等[8]首先提出三峡水库的气候影响可以发生在百公里尺度上:三峡西北部地区(秦岭大巴山地区)的降水在2003年以后明显增加,而Xiao等[12]则认为这种增加不超过自然变化范畴,在水库修建以前,也发生过这种类似现象。按照Wu等[8]和Xiao等[12]研究中的对比方法,本文计算了三峡北部大巴山地区(中心经纬度范围107.125°E~110.875°E,33.375°N~30.875°N)区域月平均降水和背景区域(107.125°E~110.875°E,33.375°N~27.875°N)月平均降水之间差值在蓄水前后的变化,从图10a中可以看出,蓄水后,三峡北部7-9月平均降水与背景值的差异明显增加,而其他月份平均降水的差异在蓄水前后则无明显变化;图10b中显示了三峡北部和背景区域7-9月平均降水差异值的年际变化,可以看出,Wu等研究中对比的两个时段:1998-2002年和2004-2006年,其降水差异分别位于历史低位和历史高位,前后形成强烈反差(降水差异由-11 mm变为24 mm);Xiao研究中对比的两个时段:1979-1980年和1981-1984年也具有较大反差(由于本文的序列只有1979-2014年,Xiao等研究中提到的1978-1980年只好缩短为1979-1980年),尤其是1981-1984年,北部区域比背景区域7-9月平均降水高出的幅度为26 mm。然而这两个研究所用的数据时段都比较短,虽然差异变化大,但无法通过显著性检验。
图10 北部区域和背景区域降水比较
Fig. 10 Precipitation contrast of northern region compared against background
本文以2003年为界,得出降水差异在蓄水前24年的平均值为-1 mm,蓄水后12年的平均值为16 mm,说明蓄水前北部大巴山地区7-9月平均降水非常接近背景值,蓄水后则是比背景值高出16 mm,且这一变化通过了显著性检验(P < 5%)。如果统计降水差异值最大的5个年份,发现除1981年以外,其他年份(2011年,2005年,2003年,2009年)都是在蓄水以后,说明北部降水高于背景值的情况在近几年发生的比例更高,笔者认为若要解释其变化原因,还需要有更多深入研究,不能简单归结为三峡工程。受数据序列长度限制,当前蓄水后降水数据只有12年,随着数据积累时间更长,可以再检验这种变化是否显著。
本文通过融合最新的全球降水产品(MSWEP)和站点降水观测数据,获取了三峡库区及附近地区降水时空数据集,主要研究结论如下:
虽然MSWEP数据在生产过程中综合了3方面的降水信息(站点观测、遥感产品、数值预报),但其质量仍存在缺陷,站点插值方法与MSWEP产品具有互补性。通过GAM模型融合站点降水和MSWEP数据,可以充分发挥两种数据的优势,提高降水估算精度,具体而言,夏秋季降水量大、空间格局复杂,GAM模型主要依赖于MSWEP数据中丰富的空间细节,冬春季降水量少,空间均匀性高,GAM主要依赖于站点空间插值方法的低偏差的估计结果,GAM融合降水精度明显高于融合前,但仍然存在明显的季节变化:冬春季均方根误差rmse = 8~20 mm/月,夏秋季均方根误差rmse = 20~50 mm/月。
与其他关于三峡区域降水变化的研究相比,本文在保持高空间分辨率的同时,大大延长了时间序列,使得降水气候平均值的计算更加准确,有助于提高变化检测的可靠性。研究结果表明,2003年水库蓄水后,库区内部长江以南地区汛期降水下降,库区外西北部地区汛期降水上升,库区内西部地区干季降水上升,降水空间格局更加复杂化(空间均匀度下降),季节分配更具均衡化(干季降水占全年降水比例上升)。未来如何应对这些变化应值得深入研究。
本文没有涉及到机理的讨论,在2003年前后,除了水域面积的扩大,还有其他因素也发生变化,如各种气候因子、森林覆盖率、植被生物量、景观格局、土地覆被/利用、地表粗糙度等,如果想把水库的影响分离出来,还需要整合多方面信息、利用气候模式模拟,开展深入研究。
The authors have declared that no competing interests exist.
| [1] |
A statistical-topographic model for mapping climatological precipitation over mountainous terrain. |
| [2] |
How much does it rain over land? https://doi.org/10.1002/2015GL066615 URL 摘要
Despite the availability of several observationally constrained data sets of daily precipitation based on rain gauge measurements, remote sensing, and/or reanalyses, we demonstrate a large disparity in the quasi-global land mean of daily precipitation intensity. Surprisingly, the magnitude of this spread is similar to that found in the Coupled Model Intercomparison Project Phase 5 (CMIP5). A weakness of reanalyses and CMIP5 models is their tendency to over simulate wet days, consistent with previous studies. However, there is no clear agreement within and between rain gauge and remotely sensed data sets either. This large discrepancy highlights a shortcoming in our ability to characterize not only modeled daily precipitation intensities but even observed precipitation intensities. This shortcoming is partially reconciled by an appreciation of the different spatial scales represented in gridded data sets of in situ precipitation intensities and intensities calculated from gridded precipitation. Unfortunately, the spread in intensities remains large enough to prevent us from satisfactorily determining how much it rains over land.
|
| [3] |
Impacts of uncertainties in European gridded precipitation observations on regional climate analysis. https://doi.org/10.1002/joc.4706 URL PMID: 5214405 [本文引用: 1] 摘要
Gridded precipitation data sets are frequently used to evaluate climate models or to remove model output biases. Although precipitation data are error prone due to the high spatio‐temporal variability of precipitation and due to considerable measurement errors, relatively few attempts have been made to account for observational uncertainty in model evaluation or in bias correction studies. In this study, we compare three types of European daily data sets featuring two Pan‐European data sets and a set that combines eight very high‐resolution station‐based regional data sets. Furthermore, we investigate seven widely used, larger scale global data sets. Our results demonstrate that the differences between these data sets have the same magnitude as precipitation errors found in regional climate models. Therefore, including observational uncertainties is essential for climate studies, climate model evaluation, and statistical post‐processing. Following our results, we suggest the following guidelines for regional precipitation assessments. (1) Include multiple observational data sets from different sources (e.g. station, satellite, reanalysis based) to estimate observational uncertainties. (2) Use data sets with high station densities to minimize the effect of precipitation undersampling (may induce about 60% error in data sparse regions). The information content of a gridded data set is mainly related to its underlying station density and not to its grid spacing. (3) Consider undercatch errors of up to 80% in high latitudes and mountainous regions. (4) Analyses of small‐scale features and extremes are especially uncertain in gridded data sets. For higher confidence, use climate‐mean and larger scale statistics. In conclusion, neglecting observational uncertainties potentially misguides climate model development and can severely affect the results of climate change impact assessments.
|
| [4] |
|
| [5] |
The TRMM Multisatellite Precipitation Analysis (TMPA): Quasi-global, multiyear, combined-sensor precipitation estimates at fine scales, |
| [6] |
A global satellite-assisted precipitation climatology. https://doi.org/10.5194/essdd-8-401-2015 URL 摘要
Accurate representations of mean climate conditions, especially in areas of complex terrain, are an important part of environmental monitoring systems. As high-resolution satellite monitoring information accumulates with the passage of time, it can be increasingly useful in efforts to better characterize the earth's mean climatology. Current state-of-the-science products rely on complex and sometimes unreliable relationships between elevation and station-based precipitation records, which can result in poor performance in food and water insecure regions with sparse observation networks. These vulnerable areas (like Ethiopia, Afghanistan, or Haiti) are often the critical regions for humanitarian drought monitoring. Here, we show that long period of record geo-synchronous and polar-orbiting satellite observations provide a unique new resource for producing high-resolution (0.05掳) global precipitation climatologies that perform reasonably well in data-sparse regions. Traditionally, global climatologies have been produced by combining station observations and physiographic predictors like latitude, longitude, elevation, and slope. While such approaches can work well, especially in areas with reasonably dense observation networks, the fundamental relationship between physiographic variables and the target climate variables can often be indirect and spatially complex. Infrared and microwave satellite observations, on the other hand, directly monitor the earth's energy emissions. These emissions often correspond physically with the location and intensity of precipitation. We show that these relationships provide a good basis for building global climatologies. We also introduce a new geospatial modeling approach based on moving window regressions and inverse distance weighting interpolation. This approach combines satellite fields, gridded physiographic indicators, and in situ climate normals. The resulting global 0.05掳 monthly precipitation climatology, the Climate Hazards Group's Precipitation Climatology version 1 (CHPclim v.1.0, <a href="http://dx.doi.org/10.15780/G2159X">doi:10.15780/G2159X), is shown to compare favorably with similar global climatology products, especially in areas with complex terrain and low station densities.
|
| [7] |
Inter comparison of high-resolution precipitation products over Northwest Europe. https://doi.org/10.1175/JHM-D-11-042.1 URL Magsci [本文引用: 1] 摘要
Satellite-derived high-resolution precipitation products (HRPP) have been developed to address the needs of the user community and are now available with 0.25 degrees X 0.25 degrees (or less) subdaily resolutions. This paper evaluates a number of commonly available satellite-derived HRPPs covering northwest Europe over a 6-yr period. Precipitation products include the Tropical Rainfall Measuring Mission (TRMM) Multisatellite Precipitation Analysis (TMPA), the Climate Prediction Center (CPC) morphing (CMORPH) technique, the CPC merged microwave technique, the Naval Research Laboratory (NRL) blended technique, and the Precipitation Estimation from Remotely Sensed Information using Artificial Neural Networks (PERSIANN) technique. In addition, the Geosynchronous Operational Environmental Satellite (GOES) precipitation index (GPI) and the European Centre for Medium-Range Weather Forecasting (ECMWF) operational forecast model products are included for comparison. Surface reference data from the European radar network is used as ground truth, supported by the Global Precipitation Climatology Centre (GPCC) precipitation gauge analysis and gauge data over the United Kingdom. Measures of correlation, bias ratio, probability of detection, and false alarm ratio are used to evaluate the products. Results show that satellite products generally exhibit a seasonal cycle in correlation, bias ratio, probability of detection, and false alarm ratio, with poorer statistics during the winter. The ECMWF model also shows a seasonal cycle in the correlation, although the results are poorer during the summer, while the bias ratio, probability of detection, and false alarm ratio are consistent through all seasons. Importantly, all the satellite HRPPs underestimate precipitation over northwest Europe in all seasons.
|
| [8] |
Climate effects of the Three Gorges Reservoir as simulated by a high resolution double nested regional climate model. https://doi.org/10.1016/j.quaint.2012.04.028 URL Magsci [本文引用: 4] 摘要
High resolution multi-annual regional climate model (RegCM3) experiments were performed to simulate the effects of the Three Gorges Reservoir (TGR) on the climate of the surrounding areas. The model was run in double nested mode. Firstly a 50 km resolution simulation was conducted over the China domain driven by the coarse resolution NCEP/NCAR re-analysis. Then the output of the simulation was used to drive the model over the Three Gorges Area (TGA) at a resolution of 10 km. SUB-BATS scheme was employed in the 10 km simulation to represent the land surface at 2 km. Two 10 km simulation, one with and the other without the inland water in TGR were conducted. Comparison of the simulations against observation were firstly carried out to validation the model performances over TGA. The 10 km sensitivity experiments with and without the TGR showed that little or negligible effects can be found except directly over the TGR. Most of the simulated effects are noisy and not statistically significant, except for cooling over the TGR water body in both June July August JJA) and December January February (DJF). The cooling leads to an/a insignificant decrease/slight decrease of precipitation over the TGR and nearby grid points, respectively. The cooling is larger in JJA compared to DJF. As a typical river-like reservoir, the width and coverage of the TGR does not have significant influence on the local climate over the area. (C) 2012 Elsevier Ltd and INQUA. All rights reserved.
|
| [9] |
Local climate sensitivity of the Three Gorges Dam. https://doi.org/10.1029/2005GL022821 URL [本文引用: 2] 摘要
Two simulations, control and land use change, were performed for an eight week period (2 April-16 May 1990) to determine the net sensitivity of the local climate around the Three Gorges Dam. The analysis indicates that the large reservoir acts as a potential evaporating surface that decreases the surface temperature, cools the lower atmosphere, decreasing upward motion, and increasing sinking air mass. Such sinking results in low level moisture divergence, decreasing cloudiness, and increasing net downward radiation, which increases the surface temperature. However, results indicate that evaporative cooling dominates radiative warming in this initial study. The strong evaporation also supplies moisture to the atmosphere, suggesting an increase in precipitation, but the sinking moist air diverges away from the TGD region with no net change in precipitation. This numerical study represents an initial methodology for quantification of the impact of the Three Gorges Dam on the local climate and a more comprehensive, fine-scale set of multi-season simulations with additional observational data is needed for a more complete analysis.
|
| [10] |
The Three Gorges Dam affects regional precipitation. https://doi.org/10.1029/2006GL026780 URL [本文引用: 2] 摘要
The impact of the Three Gorges Dam (TGD) on regional precipitation is examined through analysis of the National Aeronautics and Space Administration (NASA) Tropical Rainfall Measuring Mission (TRMM) rainfall rate and Moderate Resolution Imaging Spectroradiometer (MODIS) land surface temperature and high-resolution simulation using the Pennsylvania State University-National Center for Atmospheric Research (PSU-NCAR) fifth-generation Mesoscale Model (MM5). The independent satellite data sets and numerical simulation clearly indicate that the land use change associated with the TGD construction has increased the precipitation in the region between Daba and Qinling mountains and reduced the precipitation in the vicinity of the TGD after the TGD water level abruptly rose from 66 to 135 m in June 2003. This study suggests that the climatic effect of the TGD is on the regional scale (~100 km) rather than on the local scale (~10 km) as projected in previous studies.
|
| [11] |
Local Precipitation changes induced by the Three Gorges Reservoir based on TRMM observations. https://doi.org/10.11870/cjlyzyyhj201405004 Magsci [本文引用: 1] 摘要
<p>为揭示三峡蓄水对局地气候的影响,利用TRMM 3B42卫星降水产品分析了三峡蓄水前后(以2003年为分界)库区的局地降水变化。分析表明,蓄水以后,库区西北部年累积降水量增加,东南部年累积降水量减少,这种降水变化是大尺度上降水变化的区域体现。蓄水对干流附近降水产生了一定影响,干流站点间降水量差别增大,但整个大库区平均的年累积降水量无明显变化。蓄水之后的降水变化具有季节差异。冬季几乎整个库区的降水量都有所增加;春季降水量在干流的上游个别地区和下游减少,中游增加;夏季除库区下游部分地区外,大部分库区降水量有所减少;秋季,库区的上游和中游降水增加,下游降水减少。区域平均的季节降水量无明显年际趋势。结果表明,三峡蓄水带来的降水变化空间尺度只局限在近库区,对整个大库区降水变化的影响可忽略不计</p>
基于TRMM卫星资料分析三峡蓄水前后的局地降水变化 .https://doi.org/10.11870/cjlyzyyhj201405004 Magsci [本文引用: 1] 摘要
<p>为揭示三峡蓄水对局地气候的影响,利用TRMM 3B42卫星降水产品分析了三峡蓄水前后(以2003年为分界)库区的局地降水变化。分析表明,蓄水以后,库区西北部年累积降水量增加,东南部年累积降水量减少,这种降水变化是大尺度上降水变化的区域体现。蓄水对干流附近降水产生了一定影响,干流站点间降水量差别增大,但整个大库区平均的年累积降水量无明显变化。蓄水之后的降水变化具有季节差异。冬季几乎整个库区的降水量都有所增加;春季降水量在干流的上游个别地区和下游减少,中游增加;夏季除库区下游部分地区外,大部分库区降水量有所减少;秋季,库区的上游和中游降水增加,下游降水减少。区域平均的季节降水量无明显年际趋势。结果表明,三峡蓄水带来的降水变化空间尺度只局限在近库区,对整个大库区降水变化的影响可忽略不计</p>
|
| [12] |
Precipitation characteristics in the Three Gorges Dam vicinity. https://doi.org/10.1002/joc.1963 URL [本文引用: 3] 摘要
After the building of the Three Gorges Dam (TGD), the water level abruptly rose from 66 to 135 m in June 2003, and the land use characteristics changed significantly throughout the TGD region. More and more people are concerned with the effect of the TGD reservoir on climate. In this paper, the decadal variation of precipitation in the vicinity of the TGD was analysed using daily data from 27 rain gauges from 1960 to 2005. The empirical orthogonal function (EOF) analysis of annual precipitation anomalies indicates a clear difference in spatial distribution, with an opposite signal for the change in precipitation in the northern and southern areas of the Yangtze River, i.e. precipitation increases in the northern area are accompanied with decreases in the southern area and vice versa. The similar dipole pattern of precipitation variation around the TGD also occurred before the TGD, for example, in the period from 1977 to 1984. Therefore, it has not been shown with reasonable significance that the similar dipole pattern of precipitation variation around the TGD has been affected by the TGD. Copyright 漏 2009 Royal Meteorological Society
|
| [13] |
Numerical simulation and analysis of the effect of Three Gorges Reservoir Project on the regional climate change.
The effect on the regional climate caused by changes of underlying surface after the foundation of Three Gorges Reservoir was simulated by 〖JP2〗MM5V3,a mesoscale numerical model.Whether the foundation〖JP〗 of Three Gorges Reservoir will be a main factor of severe drought and heat wave,as well as low temperature,consecutive cryogenic freezing rain and snow disasters,which are issues concerned intensively by society,was discussed.The results show that the foundation of Three Gorges Reservoir will have a sealike effect to the local temperature.The temperature decreases in spring around the reservoir areas.And in summer,the temperature increases in downstream of reservoir while decreases in the upper stream of reservoir.In winter the temperature increases on the whole.Change of precipitation in spring mainly locates in south mountain area along the reservoir,and the increasing rainbands alternate with the decreasing rainbands.In summer,precipitation increases along the middle and upper reaches of Three Gorges Reservoir and the nearby mountain areas,but precipitation decreases in areas around downstream reservoir.And in winter,precipitation decreases mainly from dam areas to Wushan in Three Gorges.It is also found that the relative humidity of reservoir areas increases in spring, with a range of about 05~10%.In summer,〖JP2〗relative humidity increases〖JP〗 in areas around upper stream of the reservoir,but decrease in areas around downstream reservoir.Relative humidity changes little in winter.In conclusion, Three Gorges Reservoir water conservancy project is not the main inducement of extreme weather disasters such as drought, low temperature and consecutive cryogenic freezing rain.〖
三峡水库对区域气候影响的数值模拟分析 .
The effect on the regional climate caused by changes of underlying surface after the foundation of Three Gorges Reservoir was simulated by 〖JP2〗MM5V3,a mesoscale numerical model.Whether the foundation〖JP〗 of Three Gorges Reservoir will be a main factor of severe drought and heat wave,as well as low temperature,consecutive cryogenic freezing rain and snow disasters,which are issues concerned intensively by society,was discussed.The results show that the foundation of Three Gorges Reservoir will have a sealike effect to the local temperature.The temperature decreases in spring around the reservoir areas.And in summer,the temperature increases in downstream of reservoir while decreases in the upper stream of reservoir.In winter the temperature increases on the whole.Change of precipitation in spring mainly locates in south mountain area along the reservoir,and the increasing rainbands alternate with the decreasing rainbands.In summer,precipitation increases along the middle and upper reaches of Three Gorges Reservoir and the nearby mountain areas,but precipitation decreases in areas around downstream reservoir.And in winter,precipitation decreases mainly from dam areas to Wushan in Three Gorges.It is also found that the relative humidity of reservoir areas increases in spring, with a range of about 05~10%.In summer,〖JP2〗relative humidity increases〖JP〗 in areas around upper stream of the reservoir,but decrease in areas around downstream reservoir.Relative humidity changes little in winter.In conclusion, Three Gorges Reservoir water conservancy project is not the main inducement of extreme weather disasters such as drought, low temperature and consecutive cryogenic freezing rain.〖
|
| [14] |
Precipitation changes near Three Gorges Dam, China (Part I): A spatiotemporal validation analysis. https://doi.org/10.1175/JHM-D-11-061.1 URL Magsci [本文引用: 2] 摘要
In October 2010, the water level upstream of the Three Gorges Dam (TGD) reached the designated 175-m level. The associated inundation and land use-land cover changes have important implications for water resource management, agriculture, ecosystems, and the hydroclimate. Ultimately, it is important to quantify whether the dam-related changes have altered precipitation patterns. Since rain gauges are limited in the region, satellite-based methods are viable. This study is the first to validate NASA Tropical Rainfall Measuring Mission (TRMM) Multisatellite Precipitation Analysis (TMPA) data from 1998 to 2009 using 34 national meteorological rain gauges in the Three Gorges region. Areal average satellite estimates are first verified with areal average rain gauge data both annually and seasonally. Then based on empirical orthogonal functions, the study area is divided into two subregions, and similar validation procedures are performed for both subregions. TMPA data are found to have high correlations with rain gauge data for the whole study area, and correlations for the subregions are only slightly lower. The seasonal analysis yields the lowest correlations for winter. Compared with the gauge data, rainfall is slightly overestimated by about 3 mm month(-1). At daily scale, satellite data show good agreement with gauge data for all rain intensity categories except light rain (<1 mm day(-1)). Spatially, the point-source gauge data are gridded using Thiessen polygons for comparison with satellite data, and the results suggest the satellite-based product may overestimate rainfall in mountainous areas near the reservoir, especially in spring and summer. Overall, the validation results yield strong statistical support for applying satellite rainfall data for hydroclimate studies in this region.
|
| [15] |
Peters-Lidard C D. A global map of uncertainties in satellite-based precipitation measurements. https://doi.org/10.1029/2010GL046008 URL [本文引用: 1] 摘要
ABSTRACT A global map of measurement uncertainties in satellite-based precipitation estimates has been produced by computing the variance from an ensemble of six different TRMM-era data sets at daily, 0.25° resolution. This analysis yields a lower-bound estimate of the uncertainties, and a consistent global view of the error characteristics and their regional and seasonal variations, and reveals many undocumented error features over areas with no validation data available. The uncertainties are relatively small (40–60%) over the oceans, especially in the tropics, and over southern South America. There are large uncertainties (100–140%) over high latitudes (poleward of 40° latitude), especially during the cold season. High relative uncertainties are also evident through the seasons over complex terrain areas, including the Tibetan Plateau, the Rockies and the Andes. Coastlines and water bodies also indicate high measurement uncertainty. The estimated global uncertainties also exhibit systematic seasonal, regional as well as rain-rate dependencies, with lowest uncertainties over tropical oceanic regions with strong, convective precipitation, and highest ones over wintery, complex land surfaces with light precipitation.
|
| [16] |
Thin plate regression splines. |
| [17] |
McGill B, Wilson A M, et al. An assessment of methods and remote-sensing derived covariates for regional predictions of 1 km daily maximum air temperature. https://doi.org/10.3390/rs6098639 URL [本文引用: 1] 摘要
The monitoring and prediction of biodiversity and environmental changes is constrained by the availability of accurate and spatially contiguous climatic variables at fine temporal and spatial grains. In this study, we evaluate best practices for generating gridded, one-kilometer resolution, daily maximum air temperature surfaces in a regional context, the state of Oregon, USA. Covariates used in the interpolation include remote sensing derived elevation, aspect, canopy height, percent forest cover and MODIS Land Surface Temperature (LST). Because of missing values, we aggregated daily LST values as long term (2000–2010) monthly climatologies to leverage its spatial detail in the interpolation. We predicted temperature with three methods—Universal Kriging, Geographically Weighted Regression (GWR) and Generalized Additive Models (GAM)—and assessed predictions using meteorological stations over 365 days in 2010. We find that GAM is least sensitive to overtraining (overfitting) and results in lowest errors in term of distance to closest training stations. Mean elevation, LST, and distance to ocean are flagged most frequently as significant covariates among all daily predictions. Results indicate that GAM with latitude, longitude and elevation is the top model but that LST has potential in providing additional fine-grained spatial structure related to land cover effects. The study also highlights the need for more rigorous methods and data to evaluate the spatial structure and fine grained accuracy of predicted surfaces.
|
| [18] |
The generalized additive model for the assessment of the direct, diffuse, and global solar irradiances using SEVIRI images, with application to the UAE. https://doi.org/10.1109/JSTARS.2016.2522764 URL [本文引用: 1] 摘要
Generalized additive models (GAMs) can model the nonlinear relationship between a response variable and a set of explanatory variables through smooth functions. GAM is used to assess the direct, diffuse, and global solar components in the United Arab Emirates (UAE), a country which has a large potential for solar energy production. Six thermal channels of the spinning enhanced visible and infrared imager (SEVIRI) instrument onboard Meteosat second generation (MSG) are used as explanatory variables along with the solar zenith angle, solar time, day number, and eccentricity correction. The proposed model is fitted using reference data from three ground measurement stations for the full year of 2010 and tested on two other stations for the full year of 2009. The performance of the GAM model is compared to the performance of the ensemble of artificial neural networks (ANNs) approach. Results indicate that GAM leads to improved estimates for the testing sample when compared to the bagging ensemble. GAM has the advantage over ANN-based models that we can explicitly define the relationships between the response variable and each explanatory variable through smooth functions. Attempts are made to provide physical explanations of the relations between irradiance variables and explanatory variables. Models in which the observations are separated as cloud-free and cloudy and treated separately are evaluated along with the combined dataset. Results indicate that no improvement is obtained compared to a single model fitted with all observations. The performance of the GAM is also compared to the McClear model, a physical-based model providing estimates of irradiance in clear sky conditions.
|
| [19] |
Local adaptive calibration of the satellite derived surface incident shortwave radiation product using smoothing spline. https://doi.org/10.1109/TGRS.2015.2475615 URL [本文引用: 1] 摘要
Incident solar radiation over the Earth's surface plays an important role in determining the Earth's climate and environment. Generally, ...
|
| [20] |
Quantitative assessment of landslide susceptibility using high resolution remote sensing data and a generalized additive model. https://doi.org/10.1080/01431160701227661 URL [本文引用: 1] 摘要
As a geological hazard, landslides cause extensive property damage and sometimes result in loss of life. Thus, it is necessary to assess areas that are vulnerable to future landslide events to mitigate potential damage. For this purpose, change detection analysis and a generalized additive model were applied to investigate potential landslide occurrences within the Sacheoncheon area, Korea. An unsupervised change detection analysis based on multi‐temporal object‐based segmentation of high‐resolution remote sensing data and thresholding wad adopted to detect landslide‐prone areas. Landslide susceptibility was predicted on the basis of detected landslide areas and GIS‐based spatial databases. The generalized additive model, which can deal with categorical and continuous data as well as model the continuous data as a nonlinear smoothing function, was used for landslide susceptibility analysis. As a result, the unsupervised change detection scheme was able to detect 83% of actual landslide areas. The generalized additive model provided a superior predictive capability compared with the traditional generalized linear model.
|
| [21] |
|
| [22] |
Trend detection in hydrologic data: The Mann-Kendall trend test under the scaling hypothesis. https://doi.org/10.1016/j.jhydrol.2007.11.009 URL [本文引用: 1] 摘要
The subject of trend detection in hydrologic data has received a great deal of attention lately, especially in connection with the anticipated changes in global climate. However, climatic variability, which is reflected in hydrologic data, can adversely affect trend test results. The scaling hypothesis has been recently proposed for modeling such variability in hydrologic data. In this paper, the Mann鈥揔endall test, which is widely used to detect trends in hydrologic data, is modified to account for the effect of scaling. Exact expressions for the mean and variance of the test statistic are derived under the scaling hypothesis, and the Normal distribution is shown to remain a reasonable approximation. A procedure for estimating the modified variance from observed data is also outlined. The modified test is applied to a group of 57 worldwide total annual river flow time series from the database of the Global Runoff Data Centre in Koblenz, Germany, that were shown in an earlier study to exhibit significant trends in annual maximum flow. The results show a considerable reduction in the number of stations with significant trends when the effect of scaling is taken into account. These results indicate that the evidence of real trends in hydrologic data is even weaker than suggested by earlier studies, although highly significant increasing trends seem to be more common than negative ones. It is also shown that admitting scaling in the modified test helps to avoid discrepancies found in some previous studies, such as the existence of significant opposite trends in neighboring stations, or in different segments of the same time series.
|
| [23] |
Regional representativeness analysis of national reference climatological stations based on MODIS/LST product. https://doi.org/10.3969/j.issn.1001-7313.2011.02.010 URL [本文引用: 1] 摘要
该文基于2001-2007年地表温度遥感反演产品(MODllA2),以基准气候站对其周 围不同大小窗口内地表温度距平序列的解释方差作为度量,评估了我斟142个基准气候站的环境代表件,并将代表性与土地覆盖和高程状况进行相关研究。结果显 示:以解释方差大于o.75作为区分是否具有代表性的闽值,约41%的站点代表性较好,代表区域范围可超过51×51km。,多分布于北方地区;约21% 的站点代表性较差,代表区域范围不足7×7km。,多分布于南方地区;其他代表区域范围居中的站点在南、北方均有分布;站点周同的土地覆盖多样性和地形起 伏度与站点代表性存在负相关,且相关性随窗口的增大而加强。文中还评估了基准气候站对所属气候区的代表性,发现任气候特征复杂的西南地区和新疆部分地区, 站点对气候区的代表性较差。
利用MODIS/LST产品分析基准气候站环境代表性 .https://doi.org/10.3969/j.issn.1001-7313.2011.02.010 URL [本文引用: 1] 摘要
该文基于2001-2007年地表温度遥感反演产品(MODllA2),以基准气候站对其周 围不同大小窗口内地表温度距平序列的解释方差作为度量,评估了我斟142个基准气候站的环境代表件,并将代表性与土地覆盖和高程状况进行相关研究。结果显 示:以解释方差大于o.75作为区分是否具有代表性的闽值,约41%的站点代表性较好,代表区域范围可超过51×51km。,多分布于北方地区;约21% 的站点代表性较差,代表区域范围不足7×7km。,多分布于南方地区;其他代表区域范围居中的站点在南、北方均有分布;站点周同的土地覆盖多样性和地形起 伏度与站点代表性存在负相关,且相关性随窗口的增大而加强。文中还评估了基准气候站对所属气候区的代表性,发现任气候特征复杂的西南地区和新疆部分地区, 站点对气候区的代表性较差。
|
| [24] |
Application of USCRN Station Density Strategy to China Climate Reference Network. USCRN气候基准站网布局理论在我国的应用 . |

/
| 〈 |
|
〉 |
