西北师范大学地理与环境科学学院,兰州 730070
收稿日期: 2016-11-28
修回日期: 2017-03-21
网络出版日期: 2017-08-07
版权声明: 2017 《地理学报》编辑部 本文是开放获取期刊文献,在以下情况下可以自由使用:学术研究、学术交流、科研教学等,但不允许用于商业目的.
基金资助:
作者简介:
作者简介:张文霞(1987-), 女, 甘肃武山人, 硕士, 研究方向为干旱区域环境与绿洲建设。E-mail: zwxjiayou@sina.com
展开
摘要
基于中国绿洲胡杨(Populus euphratica Oliv.)分布区48个地面气象站1960-2015年逐日平均气温数据,采用线性趋势法、Mann-Kendall检验、ArcGIS反距离加权插值法(IDW)、Morlet小波功率谱和相关分析等方法,分析了中国绿洲胡杨年生长季的起止日及生长期长短对气候变暖的时空响应特征及原因。结果表明:近56年来,中国绿洲胡杨年生长季具有起始日提前、终止日推迟、生长期延长的变化趋势,变化倾向率分别为-1.34 d/10a、1.33 d/10a、2.66 d/10a(α ≥ 0.001);空间差异十分显著,呈现出由西南向东北起始日越迟,终止日越早,生长期越短的变化规律。胡杨生长季起止日及生长期分别在2001年、1989年和1996年发生突变,且分别存在3.56~7.14 a不等的短周期,与厄尔尼诺2~7 a的周期一致,起始日3.56 a和4.28 a的周期与大气环流2~4 a的周期吻合。原因分析表明亚洲极涡面积指数、青藏高原指数、西风指数和年均二氧化碳排放量是影响胡杨生长季变化的主要因素;此外,纬度对胡杨生长季的影响要明显大于海拔高度,且起始日受纬度和海拔高度的影响比终止日更加显著;胡杨生长季起止日和生长期分别与对应月份的平均气温呈显著的高相关性,且3月均温每升高1 ℃,起始日提前2.21 d,10月均温每升高1 ℃,终止日推迟2.76 d,3-10月均温每升高1 ℃,生长期延长7.78 d,表明胡杨生长季的变化对全球增暖的区域响应十分敏感。
关键词:
Abstract
Based on the daily average temperature of 48 meteorological stations in Chinese oases of the distribution area of Populus euphratica, we analyzed spatio-temporal response of the onset and upset date of P. euphratica, and the dates of growing season to climate change, with the aid of methods including a multi-year trend line, Mann-Kendall mutation test, IDW under the ArcGIS software, Morlet wavelet power spectrum, and correlation analysis. The results indicate that in the past 56 years, the onset date of the growing season has advanced and the upset date has postponed; the dates of the growing period have gradually prolonged, with the trend rates being -1.34 d/10a, 1.33 d/10a, 2.66 d/10a (α≥ 0.001), respectively. The spatial difference is extremely significant, which presents the following law: from the southwest to the northeast in Chinese oases, the onset date has postponed, the upset date advanced, and the growing period shortened. The mutation point of the onset and upset dates and growing period is observed in 2001, 1989, and 1996, respectively, and the upset date is more sensitive to climate warming. The cycles of the growing season of P. euphratica are 3.56-7.14 years, which is consistent with the cycle of the El Nino event, and the onset date cycles of 3.56 years and 4.28 years are consistent with that of atmospheric circulation. Cause analysis shows that the Asian polar vortex area index, the Qinghai-Tibet Plateau index, Westerly Circulation index, and the carbon dioxide emissions are the main reasons for the change of the growing season for P. euphratica, and consistent with the results of the periodic analysis. In addition, the influence of latitude in the growing season is significantly larger than that of altitude, while the onset date is more significant than the upset date in terms of latitude and altitude. Additionally, the onset and upset dates and growing period are significantly correlated with the average temperature of corresponding month, with the correlation coefficients being -0.875, 0.770, and 0.897, respectively (α≥ 0.001). Specifically, if the March average temperature increases by 1 ℃, the onset date will occur about 2.21 days earlier; if the October average temperature increases by 1 ℃, the upset date will delay for 2.76 days; if the average temperature of March to October increases by 1 ℃, the growing period will prolong for 7.78 days. This indicates that the change of P. euphratica in the growing season has a sensitive response to regional warming. This study is of great theoretical significance in understanding the response of Chinese vegetation to climate warming and ecological restoration.
Keywords:
近百年来全球变暖已毋庸置疑,IPCC第五次评估报告指出,1880-2012年,全球地表平均温度升高了0.85 ℃,且中国气候变暖的趋势与全球一致[1]。而植被是陆地生态系统中最重要的组分,其物候变化对区域气候的响应敏感且易于观察[2],因此,植物物候变化对全球气候响应的研究已成为国内外气候变化研究领域的热点[3],诸多研究已证实全球变暖使植物生长季起止日和生长期都发生相应的变化[4]。国外对物候的研究开始的较早,欧洲有组织的物候观察最早始于18世纪中期,后逐渐建立EPN(欧洲物候观测网)、IPG(欧洲国际物候园)等物候观测网络,以方便研究[4]。Menzel等利用IPG 1960-1990年的物候资料研究发现,欧洲植物因气温上升,春季物候提前6 d,秋季物候推迟4.8 d[5];北美紫丁香[6]、比利时温带木本植物[7]春季物候期也都明显提前;春季增温1 ℃导致欧洲甜樱桃、毛桦等植物生长季起始日提前了8 d [2];生长季终止日的推迟趋势在北半球70%的地区都很明显,平均速率为0.18±0.38 d/a[8]。物候变化对气候的响应还表现在植物始花期、展叶期、着色期等物候期的变化。欧洲中部地区的植物[9](雪花莲、连翘、甜樱桃和苹果)、英国11种植物[10]、加拿大山杨[11]、伊朗Kerman和Shiraz的柑橘[12]、匈牙利植物[13](铃兰、接骨木、小叶椴、蒲公英)的始花期均有提前;瑞士马栗树[14]及立陶宛落叶树种[15]的展叶期,格鲁吉亚白葡萄[16]的着色期也都明显提前。竺可桢先生是中国现代物候学创始人,于1963年建立中国物候观测网,为研究物候变化提供数据[17]。张福春在1995年指出气温是影响中国木本植物物候变化的主要气象因子,当年均温上升1 ℃时,中国木本植物春季物候期约提前3~4 d,秋季物候期约推迟3~4 d[18]。此外,一些学者还对中国温带植物[19]、河北草本植物[20]、贵阳木本植物[21]、郑州植物[22]、民勤荒漠区植物[23]的物候变化进行研究,均表现出春季物候提前,秋季物候推迟的变化趋势;陈效逑还指出植被的多年平均生长季长度主要随纬度和海拔高度变化[24]。
胡杨是地处亚洲中部荒漠区分布最广的乔木树种之一,横跨亚、非、欧三个大陆的20个国家,其中中国绿洲胡杨林分布面积及数量均为世界第一,主要分布在新疆、青海柴达木盆地、阿拉善高原、河西走廊、河套平原等绿洲中[25-27]。胡杨具有耐干旱、耐盐碱、防风、生长快、适应性强[25]等优点,是维护干旱区绿洲生态平衡的绿色卫士,其生长季起止日和生长期的变化,是研究中国绿洲气候变化的指示器。目前中国胡杨生长季变化对气候响应的研究仅集中在河西走廊绿洲[27]、额济纳旗绿洲[28]等个别区域,而对广大的新疆绿洲、河套绿洲、柴达木盆地绿洲的胡杨尚未研究,对气候响应的时空格局与成因也不清楚。因此,本文对中国绿洲胡杨生长季起止日及生长期的时空变化特征进行探讨,以期更好地反映中国绿洲胡杨对气候变化的响应,为中国绿洲生态环境的恢复与重建提供理论依据,也有助于提高该区域应对气候变化的能力。
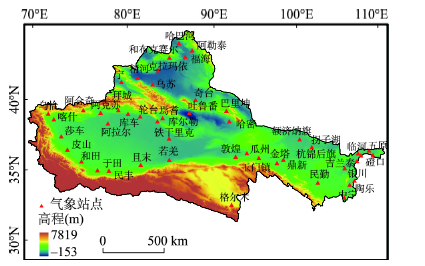
中国绿洲地处34°25′N~48°10′N、73°40′E~109°08′E,主要分布在中国西北的荒漠与半荒漠区,几乎都依托高大山系及巨大的山前洪积扇而存在(图1),多为平原荒漠气候,干旱少雨,冬寒夏炎,气温年较差和日较差都很大,热量丰富,大体自东向西递增,≥ 10 ℃积温从河西走廊的2500 ℃增至新疆塔里木盆地的4500 ℃以上,但柴达木盆地因受青藏高原垂直带的影响,积温偏低,大多不足1500 ℃。年平均降水量在200 mm以下,蒸发量大;光照丰富,尤其是河西走廊、塔里木盆地及内蒙古西部地区,年太阳总辐射量均在586 kJ/cm2以上[29]。土壤以棕漠土、灰棕漠土和风沙土为主,地带性植被以荒漠和荒漠草原为主。
图1 中国绿洲胡杨林气象站点分布
Fig. 1 Distribution of meteorological stations of P. euphratica in Chinese oases
本文根据胡杨的分布范围,选用中国绿洲胡杨分布区所在的48个地面气象站1960-2015年逐日平均气温数据,数据源于中国气象局科学数据服务共享网(http://www.cma.gov.cn/)。申元村等根据绿洲区划的原则和方法将中国绿洲划分为北疆绿洲、南疆绿洲、河西走廊绿洲、柴达木盆地绿洲、河套平原绿洲和阿拉善绿洲[29];常兆丰等根据民勤沙生植物园1974-2007年42种植物的物候观测资料,分析认为气温是影响干旱区绿洲植物物候期的主要因子,气温升高是导致民勤荒漠区植物物候期变化的主要原因[23]。根据魏庆莒提出的胡杨年生长季始于春季日均温稳定≥ 5 ℃,止于秋季日均温稳定≤ 5 ℃的标准[25],确定胡杨年生长季的起始日、终止日和生长期,中国绿洲胡杨生长季起止日和生长期则是按照绿洲亚区加权平均计算获得的。环流特征指数采用国家气候中心提供的74项环流指数(1960-2015年月数据)中的冷空气指数(CA)、青藏高原指数(TPI)、亚洲极涡指数(APVII、APVAI)和西风指数(WCI);年均二氧化碳排放量(CDE)(1960-2011年)来自世界银行的发展指标数据库(WDI)(http://data.worldbank.org)。本文采用线性趋势法分析胡杨生长季的年际变化特征和趋势,利用ArcGIS 9.3软件中IDW(反距离加权法)插值法分析中国绿洲胡杨生长季的空间变化特征及趋势,并进行空间差异分析,利用Mann-Kendall法进行突变检验和趋势分析,Morlet小波功率谱进行周期分析,采用相关分析法与二元回归分析法探讨各影响因素对胡杨生长季变化的影响。
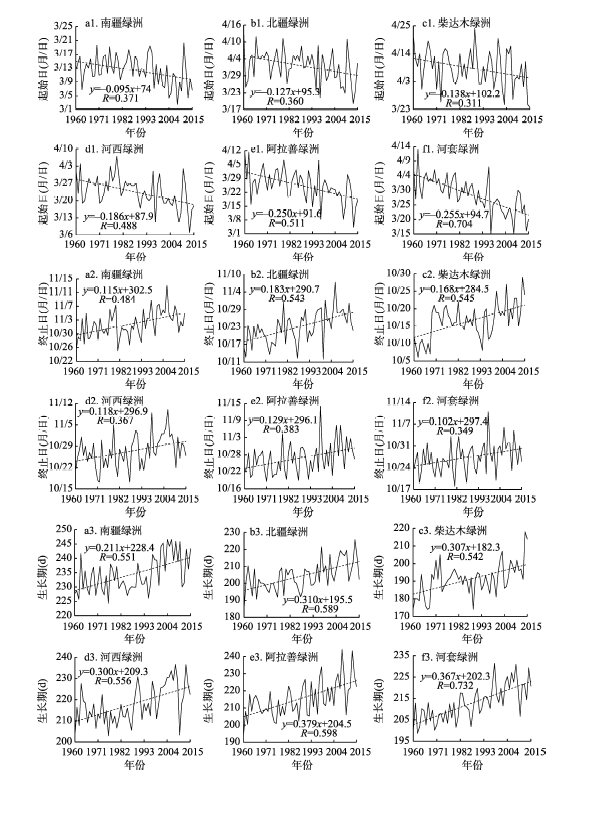
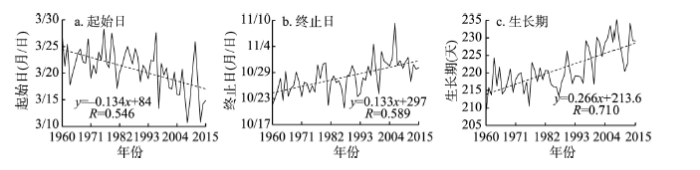
4.1.1 生长季起始日 近56年来,中国绿洲胡杨生长季起始日呈显著提前趋势(图2a),变化倾向率为-1.34d/10a(α ≥ 0.001),平均年生长季起始日为3月21日,56年来起始日平均提前了7.5d。各绿洲胡杨生长季起始日不一,且均呈提前趋势,但提前程度各异(图3a1~3f1)。其中南疆绿洲胡杨生长季起始最早,平均为3月11日,柴达木盆地绿洲最晚,平均为4月8日。起始日提前趋势最明显的是河套绿洲,变化倾向率为-2.55 d/10a(α ≥ 0.001),56年来绿洲胡杨生长季起始日共提前了14 d;提前趋势最不明显的是南疆绿洲,变化倾向率仅为-0.95 d/10a(α ≥ 0.05),56年来其胡杨生长季起始日仅提前了5.4 d。
图3 中国各绿洲胡杨林生长季起止日及生长期的年际变化趋势
Fig. 3 Variation trend of the onset and upset date and growing period of P. euphratica in each oasis of China
从年代际变化来看(表1),中国绿洲胡杨生长季起始日在20世纪60-80年代为正距平,且70年代有起始日略微推迟的趋势,从20世纪80年代开始起始日呈提前趋势,到90年代起始日距平值由正值转为负值,且在20世纪90年代-21世纪前10年距平值变化最大,到21世纪前10年距平值最大,为3.8 d,表明21世纪初胡杨生长季起始日提前最显著。
4.1.2 生长季终止日 近56年来,中国绿洲胡杨生长季终止日呈显著推迟趋势(图2b),变化倾向率为1.33 d/10a(α ≥ 0.001),平均年生长季终止日为10月28日,56年来终止日平均推迟了7.5 d。各绿洲胡杨生长季终止日虽有早有晚,但均呈推迟趋势(图3a2~3f2)。其中,柴达木盆地绿洲胡杨生长季结束最早,平均为10月16日,南疆绿洲最晚,平均为11月1日。56年来北疆绿洲胡杨生长季终止日推迟趋势最明显,变化倾向率为1.83 d/10a(α ≥ 0.001),56年共推迟了10 d;河套绿洲推迟趋势最不明显,其变化倾向率仅为1.02 d/10a(α ≥ 0.05),56年仅推迟了5.7 d。
图2 中国绿洲胡杨林生长季起始日、终止日和生长期年际变化趋势
Fig. 2 Variation trend of the onset and upset date and growing period of P. euphratica in Chinese oases
从年代际变化来看(表1),中国绿洲胡杨生长季终止日在20世纪60-80年代均为负距平,数值介于-2.7~-1.5之间,且80年代有终止日略微提前的趋势;从90年代开始生长季终止日呈推迟趋势,且距平值由负值转为正值,即在0.5~3.6之间,且在20世纪90年代-21世纪前10年变化最大,到21世纪前10年距平值高达3.6,表明21世纪前10年胡杨生长季终止日推迟趋势最明显。
表1 中国绿洲胡杨生长季年代际距平
Tab. 1 The decadal anomalies of the growing season of P. euphratica in Chinese oases
| 年代 | 起始日 | 终止日 | 生长季 |
|---|---|---|---|
| 20世纪60年代 | 1.8 | -2.7 | -4.4 |
| 20世纪70年代 | 2.4 | -1.3 | -3.7 |
| 20世纪80年代 | 1.6 | -1.5 | -3.2 |
| 20世纪90年代 | -0.1 | 0.5 | 0.7 |
| 21世纪前10年 | -3.8 | 3.6 | 7.3 |
| 2010-2015年 | -3.3 | 2.3 | 5.5 |
从年代际变化来看(表1),研究区胡杨生长期呈显著延长趋势,距平值在20世纪60-80年代均为负值,且距平值绝对值逐渐减小,生长期逐渐延长,从20世纪90年代开始距平值由负距平转为正距平,并且逐渐增大,20世纪90年代-21世纪前10年变化最大,距平值增加了6.6d,到21世纪前10年距平值高达7.3 d,生长期延长趋势最明显。
综上所述,近56年来,中国绿洲胡杨生长季存在明显的起始日提前、终止日推迟,生长期延长的变化趋势,这与中国木本植物春季物候期提前,秋季物候期推迟,生长期延长的研究结论相一致[18]。从总体来看,研究区胡杨生长季起始日提前趋势较终止日推迟趋势更为显著,这与欧洲植物生长期的延长主要因春季物候提前的结论一致[2]。
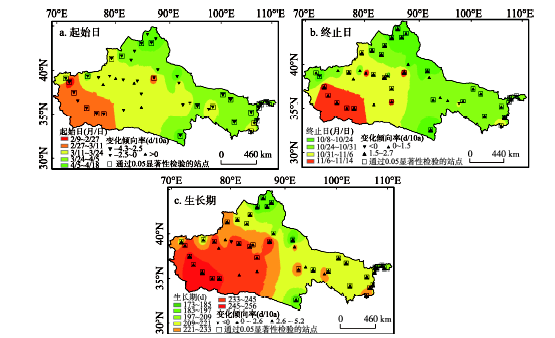
本文利用ArcGIS 9.3中IDW插值法,以各绿洲所在48个站点胡杨生长季起止日和生长期的56年平均值作为参数,绘制中国绿洲胡杨生长季起止日期、生长期的空间变化特征图,以探讨其空间分布特征和规律。
中国绿洲胡杨生长季起止日及生长期的空间差异十分显著,但三者的空间变化特征一致,均表现为自西南向东北起始日逐渐推迟,终止日逐渐提前,生长期逐渐缩短的变化规律,且这种变化规律在新疆绿洲尤为明显(图4)。中国绿洲胡杨生长季起始日介于2月9日至4月18日,终止日介于10月8日至11月14日,生长期介于173~256 d之间,其中南疆绿洲西南部地区胡杨生长季起始最早,终止最晚,生长期最长,这是因为南疆地处天山以南的塔里木盆地,受天山阻挡,地形闭塞,冷空气东入的机会多,且到达绿洲西南部已是强弩之末[30],再加上下垫面沙漠广布,盆地地形热量难以扩散,故南疆绿洲西部整体较暖;柴达木盆地绿洲胡杨生长季起始日最晚,终止日最早,生长期最短,这是因为柴达木盆地是高原绿洲,海拔较高,气温较低。
图4 中国绿洲胡杨生长季起止日、生长期的空间变化趋势
Fig. 4 Spatial distribution trend of onset and upset date and growing period of P. euphratica in Chinese oases
从变化趋势来看,研究区胡杨生长季起始日92%的站点处于提前趋势,其中56%的站点通过了0.05的显著性检验;终止日96%的站点处于推迟趋势,其中75%的站点通过了0.05的显著性检验;生长期98%的站点处于延长趋势,其中85%的站点通过了0.05的显著性检验,这表明中国绿洲胡杨生长期的延长趋势十分明显且很普遍。其中,河套绿洲和阿拉善绿洲均具有起始日提前、生长期延长,但终止日推迟趋势很不明显的变化特征,这可能因为内蒙古地区冬夏升温最明显,其次是春季,而秋季升温最为微弱造成的[31];南疆地区起始日提前趋势及生长期延长趋势都最不明显,终止日推迟趋势也很不明显,北疆绿洲终止日推迟趋势最明显,但起始日提前趋势不明显,这与近45年(1961-2005年)新疆气温的季节增温率春季最低有关[32];柴达木盆地绿洲终止日推迟趋势十分明显,但起始日提前趋势不明显,这与柴达木盆地秋冬季增温明显高于春夏,且春季增暖最缓慢有关[33]。
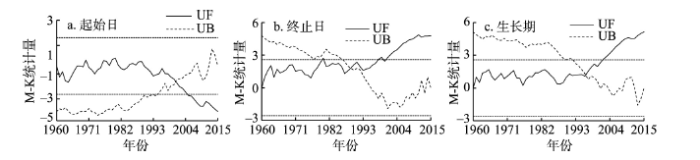
本文采用Mann-Kendall法对1960-2015年中国绿洲胡杨的生长季起止日和生长期的变化进行突变检测分析,子序列长度为3 a,给定显著性水平α = 0.01,临界线Uα = ±2.56。
结果表明,近56年来,中国绿洲胡杨生长季起始日在2001年发生突变(图5a),2001年后起始日明显提前,且从2005年开始,UF曲线超过临界线,胡杨生长季起始日显著提前;2001年突变前起始日平均在3月22日,突变后变为3月17日,突变后较突变前起始日提前5 d(表2)。胡杨生长季终止日突变年份为1989年(图5b),且从2000年开始,UF曲线超过临界线,终止日显著推迟;突变前终止日平均在10月26日,突变后平均在10月30日,突变后较突变前终止日推迟了4 d。胡杨生长期在1996年发生突变(图5c),由UF曲线可知,1996年以前,胡杨生长期缓慢延长,从1996年开始,胡杨生长期延长趋势十分显著;突变前平均生长期为218 d,突变后平均为228 d,突变前后生长期延长10 d。显然,胡杨生长季终止日对气候变暖的响应更加敏感。
表2 中国绿洲胡杨生长季突变前后的变化
Tab. 2 The change of the growing season of P. euphratica in Chinese oases before and after mutation
| 起始日 | 终止日 | 生长期(d) | |
|---|---|---|---|
| 突变前 | 3月22日 | 10月26日 | 218 |
| 突变后 | 3月17日 | 10月30日 | 228 |
| 变化(d) | -5 | 4 | 10 |
图5 中国绿洲胡杨生长季起止日、生长期的突变分析
Fig. 5 Mutation analysis of onset and upset date and growing period of P. euphratica in Chinese oases
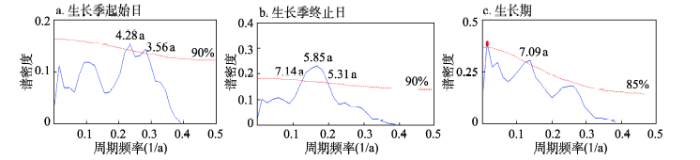
本文继而采用Morlet小波功率谱分析方法对中国绿洲胡杨生长季起止日及生长期进行周期分析。结果表明,研究区胡杨生长季具有明显的短周期特征,其中,胡杨生长季起始日存在3.56 a、4.28 a(α ≥ 0.1)的周期(图6a),终止日存在5.31 a、5.85 a、7.14 a (α ≥ 0.1)的周期(图6b),生长期存在7.09 a(α ≥ 0.15)的周期(图6c)。胡杨生长季起止日和生长期的周期均与厄尔尼诺2~7 a的活动周期相一致,起始日的周期与大气环流2~4 a的周期相吻合,表明胡杨生长季起止日及生长期受大气环流和厄尔尼诺事件的影响较大。
图6 中国绿洲胡杨生长季起止日及生长期的Morlet小波分析
Fig. 6 Morlet wavelet of the onset and upset date and growing period of P. euphratica in Chinese oases
4.5.1 影响因子的相关分析 本文从自然因素和人为因素两方面探讨胡杨生长季起止日及生长期变化的影响因素,选取了APVAI、APVII、CA、TPI和WCI作为自然因素指标,年均二氧化碳排放量CDE(年数据)作为人为因素指标,将各指标3月、10月、3-10月的均值与中国各绿洲胡杨生长季起止日及生长期建立相关关系,研究年际尺度胡杨生长季变化的驱动因子。其中柴达木盆地胡杨生长季起止日及生长期与各指数4月、11月和4-11月的均值建立相关关系。
结果表明:胡杨生长季起止日及生长期的变化主要受APVAI、TPI、WCI和CDE的影响(表3),这与小波功率谱周期结果一致。当亚洲极涡面积大时,胡杨生长季起始日较迟,终止日较早,生长期较短。TPI与胡杨生长季起止日及生长期存在较为显著的相关性,尤其与河西走廊和南疆绿洲的相关性很高,这主要与青藏高原的动力和热力作用有关,冬季由于高原的分支作用,冷空气一支由东进入南疆,另一支沿河西走廊南下,进而影响胡杨生长季起止日期的变化[34]。除柴达木盆地绿洲外,中国绿洲其他地区胡杨生长季起止日及生长期受WCI的影响较明显,中国绿洲处于中纬度西风带,西风环流的强弱影响气温变化。除柴达木盆地绿洲起始日以外,其他绿洲起止日和生长期都与CDE呈显著的高相关性,而CO2的过量排放是导致全球变暖的主要原因,CDE与胡杨生长季变化的高相关性进一步反映出胡杨生长季的变化对中国绿洲气候变化的响应十分敏感。
表3 中国绿洲胡杨生长季起止日、生长期影响因子的相关分析
Tab. 3 Correlation analysis between the onset and upset date and growing period of P. euphratica and impact factors in Chinese oases
| APVII | APVAI | CA | TPI | WCI | CDE | ||
|---|---|---|---|---|---|---|---|
| 起始日 | 阿拉善 | 0.243* | 0.529*** | 0.029 | -0.185 | -0.399*** | -0.377*** |
| 北疆 | 0.393*** | 0.583*** | -0.053 | -0.177 | -0.263** | -0.246* | |
| 柴达木 | -0.091 | 0.013 | -0.108 | -0.346*** | -0.092 | -0.17 | |
| 河套 | 0.173 | 0.486*** | 0.045 | -0.306** | -0.397*** | -0.582*** | |
| 河西 | 0.181 | 0.580*** | -0.016 | -0.434*** | -0.409*** | -0.319** | |
| 南疆 | -0.21 | 0.342*** | -0.272** | -0.540*** | -0.435*** | -0.321** | |
| 终止日 | 阿拉善 | -0.104 | -0.273** | -0.163 | 0.372*** | 0.315** | 0.281** |
| 北疆 | -0.324** | -0.523*** | -0.179 | 0.372*** | 0.284** | 0.547*** | |
| 柴达木 | -0.340** | -0.042 | 0.071 | 0.135 | 0.068 | 0.474*** | |
| 河套 | 0.145 | -0.211 | -0.096 | 0.395*** | 0.382*** | 0.392*** | |
| 河西 | -0.03 | -0.395*** | -0.122 | 0.581*** | 0.308** | 0.406*** | |
| 南疆 | -0.230* | -0.416*** | -0.012 | 0.481*** | 0.236* | 0.529*** | |
| 生长期 | 阿拉善 | -0.152 | -0.358*** | -0.246* | 0.301** | 0.356*** | 0.507*** |
| 北疆 | -0.205 | -0.368*** | -0.152 | 0.345*** | 0.234* | 0.538*** | |
| 柴达木 | -0.393*** | -0.270** | -0.062 | 0.192 | 0.059 | 0.423*** | |
| 河套 | -0.106 | -0.363*** | -0.22 | 0.361*** | 0.414*** | 0.649*** | |
| 河西 | -0.169 | -0.362*** | -0.197 | 0.445*** | 0.335** | 0.488*** | |
| 南疆 | -0.222* | -0.480*** | 0.041 | 0.592*** | 0.322** | 0.552*** |
4.5.2 地理参数的影响 由于中国绿洲南北跨越14个纬度,地形起伏较大,故本文进一步分析了纬度和海拔高度对其生长季的影响。本文建立了胡杨生长季起始日、终止日、生长期日数与纬度、海拔高度的二元线性回归模型(置信度95%,R2分别为0.44、0.55和0.57,F分别为17、27和29,均大于F0.05,54 = 4.00):
式中:Y1、Y2、Y3分别为胡杨生长季起始日、终止日、生长期日数;X1为纬度;X2为海拔高度。上述模型反映了纬度和海拔高度对胡杨生长季起止日和生长期日数的影响,纬度每向北推移1°,起始日推迟3.69 d,终止日提前2.57 d,生长期缩短6.3 d;海拔每上升100 m,起始日推迟1.6 d,终止日提前1.2 d,生长期缩短2.8 d。即海拔高度相同时,纬度越高,胡杨生长季起始的越晚,终止的越早,生长期越短;纬度相同时,海拔越高,胡杨生长季开始的越迟,终止的越早,生长期越短。显然,纬度对胡杨生长季起止日和生长期的影响明显大于海拔高度,而起始日受纬度和海拔高度的影响比终止日更加显著,这与前文年际变化研究中得出的胡杨生长季起始日的提前趋势较终止日推迟趋势更为显著的结论一致。
4.5.3 中国绿洲胡杨年生长季起止日、生长期与月平均气温的关系 本文对胡杨年生长季起始日、终止日和生长季天数与3月、10月、3-10月平均气温进行相关分析,进一步探讨胡杨生长季变化与气温之间的响应机制(图7)。结果表明,中国绿洲胡杨生长季起始日与3月平均气温呈显著负相关,相关系数达-0.875(α ≥ 0.001),其中,南疆绿洲相关性最高,高达-0.920(α ≥ 0.001),柴达木盆地绿洲最低,仅为-0.265(α ≥ 0.05),但柴达木盆地绿洲胡杨起始日与4月均温的相关性为-0.571(α ≥ 0.001),表明柴达木盆地绿洲胡杨生长季起始日受4月气温的影响更加明显,这与柴达木盆地绿洲海拔较高,胡杨生长季起始较晚有关。中国绿洲胡杨生长季终止日与10月平均气温呈显著的正相关,相关系数达0.770(α ≥ 0.001),且各绿洲终止日均与10月均温呈显著正相关,表明10月气温越高,胡杨生长季终止的越迟,其中北疆绿洲相关系数最大,为0.815(α ≥ 0.001)。胡杨生长期天数与3-10月平均气温呈极显著正相关,相关系数高达0.897(α ≥ 0.001),且各绿洲生长期天数均与3-10月平均气温呈显著正相关,相关系数在0.606~0.854(α ≥ 0.001)之间,表明3-10月气温越高,胡杨生长期天数越长,其中北疆绿洲相关性最高。
图7 中国绿洲胡杨生长季起止日、生长期与所在月及时段平均气温的相关分析
Fig. 7 Correlation analysis between the onset and upset date and growing period of P. euphratica and mean monthly temperaturesin Chinese oases
气温是影响中国木本植物物候变化的主导气象因子[18],它可以控制物候期的迟早,且从上述统计分析得知,胡杨年生长季与对应月份平均气温有较大相关性,故建立胡杨年生长季起始日、终止日及生长期与对应月份平均气温之间的回归方程(其中置信度95%;R2分别为0.77、0.59和0.81;F值分别为177、78和223,均大于F0.05,54=4.00)
式中:Y1、Y2、Y3分别为胡杨生长季起始日、终止日、生长期天数;X3为3月平均气温;X4为10月平均气温;X5为3-10月平均气温。
该模型能够很好地反映胡杨生长季变化对气温变化的响应程度。模型计算结果表明,如果3月平均气温升高1 ℃,中国绿洲胡杨生长季起始日提前2.21 d;如果10月平均气温升高1 ℃,终止日将推迟2.76 d,这与陈效逑研究中国温带地区植被得出秋季日均温每升高1 ℃,生长季结束日期推迟2.6 d的结论相似[35];如果3-10月平均温度升高1 ℃,生长期将延长7.78 d。可见胡杨生长对全球变暖的响应是敏感的。
(1)近56年来,中国绿洲胡杨年生长季有显著的起始日提前、终止日推迟、生长期延长的变化趋势,变化倾向率分别为-1.34 d/10a、1.33 d/10a、2.66d /10a(α ≥ 0.001),其中南疆绿洲胡杨生长季起始日最早、终止日最晚、生长期最长,柴达木盆地绿洲反之。
(2)中国绿洲胡杨生长季起止日及生长期空间差异显著,但变化特征一致,均呈现出由西南向东北起始日推迟、终止日提前、生长期缩短的变化规律,且此规律在新疆绿洲表现最为明显。河套绿洲起始日提前趋势最明显,终止日推迟趋势最小,南疆绿洲起始日提前趋势和生长期延长趋势都最小,而生长期延长趋势最大在阿拉善绿洲,终止日推迟趋势最大在北疆绿洲。
(3)突变分析表明,胡杨生长季起止日及其生长期分别在2001年、1989年、1996年发生突变,显然终止日对气候变暖的响应更加敏感。Morlet小波功率谱分析表明,胡杨生长季起止日和生长期分别存在3.56~7.14 a不等的短周期特征,并与厄尔尼诺2~7 a的周期吻合,起始日与大气环流2~4 a的准周期相一致。
(4)成因分析表明,研究区胡杨生长季起止日及生长期主要受APVAI、TPI、WCI和CDE的影响,与上述小波功率谱分析得出的周期结果相一致。
纬度每向北推移1°,起始日推迟3.69 d,终止日提前2.57 d,生长期缩短6.3 d;海拔每上升100 m,起始日推迟1.6 d,终止日提前1.2 d,生长期缩短2.8 d。显然纬度对胡杨生长季的影响明显大于海拔高度;起始日受纬度和海拔高度的影响比终止日更加显著。
胡杨生长季起止日及生长期分别与3月、10月、3-10月的均温呈显著相关,相关系数分别为-0.875、0.770、0.897(α ≥ 0.001)。3月均温升高1 ℃,起始日提前2.21 d;10月均温每升高1 ℃,终止日推迟2.76 d;3-10月均温每升高1 ℃,生长期延长7.78 d。
The authors have declared that no competing interests exist.
| [1] |
259 Authors and TSU (Bern & Beijing). Highlights of the IPCC working group I fifth assessment report. 259名作者和TSU(驻伯尔尼和北京). IPCC第五次评估报告第一工作组报告的亮点结论 . |
| [2] |
Response of tree phenology to climate change across Europe. https://doi.org/10.1016/S0168-1923(01)00233-7 URL [本文引用: 3] 摘要
To investigate the impact of recent climatic changes on the plant development in Europe, this study uses phenological data of the International Phenological Gardens for the period 1969–1998. For this study, the leafing dates of four tree species ( Betula pubescens, Prunus avium, Sorbus aucuparia and Ribes alpinum) were combined in an annual leaf unfolding index to define the beginning of growing season. The end of growing season was defined using the average leaf fall of B. pubescens, P. avium, Salix smithiana and R. alpinum. A nearly Europe-wide warming in the early spring (February–April) over the last 30 years (1969–1998) led to an earlier beginning of growing season by 8 days. The observed trends in the onset of spring corresponded well with changes in air temperature and circulation ( North Atlantic Oscillation Index (NAO-index)) across Europe. In late winter and early spring, the positive phase of NAO increased clearly, leading to prevailing westerly winds and thus to higher temperatures in the period February–April. Since the end of the 1980s the changes in circulation, air temperature and the beginning of spring time were striking. The investigation showed that a warming in the early spring (February–April) by 1°C causes an advance in the beginning of growing season of 7 days. The observed extension of growing season was mainly the result of an earlier onset of spring. An increase of mean annual air temperature by 1°C led to an extension of 5 days.
|
| [3] |
Progress in the studies on the phenological responding to global warming. https://doi.org/10.3321/j.issn:1001-8166.2002.05.013 URL [本文引用: 1] 摘要
The global average surface temperature has increased over the 20th Century evidently, especially in the last 20 years of the century. Global warming has been a very important problem of the world. Climate warming is expected to alter seasonal biological phenomena such as plant growth and flowering or animal migration, which depend on accumulated temperature. These phenological changes are likely to have a wide range of consequences for ecological processes, agriculture, forestry, human health, and the global economy. The study on the phenological responding to global warming is becoming a new hot research point. Remote sensing data validate these ground observations on larger scales. Lots of studies demonstrate that NOAA AVHRR data are well suited for studying the regional impact of the climatic change. This paper summarized the progresses in the studies of the phenology in responding to global warming. Based on observation on the spot and remote sensing monitoring on plant and animal, it is found that the phenology is changing remarkably. Many plants and animals respond to a longer growing season by changing the timing of activities associated with the arrival of spring and onset of autumn such as flowering, leaf fall, breeding, and migration. Observations on the spot show the leaves of many deciduous plant species now unfold earlier and fall later in the mid- to high-latitude area of the northern hemisphere. A large increase in growing season NDVI magnitude and a longer active growing season has also been observed by satellite. Flowering date of many flowers are tending to earlier. Some insects now also appear earlier. The timing of bird migration and breeding is sensitive to changes in temperature, and global warming would be expected to lead to an earlier onset of those activities in the spring. These changes in plant and animal phenology may lead to a decoupling of species interactions. It is also found the trend toward earlier ice break-up and snow melting in spring that is consistent with the enhanced warming observed at higher latitudes. All the phenological changes which link to increasing surface temperatures very well, which is an obviously responding to the globe warming. Compared with the international research advance, there are still lots of work to do on the research of phonological response to global warming in China.顎
物候对全球变暖响应的研究综述 .https://doi.org/10.3321/j.issn:1001-8166.2002.05.013 URL [本文引用: 1] 摘要
The global average surface temperature has increased over the 20th Century evidently, especially in the last 20 years of the century. Global warming has been a very important problem of the world. Climate warming is expected to alter seasonal biological phenomena such as plant growth and flowering or animal migration, which depend on accumulated temperature. These phenological changes are likely to have a wide range of consequences for ecological processes, agriculture, forestry, human health, and the global economy. The study on the phenological responding to global warming is becoming a new hot research point. Remote sensing data validate these ground observations on larger scales. Lots of studies demonstrate that NOAA AVHRR data are well suited for studying the regional impact of the climatic change. This paper summarized the progresses in the studies of the phenology in responding to global warming. Based on observation on the spot and remote sensing monitoring on plant and animal, it is found that the phenology is changing remarkably. Many plants and animals respond to a longer growing season by changing the timing of activities associated with the arrival of spring and onset of autumn such as flowering, leaf fall, breeding, and migration. Observations on the spot show the leaves of many deciduous plant species now unfold earlier and fall later in the mid- to high-latitude area of the northern hemisphere. A large increase in growing season NDVI magnitude and a longer active growing season has also been observed by satellite. Flowering date of many flowers are tending to earlier. Some insects now also appear earlier. The timing of bird migration and breeding is sensitive to changes in temperature, and global warming would be expected to lead to an earlier onset of those activities in the spring. These changes in plant and animal phenology may lead to a decoupling of species interactions. It is also found the trend toward earlier ice break-up and snow melting in spring that is consistent with the enhanced warming observed at higher latitudes. All the phenological changes which link to increasing surface temperatures very well, which is an obviously responding to the globe warming. Compared with the international research advance, there are still lots of work to do on the research of phonological response to global warming in China.顎
|
| [4] |
Research on plant phenological responses to climate change abroad. 国外植物物候对气候变化响应的研究进展 . |
| [5] |
Growing season extended in Europe. https://doi.org/10.1038/17709 URL [本文引用: 1] 摘要
Changes in phenology (seasonal plant and animal activity driven by environmental factors) from year to year may be a sensitive and easily observable indicator of changes in the biosphere. We have analysed data from more than 30 years of observation in Europe, and found that spring events, such as leaf unfolding, have advanced by 6 days, whereas autumn events, such as leaf colouring, have been delayed by 4.8 days. This means that the average annual growing season has lengthened by 10.8 days since the early 1960s. These shifts can be attributed to changes in air temperature.
|
| [6] |
Changes in North American spring. https://doi.org/10.1002/1097-0088(20000630)20:83.0.CO;2-5 URL [本文引用: 1] 摘要
ABSTRACT Onset of the growing season in mid-latitudes is a period of rapid transition, which includes heightened interaction between living organisms and the lower atmosphere. Phenological events (seasonal plant and animal activity driven by environmental factors), such as first leaf appearance or flower bloom in plants, can serve as convenient markers to monitor the progression of this yearly shift, and assess longer-term change resulting from climate variations. We examined spring seasons across North America over the 1900–1997 period using modelled and actual lilac phenological data. Regional differences were detected, as well as an average 5–6 day advance toward earlier springs, over a 35-year period from 1959–1993. Driven by seasonally warmer temperatures, this modification agrees with earlier bird nesting times, and corresponds to a comparable advance of spring plant phenology described in Europe. These results also align with trends towards longer growing seasons, reported by recent carbon dioxide and satellite studies. North American spring warming is strongest regionally in the northwest and northeast portions. Meanwhile, slight autumn cooling is apparent in the central USA. Copyright 08 2000 Royal Meteorological Society
|
| [7] |
Bayesian calibration of the Unified budburst model in six temperate tree species. https://doi.org/10.1007/s00484-011-0408-7 URL PMID: 21298448 [本文引用: 1] 摘要
Abstract, which agreed with the observed trends. In synthesis, our results suggest that the Unichill model can be successfully applied to chestnut and black locust (with both across-site and site-specific calibration) and to birch (with site-specific calibration). For other species, temperature is not the only determinant of budburst and additional influencing factors will need to be included in the model.
|
| [8] |
Delayed autumn phenology in the Northern Hemisphere is related to change in both climate and spring phenology. https://doi.org/10.1111/gcb.13311 URL PMID: 27061925 [本文引用: 1] 摘要
Abstract The timing of the end of the vegetation growing season (EOS) plays a key role in terrestrial ecosystem carbon and nutrient cycles. Autumn phenology is, however, still poorly understood, and previous studies generally focused on few species or were very limited in scale. In this study, we applied four methods to extract EOS dates from NDVI records between 1982 and 2011 for the Northern Hemisphere, and determined the temporal correlations between EOS and environmental factors (i.e., temperature, precipitation and insolation), as well as the correlation between spring and autumn phenology, using partial correlation analyses. Overall, we observed a trend toward later EOS in ~70% of the pixels in Northern Hemisphere, with a mean rate of 0.1802±020.3802days02yr611. Warming preseason temperature was positively associated with the rate of EOS in most of our study area, except for arid/semi-arid regions, where the precipitation sum played a dominant positive role. Interestingly, increased preseason insolation sum might also lead to a later date of EOS. In addition to the climatic effects on EOS, we found an influence of spring vegetation green-up dates on EOS, albeit biome dependent. Our study, therefore, suggests that both environmental factors and spring phenology should be included in the modeling of EOS to improve the predictions of autumn phenology as well as our understanding of the global carbon and nutrient balances.
|
| [9] |
Phenology in central Europe-differences and trends of spring phenophases in urban and rural areas. https://doi.org/10.1007/s004840000062 URL PMID: 10993559 [本文引用: 1] 摘要
In order to examine the impacts of both large-scale and small-scale climate changes (urban climate effect) on the development of plants, long-term observations of four spring phenophases from ten central European regions (Hamburg, Berlin, Cologne, Frankfurt, Munich, Prague, Vienna, Zurich, Basle and Chur) were analysed. The objective of this study was to identify and compare the differences in the starting dates of the pre-spring phenophases, the beginning of flowering of the snowdrop ( Galanthus nivalis ) and forsythia ( Forsythia sp.), and of the full-spring phenophases, the beginning of flowering of the sweet cherry ( Prunus avium ) and apple ( Malus domestica ), in urban and rural areas. The results indicate that, despite regional differences, in nearly all cases the species studied flower earlier in urbanised areas than in the corresponding rural areas. The forcing in urban areas was about 4 days for the pre-spring phenophases and about 2 days for the full-spring phenophases. The analysis of trends for the period from 1951 to 1995 showed tendencies towards an earlier flowering in all regions, but only 22% were significant at the 5% level. The trends for the period from 1980 to 1995 were much stronger for all regions and phases: the pre-spring phenophases on average became earlier by 13.9 days/decade in the urban areas and 15.3 days/decade in the rural areas, while the full-spring phenophases were 6.7 days earlier/decade in the urban areas and 9.1 days/decade earlier in the rural areas. Thus rural areas showed a higher trend towards an earlier flowering than did urban areas for the period from 1980 to 1995. However, these trends, especially for the pre-spring phenophases, turned out to be extremely variable.
|
| [10] |
An examination of the relationship between flowering times and temperature at the national scale using long-term phenological records from the UK. |
| [11] |
Spring phenology trends in Alberta, Canada: links to ocean temperature. |
| [12] |
-2010. Agricultural & Forest Meteorology, |
| [13] |
Flowering phenological changes in relation to climate change in Hungary. https://doi.org/10.1007/s00484-015-1128-1 URL PMID: 26768142 [本文引用: 1] 摘要
The importance of long-term plant phenological time series is growing in monitoring of climate change impacts worldwide. To detect trends and assess possible influences of climate in Hungary, we studied flowering phenological records for six species (Convallaria majalis, Taraxacum officinale, Syringa vulgaris, Sambucus nigra, Robinia pseudoacacia, Tilia cordata) based on phenological observations from the Hungarian Meteorological Service recorded between 1952 and 2000. Altogether, four from the six examined plant species showed significant advancement in flowering onset with an average rate of 1.9-4.4 days per decade. We found that it was the mean temperature of the 2-3 months immediately preceding the mean flowering date, which most prominently influenced its timing. In addition, several species were affected by the late winter (January-March) values of the North Atlantic Oscillation (NAO) index. We also detected sporadic long-term effects for all species, where climatic variables from earlier months exerted influence with varying sign and little recognizable pattern: the temperature/NAO of the previous autumn (August-December) seems to influence Convallaria, and the temperature/precipitation of the previous spring (February-April) has some effect on Tilia flowering.
|
| [14] |
Phytophenological trends in Switzerland. https://doi.org/10.1007/s004840100101 URL PMID: 11769321 [本文引用: 1] 摘要
Nation-wide phenological observations have been made in Switzerland since 1951. In addition to these observation programmes, there are two very long phenological series in Switzerland: leaf bud burst of horse-chestnut trees has been observed in Geneva since 1808 and full flowering of cherry trees in Liestal since 1894. In addition to the presentation of these two long phenological series, trends for 896 phenological time series have been calculated with national data from 1951 to 1998. The earlier bud burst of horse-chestnut trees in Geneva can be attributed mainly to the city effect (warmth island). This phenomenon was not observed with the cherry tree flowering in Liestal. A clear trend towards earlier appearance dates in spring and a weak tendency towards later appearance dates in autumn could be shown with data from the national observation network. It must be noted that different phenophases and plant species react differently to various environmental influences.
|
| [15] |
Response of deciduous trees spring phenology to recent and projected climate change in Central Lithuania. https://doi.org/10.1007/s00484-016-1149-4 URL PMID: 26951116 [本文引用: 1] 摘要
The analysis of long-term time series of spring phenology for different deciduous trees species has shown that leaf unfolding for all the investigated species is the most sensitive to temperatures in
|
| [16] |
Grapevine phenology and climate change in Georgia. https://doi.org/10.1007/s00484-016-1241-9 URL [本文引用: 1] 摘要
While the climate of Western Europe has been deeply affected by the abrupt climate change that took place in the late ‘1980s of the twentieth century, a similar signal is detected only few years later
|
| [17] |
The progress of phenology studies and challenges to modern phenology research in China. 物候学研究进展及中国现代物候学面临的挑战 . |
| [18] |
Effects of global warming on plant phonological everts in China. 气候变化对中国木本植物物候的可能影响 . |
| [19] |
Spatiotemporal response of Salix matsudana's phenophases to climate change in China's temperate zone. https://doi.org/10.5846/stxb201310082411 URL [本文引用: 1] 摘要
为了揭示中国温带植物物候随时间变化和植物物候对气候变化响应的空间格局及其生态机制,利用52个站点 1986-2005年的旱柳展叶始期、开花始期、果实成熟期、叶变色始期和落叶末期的物候数据,分析其时间序列的线性趋势,并通过建立基于最佳期间日均温 的物候时间模型,确定物候发生日期对气温年际变化的响应.在研究的时段内,区域平均旱柳展叶始期、开花始期和果实成熟期的发生日期分别以-4.2 d/10 a、-3.8 d/10 a和-3.3 d/10 a的平均速率显著提前,而区域平均旱柳叶变色始期和落叶末期的发生日期则分别呈不显著推迟和以2.4 d/10 a的平均速率显著推迟的趋势.单站展叶始期、开花始期和果实成熟期发生日期的线性趋势以提前为主,显著提前的站点分别占40%、41%和29%;叶变色始 期发生日期呈显著提前和显著推迟趋势的站点数相当,分别占17%和19%;落叶末期发生日期的线性趋势以推迟为主,显著推迟的站点占23%.各站展叶始 期、开花始期和果实成熟期发生日期的线性趋势空间序列与相应的最佳期间日均温的线性趋势空间序列之间呈显著负相关,表明一个站点前期气温升高的速率越快, 该站这些物候期发生日期提前的速率就越快.在物候期对气温年际变化的响应方面,区域平均春季最佳期间日均温每升高1℃,展叶始期、开花始期和果实成熟期的 发生日期分别提前3.08 d、2.83 d和3.54 d;区域平均秋季最佳期间日均温每升高1℃,叶变色始期和落叶末期的发生日期分别推迟1.69 d和2.28 d.单站展叶始期和落叶末期发生日期对气温年际变化的响应表现出在温暖地区的站点比在寒冷地区的站点更为敏感的特点.总体上看,基于日均温的物候时间模型 对春、夏季物候期的模拟精度明显高于对秋季物候期的模拟精度.建立了基于最佳期间日均温和日累积降水量的改进秋季物候模型,该模型使旱柳叶变色始期和落叶 末期的模拟精度显著提高.由此可见,旱柳叶变色始期和落叶末期的发生日期受到前期气温和降水量的综合影响.
中国温带旱柳物候期对气候变化的时空响应 .https://doi.org/10.5846/stxb201310082411 URL [本文引用: 1] 摘要
为了揭示中国温带植物物候随时间变化和植物物候对气候变化响应的空间格局及其生态机制,利用52个站点 1986-2005年的旱柳展叶始期、开花始期、果实成熟期、叶变色始期和落叶末期的物候数据,分析其时间序列的线性趋势,并通过建立基于最佳期间日均温 的物候时间模型,确定物候发生日期对气温年际变化的响应.在研究的时段内,区域平均旱柳展叶始期、开花始期和果实成熟期的发生日期分别以-4.2 d/10 a、-3.8 d/10 a和-3.3 d/10 a的平均速率显著提前,而区域平均旱柳叶变色始期和落叶末期的发生日期则分别呈不显著推迟和以2.4 d/10 a的平均速率显著推迟的趋势.单站展叶始期、开花始期和果实成熟期发生日期的线性趋势以提前为主,显著提前的站点分别占40%、41%和29%;叶变色始 期发生日期呈显著提前和显著推迟趋势的站点数相当,分别占17%和19%;落叶末期发生日期的线性趋势以推迟为主,显著推迟的站点占23%.各站展叶始 期、开花始期和果实成熟期发生日期的线性趋势空间序列与相应的最佳期间日均温的线性趋势空间序列之间呈显著负相关,表明一个站点前期气温升高的速率越快, 该站这些物候期发生日期提前的速率就越快.在物候期对气温年际变化的响应方面,区域平均春季最佳期间日均温每升高1℃,展叶始期、开花始期和果实成熟期的 发生日期分别提前3.08 d、2.83 d和3.54 d;区域平均秋季最佳期间日均温每升高1℃,叶变色始期和落叶末期的发生日期分别推迟1.69 d和2.28 d.单站展叶始期和落叶末期发生日期对气温年际变化的响应表现出在温暖地区的站点比在寒冷地区的站点更为敏感的特点.总体上看,基于日均温的物候时间模型 对春、夏季物候期的模拟精度明显高于对秋季物候期的模拟精度.建立了基于最佳期间日均温和日累积降水量的改进秋季物候模型,该模型使旱柳叶变色始期和落叶 末期的模拟精度显著提高.由此可见,旱柳叶变色始期和落叶末期的发生日期受到前期气温和降水量的综合影响.
|
| [20] |
Phenological characteristics of herbaceous plants in Hebei Province and their responses to climate warming. 河北省草本植物物候特征及其对气候变暖的响应 . |
| [21] |
Response of woody plant phenophases to climate change for recent 30 years in Guiyang. 贵阳木本植物物候对气候变化的响应 . |
| [22] |
Responses of phenology to climate change in Zhengzhou area. 郑州植物物候对气候变化的响应 . |
| [23] |
Responses of plant phenology to climate warming in Minqin desert area. https://doi.org/10.3321/j.issn:1000-0933.2009.10.004 URL [本文引用: 2] 摘要
近几十年来,全球气候普遍变暖.那么,荒漠地区的气候是不是响应了全球气候的这种变化?在全球气候变化过程中,荒漠区植物物候又是如何响应这种气候变化的呢?显然,研究荒漠地区植物物候对气候变化的响应对于深入研究荒漠植物物候与气候因子的关系以及荒漠地区的植物保护都具有重要意义.运用位于中国西北典型荒漠地区的民勤沙生植物园1974~2007年42种中生、旱生植物的物候观测资料进行分析.结果表明:研究区1974年以来气温抬升幅度大于其他文献的研究报道,春季物候期提前幅度明显大于其他国家文献报道;在气温变暖的过程中,不同月份的气温变化与年平均气温的变化趋势并不完全对应,物候期发生当月的平均气温对该物候期的影响>物候期发生上月平均气温>年平均气温;研究区位于中国典型荒漠化地区,属于干旱荒漠气候,春季气温升高较其他地区更加明显,这就是当地春季物候期提前幅度相对较大的原因所在,也是当地以及中国西北沙区近几十年来沙尘暴天气增多和沙尘暴发生日期提前的原因.植物物候变化既是植物对气候变化的综合反应过程,又是植物适应气候变化的过程,尤其是荒漠植物.因此,物候研究将会成为今后气候学和植物生态学研究的一个重要内容.
民勤荒漠区植物物候对气候变暖的响应 .https://doi.org/10.3321/j.issn:1000-0933.2009.10.004 URL [本文引用: 2] 摘要
近几十年来,全球气候普遍变暖.那么,荒漠地区的气候是不是响应了全球气候的这种变化?在全球气候变化过程中,荒漠区植物物候又是如何响应这种气候变化的呢?显然,研究荒漠地区植物物候对气候变化的响应对于深入研究荒漠植物物候与气候因子的关系以及荒漠地区的植物保护都具有重要意义.运用位于中国西北典型荒漠地区的民勤沙生植物园1974~2007年42种中生、旱生植物的物候观测资料进行分析.结果表明:研究区1974年以来气温抬升幅度大于其他文献的研究报道,春季物候期提前幅度明显大于其他国家文献报道;在气温变暖的过程中,不同月份的气温变化与年平均气温的变化趋势并不完全对应,物候期发生当月的平均气温对该物候期的影响>物候期发生上月平均气温>年平均气温;研究区位于中国典型荒漠化地区,属于干旱荒漠气候,春季气温升高较其他地区更加明显,这就是当地春季物候期提前幅度相对较大的原因所在,也是当地以及中国西北沙区近几十年来沙尘暴天气增多和沙尘暴发生日期提前的原因.植物物候变化既是植物对气候变化的综合反应过程,又是植物适应气候变化的过程,尤其是荒漠植物.因此,物候研究将会成为今后气候学和植物生态学研究的一个重要内容.
|
| [24] |
Spatial and temporal variations of the vegetation growing season in warm-temperate Eastern China during 1982 to 1999. https://doi.org/10.3321/j.issn:0375-5444.2007.01.005 URL [本文引用: 1] 摘要
利用1982~1996年5个站点的植物群落物候观测数据和物候累积频率拟合法,划分各站逐年的植被物候季节,并确定各季节初日对应的当地归一化差值植被指数(NDVI)阈值。在此基础上,通过对物候站各年NDVI曲线的年型聚类分析和区内所有像元逐年NDVI曲线的空间聚类分析,实现植被物候季节的时空外推估计,从而得到我国暖温带落叶阔叶林地区1982~1999年植被物候季节初日和生长季节长度的时空格局。结果表明,多年平均的植被物候季节初日和生长季节长度呈现出主要随纬度和海拔高度变化的空间格局。在这18年中,整个区域的物候春季初日以提前为主,且以华北平原提前的趋势最为显著;夏季、秋季和冬季初日以推迟为主,也以华北平原推迟的趋势比较显著;因此,华北平原植被生长季节呈显著延长的趋势。本文揭示的植被物候季节初日的趋势变化与华北地区各季节气温的趋势变化基本吻合;植被生长季节的趋势变化特征与欧洲单种植物物候生长季节,以及欧亚大陆和我国温带遥感植被生长季节的趋势变化基本一致,但植被生长季节初、终日期和长度的趋势值明显大于后者,表明该地区植物物候对于气候变暖的响应更加敏感。
1982-1999年我国东部暖温带植被生长季节的时空变化 .https://doi.org/10.3321/j.issn:0375-5444.2007.01.005 URL [本文引用: 1] 摘要
利用1982~1996年5个站点的植物群落物候观测数据和物候累积频率拟合法,划分各站逐年的植被物候季节,并确定各季节初日对应的当地归一化差值植被指数(NDVI)阈值。在此基础上,通过对物候站各年NDVI曲线的年型聚类分析和区内所有像元逐年NDVI曲线的空间聚类分析,实现植被物候季节的时空外推估计,从而得到我国暖温带落叶阔叶林地区1982~1999年植被物候季节初日和生长季节长度的时空格局。结果表明,多年平均的植被物候季节初日和生长季节长度呈现出主要随纬度和海拔高度变化的空间格局。在这18年中,整个区域的物候春季初日以提前为主,且以华北平原提前的趋势最为显著;夏季、秋季和冬季初日以推迟为主,也以华北平原推迟的趋势比较显著;因此,华北平原植被生长季节呈显著延长的趋势。本文揭示的植被物候季节初日的趋势变化与华北地区各季节气温的趋势变化基本吻合;植被生长季节的趋势变化特征与欧洲单种植物物候生长季节,以及欧亚大陆和我国温带遥感植被生长季节的趋势变化基本一致,但植被生长季节初、终日期和长度的趋势值明显大于后者,表明该地区植物物候对于气候变暖的响应更加敏感。
|
| [25] |
|
| [26] |
|
| [27] |
Climate characteristic of seasonal variation and its influence on annual growth period of populous euphratica Olive in Hexi Corridor in recent 55 years.
利用河西走廊荒漠绿洲胡杨林集中分布区的4个气象站点1955-2009 年日平均气温资料,采用5d滑动平均、气候倾向率、Mann-Kendall和滑动t检验等方法,分析其四季开始日与长度的变化特征及其对胡杨年生长期的 影响.结果表明:近55a来,河西走廊荒漠绿洲区四季开始日主要表现为春、夏和秋季提早,冬季推迟的变化趋势,并以夏季提早最显著,且以21世纪初更突 出.研究区平均四季长短变化特征为:冬季>夏季>春季>秋季.胡杨年生长期有开始日提早、终止日推后的趋势,且推迟趋势更明显;胡杨年生长期天数具有延长 趋势.突变分析表明:春季开始日在1969年和2001年发生突变,夏、秋开始日则分别在1998年、1985年和1997年发生突变,而冬季开始日发生 突变的时间早于其它3季,为1985年;胡杨年生长期开始日具有多个突变,分别在1961年、1973年和1997年发生突变.显然,研究区胡杨对气候变 化的响应更敏感.
近55a来河西走廊荒漠绿洲区季节变化特征及其对胡杨年生长期的影响 .
利用河西走廊荒漠绿洲胡杨林集中分布区的4个气象站点1955-2009 年日平均气温资料,采用5d滑动平均、气候倾向率、Mann-Kendall和滑动t检验等方法,分析其四季开始日与长度的变化特征及其对胡杨年生长期的 影响.结果表明:近55a来,河西走廊荒漠绿洲区四季开始日主要表现为春、夏和秋季提早,冬季推迟的变化趋势,并以夏季提早最显著,且以21世纪初更突 出.研究区平均四季长短变化特征为:冬季>夏季>春季>秋季.胡杨年生长期有开始日提早、终止日推后的趋势,且推迟趋势更明显;胡杨年生长期天数具有延长 趋势.突变分析表明:春季开始日在1969年和2001年发生突变,夏、秋开始日则分别在1998年、1985年和1997年发生突变,而冬季开始日发生 突变的时间早于其它3季,为1985年;胡杨年生长期开始日具有多个突变,分别在1961年、1973年和1997年发生突变.显然,研究区胡杨对气候变 化的响应更敏感.
|
| [28] |
Respond of Populus euphratica Oliv. Phenology to climate warming in the oasis of lower reaches of Heihe River from 1960 to 2010 .https://doi.org/10.3969/j.issn.1000-4025.2012.10.027 URL [本文引用: 1] 摘要
Based on the daily average temperature,maximum and minimum temperature data of 2 weather stations of Dingxin,Ejina Banner in the Heihe River’s downstream in 1960~2010,using the methods of climate trending rate and Mann-Kendall abrupt change test method,the characteristics and respond of Populus euphratica’s phenology to climate change was analyzed,including beginning dates,ending dates of annual growth period,the annual growth period of P.euphratica and the P.euphratica’s beginning dates of yellow leaf stage.The results showed that:(1)The mean annual temperatures in the oasis of lower reaches Heihe River was significantly warming,and the air temperature in the study area which was the oasis of Dingxin and Ejina Banner increased respectively 1.6℃ and 2.4℃ from 1960 to 2010.(2)The change trend of P.euphratica’s characteristics was different in recent 51 years.The beginning dates of annual growth of P.euphratica in the lower reaches Heihe River was becoming earlier.The beginning dates of annual growth of P.euphratica in the oasis of Dingxin and Ejina Banner were -1.46 d/10a (α=0.01),-1.54 d/10a (α=0.02),and they were respectively earlier 7 days and 8 days in recent 51 years.The ending dates was becoming later,they were respectively later 5 days and 9 days in recent 51 years,and it was more appreciable in the oasis of Ejina,it was the most significant in 2000s among the change of decades;The growth period of P.euphratica was prolonged,and the trend of P.euphratica’s annual growth in the oasis of Ejina was more extended 0.9 d/10a than Dingxin,and the average annual length growth was shorten 1 day;the P.euphratica’s beginning dates of yellow leaf stage was becoming slightly later,but it responsed the seasonal change of the climate characteristic in a certain extent,and it was coincided that conclusions which was the temperature changes with temperature fall were not significant.(3)There was significantly different in the abrupt change about P.euphratica phenology,and it was more sensitive in the ending dates.Therefore,it was an obvious response to the climatic change of the P.euphratica in the study area,especially there was more sensitive in Ejina Banner.
黑河下游绿洲胡杨物候期对1960-2010年气温变暖的响应 .https://doi.org/10.3969/j.issn.1000-4025.2012.10.027 URL [本文引用: 1] 摘要
Based on the daily average temperature,maximum and minimum temperature data of 2 weather stations of Dingxin,Ejina Banner in the Heihe River’s downstream in 1960~2010,using the methods of climate trending rate and Mann-Kendall abrupt change test method,the characteristics and respond of Populus euphratica’s phenology to climate change was analyzed,including beginning dates,ending dates of annual growth period,the annual growth period of P.euphratica and the P.euphratica’s beginning dates of yellow leaf stage.The results showed that:(1)The mean annual temperatures in the oasis of lower reaches Heihe River was significantly warming,and the air temperature in the study area which was the oasis of Dingxin and Ejina Banner increased respectively 1.6℃ and 2.4℃ from 1960 to 2010.(2)The change trend of P.euphratica’s characteristics was different in recent 51 years.The beginning dates of annual growth of P.euphratica in the lower reaches Heihe River was becoming earlier.The beginning dates of annual growth of P.euphratica in the oasis of Dingxin and Ejina Banner were -1.46 d/10a (α=0.01),-1.54 d/10a (α=0.02),and they were respectively earlier 7 days and 8 days in recent 51 years.The ending dates was becoming later,they were respectively later 5 days and 9 days in recent 51 years,and it was more appreciable in the oasis of Ejina,it was the most significant in 2000s among the change of decades;The growth period of P.euphratica was prolonged,and the trend of P.euphratica’s annual growth in the oasis of Ejina was more extended 0.9 d/10a than Dingxin,and the average annual length growth was shorten 1 day;the P.euphratica’s beginning dates of yellow leaf stage was becoming slightly later,but it responsed the seasonal change of the climate characteristic in a certain extent,and it was coincided that conclusions which was the temperature changes with temperature fall were not significant.(3)There was significantly different in the abrupt change about P.euphratica phenology,and it was more sensitive in the ending dates.Therefore,it was an obvious response to the climatic change of the P.euphratica in the study area,especially there was more sensitive in Ejina Banner.
|
| [29] |
|
| [30] |
|
| [31] |
Seasonal and regional differences of air temperature changes in Inner Mongolia. https://doi.org/10.11821/yj2009010005 URL [本文引用: 1] 摘要
利用内蒙古地区1961~2003年101个气象站的月平均气温资料和旋转经验正交函数分解 的方法,根据四季气温变化的一致性进行区域的划分,并分析气温变化的季节和区域差异。结果表明:内蒙古地区的四季气温变化存在着明显的东、西分异,春、 秋、冬季的气温场划分为东部和西部两大区域,而在夏季,则划分为西部、东南部和东北部三大区域;在年际波动方面,除夏季的东南区以外,近43年中各区四季 气温的变化都经历了一次显著的由降而升的转折,转折点大致出现在80年代中、后期或90年代初、中期;在线性趋势方面,东部区春、夏季的升温幅度和显著性 大于西部区,而西部区秋、冬季的升温幅度和显著性则大于东部区。一般而言,冬季和夏季升温最为显著,其次是春季,秋季升温最为微弱。
内蒙古地区气温变化的季节和区域差异 .https://doi.org/10.11821/yj2009010005 URL [本文引用: 1] 摘要
利用内蒙古地区1961~2003年101个气象站的月平均气温资料和旋转经验正交函数分解 的方法,根据四季气温变化的一致性进行区域的划分,并分析气温变化的季节和区域差异。结果表明:内蒙古地区的四季气温变化存在着明显的东、西分异,春、 秋、冬季的气温场划分为东部和西部两大区域,而在夏季,则划分为西部、东南部和东北部三大区域;在年际波动方面,除夏季的东南区以外,近43年中各区四季 气温的变化都经历了一次显著的由降而升的转折,转折点大致出现在80年代中、后期或90年代初、中期;在线性趋势方面,东部区春、夏季的升温幅度和显著性 大于西部区,而西部区秋、冬季的升温幅度和显著性则大于东部区。一般而言,冬季和夏季升温最为显著,其次是春季,秋季升温最为微弱。
|
| [32] |
Spatial and temporal trends of climate change in Xinjiang, China. https://doi.org/10.1007/s11442-011-0896-8 URL [本文引用: 1] 摘要
Temperature and precipitation time series datasets from 1961 to 2005 at 65 meteorological stations were used to reveal the spatial and temporal trends of climate change in Xinjiang, China. Annual and seasonal mean air temperature and total precipitation were analyzed using Mann-Kendall (MK) test, inverse distance weighted (IDW) interpolation, and R/S methods. The results indicate that: (1) both temperature and precipitation increased in the past 45 years, but the increase in temperature is more obvious than that of precipitation; (2) for temperature increase, the higher the latitude and the higher the elevation the faster the increase, though the latitude has greater influence on the increase. Northern Xinjiang shows a faster warming than southern Xinjiang, especially in summer; (3) increase of precipitation occurs mainly in winter in northern Xinjiang and in summer in southern Xinjiang. Ili, which has the most precipitation in Xinjiang, shows a weak increase of precipitation; (4) although both temperature and precipitation increased in general, the increase is different inside Xinjiang; (5) Hurst index ( H ) analysis indicates that climate change will continue the current trends.
|
| [33] |
Research on climatic change of Qaidam Basin since 1961. https://doi.org/10.3321/j.issn:1000-694X.2005.01.021 URL [本文引用: 1] 摘要
The observed meteorological data of Qaidam basin in Qinghai province in 1961鈥2002 are analyzed. The result shows that the changing tendency rate of precipitation and surface evaporation as well as annual and seasonal temperature is positive. Especially in last decade, the air temperature rose, the surface evaporation and precipitation increased, these were favorable for the climate developed toward warm and wet. But due to the limited rainfall (daily average rainfall less than 0.3 mm) and its approximation with surface evaporation amount, the overall environment state of Qaidam basin is still under relatively inferior stage viewed from the historical change of meteorological factors and seasonal distribution characteristics.
柴达木盆地40多年来的气候变化研究 .https://doi.org/10.3321/j.issn:1000-694X.2005.01.021 URL [本文引用: 1] 摘要
The observed meteorological data of Qaidam basin in Qinghai province in 1961鈥2002 are analyzed. The result shows that the changing tendency rate of precipitation and surface evaporation as well as annual and seasonal temperature is positive. Especially in last decade, the air temperature rose, the surface evaporation and precipitation increased, these were favorable for the climate developed toward warm and wet. But due to the limited rainfall (daily average rainfall less than 0.3 mm) and its approximation with surface evaporation amount, the overall environment state of Qaidam basin is still under relatively inferior stage viewed from the historical change of meteorological factors and seasonal distribution characteristics.
|
| [34] |
|
| [35] |
|

/
| 〈 |
|
〉 |
