史文娇 , 刘奕婷
, 刘奕婷
SHI Wenjiao, LIU Yiting
收稿日期: 2016-09-26
修回日期: 2016-11-20
网络出版日期: 2017-03-15
版权声明: 2017 《地理学报》编辑部 本文是开放获取期刊文献,在以下情况下可以自由使用:学术研究、学术交流、科研教学等,但不允许用于商业目的.
基金资助:
作者简介:
作者简介:史文娇(1982-), 女, 辽宁葫芦岛人, 博士, 副研究员, 硕士生导师, 中国地理学会会员(S110008514M), 研究方向为全球变化与区域农业。E-mail: shiwj@lreis.ac.cn
展开
摘要
气候对北方农牧交错带界线变迁的定量影响是目前生态脆弱敏感区对气候变化响应领域的研究热点问题。前人已在气候变化对农牧交错带界线的定性影响方面有较为深刻的认识,但仍缺乏在时间和空间上对气候贡献率进行有针对性的定量辨识。本文利用1970年以来长时间序列的国家气象站点数据和土地利用遥感解译数据,分别提取了基于气候要素和土地利用的20世纪70年代、80年代、90年代和21世纪前10年4个时期的北方农牧交错带界线,通过垂直和水平方向变动探测方法(FishNet)和界线变迁方向变动探测方法(DSAS)对气候界线与土地利用界线的时空变化进行探测,定量分析了不同时期气候对农牧交错带界线变迁影响的贡献率。结果表明,气候与土地利用界线空间分布格局及气候贡献率在不同时期、不同区域差异较大,在西北地区变幅最小,东北地区变幅最大。在大兴安岭东南缘农田控制水源涵养生态功能区西北段以及内蒙古高原东南缘农、林、牧业生态—生产功能区西北段,气候与土地利用界线空间耦合关系最为密切,在该地区基于FishNet方法下水平方向上气候贡献率达10.7%~44.4%,垂直方向上达4.7%~55.9%;基于DSAS方法下气候贡献率为1.1%~16.8%。两种方法探测结果大部分趋于一致,但DSAS方法精度高,适用于小范围精确探测;FishNet方法更简单,适用于精度要求不高、快速直观的统计分析。本研究可为北方农牧交错带内农牧业生产适应气候变化、合理开发土地生产潜力、保护农牧交错带区内生态环境提供科学依据和指导。
关键词:
Abstract
The quantitative analysis of the effect of climate change on the fluctuation of farming-pastoral ecotone (FPE) boundary in northern China is a current focus in the field of response to climate change in ecological vulnerable regions. Previous studies have given profound descriptions about the effects of climate change on the boundary shifts of the ecotones qualitatively, but lacked quantitative analysis of the contribution of climate change on both spatial and temporal scales. Here, climate data from national meteorological stations and land use data interpreted from remote sensing images of the farming-pastoral ecotone (FPE) in northern China since 1970 were used to describe boundaries of the FPE based on both climate and land use in the 1970s, 1980s, 1990s and 2000s. Detection in horizontal and vertical directions method (FishNet) and Digital Shoreline Analysis System method (DSAS) were applied to detect the spatial pattern of the FPE boundaries and to examine how much of the boundaries shifts can be explained by climate change in different periods. The results showed that the spatial pattern of the FPE boundaries and contributions of climate varied in different regions and periods. The FPE boundaries moved slightly in the northwest part of the FPE and violently in the northeast part. The shift of climate and land use boundaries in northwest segment of the Greater Hinggan Mountains showed the most highly coupling relationship and the contribution rate of climate change reached 10.7%-44.4% in east-west direction and 4.7%-55.9% in north-south direction based on FishNet method and 1.1%-16.8% based on DSAS method from the 1970s to the 2000s. Most of the detections based on the two methods had consistent results. Moreover, DSAS method was better than FishNet method in overall accuracy and suitable for the precise detection in small range, while FishNet method was more appropriate for intuitive, rapid and low-precision analysis. Our findings highlight the importance of different adaption measures to climate change in the FPE of northern China in different regions and periods.
Keywords:
农牧交错带是农业种植区与草原畜牧区的生态过渡地带[1]。在农牧交错带中,耕地和草地在空间上交错分布,时间上相互重叠[2]。农牧交错带界线对气候变化和人为干扰均较为敏感[3]。中国农牧交错带分布广泛,在北方地区、西南地区、西北地区均有分布,其中北方农牧交错带范围最广、生态问题最为突出,因而气候变化对北方农牧交错带界线变迁的影响得到了气候变化与土地利用变化等领域学者的广泛关注。
已有研究在北方农牧交错带界线划定的基础上,定性分析了其时空格局变化及气候变化对界线变迁的影响,并得出北方农牧交错带地区气候界线与土地利用界线移动趋势相反的结论[4-5]。也有学者发现,北方农牧交错带尤其是东北地区的气候、政策和耕地开垦是一个相互作用的有机整体,它们共同主导了土地利用/土地覆被变化过程,从而引起了农牧交错带界线的变迁[6]。随后,许多学者认识到定性研究的不足,开始定量分析气候和人类活动等不同因素对土地利用格局产生的影响[7]。在研究方法上,主要分为两类:一是模型分析方法,如区域土地利用变化与影响模型(CLUE-S模型)[8]、面向地理过程动态环境模型(Dinamica EGO模型)[9]等模型方法;二是数理统计分析方法,包括Logistic回归分析方法[8]、Pearson相关分析[10]等方法等。其中,模型分析方法是土地利用/土地覆被变化的经典研究方法之一[7],大多数相关研究结合经济模型[11]分析自然、人为因素对农牧交错带地区土地利用变化驱动的贡献程度,并对未来土地利用变化情况进行预测,但模型分析方法存在针对不同地区参数获取困难、计算复杂、精度验证标准不一的问题。数理统计方法计算较为简单,但大多分析某个特定因子如降水、气温等对农牧交错带内土地利用格局变化的驱动情况,少有对气候影响的综合分析,且大多选取整体研究区内指标平均值的时间序列进行分析[8],不能全面、客观地反映实际情况。从研究尺度上来看,主要集中在点[4, 12]、面尺度上[13-14],但在线尺度上尚未提出有效方法对气候变化对农牧交错带界线变迁的贡献程度做出较为清晰、有针对性且定量化的辨识[3-4]。
本文基于对北方农牧交错带气候界线和土地利用界线的刻画,在地理信息系统渔网功能(FishNet)和数字化海岸带界线变动探测方法(DSAS)的基础上[15-16],进一步提出了适用于1 km精细尺度的定量化不同时间阶段和生态功能区的气候变化对农牧交错带界线变迁贡献程度的两种方法,实现了精细尺度的水平、垂直和界线变动方向上的气候界线与土地利用界线变迁程度探测,科学厘定了气候驱动农牧交错带界线变迁的贡献程度。同时,根据两种方法得到的研究结果进行对比,分析两种方法的优缺点及各自适用条件,以期帮助制定和采取适当的土地利用政策和措施,合理开发北方农牧交错区的农业生产潜力,避免气候不适宜区域的农垦活动,对更好地适应气候变化、保护耕地资源和区域生态环境具有重要的现实意义。
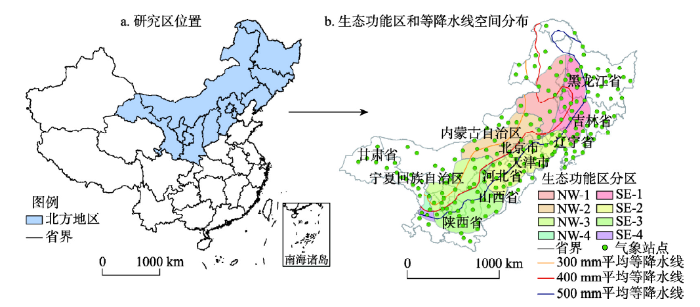
中国北方农牧交错带(34°16′N~48°57′N,102°40′E~126°14′E)位于大兴安岭东南缘、内蒙古高原南缘和黄土高原北部,同时有小部分位于河西走廊地区,包含内蒙古、宁夏、黑龙江、吉林、辽宁、河北、山西、陕西、甘肃等省、自治区的百余个县、市、旗,总面积约61.4万km2。区域内气候属于典型温带半干旱大陆性季风气候,年均温0~10 ℃左右,年降水量300~500 mm,年际降水变化大、蒸发强烈;地形较为复杂,海拔多在1000 m以上;耕地、草地与林地交错分布,西北界紧邻牧区,草地比例较高,东南界靠近农区,耕地比例较高;自西向东植被类型由森林草原带过渡到典型草原带和荒漠草原带,是典型的干草原植被类型;在过去近40年中,东南地区经济发展较快、人口增长迅速,大量土地被开垦,该区域的农牧交错带界线受人为干扰较大。由于北方农牧交错带区域内存在以上自然条件和人为干扰上的差异,为了得到更有针对性的结论,在黄青等[17]对北方农牧交错带内生态功能区划分的基础上,对各区外侧做缓冲区至包含全部北方农牧交错带地区,分别命名为大兴安岭东南缘农田控制水源涵养生态功能(1区)、内蒙古高原东南缘农、林、牧业生态—生产功能区(2区)、黄土高原北部农牧交错水土保持生态功能区(3区)以及河西走廊干旱荒漠绿洲农业生态功能区(4区),并根据20世纪70年代以来400 mm等降水线平均位置的走势将每类生态功能区均划分成西北段(NW)和东南段(SE),划分区域具体情况如表1所示,空间分布如图1所示。
表1 北方农牧交错带地区生态功能区划分
Tab. 1 Ecological function regions in farming-pastoral ecotone of northern China
| 简称 | 生态功能区名称 | 主要生态服务功能 |
|---|---|---|
| NW-1 | 大兴安岭东南缘农田控制水源涵养生态功能区西北段 | 农牧业生产/林果业生产/ 沙漠化控制/生态旅游 |
| SE-1 | 大兴安岭东南缘农田控制水源涵养生态功能区东南段 | |
| NW-2 | 内蒙古高原东南缘农、林、牧业生态—生产功能区西北段 | 农牧业生产/沙漠化控制 |
| SE-2 | 内蒙古高原东南缘农、林、牧业生态—生产功能区东南段 | |
| NW-3 | 黄土高原北部农牧交错水土保持生态功能区西北段 | 水土保持/农林产品生产 |
| SE-3 | 黄土高原北部农牧交错水土保持生态功能区东南段 | |
| NW-4 | 河西走廊干旱荒漠绿洲农业生态功能区西北段 | 沙漠化控制/农业生产 |
| SE-4 | 河西走廊干旱荒漠绿洲农业生态功能区东南段 |
图1 中国北方农牧交错带生态功能区和等降水线空间分布
Fig. 1 The distributions of ecological function regions and isohyets in farming pastoral ecotone of northern China
2.2.1 气象数据 本文气象数据来自北方地区197个国家气象站点(图1)1970-2010年的日值气温和降水数据。其中日值气温数据来源于序列均一性的多元分析方法(MASH)软件包处理得到全国均一化日气温数据集[18],该时间序列数据有效地避免了观测时间、观测仪器等引起的偏差。基于以上数据集,使用ANUSPLIN软件进行气象数据空间插值,得到研究区内空间分辨率为1 km的各类气象指标的栅格数据。
2.2.2 土地利用数据 为了研究北方农牧交错带地区近40年内的土地利用变化情况,本文应用了中国北方地区20世纪70年代、80年代、90年代和21世纪前10年的1 km土地利用百分比栅格数据,数据来源于国家土地利用/土地覆被数据集(NLCD)[19-21]。NLCD数据集使用了Landsat TM/ETM/MSS影像以及CBERS-1、CBERS-2影像解译成果,并将土地利用类型分为6类,即耕地、草地、林地、水体、建设用地和未利用地[22-23]。
2.3.1 基于气候要素与土地利用的北方农牧交错带界线提取 近几十年来,各专家学者基于不同的专业背景提出了多种界定北方农牧交错带范围的指标,但一直以来存在较大的争论和分歧。在以往研究中,北方农牧交错带界线的界定指标主要有两类:一是基于气候要素的指标,二是基于土地利用空间分布比例的指标。
在基于气候要素的界定指标方面,朱震达等[24]使用年降水量300~500 mm界定;赵哈林等[2]使用降水量300~450 mm、降水变化率15%~30%、干燥度1.0~2.0的内蒙古高原南缘和长城沿线界定北方农牧交错带;刘军会等[4]在上述界定范围的基础上以年降水量400 mm等值线为中心、降水年变率15%~30%、干燥度指数0.2~0.5进行界定,并用多年平均降水量300 mm、450 mm等值线修订西北界和东南界。本文在综合前人研究的基础上,采用的基于气候要素的北方农牧交错带界线(气候界线)界定规则为:在刘军会等[4]根据降水年变率15%~30%、干燥度指数0.2~0.5界定范围的基础上,以年降水量400 mm等值线为中心、300 mm等值线为西北界、500 mm等值线为东南界。西北界与东南界未闭合的部分,通过350 mm、400 mm、450 mm降水等值线,从300 mm到500 mm降水等值线平滑过渡连接。为了具有可比性,每一段界线的等值线在不同时间范围内的选取规则一致,完成界线的闭合。根据气候要素指标及界定规则,提取了20世纪70年代、80年代、90年代和21世纪前10年4期气候界线。
在基于土地利用的界定指标方面,Ye等[6]将农业用地比例在15%~35%作为农牧交错带土地利用界线的定义;王静爱等[25]界定范围时使用了农业用地占15%~35%、牧业用地占35%~75%的指标,但主要针对的是以牧业为主的内蒙古地区;吴传钧等[26]对农牧交错带的定义为农、牧、林的比例为1:0.5:1.5。因此,本文基于土地利用的北方农牧交错带界线(土地利用界线)界定规则为:在已有的北方农牧交错带生态分区的范围内,提取土地利用百分比栅格中满足栅格内耕地和草地比重均大于15%的连片区域。根据20世纪70年代末期、80年代末期、2000年和2010年土地利用百分比栅格数据,提取了20世纪70年代、80年代、90年代和21世纪前10年4期土地利用界线。
2.3.2 农牧交错带界线在垂直和水平方向变动的探测方法(FishNet方法) 垂直和水平方向变动探测方法(FishNet方法)是指利用ArcGIS中的渔网(FishNet)功能,对不同年代北方农牧交错带界线在水平(东西)方向和垂直(南北)方向的变动情况分别进行探测。根据所有年代界线的最大地理范围,生成1 km×1 km的渔网,根据生态功能区分区计算每两期土地利用或气候界线在每条水平和竖直方向渔网线上的变动距离,并标记变动方向。水平(垂直)渔网线由东向西(由南向北)依次穿过较早时期的界线、较晚时期的界线时,记Direction为1;水平(垂直)渔网线由东向西(由南向北)依次穿过较晚时期的界线、较早时期的界线时,记Direction为-1;水平(垂直)渔网线由东向西(由南向北)依次穿过同一时期的界线时,Direction为0。根据式(1)计算得到带方向标志的距离:
式中:fp为较早年代;lp为较晚年代;Lfp-lp为统计得到的渔网线的长度;Direction代表标记的方向;Dfp-lp代表带方向标志的距离。根据Lfp-lp可统计气候界线、土地利用界线每两个时期的最大和最小变动距离、变动距离中位数、平均数等参数,根据Dfp-lp可统计气候界线和土地利用界线在不同方向的变动程度及二者的相关性。
2.3.3 农牧交错带界线在变迁方向变动的探测方法(DSAS方法) 农牧交错带界线在变迁方向变动的探测方法(DSAS方法)是根据界线的缓冲区建立基线,沿基线每隔1 km做垂直于基线的等间隔垂线段(transects)与农牧交错带界线相交,根据生态功能区分区分别统计各期界线与每条等间隔垂线段的交点到基线的距离Dp,并根据公式(2)计算每两期土地利用或气候界线在每条等间隔垂线段上的变动距离、变动方向等参数:
式中:Dfp为较早年代界线到基线的距离;Dlp为较晚年代界线到基线的距离;Dfp-lp代表带方向标志的距离。根据Dfp-lp的绝对值统计气候界线和土地利用界线每两个时期的最大和最小变动距离以及变动距离的平均数、中位数等参数,根据Dfp-lp统计气候界线和土地利用界线在不同方向的变动程度及二者的相关性。
2.3.4 气候贡献率计算方法 根据FishNet和DSAS方法探测得到的各生态功能区内、每两个时期的气候和土地利用界线在每条渔网线上或每条等间隔垂线段上带方向的变动距离Dfp-lp,求取气候和土地利用界线两组数据的相关性、决定系数r2以及显著性p。由于决定系数r2可以说明自变量对因变量变化的影响程度,因此本文对呈显著正相关关系(p<0.05,r>0)的气候与土地利用界线移动距离数据,选取决定系数r2指标来定量评价气候驱动作用的贡献程度。
3.1.1 气候界线变迁特征 由图2a、2c和2e可以看出,在水平(东西)方向上,气候界线最大变幅达278.54 km,发生在SE-2区20世纪90年代-21世纪前10年期间,向东移动。从各生态功能区来看,气候界线在1区全区、NW-2区以及SE-3区移动幅度较大,其中在20世纪90年代-21世纪前10年期间,NW-1区与NW-2区界线东移明显,而SE-3区向西大幅移动,移动距离中位数均处于较高水平,分别为91.88 km、78.76 km、72.02 km;相比之下,4区全区范围较小、探测样本少、变迁方向波动频繁且移动幅度最小,变动距离中位数大多小于10 km。从研究区整体上来看,气候界线在研究区东南段与西北段变动幅度差别不明显。
图2 基于FishNet方法探测气候与土地利用界线变迁情况
Fig. 2 Changes of climate and land use boundaries based on FishNet method
由图2b、2d和2f可以看出,垂直(南北)方向上,气候界线最大变动距离达271.25 km,发生在NW-1区20世纪70-80年代期间,向南移动。从各生态功能区来看,气候界线在东南段的移动幅度略大于西北段,且在1区全区、SE-2、SE-3区变幅较大,在NW-4区变幅最小,但有持续向北移动的趋势。由于20世纪80年代东北地区降水量的增加,1区全区、NW-3区、SE-2区在70-80年代期间界线均向南大幅移动,尤其在1区,其西北段和东南段界线变幅中位数分别达到97.28 km、84.93 km;随后的几十年间,随着降水的减少,气候界线逐渐北移。
3.1.2 土地利用界线变迁特征 由图2a、2c和2e可以看出,在水平(东西)方向上,土地利用最大变动距离达140.39 km,发生在SE-2区20世纪70-80年代期间,向东移动。从各生态功能区来看,与气候界线变迁特征类似,1区、2区土地利用界线移动幅度较大,其中NW-1区内界线在20世纪80-90年代期间西移明显,变幅中位数最大达32.34 km;而4区移动幅度较小且变幅中位数均小于7 km,西北段与东南段移动幅度相差不大。
由图2b、2d和2f可以看出,在垂直(南北)方向上,土地利用最大变动距离为149.82 km,发生在NW-2区20世纪70-80年代期间,向北移动。从各生态功能区来看,1区移动幅度较大,其中SE-1区内界线在20世纪90年代-21世纪前10年期间向北大幅变迁,变幅中位数高达46.07 km;2区、3区、4区移动幅度较小,除80-90年代期间NW-4区界线移动中位数为10.82 km外,其余各区域各时期界线移动距离中位数均小于10 km。
3.2.1 气候界线变迁特征 由图3a、3c和3e可见,各个时期、各生态功能区内气候界线发生了较为明显的变动。经过DSAS方法的统计,气候界线的最大变动距离为299.09 km,向南移动,发生在SE-1区20世纪70-80年代期间。从生态功能区来看,气候界线移动特征与FishNet方法下探测结果类似,在1区、2区移动幅度较大,尤其在70-80年代期间,SE-1区内界线变动剧烈,有向西移动的趋势,移动距离中位数高达103.75 km;4区内界线变动幅度最小,除90年代-21世纪前10年期间在NW-4区的界线移动距离中位数为16.71 km,其余移动距离中位数均小于5 km;在研究区东南段变幅略大于西北段。
图3 基于DSAS方法探测气候与土地利用界线变迁情况
Fig. 3 Changes of climate and land use boundaries based on DSAS method
3.2.2 土地利用界线变迁特征 由图3b、3d和3f可见,基于DSAS方法在线尺度上对土地利用界线的变迁距离和变迁方向进行统计,最大变迁距离为217.79 km,向东北方向移动,发生在SE-1区的20世纪90年代-21世纪前10年期间。从各生态功能区上来看,1区各时期土地利用界线变动距离的中位数、平均值均较高,变幅最大,在NW-1区80-90年代期间界线向西北大幅移动,移动距离中位数达28.89 km;与FishNet在垂直方向上的探测结果类似,土地利用界线在2区、3区及4区移动幅度较小,除在NW-4区80-90年代期间移动距离中位数达12.39 km,其余区域在各时期均小于10 km,且界线在东南段的移动幅度与西北段移动幅度差别不大。
基于FishNet方法定量探测的北方农牧交错带界线在不同地区、不同年代受气候的影响贡献程度有明显差别(表2)。
表2 气候变化对北方农牧交错带界线变迁影响的定量探测
Tab. 2 The quantitative detection of climate change effects on the boundary fluctuation in the farming-pastoral ecotone of northern China
| 区域 | 阶段 | X方向 | Y方向 | 界线变迁方向 | |||||
|---|---|---|---|---|---|---|---|---|---|
| 样本数 | r2 | 样本数 | r2 | 样本数 | r2 | ||||
| NW-1 | 20世纪70-80年代 | 261 | 0.444 | - | - | 580 | 0.027 | ||
| 20世纪80-90年代 | 255 | 0.107 | - | - | - | - | |||
| 20世纪90年代-21世纪前10年 | 411 | 0.202 | 331 | 0.047 | 580 | 0.011 | |||
| NW-2 | 20世纪70-80年代 | 473 | 0.209 | 655 | 0.088 | 755 | 0.168 | ||
| 20世纪80-90年代 | - | - | 726 | 0.559 | - | - | |||
| 20世纪90年代-21世纪前10年 | - | - | 697 | 0.104 | 755 | 0.043 | |||
| NW-3 | 20世纪70-80年代 | - | - | - | - | - | - | ||
| 20世纪80-90年代 | - | - | 457 | 0.082 | 612 | 0.043 | |||
| 20世纪90年代-21世纪前10年 | - | - | - | - | - | - | |||
| NW-4 | 20世纪70-80年代 | - | - | 77 | 0.052 | 73 | 0.153 | ||
| 20世纪80-90年代 | - | - | - | - | - | - | |||
| 20世纪90年代-21世纪前10年 | - | - | - | - | - | - | |||
| SE-1 | 20世纪70-80年代 | - | - | - | - | - | - | ||
| 20世纪80-90年代 | - | - | - | - | - | - | |||
| 20世纪90年代-21世纪前10年 | - | - | - | - | 891 | 0.015 | |||
| SE-2 | 20世纪70-80年代 | - | - | - | - | - | - | ||
| 20世纪80-90年代 | 567 | 0.040 | - | - | 985 | 0.032 | |||
| 20世纪90年代-21世纪前10年 | - | — | - | - | - | - | |||
| SE-3 | 20世纪70-80年代 | 357 | 0.201 | 568 | 0.227 | 932 | 0.099 | ||
| 20世纪80-90年代 | - | - | - | - | - | - | |||
| 20世纪90年代-21世纪前10年 | - | - | - | - | 932 | 0.019 | |||
| SE-4 | 20世纪70-80年代 | - | - | - | - | - | - | ||
| 20世纪80-90年代 | - | - | - | - | - | - | |||
| 20世纪90年代-21世纪前10年 | - | - | - | - | - | - | |||
从各生态功能区的角度来看,NW-1区西北段3个时间段的界线变迁在东西方向上均受气候变化显著影响,贡献程度达10.7%~44.4%,但在南北方向上仅在20世纪90年代-21世纪前10年期间,受气候变化影响,贡献率为4.7%。对于2区,西北段在南北方向上3个时期内的界线变迁均受气候变化影响,贡献率达8.8%~55.9%,而在东西方向上仅在20世纪70-80年代期间气候驱动作用显著,贡献率为20.9%;该区东南段气候影响较小,在东西方向上仅80-90年代期间气候驱动界线变化,贡献率为4.0%。NW-3区在80-90年代期间,气候在南北方向上贡献率为8.2%;SE-3区在70-80年代期间气候在东西、南北方向上对界线均有显著影响,贡献率分别为20.1%、22.7%。4区内气候贡献率较低,仅在70-80年代期间,NW-4区内南北方向上气候驱动作用显著,贡献率为5.2%。
从不同时期的角度上来看,20世纪70-80年代时期内,在东西方向上NW-1区、NW-2区以及SE-3区的气候贡献率达20.1%~44.4%;在南北方向上,NW-2区、NW-4区以及SE-3区气候贡献率达5.2%~22.7%。80-90年代时期内,在东西方向上NW-1区和SE-2区的气候贡献率达4.0%~10.7%;在南北方向上,NW-2区以及NW-3区的贡献率达8.2%~55.9%。90年代-21世纪前10年时期内,气候在NW-1区、NW-2区的影响明显,尤其在东西方向上,NW-1区气候贡献率达20.2%;在南北方向上,NW-1区、NW-2区气候贡献率分别为4.7%、10.4%。
经过FishNet方法计算和统计,3个时期中气候在东西方向上最大贡献率为44.4%,发生在NW-1区,20世纪70-80年代期间;南北方向上最大贡献率为55.9%,发生在NW-2区,80-90年代期间。气候贡献率较高的区域主要集中在NW-1区及NW-2区,东西方向气候贡献率达10.7%~44.4%,南北方向上气候贡献率达4.7%~55.9%,说明中国东北地区内各时期农牧交错带界线的移动过程中,气候的驱动作用明显。
基于DSAS方法定量探测的北方农牧交错带界线在不同区域、不同年代气候对土地利用界线变迁的驱动作用与FishNet方法总体上类似,在变动方向和贡献率方面准确度更高(表2)。
从各生态功能区的角度上看,1区与2区受气候影响较大,其中NW-1区的土地利用界线在20世纪70-80年代以及90年代-21世纪前10年两个时期气候贡献率分别为2.7%、1.1%;SE-1区90年代-21世纪前10年期间贡献率为1.5%;NW-2区70-80年代以及90年代-21世纪前10年期间,气候对土地利用界线变迁的贡献率分别为16.8%、4.3%;SE-2区在80-90年代期间,气候贡献率为3.2%。3区与4区受气候影响有限,且在3区内气候对东南段的影响比西北段明显。SE-3区在70-80年代、90年代-21世纪前10年期间气候贡献率分别达到9.9%、1.9%,而NW-3区仅在80-90年代期间气候贡献显著,贡献率为4.3%;NW-4区在70-80年代期间内气候贡献率为15.3%。
从不同时期的角度上来看,20世纪70-80年代时期内,气候对土地利用界线的贡献程度较大,且西北段的气候贡献率2.7%~16.8%,略大于东南段;在80-90年代时期内,气候对土地利用的贡献程度比70-80年代期间小,气候贡献率为3.2%~4.3%;90年代-21世纪前10年时期内,1区全区、NW-2区及SE-3区内的土地利用界线均受气候的影响,气候贡献率达1.1%~4.3%。
经过DSAS方法计算和统计,气候最大贡献率达到16.8%,发生在NW-2区,20世纪70-80年代期间。气候驱动作用明显且贡献率较大的地区是NW-1区、NW-2区、NW-4区和SE-3区,且在70-80年代期间气候对各区域土地利用界线变动的贡献作用更为显著。
3.5.1 与前人研究对比 本文研究结果与前人得出的结论可相互验证。有多位学者的研究[27-29]指出20世纪80年代以来气候变暖促进了东北地区耕地与草地间的转化及耕地的增加,导致中国东北地区的耕地快速扩张,与本文中NW-1区、NW-2区在此阶段气候贡献率显著的结论吻合。Liu等[30]的研究表明,1986-2000年东北地区东南界(与本文SE-1区重叠)受人类活动影响,附近耕地大幅向西扩张;这与本文中SE-1区中前两个时期均未受到气候变化的显著影响的结果一致。Lu等[31]的研究指出,退耕还林和禁牧政策的实施,导致西北段的界线变迁在1999年以后受政策影响明显,这与本文中的NW-3和NW-4区20世纪90年代-21世纪前10年阶段界线变迁受气候变化影响不显著相一致。Zuo等[32]指出在中国西部地区,20世纪80年代以来土地利用变化受人为活动及政策因素主导,与本文中位于西北部的4区全区在80年代以后气候贡献均不显著的结论一致,人为因素[11, 33]也是驱动北方农牧交错带界线变迁的重要因素。
3.5.2 FishNet方法与DSAS方法对比 FishNet方法与DSAS方法在探测北方农牧交错带界线的时空格局变化中得到的结果虽有差异,但大部分趋于一致。两种方法均探测得到气候界线移动幅度大于土地利用界线移动幅度,且界线在1区各时期变迁幅度较大,在4区变迁幅度较小;大部分区域移动距离的平均值、中位数更接近最小值,说明各区域内界线的变迁幅度有限;各区域界线变动方向探测结果大部分相同,如气候界线在2区、3区以及土地利用界线在SE-2、SE-3区各时期内的变迁方向在两种统计方法下所得结果一致。同时,探测结果存在差异,如基于FishNet方法,NW-1区气候界线在20世纪70-80年代期间向西、向南移动,而基于DSAS方法则向西北移动,原因在于FishNet方法分开探测界线在水平、垂直方向上的移动情况,存在无法将某一位置的界线水平和垂直方向上的变化距离对应起来的情况,相比于DSAS探测结果,虽直观明了,但在精确度上有所欠缺。
在气候对北方农牧交错带界线变迁贡献程度方面,可以看出气候对北方农牧交错带的影响在各个区域和各个时期有所差异,但基于FishNet方法与DSAS方法下得出的结论大体趋于一致。如NW-2区20世纪70-80年代期间,FishNet方法下气候在东西、南北方向上的贡献率分别为20.9%、8.8%,DSAS方法下气候贡献率为16.8%;SE-3区70-80年代期间,FishNet方法下气候在水平、垂直方向的贡献率为20.1%、22.7%,DSAS方法下,气候贡献率为9.9%。两种方法的统计结果中也存在差异,如NW-2区80-90年代期间,FishNet方法统计得到气候在南北方向上的贡献率达55.9%,但基于DSAS方法并未明显的表现出较高的贡献率,原因在于该区该时期内东西方向上气候界线与土地利用界线呈显著的负相关关系,又由于DSAS方法中等间隔垂线段的方向基本与界线走势垂直,相比于FishNet方法统计条件要求更高,故基于DSAS方法得出该区域该段时期内气候并未显著的驱动农牧交错带界线的变迁。
综合来看,FishNet方法直观地体现了气候在东西、南北方向上对北方农牧交错带界线的影响和贡献程度,方法简单但不精确,适用于大尺度、精确度要求不高且直观的统计分析;DSAS方法则更精确的给出气候在农牧交错带界线变化方向上的贡献程度,但统计条件要求高,且统计结果受设定的基线影响较大,更适用于小尺度上、精确探测界线的变化。两种方法均受极值影响较大,且分区交界处的不确定性较强。
北方农牧交错带界线变迁是气候和人类活动共同作用的结果,人类活动和政策深刻影响着中国北方地区土地利用格局变化。本文提出了基于FishNet和DSAS的两种在1 km精细尺度上探测不同方向上气候变化对农牧交错带界线变迁贡献程度的定量方法,有助于更好地理解气候变化对脆弱敏感区的定量影响,可为人类更好地适应气候变化提供方法支持。
由于北方农牧交错带跨度大、范围广,研究区自然环境复杂,不同区域和时期内变化趋势有所差异,因而本文在前人的相关研究基础上,根据生态功能区对北方农牧交错带进行了详细的划分,基于FishNet和DSAS两种方法对界线的定量探测得出,气候和土地利用界线在不同时期、不同区域的变迁情况和耦合关系有很大差异。在1区的变动幅度最大,在4区变动幅度最小。在NW-1区、NW-2区,气候和土地利用界线变迁表现出较高的空间耦合关系,该区域基于FishNet方法下水平方向上气候贡献率达10.7%~44.4%,垂直方向上达4.7%~55.9%,基于DSAS方法下气候贡献率为1.1%~16.8%。2区全区在各时期内气候界线与土地利用界线变动方向一致,表现出较高的空间耦合性,气候显著驱动界线变迁;而在20世纪80年代-21世纪前10年期间,4区内气候与土地利用界线的耦合关系较弱,气候并未显著驱动农牧交错带界线的变迁,与前人研究中西北地区土地利用情况受人为活动及政策影响深远的实际情况吻合,说明在北方农牧交错带气候界线与土地利用界线整体移动趋势相反的基础上,存在典型区域气候明显驱动农牧交错带变化。
通过对比两种方法的探测结果,可以看出FishNet方法与DSAS方法所得结论虽有差异,但大多趋于一致。DSAS方法更接近实际情况,总体精度上优于FishNet方法,适用于小尺度上的精确探测;FishNet方法则更为简单,适用于大尺度上快速、直观的统计分析。
The authors have declared that no competing interests exist.
| [1] |
Research progress on the farming-pastoral ecotone in China .
<p>通过分析中国在农牧交错带研究领域公开发表的学术成果,从中透视中国农牧交错带研究关注的重点、研究方法、存在问题和发展趋势。研究表明:1)中国农牧交错带的研究主要集中在自然条件、土地利用与景观、生态系统、产业经济与区域发展等领域;2)地理信息系统、遥感、卫星定位系统和模型分析等逐渐成为农牧交错带研究的重要方法;3)基于多学科综合的交叉研究、多尺度研究和时空综合研究及现代信息技术平台的应用等是今后农牧交错带研究的发展趋势。</p>
中国农牧交错带研究进展 .
<p>通过分析中国在农牧交错带研究领域公开发表的学术成果,从中透视中国农牧交错带研究关注的重点、研究方法、存在问题和发展趋势。研究表明:1)中国农牧交错带的研究主要集中在自然条件、土地利用与景观、生态系统、产业经济与区域发展等领域;2)地理信息系统、遥感、卫星定位系统和模型分析等逐渐成为农牧交错带研究的重要方法;3)基于多学科综合的交叉研究、多尺度研究和时空综合研究及现代信息技术平台的应用等是今后农牧交错带研究的发展趋势。</p>
|
| [2] |
Boundary line on agro-pasture zigzag zone in North China and its problems on eco-environment .
<p>我国北方农牧交错带主要分布于降水量300~450 mm,干燥度 1~2的内蒙古高原南缘和长城沿线,其东界和南界为黑龙江的龙江、安达,吉林的乾安和长岭,辽宁的康平、阜新,河北的丰宁、淮安,山西的浑源、五寨,陕西神木、榆林,甘肃环县,宁夏同心;其西界和北界为内蒙古的陈巴尔虎旗、乌兰浩特、林西、多伦、托克托、鄂托克和宁夏盐池。行政区划涉及 9省106个旗(县市),总面积654564km<sup>2</sup>。全区耕地总面积804.69万hm<sup>2</sup>,人均占有耕地 0.32hm<sup>2</sup>,农、林、牧用地比例为 1.0∶1.17∶3.67。主要生态问题为:沙漠化急剧发展、可利用土地资源锐减;草地退化、沙化、盐渍化严重,承载力急剧下降;生态环境恶化,自然灾害频繁。其原因除了受自然不利因素影响和现代人为强烈干扰外,还有沙漠化的历史烙印、现代农牧交错带的北移错位和经济地理三大原因。该区的退化生态治理应注意:大部分地区要逐步用榆、柳、松、杏等乡土树种取代高耗水肥的杨树树种,采取以灌木为主的乔灌草结合的带状造林方式,建立类似原生植被的人工疏林草原植被,充分发挥其生态屏障作用。农业应以发展灌溉农业和保护型农业为主攻方向,改变生产经营方式,大力提高生产水平、防止土地沙漠化。</p>
北方农牧交错带的地理界定及其生态问题 .
<p>我国北方农牧交错带主要分布于降水量300~450 mm,干燥度 1~2的内蒙古高原南缘和长城沿线,其东界和南界为黑龙江的龙江、安达,吉林的乾安和长岭,辽宁的康平、阜新,河北的丰宁、淮安,山西的浑源、五寨,陕西神木、榆林,甘肃环县,宁夏同心;其西界和北界为内蒙古的陈巴尔虎旗、乌兰浩特、林西、多伦、托克托、鄂托克和宁夏盐池。行政区划涉及 9省106个旗(县市),总面积654564km<sup>2</sup>。全区耕地总面积804.69万hm<sup>2</sup>,人均占有耕地 0.32hm<sup>2</sup>,农、林、牧用地比例为 1.0∶1.17∶3.67。主要生态问题为:沙漠化急剧发展、可利用土地资源锐减;草地退化、沙化、盐渍化严重,承载力急剧下降;生态环境恶化,自然灾害频繁。其原因除了受自然不利因素影响和现代人为强烈干扰外,还有沙漠化的历史烙印、现代农牧交错带的北移错位和经济地理三大原因。该区的退化生态治理应注意:大部分地区要逐步用榆、柳、松、杏等乡土树种取代高耗水肥的杨树树种,采取以灌木为主的乔灌草结合的带状造林方式,建立类似原生植被的人工疏林草原植被,充分发挥其生态屏障作用。农业应以发展灌溉农业和保护型农业为主攻方向,改变生产经营方式,大力提高生产水平、防止土地沙漠化。</p>
|
| [3] |
Changes of land use and landscape pattern in the boundary change areas in farming-pastoral ecotone of northern China .
交错带是相邻生态系统的边缘交汇带,是陆地生态系统对全球变化和人为干扰响应较为敏感的地段。在全球气候变化和人为干扰的影响下,北方农牧交错带的地理位置和界线不断变迁,界线变迁区的土地利用和景观格局也处于快速的变化之中。该文基于气象和土地利用数据,利用遥感、GIS技术和景观生态学方法,界定了北方农牧交错带及界线变迁区的地理位置,并分析了1986-2000年界线变迁区的土地利用和景观格局时空变化特征。结果显示:(1)北方农牧交错带的西北界、东南界缓冲区土地利用结构变化、不同地类之间的相互转化及土地利用动态度变化存在明显区域差异;(2)西北界、东南界缓冲区景观重心迁移的距离和方向、景观格局变化呈现出不同的特征。
北方农牧交错带界线变迁区的土地利用与景观格局变化 .
交错带是相邻生态系统的边缘交汇带,是陆地生态系统对全球变化和人为干扰响应较为敏感的地段。在全球气候变化和人为干扰的影响下,北方农牧交错带的地理位置和界线不断变迁,界线变迁区的土地利用和景观格局也处于快速的变化之中。该文基于气象和土地利用数据,利用遥感、GIS技术和景观生态学方法,界定了北方农牧交错带及界线变迁区的地理位置,并分析了1986-2000年界线变迁区的土地利用和景观格局时空变化特征。结果显示:(1)北方农牧交错带的西北界、东南界缓冲区土地利用结构变化、不同地类之间的相互转化及土地利用动态度变化存在明显区域差异;(2)西北界、东南界缓冲区景观重心迁移的距离和方向、景观格局变化呈现出不同的特征。
|
| [4] |
Spatial changes of boundary based on land use and climate change in the farming-pastoral ecotone of northern China .
<FONT face=Verdana>基于1961~2005 年中国北方9 省、自治区的218 个气象站点的气象资料及1986 年和2000 年的土地利用数据,从全球气候变化和土地利用变化角度分别界定了北方农牧交错带的地理位置,并分析了其界线变迁特征.结果表明,北方农牧交错带的地理位置还存在一定争议.<BR>交错带整体上已向西北移动.西北界已向北深入到纯牧区,东南界附近也由农牧交错区转成纯农区.气候界线向东南变迁,土地利用界线向西北变迁,两者变迁方向相反.东北段和华北段的界线变迁幅度远大于西北段.</FONT>
基于土地利用和气候变化的北方农牧交错带界线变迁 .
<FONT face=Verdana>基于1961~2005 年中国北方9 省、自治区的218 个气象站点的气象资料及1986 年和2000 年的土地利用数据,从全球气候变化和土地利用变化角度分别界定了北方农牧交错带的地理位置,并分析了其界线变迁特征.结果表明,北方农牧交错带的地理位置还存在一定争议.<BR>交错带整体上已向西北移动.西北界已向北深入到纯牧区,东南界附近也由农牧交错区转成纯农区.气候界线向东南变迁,土地利用界线向西北变迁,两者变迁方向相反.东北段和华北段的界线变迁幅度远大于西北段.</FONT>
|
| [5] |
The impact of climate change on boundary shift of farming pasture ecotone in northern China .
北方农牧交错带地理位置特殊,脆弱性、敏感性是其主要特点。气候变化背景下我国北方农牧交错带范围也发生了相应变化。文中参考已有的界限指标,结合北方农牧交错带及其周边地区(11个省、自治区及直辖市)208个站点1961-2010年的降水资料,确定新的界限指标划定北方农牧交错带的边界,并讨论其界限移动情况。经分析,北方农牧交错带大部分地区降水量呈减少趋势,气候变化对东部降水量影响较为明显,农牧交错带范围向东南方向移动,且南界移动幅度大于北界;北部西界向西移动约2个经度;同时我国北方农牧交错带范围增加约3.5×10⁴Km2,这一变化趋势与实际土地利用模式下农牧交错带移动情况相反,因此当前农牧交错带地区的土地利用方式不利于该地区生态环境的可持续发展,使该地区生态环境问题更加严重。
气候变化对我国北方农牧交错带空间位移的影响 .
北方农牧交错带地理位置特殊,脆弱性、敏感性是其主要特点。气候变化背景下我国北方农牧交错带范围也发生了相应变化。文中参考已有的界限指标,结合北方农牧交错带及其周边地区(11个省、自治区及直辖市)208个站点1961-2010年的降水资料,确定新的界限指标划定北方农牧交错带的边界,并讨论其界限移动情况。经分析,北方农牧交错带大部分地区降水量呈减少趋势,气候变化对东部降水量影响较为明显,农牧交错带范围向东南方向移动,且南界移动幅度大于北界;北部西界向西移动约2个经度;同时我国北方农牧交错带范围增加约3.5×10⁴Km2,这一变化趋势与实际土地利用模式下农牧交错带移动情况相反,因此当前农牧交错带地区的土地利用方式不利于该地区生态环境的可持续发展,使该地区生态环境问题更加严重。
|
| [6] |
Expansion of cropland area and formation of the eastern farming-pastoral ecotone in northern China during the twentieth century .https://doi.org/10.1007/s10113-012-0306-5 Magsci [本文引用: 2] 摘要
Land cover changes induced by historical cultivation in ecologically fragile areas involving important issues such as environmental change, ecology, and human sustainability are particularly worthy of attention. This paper reconstructs the spatial distribution of cultivated areas at the county level in the eastern farming-pastoral ecotone of northern China for four time periods during the twentieth century. The paper also analyzes how the location of cultivation ratio contours of 15 and 30 %, representing the boundaries of agricultural areas, have moved and the formation process of farming-pastoral ecotone patterns during this period. The study concludes that the area and ratio of cultivated land fluctuations increased during the twentieth century. The boundaries of the cultivation ratio contours of 15 and 30 % continually moved west and north. Moving north took priority over the other directions during the period of 1916-1940, when its center moved the farthest during the twentieth century, and the boundaries primarily moved westward during 1940-1980 and northwestward during 1980-2000. The distance, direction, and extent of the movement of the cultivation boundaries are all related to agricultural area expansion processes during this period, finally resulting in the creation of the modern farming-pastoral ecotone pattern.
|
| [7] |
Identifying contributions of climate change and human activities to cropland spatial-temporal changes: A review .https://doi.org/10.11821/dlxb201509009 Magsci [本文引用: 2] 摘要
<p>定量辨识气候变化和人类活动对耕地格局变化的贡献归因,是当今气候变化和土地利用变化领域的热点问题。目前研究大都结合耕地的时空变化格局和相关驱动因素进行双变量或多变量的定性分析,未进一步定量给出气候变化和人类活动的贡献程度。本文对国内外相关研究进行总结,介绍了定量评价气候变化和人类活动对耕地格局变化的贡献程度的5种主要研究方法,即模型分析法、数理统计法、框架分析法、指标评价法和差值比较法。综述了气候变化、人类活动以及两者共同作用对耕地格局变化的贡献归因的主要结论。总结了目前研究存在的方法综合性较差、数据全面性与准确性欠缺、尺度单一和解释片面等问题,针对以上问题,提出了从综合作用到具体因素的贡献程度归因评价的思路,并就数据、尺度与驱动力的解释问题提出了研究展望。</p>
气候变化和人类活动对耕地格局变化的贡献归因综述 .https://doi.org/10.11821/dlxb201509009 Magsci [本文引用: 2] 摘要
<p>定量辨识气候变化和人类活动对耕地格局变化的贡献归因,是当今气候变化和土地利用变化领域的热点问题。目前研究大都结合耕地的时空变化格局和相关驱动因素进行双变量或多变量的定性分析,未进一步定量给出气候变化和人类活动的贡献程度。本文对国内外相关研究进行总结,介绍了定量评价气候变化和人类活动对耕地格局变化的贡献程度的5种主要研究方法,即模型分析法、数理统计法、框架分析法、指标评价法和差值比较法。综述了气候变化、人类活动以及两者共同作用对耕地格局变化的贡献归因的主要结论。总结了目前研究存在的方法综合性较差、数据全面性与准确性欠缺、尺度单一和解释片面等问题,针对以上问题,提出了从综合作用到具体因素的贡献程度归因评价的思路,并就数据、尺度与驱动力的解释问题提出了研究展望。</p>
|
| [8] |
Land use change in China and analysis of its driving forces using CLUE-S and Dinamica EGO model .https://doi.org/10.3969/j.issn.1002-6819.2012.16.033 URL Magsci [本文引用: 3] 摘要
为了探究中国土地利用变化驱动机制和未来土地利用状况,该文利用中国科学院资源环境科学数据库中的2000年和2005年土地利用数据,结合区域土地利用变化与影响模型CLUE-S (the conversion of land use and its effects at small regional extent)和面向地理过程动态环境模型Dinamica EGO(environment for geoprocessing objects)模拟2000-2020年中国土地利用状况,并借助于Logistic回归结果和贝叶斯估计结果,探讨了中国2000-2005年土地利用适宜性和土地利用变化的驱动力空间特征.以2005年土地利用数据对模拟结果进行验证表明,CLUE-S模型和Dinamica EGO模型在LUCC预测上与实际结果一致性较好,并且CLUE-S模型在预测总体精度上优于Dinamica EGO模型.但在土地利用变化类型的数量预测上,Dinamica EGO模型的Markov过程可以准确预测,并且Dinamica EGO模拟的土地利用变化在空间分布上与经验结果较一致.从2020年中国土地利用预测结果来看,耕地、林地、水域和建设用地将会增加,草地会出现大面积的缩减,未利用地在CLUE-S模型预测中出现增加,而在Dinamica EGO模型中减少.该文可为国土资源规划和耕地资源保护政策的制定提供科学依据.
基于CLUE-S和Dinamica EGO模型的土地利用变化及驱动力分析 .https://doi.org/10.3969/j.issn.1002-6819.2012.16.033 URL Magsci [本文引用: 3] 摘要
为了探究中国土地利用变化驱动机制和未来土地利用状况,该文利用中国科学院资源环境科学数据库中的2000年和2005年土地利用数据,结合区域土地利用变化与影响模型CLUE-S (the conversion of land use and its effects at small regional extent)和面向地理过程动态环境模型Dinamica EGO(environment for geoprocessing objects)模拟2000-2020年中国土地利用状况,并借助于Logistic回归结果和贝叶斯估计结果,探讨了中国2000-2005年土地利用适宜性和土地利用变化的驱动力空间特征.以2005年土地利用数据对模拟结果进行验证表明,CLUE-S模型和Dinamica EGO模型在LUCC预测上与实际结果一致性较好,并且CLUE-S模型在预测总体精度上优于Dinamica EGO模型.但在土地利用变化类型的数量预测上,Dinamica EGO模型的Markov过程可以准确预测,并且Dinamica EGO模拟的土地利用变化在空间分布上与经验结果较一致.从2020年中国土地利用预测结果来看,耕地、林地、水域和建设用地将会增加,草地会出现大面积的缩减,未利用地在CLUE-S模型预测中出现增加,而在Dinamica EGO模型中减少.该文可为国土资源规划和耕地资源保护政策的制定提供科学依据.
|
| [9] |
Scale-effect analysis of LUCC driving forces in the farming-pasturing interlocked area in northern China .https://doi.org/10.3969/j.issn.1672-0504.2004.03.015 URL [本文引用: 1] 摘要
"可塑性面积单元问题"是对面积数据进行空间统计分析时不可回避的问题。该文以我国北方农牧交错带土地利用变化驱动力研究为契机,探讨了由于"可塑性面积单元问题"的存在而导致的土地利用变化驱动力研究中的尺度效应问题。通过构建土地利用变化驱动力模型,探究了20世纪80年代以来我国北方农牧交错带土地利用变化的驱动机制。研究表明,反映驱动因子与土地利用变化(耕地扩张与草地收缩)关系的ExponentBeta系数随研究尺度的变化而发生显著变化,反映了在研究土地利用驱动力时进行多尺度分析的必要性。
中国北方农牧交错带土地利用变化驱动力的尺度效应分析 .https://doi.org/10.3969/j.issn.1672-0504.2004.03.015 URL [本文引用: 1] 摘要
"可塑性面积单元问题"是对面积数据进行空间统计分析时不可回避的问题。该文以我国北方农牧交错带土地利用变化驱动力研究为契机,探讨了由于"可塑性面积单元问题"的存在而导致的土地利用变化驱动力研究中的尺度效应问题。通过构建土地利用变化驱动力模型,探究了20世纪80年代以来我国北方农牧交错带土地利用变化的驱动机制。研究表明,反映驱动因子与土地利用变化(耕地扩张与草地收缩)关系的ExponentBeta系数随研究尺度的变化而发生显著变化,反映了在研究土地利用驱动力时进行多尺度分析的必要性。
|
| [10] |
Responses of vegetation to change of meteorological factors in agricultural-pastoral area of northern China .https://doi.org/10.6041/j.issn.1000-1298.2015.11.048 URL [本文引用: 1] 摘要
研究了2001—2013年我国北方农牧交错带内表征植被生态特征的归一化差值植被指数(NDVI)、总初级生产力(GPP)时空变化规律,分析了研究区该时间段内的温度、降水量变化特征,利用Pearson相关系数法分析了不同植被类型对气象因子的响应规律。结果显示:研究区内生长季的植被生态状况与温度呈负相关、与降水量呈正相关;非生长季的植被生态状况则相反,其生态状况与温度呈正相关、与降水量呈负相关。这是因为生长季温度高于最适温度会抑制增长,而干旱地带的降水会促进植被生长;而非生长季气温较低,温度的增加会对植被有明显的促进作用,而降水量并不是影响植被生态状况的主要因素,植被对其响应也并不明显。
北方农牧交错带植被对气象因子变化的响应规律研究 .https://doi.org/10.6041/j.issn.1000-1298.2015.11.048 URL [本文引用: 1] 摘要
研究了2001—2013年我国北方农牧交错带内表征植被生态特征的归一化差值植被指数(NDVI)、总初级生产力(GPP)时空变化规律,分析了研究区该时间段内的温度、降水量变化特征,利用Pearson相关系数法分析了不同植被类型对气象因子的响应规律。结果显示:研究区内生长季的植被生态状况与温度呈负相关、与降水量呈正相关;非生长季的植被生态状况则相反,其生态状况与温度呈正相关、与降水量呈负相关。这是因为生长季温度高于最适温度会抑制增长,而干旱地带的降水会促进植被生长;而非生长季气温较低,温度的增加会对植被有明显的促进作用,而降水量并不是影响植被生态状况的主要因素,植被对其响应也并不明显。
|
| [11] |
Spatiotemporal changes of farming-pastoral ecotone in northern China, 1954-2005: A case study in Zhenlai County, Jilin Province .
Analyzing spatiotemporal changes in land use and land cover could provide basic information for appropriate decision-making and thereby plays an essential role in promoting the sustainable use of land resources, especially in ecologically fragile regions. In this paper, a case study was taken in Zhenlai County, which is a part of the farming-pastoral ecotone of Northern China. This study integrated methods of bitemporal change detection and temporal trajectory analysis to trace the paths of land cover change for every location in the study area from 1954 to 2005, using published land cover data based on topographic and environmental background maps and also remotely sensed images including Landsat MSS (Multispectral Scanner) and TM (Thematic Mapper). Meanwhile, the Lorenz curve and Gini coefficient derived from economic models were also used to study the land use structure changes to gain a better understanding of human impact on this fragile ecosystem. Results of bitemporal change detection showed that the most common land cover transition in the study area was an expansion of arable land at the expense of grassland and wetland. Plenty of grassland was converted to other unused land, indicating serious environmental degradation in Zhenlai County during the past decades. Trajectory analysis of land use and land cover change demonstrated that settlement, arable land, and water bodies were relatively stable in terms of coverage and spatial distribution, while grassland, wetland, and forest land had weak stability. Natural forces were still dominating the environmental processes of the study area, while human-induced changes also played an important role in environmental change. In addition, different types of land use displayed different concentration trends and had large changes during the study period. Arable land was the most decentralized, whereas forest land was the most concentrated. The above results not only revealed notable spatiotemporal features of land use and land cover change in the time series, but also confirmed the applicability and effectiveness of the methodology in our research, which combined bitemporal change detection, temporal trajectory analysis, and a Lorenz curve/Gini coefficient in analyzing spatiotemporal changes in land use and land cover.
|
| [12] |
The LUCC responses to climate changes in China from 1980 to 2000 .https://doi.org/10.3321/j.issn:0375-5444.2006.08.009 URL [本文引用: 1] 摘要
基于中国1980~2000年气候数据及两期土地利用/土地覆盖(LUCC)数据.利用Holdfidge植被生态分区模型、重心模型及土地利用程度模型,分析气候变化及人类活动对中国植被覆盖及土地利用的影响程度及变化趋势。1980~2000年间.中国大部分地区温度升高.降水增多。气候变化不仅影响了中国植被群落分区.更进一步影响了植被群落的生长状况:东北、华北、内蒙古高原等区域未利用土地型向草地和灌木生态类型转换,草地和灌木型生态类型向林地和耕地型转换:又因为1980~2000年间中国经济的发展.东部沿海区域城市乡村建设用地及交通用地的增多.使土地利用类型由农业耕地型向建设用地型发展,导致土地利用程度指数的升高。气候变化及经济发展的双重作用.导致中国土地利用程度重心20年来向东北方向移动了54km.东西方向土地利用程度偏移强度,气候占81%,人类活动占19%,南北方向土地利用程度偏移强度.气候占85%.人类活动占15%。
1980-2000年中国LUCC对气候变化的响应 .https://doi.org/10.3321/j.issn:0375-5444.2006.08.009 URL [本文引用: 1] 摘要
基于中国1980~2000年气候数据及两期土地利用/土地覆盖(LUCC)数据.利用Holdfidge植被生态分区模型、重心模型及土地利用程度模型,分析气候变化及人类活动对中国植被覆盖及土地利用的影响程度及变化趋势。1980~2000年间.中国大部分地区温度升高.降水增多。气候变化不仅影响了中国植被群落分区.更进一步影响了植被群落的生长状况:东北、华北、内蒙古高原等区域未利用土地型向草地和灌木生态类型转换,草地和灌木型生态类型向林地和耕地型转换:又因为1980~2000年间中国经济的发展.东部沿海区域城市乡村建设用地及交通用地的增多.使土地利用类型由农业耕地型向建设用地型发展,导致土地利用程度指数的升高。气候变化及经济发展的双重作用.导致中国土地利用程度重心20年来向东北方向移动了54km.东西方向土地利用程度偏移强度,气候占81%,人类活动占19%,南北方向土地利用程度偏移强度.气候占85%.人类活动占15%。
|
| [13] |
Boundary shift of potential suitable agricultural area in farming-grazing transitional zone in northeastern China under background of climate change during 20th century .https://doi.org/10.1007/s11769-013-0638-1 URL [本文引用: 1] 摘要
ABSTRACT Climate change affected the agricultural expansion and the formation of farming-grazing transitional patterns during historical periods. This study analyzed the possible range of the boundary shift of the potential suitable agriculture area in the farming-grazing transitional zone in the northeastern China during the 20th century. Based on modern weather data, 1 km-resolution land cover data, historical climatic time series, and estimation by using similar historical climatic scenes, the following was concluded: 1) The climate conditions of suitable agriculture areas in the farming-grazing transitional zone in the northeastern China between 1971 and 2000 required an average annual temperature above 1°C or ≥ 0°C accumulated temperature above 2500°C–2700°C, and annual precipitation above 350 mm. 2) The northern boundary of the potential suitable agriculture area during the relatively warmer period of 1890–1910 was approximately located at the position of the 1961–2000 area. The northern boundary shifted back to the south by 75 km on average during the colder period of the earlier 20th century, whereas during the modern warm period of the 1990s, the area shifted north by 100 km on average. 3) The western and eastern boundaries of the suitable agriculture area during the heaviest drought periods between 1920s and 1930s had shifted northeast by 250 km and 125 km, respectively, contrasting to the boundaries of 1951–2008. For the wettest period, that is, the 1890s to the 1910s, the shift of western and eastern boundaries was to the southwest by 125 km and 200 km, respectively, compared with that in the 1951–2008 period. This study serves as a reference for identifying a climatically sensitive area and planning future land use and agricultural production in the study area.
|
| [14] |
Has climate change driven spatio-temporal changes of cropland in northern China since the 1970s? https://doi.org/10.1007/s10584-014-1088-1 URL [本文引用: 1] 摘要
Improving the understanding of cropland change and its driving factors is a current focus for policy decision-makers in China. The datasets of cropland and cropland changes from the 1970s to the 2000s were used to explore whether climate change has produced spatio-temporal changes to cropland in northern China since the 1970s. Two representative indicators of heat and water resources, which are important determinants of crop growth and productivity, were considered to track climate change, including active accumulated temperatures 10 C (AAT10) and the standardized precipitation evapotranspiration index (SPEI). Our results showed that rapid cropland change has occurred in northern China since the 1970s, and the area of cropland reclamation (10.23 million ha) was much greater than that of abandoned cropland (2.94 million ha). In the 2000s, the area of cropland with AAT10 higher than 3,000 Cd increased, while the area of cropland with an SPEI greater than 0.25 decreased compared to the 1970s, 1980s and 1990s. It appears that climate warming has provided thermal conditions that have aided rapid cropland reclamation in northern China since the 1970s, and drier climatic conditions did not become a limiting factor for cropland reclamation, especially from the 1990s to the 2000s. Approximately 70 % of cropland reclamation areas were located in warmer but drier regions from the 1990s to the 2000s, and approximately 40 % of cropland abandonment occurred in warmer and wetter conditions that were suitable for agriculture during the periods from the 1970s to the 1980s and the 1990s to the 2000s. Our results suggest that climate change can be considered a driving factor of cropland change in the past several decades in northern China, in addition to socioeconomic factors. 2014 Springer Science+Business Media Dordrecht.
|
| [15] |
Remote detection of shoreline changes in eastern bank of Laizhou Bay, North China .https://doi.org/10.1007/s12524-014-0361-0 URL [本文引用: 1] 摘要
Sandy beaches of the eastern coast zone in Eastern Laizhou Bay represent the most popular tourist, recreational destinations and constitute some of the most valuable restates in China. This paper presents the detection of shoreline changes in Laizhou Bay East Bank using an automatic histogram thresholding algorithm on the basis of multi-temporal Landsat images. Shoreline change rates (SCR) and shoreline change areas (SCA) were retrieved using the statistical approach and zonal change detection method, respectively. Results showed that during 1979-2010 a large portion (over 59.8 %) of shoreline are dominated by a retreating process with an average rate of -2.01 m/year, while other parts of shoreline exhibited a seaward advancing trend due to intense land reclamation activities. It is our anticipation that the result of this work would support sandy beaches protection and management in China coast.
|
| [16] |
Medium resolution satellite imagery as a tool for monitoring shoreline change: Case study of the Eastern coast of Ghana .https://doi.org/10.2112/SI65-087.1 URL [本文引用: 1] 摘要
Shoreline change analysis provides important information upon which most coastal zone management and intervention policies rely. Such information is however mostly scarce for large and inaccessible shorelines largely due to expensive field work. This study investigated the potential of medium resolution satellite imagery for mapping shoreline positions and for estimating historic rate of change. Both manual and semi-automatic shoreline extraction methods for multi-spectral satellite imageries were explored. Five shoreline positions were extracted for 1986, 1991, 2001, 2007 and 2011 covering a medium term of 25 years period. Rates of change statistics were calculated using the End Point Rate and Weighted Linear Regression methods. Approximately 283 transects were cast at simple right angles along the entire coast at 200m interval. Uncertainties were quantified for the shorelines ranging from 4.1m to 5.5m. The results show that the Keta shoreline is a highly dynamic feature with average rate of erosion estimated to be about 2m/year 0.44m. Individual rates along some transect reach as high as 16m/year near the estuary and on the east of the Keta Sea Defence site. The study confirms earlier rates of erosion calculated for the area and also reveals the influence of the Keta Sea Defence Project on erosion along the eastern coast of Ghana. The research shows that shoreline change can be estimated using medium resolution satellite imagery. Coastal Education & Research Foundation 2013.
|
| [17] |
Ecosystem-service-based regionalization of the grassland and agro-pastoral transition zone in northern China .
以北方草地和农牧交错带草地类型区域分异为基础,重点考虑不同草 地类型的生态系统服务功能,在综合分析了北方草地和农牧交错带生态环境基本特征的基础上,确定了草地生态功能区划的原则、依据、方法及命名,然后 在"3S"技术的支持下,将北方草地和农牧交错带分为北方草原区、北方荒漠区和农牧交错区3个一级区及10个二级区,对各个功能区的区域范围、主要生态环 境问题、主要的生态服务功能及为了功能区的保护与可持续发展而需要采取的措施都进行了详细论述.区划结果对认识北方草地与农牧交错带不同草地类型生态系统 服务功能的重要价值,对草地资源的合理利用和农业生产的合理布局、对生态环境保护与建设规划及对维护区域生态安全、实现区域的可持续发展都具有重大意义.
基于生态系统服务功能的中国北方草地及农牧交错带区划 .
以北方草地和农牧交错带草地类型区域分异为基础,重点考虑不同草 地类型的生态系统服务功能,在综合分析了北方草地和农牧交错带生态环境基本特征的基础上,确定了草地生态功能区划的原则、依据、方法及命名,然后 在"3S"技术的支持下,将北方草地和农牧交错带分为北方草原区、北方荒漠区和农牧交错区3个一级区及10个二级区,对各个功能区的区域范围、主要生态环 境问题、主要的生态服务功能及为了功能区的保护与可持续发展而需要采取的措施都进行了详细论述.区划结果对认识北方草地与农牧交错带不同草地类型生态系统 服务功能的重要价值,对草地资源的合理利用和农业生产的合理布局、对生态环境保护与建设规划及对维护区域生态安全、实现区域的可持续发展都具有重大意义.
|
| [18] |
Homogenized daily mean/maximum/minimum temperature series for China from 1960-2008 .https://doi.org/10.1080/16742834.2009.11446802 URL [本文引用: 1] 摘要
在每日的 mean/maximum/ 最小温度的不同类(T m /T 最大 /T 在在中国的 549 个国家标准车站(NSS ) 的从 19602008 的 min ) 系列被为 Homogenization 使用系列的多重分析分析(搅碎) 软件包裹。在数据集的典型偏爱经由北京(BJ ) 的盒子被说明, Wutaishan (WT ) , ???? 湡 ? 桴 ? 牰摥捩整 ? 捡畣畭慬整 ? 牰 ' 虨宫摤嫕?癯牥㈠祝 ? 慊畮牡 ? 慣? 楤晦牥戠 ? 木 ?? 潴 ?? ‰浭漠敶 ? 牁慥?? 湡 ?? 楷桴氠牡敧 ??敤潰楳楴 吗?
|
| [19] |
Study on spatial pattern of land-use change in China during 1995-2000 .https://doi.org/10.1360/03yd9033 URL [本文引用: 1] 摘要
Abstract It is more and more acknowledged that land-use/cover dynamic change has become a key subject urgently to be dealt with in the study of global environmental change. Supported by the Landsat TM digital images, spatial patterns and temporal variation of land-use change during 1995 -2000 are studied in the paper. According to the land-use dynamic degree model, supported by the 1km GRID data of land-use change and the comprehensive characters of physical, economic and social features, a dynamic regionalization of land-use change is designed to disclose the spatial pattern of land-use change processes. Generally speaking, in the traditional agricultural zones, e.g., Huang-Huai-Hai Plains, Yangtze River Delta and Sichuan Basin, the built-up and residential areas occupy a great proportion of arable land, and in the interlock area of farming and pasturing of northern China and the oases agricultural zones, the reclamation of arable land is conspicuously driven by changes of production conditions, economic benefits and climatic conditions. The implementation of eturning arable land into woodland or grassland policies has won initial success in some areas, but it is too early to say that the trend of deforestation has been effectively reversed across China. In this paper, the division of dynamic regionalization of land-use change is designed, for the sake of revealing the temporal and spatial features of land-use change and laying the foundation for the study of regional scale land-use changes. Moreover, an integrated study, including studies of spatial pattern and temporal process of land-use change, is carried out in this paper, which is an interesting try on the comparative studies of spatial pattern on change process and the change process of spatial pattern of land-use change.
|
| [20] |
Spatial and temporal patterns of China's cropland during 1990-2000: An analysis based on Landsat TM data .https://doi.org/10.1016/j.rse.2005.08.012 URL 摘要
There are large discrepancies among estimates of the cropland area in China due to the lack of reliable data. In this study, we used Landsat TM/ETM data at a spatial resolution of 30 m to reconstruct spatial and temporal patterns of cropland across China for the time period of 1990-2000. Our estimate has indicated that total cropland area in China in 2000 was 141.1 million hectares (ha), including 35.6 million ha paddy land and 105.5 million ha dry farming land. The distribution of cropland is uneven across the regions of China. The North-East region of China shows more cropland area per capita than the South-East and North regions of China. During 1990-2000, cropland increased by 2.79 million ha, including 0.25 million ha of paddy land and 2.53 million ha of dry farming land. The North-East and North-West regions of China gained cropland area, while the North and South-East regions showed a loss of cropland area. Urbanization accounted for more than half of the transformation from cropland to other land uses, and the increase in cropland was primarily due to reclamation of grassland and deforestation. Most of the lost cropland had good quality with high productivity, but most gained cropland was poor quality land with less suitability for crop production. The globalization as well as changing environment in China is affecting land-use change. Coordinating the conflict between environmental conservation and land demands for food will continue to be a primary challenge for China in the future. 2005 Elsevier Inc. All rights reserved.
|
| [21] |
Spatial patterns and driving forces of land use change in China during the early 21st century .https://doi.org/10.1007/s11442-010-0483-4 URL [本文引用: 1] 摘要
Land use and land cover change as the core of coupled human-environment systems has become a potential field of land change science (LCS) in the study of global environmental change. Based on remotely sensed data of land use change with a spatial resolution of 1 km × 1 km on national scale among every 5 years, this paper designed a new dynamic regionalization according to the comprehensive characteristics of land use change including regional differentiation, physical, economic, and macro-policy factors as well. Spatial pattern of land use change and its driving forces were investigated in China in the early 21st century. To sum up, land use change pattern of this period was characterized by rapid changes in the whole country. Over the agricultural zones, e.g., Huang-Huai-Hai Plain, the southeast coastal areas and Sichuan Basin, a great proportion of fine arable land were engrossed owing to considerable expansion of the built-up and residential areas, resulting in decrease of paddy land area in southern China. The development of oasis agriculture in Northwest China and the reclamation in Northeast China led to a slight increase in arable land area in northern China. Due to the “Grain for Green” policy, forest area was significantly increased in the middle and western developing regions, where the vegetation coverage was substantially enlarged, likewise. This paper argued the main driving forces as the implementation of the strategy on land use and regional development, such as policies of “Western Development”, “Revitalization of Northeast”, coupled with rapidly economic development during this period.
|
| [22] |
本书系统阐述了构建全国资源环境遥感时空信息平台的理论、方法与技术框架,提炼了20世纪90年代我国土地利用时空过程的区域特征,深入揭示了我国土地利用变化的时空格局,分析了我国土地利用变化的驱动机制,进而揭示了我国区域尺度上土地利用变化规律及其主要驱动因子和控制因子的耦合规律。
本书系统阐述了构建全国资源环境遥感时空信息平台的理论、方法与技术框架,提炼了20世纪90年代我国土地利用时空过程的区域特征,深入揭示了我国土地利用变化的时空格局,分析了我国土地利用变化的驱动机制,进而揭示了我国区域尺度上土地利用变化规律及其主要驱动因子和控制因子的耦合规律。
|
| [23] |
本书介绍了基于遥感和地理信息系统技术连续进行全国中等比例尺土地利用遥感监测的技术方法,根据建设完成的20世纪80年代末、1995年、2000年、2000年、2008年和2010年土地利用状况及其见土地利用动态数据库,以专题图、表格、文字和图像等相结合的方式,分别展现了中国土地利用遥感监测几期数据库的建设、中国土地利用的时空特点、主要土地利用类型的分区差异等,按照类型和区域特点分析了土地利用类型构成、分布、空间差异及其变化。
本书介绍了基于遥感和地理信息系统技术连续进行全国中等比例尺土地利用遥感监测的技术方法,根据建设完成的20世纪80年代末、1995年、2000年、2000年、2008年和2010年土地利用状况及其见土地利用动态数据库,以专题图、表格、文字和图像等相结合的方式,分别展现了中国土地利用遥感监测几期数据库的建设、中国土地利用的时空特点、主要土地利用类型的分区差异等,按照类型和区域特点分析了土地利用类型构成、分布、空间差异及其变化。
|
| [24] |
The possibilities and realities on re-management of desertified lands in the inter-distributing areas for argicultural and graziery practices in northern China .
正 近年来,各种影响经济建设的环境问题开始引起人们的重视,其中沙漠化问题,特别是我国东北的北部,华北及西北的大部分地区,已经成为危害农牧业发展的一个重要问题,所谓沙漠化乃是干旱半干旱地区(包括一部分半湿润地区)土地生产力衰退的环境退化过程,是人类强度活动与环境资源之间的不协调产物。换言之,也即土地强度利用与干旱多风的沙质地表环境相互作用,使脆弱生态平衡发生破坏的结果,从而使地面出现风沙活动的类似沙漠景观。这一过程称之为沙漠化过程。影响所及的土地称为沙漠化土地。风沙活动所表现的特征包括:地表风蚀,粗化,片状流沙及沙丘的形成与发
试论中国北方农牧交错地区沙漠化土地整治的可能性和现实性 .
正 近年来,各种影响经济建设的环境问题开始引起人们的重视,其中沙漠化问题,特别是我国东北的北部,华北及西北的大部分地区,已经成为危害农牧业发展的一个重要问题,所谓沙漠化乃是干旱半干旱地区(包括一部分半湿润地区)土地生产力衰退的环境退化过程,是人类强度活动与环境资源之间的不协调产物。换言之,也即土地强度利用与干旱多风的沙质地表环境相互作用,使脆弱生态平衡发生破坏的结果,从而使地面出现风沙活动的类似沙漠景观。这一过程称之为沙漠化过程。影响所及的土地称为沙漠化土地。风沙活动所表现的特征包括:地表风蚀,粗化,片状流沙及沙丘的形成与发
|
| [25] |
The utilization of land resources and regional development strategies of farming-pastoral zone in Inner Mongilia .
本文根据遥感应用研究的最新成果,提出内蒙古农牧交错带的范围及该带中农牧区和牧农区的分异;从土地资源利用角度讨论了本区发展战略及土地利用分区和各区利用中的主要措施。
论内蒙古农牧交错地带土地资源利用及区域发展战略 .
本文根据遥感应用研究的最新成果,提出内蒙古农牧交错带的范围及该带中农牧区和牧农区的分异;从土地资源利用角度讨论了本区发展战略及土地利用分区和各区利用中的主要措施。
|
| [26] |
|
| [27] |
Migration and reclamation in Northeast China in response to climatic disasters in North China over the past 300 years .https://doi.org/10.1007/s10113-011-0245-6 URL [本文引用: 1] 摘要
Climatic disaster-induced migration and its effects on land exploitation of new settlements is a crucial topic that needs to be researched to better understand the impact of climate change and human adaptation. This paper focuses on the process and mechanism of migrant–reclamation in Northeast China in response to climatic disasters over the past 30002years. The research used comparative analysis of key interlinked factors in this response involving drought/flood events, population, cropland area, farmer revolts, administrations establishment, and land reclamation policies. It draws the following conclusions: (1) seven peaks of migrants–reclamation in Northeast China were evident, most likely when frequent climatic disasters happened in North China, such as the drought–flood in 1851–1859, drought in 1875–1877, and drought 1927–1929; (2) six instances of policy transformation adopted to cope with extreme climatic events, including distinctive examples like changing to a firm policy prohibiting migration in 1740 and a subsequent lifting of that prohibition in 1860; and (3) the fast expansion of the northern agricultural boundary since the middle of the nineteenth century in this area benefited from a climate change trend from a cold period into a warm period. Altogether, over the past 30002years, extreme climatic disasters in North China have deepened the contradiction between the limited land resources and the rapidly increasing population and have resulted in migration and reclamation in Northeast China. Climate, policy, and reclamation constructed an organic chain of response that dominated the land use/cover change process of Northeast China.
|
| [28] |
Land use/cover changes and environmental consequences in Songnen Plain, Northeast China .https://doi.org/10.1007/s11769-009-0299-2 URL 摘要
The Songnen Plain in Northeast China,one of the key national bases of agricultural production,went through remarkable land use/cover changes in recent years.This study aimed to explore the long-term land use/cover changes and the effects of these changes on the environment.The Landsat-based analysis showed that,during 1986-2000,cropland,built-up land and barren land had increased,among which cropland had the largest increase of 9,198km2 with an increase rate of 7.5%.Woodland,grassland,water body and swampland had decreased correspondingly,among which grassland had the most dramatic decrease of 6,127km2 with a decrease rate of 25.6%.The transition matrix results revealed that grassland,woodland and swampland were the three main land use types converted to cropland.Climate warming created the potential environment for the conversion of grassland and swampland into cropland.Land resources policy made by central and provincial governments of China affected the pattern and intensity of land use.Land use/cover changes accompanied by climatic variation brought out a series of environmental consequences,such as sand desertification of land,land salinization and alkalinization,grassland degradation,and more frequent floods.Under this circumstance,optimized land use structure and restoration measures are needed.
|
| [29] |
Land use changes in Northeast China driven by human activities and climatic variation .https://doi.org/10.1007/s11769-009-0225-7 URL [本文引用: 1] 摘要
Abstract Human-induced land use/cover change (LUCC) forms an important component of global environmental change. Therefore, it is important to study land use/cover and its change at local, regional and global scales. In this paper we conducted the study of land use change in Northeast China, one of the most important agricultural zones of the nation. From 1986 to 2000, according to the study results obtained from Landsat images, widespread changes in land use/cover took place in the study area. Grassland, marsh, water body and woodland decreased by 9864, 3973, 1367 and 10,052km2, respectively. By comparison, paddy field, dry farmland, and built-up land expanded by 7339, 17193 and 700km2, respectively. Those changes bore an interactive relationship with the environment, especially climate change. On the one hand, climate warming created a potential environment for grassland and marsh to be changed to farmland as more crops could thrive in the warmer climate, and for dry farmland to paddy field. On the other hand, the changed surface cover modified the local climate. Those changes, in turn, have adversely influenced the local environment by accelerating land degradation. In terms of socio-economic driving forces, population augment, regional economic development, and national and provincial policies were confirmed as main driving factors for land use change.
|
| [30] |
Shifting farming-pastoral ecotone in China under climate and land use changes .https://doi.org/10.1016/j.jaridenv.2010.10.010 URL [本文引用: 1] 摘要
Abstract Meteorological records show a rise in temperature and decrease in precipitation in most parts of the farming–pastoral ecotone of Northern China over the last 50 years. During the last quarter of the 20th Century, the agrarian sector went through a series of reforms and changes in government policies on land use that have led to extensive changes in land cover. The objective of this study was to redefine the location and analyze the boundary variations under the effects of climate and land use changes in the farming–pastoral ecotone of Northern China. The results showed that the location of study area has been redefined as both a climatic ecotone from the perspective of suitability of precipitation and temperature for agricultural crops and vegetation growth, and also a land use ecotone based on the impacts of farmland restructuring by government policies on land use. In recent decades, the climatic boundary has moved southeast while the land use boundary has moved northwest, showing opposing directions of change. The extent of boundary changes in the northeast and northern sections are far greater than in the northwestern section of the farming–pastoral ecotone of Northern China.
|
| [31] |
Fluctuation of farming-pastoral ecotone in association with changing East Asia monsoon climate .https://doi.org/10.1007/s10584-013-0761-0 URL [本文引用: 1] 摘要
As a monsoon climate dominated region, East Asia has a high rate of climate variation. Previous studies demonstrated that the East Asian monsoon had weakened since the end of 1970’s; however, contrary to the climatic trend, a common scenario of advancing farming-pastoral ecotone (FPE) has been proposed. The objective of this study is to analyze land surface changes in association with monsoon climate variability over past 2502years in East Asia. A combination of intensive ground survey of vegetation and land use, meteorological data, and remote sensing are used to quantify the relationship between vegetation and climate and to analyze the FPE fluctuations associated with changing climate. Field precipitation data from 1981 to 2005, are used to represent climate variations and to delineate the FPE boundary. NDVI data are used to evaluate greenness-precipitation linkages by vegetation type and to create land cover maps depicting spatial pattern fluctuations of the FPE. This study demonstrates that: (1) There was no persistent northwest shifting trend of either the FPE boundary or vegetation cover during last 2502years. (2) Time integrated NDVI (TI-NDVI) varies with precipitation, and the maximum or minimum NDVI may be only sensitive to precipitation for areas with mean annual precipitation lower than approximately 20002mm. (3) A significant relationship exists between NDVI and precipitation variations for areas with mean annual precipitation greater than approximately 30002mm, especially the ecotone with a ΔNDVI of 0.12265±650.032. (4) The “advances” of FPE closely mimic fluctuations of precipitation in East Asia.
|
| [32] |
Multitemporal analysis of cropland transition in a climate-sensitive area: A case study of the arid and semiarid region of northwest China .https://doi.org/10.1007/s10113-013-0435-5 URL [本文引用: 1] 摘要
Land-use change is becoming an important anthropogenic force in the global climate system through alteration of the Earth biogeophysical and biogeochemical processes. Cropland, which provides people with food, is the most variable vegetation land-use type and is affected by natural and anthropic forces and in turn affects the environment and climate system. This paper investigates the temporal-spatial pattern of cropland transition in the arid and semiarid region of northwest China, using remote sensing data for the late 1980s, 1995, 2000, 2005, 2008, and 2010. The aim was to clarify the change intensity and conversion pattern of cropland with a view to identifying the effects of a series of governmental policies and their influence on the climate system. Mathematical methodologies including the use of a transition matrix model, dynamic degree model, area-weighted centroid model, and area percentage were employed to analyze the temporal change in cropland. Meanwhile, a gridded zonal model with 10-km
|
| [33] |
Spatiotemporal characteristics, patterns, and causes of land-use changes in China since the late 1980s .https://doi.org/10.1007/s11442-014-1082-6 URL [本文引用: 1] 摘要
Land-use/land-cover changes (LUCCs) have links to both human and nature interactions. China's Land-Use/cover Datasets (CLUDs) were updated regularly at 5-year intervals from the late 1980s to 2010, with standard procedures based on Landsat TMETM+ images. A land-use dynamic regionalization method was proposed to analyze major land-use conversions. The spatiotemporal characteristics, differences, and causes of land-use changes at a national scale were then examined. The main findings are summarized as follows.
|

/
| 〈 |
|
〉 |

