周亮 , 周成虎
, 周成虎
ZHOU Liang, ZHOU Chenghu
通讯作者:
收稿日期: 2016-10-8
修回日期: 2017-07-28
网络出版日期: 2017-11-20
版权声明: 2017 《地理学报》编辑部 本文是开放获取期刊文献,在以下情况下可以自由使用:学术研究、学术交流、科研教学等,但不允许用于商业目的.
基金资助:
作者简介:
作者简介:周亮(1983-), 男, 甘肃天水人, 博士后, 讲师, 中国地理学会会员(S110007587M),主要从事环境经济地理,城市与区域规划研究。E-mail: zhougeo@126.com
展开
摘要
高浓度PM2.5是形成雾霾的主要原因之一,科学识别PM2.5浓度的空间异质性与驱动因素对区域大气联动治理意义重大。研究采用2000-2011年NASA大气遥感影像反演的PM2.5数据,结合地统计、地理探测器及GIS空间分析等方法,系统分析了中国2000-2011年PM2.5浓度时空演化格局特征与其驱动因素。结果表明:① 2000-2011年中国PM2.5污染平均浓度一直保持在22.47~28.26 μg/m3区间,总体呈现先快速增加后趋于稳定的演化态势,2006年是PM2.5浓度值变化的拐点(峰值)。② 空间上PM2.5浓度整体呈现北方高于南方,东部高于西部趋势,污染浓度高值区集中分布在黄淮海平原、长三角下游平原、四川盆地与塔克拉玛干沙漠四大区域,其中京津冀地区污染最为严重。③ 污染浓度重心研究表明PM2.5重心总体呈现快速东移趋势,污染高值区持续向东移动,低值区向西移动,两者重心背向而行,表明东部雾霾污染程度在进一步加剧。④ 空间自相关分析表明PM2.5年均浓度呈现强烈的局部空间正自相关特性,PM2.5“高—高”集聚区连片分布在黄淮海平原、汾渭盆地、四川盆地及江汉平原地区,PM2.5“低—低”集聚区分布在长城以北的内蒙古、黑龙江、青藏高原、以及台湾、海南与福建等东南沿海及岛屿地区。⑤ 地理探测分析表明气候等自然因素与人类活动共同对PM2.5浓度空间变化产生巨大影响,其中自然地理区位、人口密度、汽车数量、工业烟尘、秸秆燃烧等因子是中国PM2.5浓度空间变化的主要驱动因素。
关键词:
Abstract
High concentration of PM2.5 has been universally considered as a main cause for haze formation. Therefore, it is important to identify the spatial heterogeneity and influencing factors of PM2.5 concentration for the purpose of regional air quality control and management. Using PM2.5 data from 2000 to 2011 that is inversed from NASA atmospheric remote sensing images, and employing the methods in geo-statistics, geographic detectors and geo-spatial analysis, this paper reveals the spatio-temporal evolution patterns and driving factors of PM2.5 concentration in China. The main findings are as follows: (1) In general, the average concentration of PM2.5 in China has increased quickly and reached its peak value in the year of 2006; after that, it has been maintained at around 22.47-28.26 μg/m3. (2) PM2.5 is strikingly uneven in China, with a higher concentration in North and East than in South and West, respectively. In particular, the areas with a relatively high concentration of PM2.5 are mainly the four regions including the Huang-Huai-Hai Plain, the Lower Yangtze River Delta Plain, the Sichuan Basin, and the Taklimakan Desert. Among them, Beijing-Tianjin-Hebei Region has the highest concentration of PM2.5. (3) The center of gravity of PM2.5 has shown an overall eastward movement trend, which indicates an increasingly serious haze in eastern China. Particularly, the center of gravity of high-value PM2.5 is kept on moving eastward, while that of the low-value PM2.5 moves westward. (4) The spatial autocorrelation analysis indicates a significantly positive spatial correlation. The "High-High" PM2.5 agglomeration areas include the Huang-Huai-Hai Plain, Fenhe-Weihe River Basin, Sichuan Basin, and Jianghan plain regions. The "Low-Low" PM2.5 agglomeration areas include Inner Mongolia and Heilongjiang to the north of the Great Wall, Qinghai-Tibet Plateau, and Taiwan, Hainan and Fujian and other southeast coastal and island areas. (5) Geographic detection analysis indicates that both natural and human factors account for the spatial variations of PM2.5 concentration. In particular, factors such as natural geographical location, population density, automobile quantity, industrial discharge and straw burning are the main driving forces of PM2.5 concentration in China.
Keywords:
细颗粒物是中国目前面临的最重要的大气污染物,其呈现典型的区域性、复合型污染特征。城市化与工业化的快速发展,能源消费激增,城市化建设造成的扬尘、煤炭燃烧以及汽车尾气排放是导致空气中悬浮细颗粒物飙升主要原因[1-2]。目前中国地缘上形成黄淮海地区、四川盆地、长江三角洲和珠江三角洲四大雾霾区[3-4]。“十一五”与“十二五”期间由于国家相继出台了一系列的环境保护法律、法规与大气防控长效措施,叠加国家产业与能源结构调整升级,SO2、SOx与粉尘明显下降,然而,可吸入大气颗粒物PM2.5(Particulate matter with aerodynamic diameter ≤ 2.5 μm)逐渐演变成为中国大气污染防治的重点与难点[5]。PM2.5在大气边界层内与人类活动关系密切,不但降低大气能见度,参与大气化学反应生成新的污染物,而且严重影响着人体健康[6-9]。医学研究表明PM2.5能进入人体呼吸系统,引起各种呼吸道疾病,心血管疾病,破坏人体免疫系统,可能增加暴露人群的死亡风险[10-13]。中国每年因长期暴露在污染空气中而导致过早死亡的人数超过125万人,约占全球的40%[14]。2013年冬季北京单日PM2.5的极端浓度超过了1000 μg/m3,超过世界卫生组织(WHO)健康标准的40倍[15-16],雾霾对其笼罩的地区造成的损失和群众身心健康的负面影响不可估计。在此环境背景下,2012年中国政府出台了新的环境空气质量标准(GB 3095-2012),首次将PM2.5列为常规关键监测指标,同时,国家空气质量监测条件与范围不断增大,PM2.5浓度监测点由2013年的612个增加至2016的1436个。由此可见,PM2.5将是未来中国大气污染防治的重点,也是国际大气环境研究的热点之一。
目前PM2.5浓度空间估算与空间特征分析主要采用以下数据与方法[17]:利用遥感影像反演大气气溶胶厚度(AOD)估算PM2.5浓度,监测点实时数据空间插值,加权回归模型以及混合模型。研究者基于上述数据源与方法模型,展开对PM2.5的来源解析、成因机理、空间异质性、跨界传输、健康影响以及应对机制等研究,如通过聚类分析与地理时空加权回归(GTWR)模型,构建PM10与PM2.5的时空分布规律与关系[18]。利用卫星反演遥测气溶胶厚度(AOD)表征PM2.5的空间污染格局特征等[19-20]。通过源清单化学质量平衡法(I-CMB)模型[21],化学质量平衡法(CMB)[22],大气扩散模型法[23],建立PM2.5的排放源清单[24-25]。基于光学厚度(Aerosol optical thickness, AOT)数据,并借助线性回归模型、CAMx空气质量模型揭示PM2.5浓度的空间异质特征与跨区域输送规律[26-27]。进一步研究发现PM2.5浓度不仅存在显著的季节性变化,也存在着明显的地理空间异质性和空间依赖性[28-33]。另外,针对成因与驱动力研究揭示出高能耗的经济增长模式和不生态的城镇化模式是中国和一些类似发展中国家PM2.5污染的主要诱因,其中地形、气象、沙尘、交通运输、生物质与煤炭燃烧等因素是影响PM2.5污染空间格局的最关键因子。本文认为大尺度PM2.5的空间异质性主要受全球气候变化、地形地貌、人口密度、土地利用、经济与交通强度的影响[34-37];小尺度PM2.5时空变化受制于监测点位置与城市中心、车站、机场、工厂等污染源的距离[38]。
综上所述,关于PM2.5研究主要集中在来源解析、污染特征与健康评价等方面,已有研究更多针对洛杉矶、伦敦、北京等国际大都市或污染敏感型城市展开,且时间序列较短,空间尺度较小[39],缺乏大尺度、长时间序列系统分析PM2.5时空分布特征规律及驱动因素的研究范例。究其原因:① 大尺度长序列PM2.5污染数据获取困难或尚无连续监测数据,就中国而言,2012年国家大气环境监测系统才将PM2.5的浓度值纳入监测指标体系,此前全国性PM2.5监测处于空白(无公开历史数据);② PM2.5监测体系完整的欧美国家,并未爆发大范围PM2.5污染,污染只是出现在如洛杉矶、伦敦等污染典型城市及邻近区域,呈“孤岛”状,并未形成大面积连片污染影响。2000-2011年是中国城镇化、工业化发展最为迅猛阶段,城镇化率由2000年的36.22%上升到51.72%,年均增长1.41%。因此,本文利用2000-2011年NASA大气环境遥感影像反演的PM2.5年均浓度数据,展开中国PM2.5时空分布及驱动因素探析,可以较为精准、宏观、长时间序列地反映该时段中国颗粒物污染的变化情况,一定程度上补充了2000-2011年中国快速发展时期PM2.5浓度监测的宏观数据缺失问题。研究结果可能对中国未来10~20年能源结构调整、产业布局引导、污染风险规避提供一定依据,也可以解决当前以行政单元为主体、孤立的大气污染防治模式难以有效解决PM2.5跨界污染问题,为跨区域大气污染联动治理提供空间决策参考。
研究数据来源主要分为三个方面:① PM2.5遥感反演浓度数据,本研究采用美国国家航空航天局(NASA)公布的1998-2012年全球大气PM2.5浓度栅格数据作为基础研究数据(http://earthdata.nasa.gov),分辨率为0.1°。卫星遥感反演气溶胶光学厚度(AOD)数据具有成本低、空间覆盖广、模拟精度高等优点,因此被普遍认为是地面PM2.5浓度的重要指标,广泛地应用于地面PM2.5遥感监测。为了保证数据的可靠性与平稳性,原始数据取3年的平均值,以中间年份作为研究数据基础,例如2000年的PM2.5浓度均值是1999年、2000年与2001年的PM2.5浓度均值的求和平均值。② 基础地理信息数据,空间行政边界来源于国家基础地理信息中心提供的1:400万中国基础地理信息数据。本文以中国全域(包括中国大陆及港澳台地区)作为研究区域,再以研究区域矢量界线为掩膜对栅格数据进行提取,并利用市、县级行政区划界线矢量数据,分区统计各市、县级行政单元各年的PM2.5浓度均值,从而建立中国PM2.5浓度值时空数据库。③ 社会经济数据,汽车保有量、人口密度、秸秆燃烧等统计数据,主要来源于相应年份《中国城市统计年鉴》(2000-2012)、《中国城市建设统计年鉴》(2000-2012)、《中国区域统计年鉴》(2000-2012)、《中国农村统计年鉴》(2000-2012)等,部分缺失数据结合相应省市(自治区)、地市数据进行补充。
2.2.1 重力模型 地理学第一定律认为地理事物或属性在空间分布上互为相关,存在集聚(Clustering)、随机(Random)、规则(Regularity)分布,并且相关性随距离增大而减少,该现象称为空间自相关[40]。因此,为了深入分析PM2.5 的时空分布格局与特征,研究首先引入物理学中重心概念与计算方式以揭示PM2.5在空间上的迁移过程,利用重力模型表征PM2.5的空间集聚变化特征。定义中国PM2.5污染重心的X、Y坐标分别为:
式中:
2.2.2 空间自相关分析 本文使用全局Moran's指数(Global Moran's I)检验PM2.5浓度的全局空间自相关性,全局Moran's I指数大于0,表明研究对象呈正空间自相关,其值越大表明PM2.5观测值的空间集聚性越强;全局Moran's I指数小于0,表明PM2.5浓度呈负空间自相关关系,其值越小则表明观测值的空间离散性越强。全局Moran's I指数的计算公式如下:
式中:n为空间单元(本文中为县级行政单元)的数量,xi、yj分别是单元i、j的PM2.5年均浓度值,
式中:
同时利用局部Moran's I指标来挖掘大气PM2.5污染的局部空间自相关性,对空间集聚和空间异质进行识别。对于第i个空间单元,其局部Moran's I指数通过下式进行定义:
式中:局部Moran's I指数的显著性水平同样可以用
2.2.3 地理探测器 地理探测器(GeoDetector, GD)是探测空间分异性,以及揭示其背后驱动力的一组统计学方法,其作为一种探测地理要素空间格局成因和机理的重要方法被逐渐应用于社会经济、生态环境等相关领域研究中[41-43]。该模型中的因子探测器是用来检测某种地理因素是否是形成某个指标值空间分布差异的原因,其具体的做法是比较该指标在不同类别分区上的总方差与该指标在整个研究区域上的总方差,其模型如下:
式中:PD,H为PM2.5驱动因素解释力;D为PM2.5年平均浓度变化的驱动因子;n与σ2分别为研究区域整体样本量与方差;m为某种因子的分类个数;nD,i为D指标在i类上样本的个数。PD,H取值区间为[0, 1],其数值越大则表明该因子对PM2.5浓度的变化解释能力越强,数值为0,表明分类因素与PM2.5浓度变化完全无关;数值为1,说明分类因素可以完全解释PM2.5浓度差异特征。
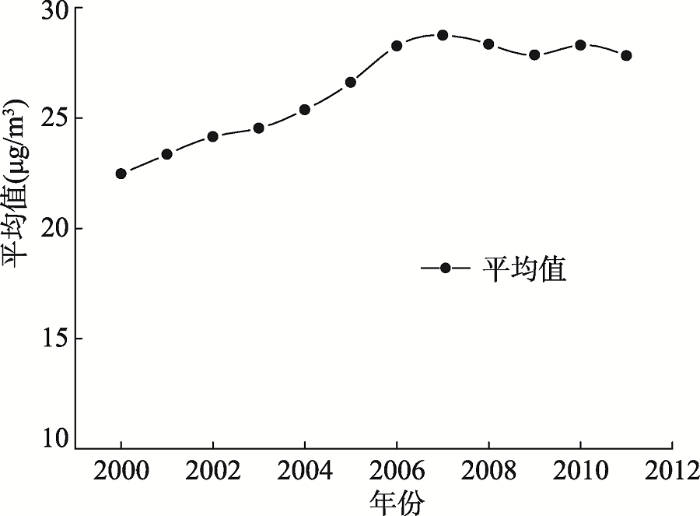
综合时间序列分析与Spearman秩相关系数法分析发现,监测数据空缺的2000-2011年中国PM2.5年均浓度总体趋势呈现先增加后稳定的演化态势(图1)。PM2.5年均浓度由2000年的22.47 μg/m3增加至2006年的28.26 μg/m3,年均增加0.97 μg/m3,呈显著持续上升趋势(p = 0.05)。2006-2011年PM2.5年均浓度基本围绕28.22 μg/m3波动,2006年之后显著上升态势在一定程度上得到抑制,呈现较为稳定的波动数值。表明2006年是中国PM2.5年平均浓度变化的重要“拐点”,该结果与2007年中国环保部发布结果一致。主要原因是全国生态文明建设、生态补偿试点、污染普查、环境保护政策的初显成效,国家产业结构调整、能源效率提升在一定度上抑制了颗粒物排放。然而,中国PM2.5浓度依然较高,且呈现快速扩散趋势,2011年PM2.5年浓度值栅格数相比2000年增加75.12%,其中年均浓度增幅超过1倍的栅格达13.20%,表明PM2.5的污染在国土空间上仍呈现明显扩散趋势。
图1 2000-2011年中国PM2.5浓度变化总体变化趋势
Fig. 1 The overall trend of PM2.5 concentration changes in China in 2000-2011
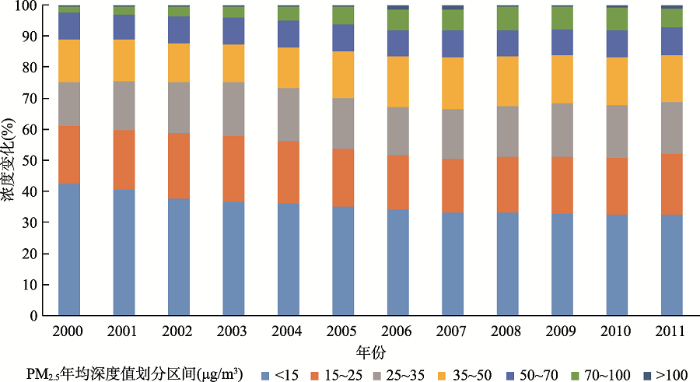
基于中国《环境空气质量标准》(GB3095-2012)中PM2.5年均浓度限值[12],将PM2.5年均浓度值划分为7个区间,深入分析研究时段内各区间栅格的面积占比(图2),结果表明:① PM2.5年均浓度低于15 μg/m3(一级浓度限值)的比例由2000年的42.49%,持续降至2011年的32.39%;② PM2.5年均浓度高于35 μg/m3(二级浓度限值)的比例由2000年的24.64%,上升至2011年的31.25%;③ PM2.5年均浓度高于70 μg/m3的高污染区比例由2000年的2.21%,大幅上升至2011年的7.08%,增加幅度超过2倍;④ PM2.5年均浓度高于100 μg/m3的极高污染区集中涌现在2006-2007年,其次为2010-2011年,其余年份比例均低于0.50%。研究结果表明低于15 μg/m3低污染区在持续减少,高于70 μg/m3的高污染区在不断增加,高污染区域与极高污染区在国土空间上呈现快速扩张趋势。
图2 2000-2011年中国分区间PM2.5浓度变化趋势
Fig. 2 The trends of PM2.5 concentration changes by range in China in 2000-2011
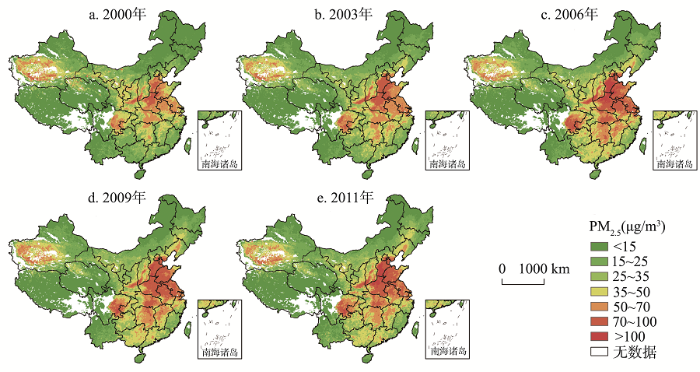
3.2.1 时空格局演化特征 科学识别PM2.5空间格局演化特征与分布规律,探究国土空间上PM2.5的浓度变化,对国家制定跨区域联动污染治理具有重要意义。研究首先通过PM2.5的栅格空间数据分析得到2000-2011年中国PM2.5的主要空间特征规律:① 2000年PM2.5年均浓度超过100 μg/m3的区域,零星出现在河南的新乡、开封、延津等县区,到2006年开始蔓延覆盖至河南北部、河北南部的大部分地区,同时在汾渭盆地、四川盆地亦有零星分布(图3)。② PM2.5年均浓度超过70 μg/m3的高污染区在黄淮海平原、汾渭盆地、四川盆地明显有集中成片分布,其中黄淮海平原的高污染区面积最大,且有向长江中下游平原蔓延扩散的趋势。此外,除了人口密集、经济相对发达的地区之外,高污染区在塔里木盆地外缘亦有零星分布。③ 胡焕庸线以东除黑龙江、云南、福建、台湾、海南等省以外的地区,PM2.5年均浓度基本都超过35 μg/m3,即中国大部分人口稠密的地区PM2.5年均浓度无法满足《环境空气质量标准》所规定的二级标准。④ 位于胡焕庸线以西地区,除塔里木盆地地区受塔克拉玛干沙漠的春季扬尘影响外,其余地区PM2.5年均浓度基本低于35 μg/m3。国土空间上PM2.5污染较严重区域主要集中分布在华北与长江流域地区,具有较明显的低地平原指向性,其浓度与人口密度、经济活动密度存在紧密地理空间关联。
图3 2000-2011年中国PM2.5空间格局演变特征
Fig. 3 The evolution of spatial patterns of PM2.5 in China in 2000-2011
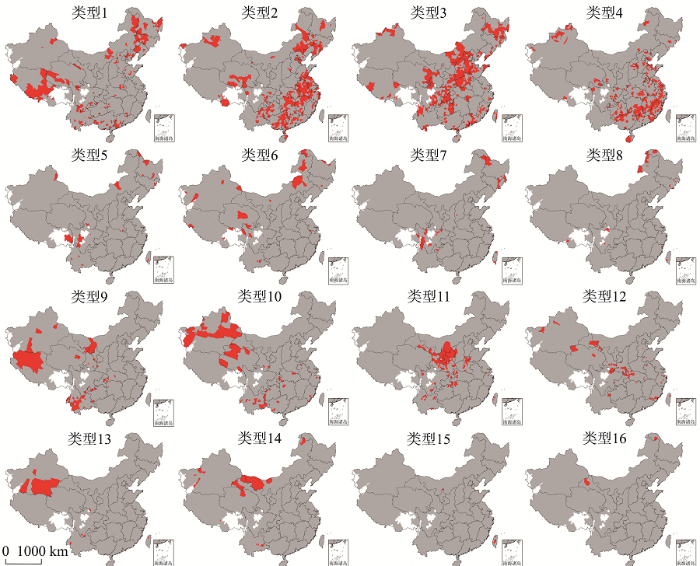
3.2.2 县域时空格局演化特征 为了精细刻画中国PM2.5浓度变化与污染的空间特征,本研究以县级行政区划为基本单元,通过栅格运算,详细地统计全国2861个县区单元2000-2003年、2003-2006年、2006-2009年与2009-2011年4个阶段,PM2.5的浓度值的升降情况,依据4个时段的浓度升降变化特征将其划分为16种时间序列类型(表1、图4)发现:① 研究时段内PM2.5浓度呈现持续上升的县级单元占总数的8.64%,主要分布在PM2.5污染程度较低的青藏高原及东北等区域,此类地区是中国环境的净土,虽然生态环境较佳但空气质量呈现小幅持续恶化,应该引起关注和重视;② 2000-2006年PM2.5污染程度持续上升的县级研究单元占到总体的76.23%,该时段内PM2.5污染加剧是全国大多数地区的总体趋势,该时段是中国工业化和城市化发展速度最快的时期之一;③ 部分时间序列类型分布具有明显的空间集聚性,如,类型D-R-D-R明显集中在陕甘宁地区,类型D-D-R-R则基本分布在南疆地区,其中全国范围内PM2.5持续呈现下降趋势的县区仅有2个,分布在甘肃酒泉地区。整体分析发现16种类型内部各有差异,呈现明显的空间集聚特征,进一步表明PM2.5分布的空间异质性和复杂性。
图4 中国PM2.5浓度16种时间序列类型演变趋势
Fig. 4 The evolution trend of PM2.5 concentration by type of time sequences in China
表1 中国PM2.5浓度时间变化的16种类型
Tab. 1 16 types of the evolution of PM2.5 concentration in time sequences in China
| 序号 | 变化类型 | 数量 | 占比(%) | 序号 | 变化类型 | 数量 | 占比(%) |
|---|---|---|---|---|---|---|---|
| 1 | R—R—R—R | 199 | 8.64 | 9 | D—R—R—R | 62 | 2.69 |
| 2 | R—R—R—D | 498 | 21.63 | 10 | D—R—R—D | 87 | 3.78 |
| 3 | R—R—D—R | 676 | 29.37 | 11 | D—R—D—R | 183 | 7.95 |
| 4 | R—R—D—D | 382 | 16.59 | 12 | D—R—D—D | 63 | 2.74 |
| 5 | R—D—R—R | 28 | 1.22 | 13 | D—D—R—R | 10 | 0.43 |
| 6 | R—D—R—D | 41 | 1.78 | 14 | D—D—R—D | 19 | 0.83 |
| 7 | R—D—D—R | 34 | 1.48 | 15 | D—D—D—R | 4 | 0.17 |
| 8 | R—D—D—D | 14 | 0.61 | 16 | D—D—D—D | 2 | 0.09 |
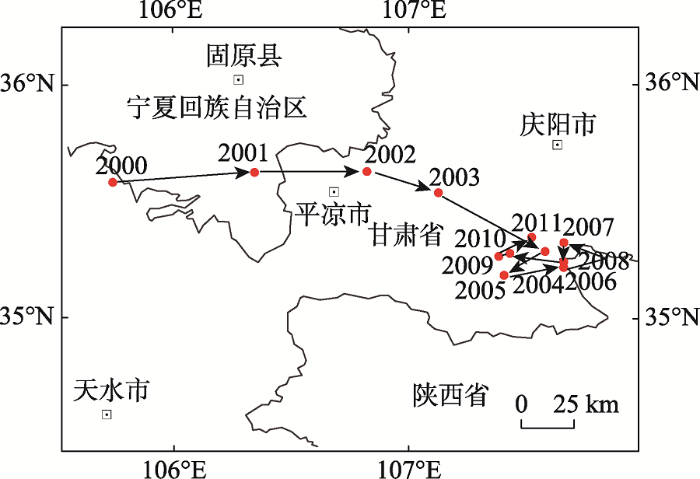
3.2.3 空间重心转移 利用重力模型,从PM2.5总体浓度重心、高浓度重心与低浓度重心三个方面,系统考察2000-2011年间中国PM2.5浓度重心的移动方向、移动轨迹与移动速率。重心时空分析表明:① 研究时段内,中国PM2.5浓度总体浓度重心位于甘肃、宁夏与陕西交界处(图5),重心格局变动明显。2000-2004年整体浓度重心呈现快速东移态势,重心年均移动距离为44.40 km,表明该时段东部地区PM2.5浓度明显增加。2005年以后PM2.5总体重心移动趋势放缓,年均移动距离下降至15.04 km,重心移动明显减弱;② PM2.5高浓度重心由西北快速向东南移动,2001年位于甘肃省境内,2001-2003年快速转移山西省境内,年均移动距离达到156.09 km,2004年之后转移至河南省境内,移动距离快速下降至40.71 km,呈现较为稳定状态;③ 低浓度重心呈现快速向西移动的趋势,重心长期位于内蒙古境内,与高浓度重心相向而行,2004年之前年平均移动距离86.37 km,2005-2011年移动速度迅速降低至37.84 km。总体而言,总体浓度重心、高浓度重心呈现向东南移动趋势,低浓度重心呈现向西移动趋势,且三者重心2004年之前空间移动迅速,2005年之后趋于稳定。这与“十一五”期间国家生态文明建设、产业转移(东部向中西部)、东部环保门槛提升有密切的关系,研究结果与前文3.1结果一致。进一步印证中国PM2.5污染大致呈现东部高于西部,北方高于南方的空间格局与趋势。
图5 2000-2011年中国PM2.5污染总体重心迁移轨迹
Fig. 5 The movement of the center of gravity of PM2.5 in China in 2000-2011
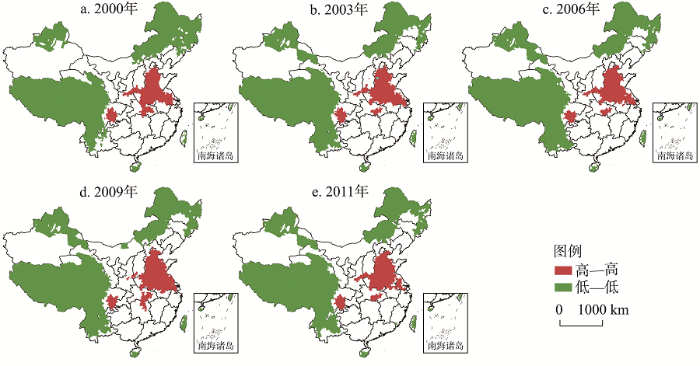
3.3.1 全局空间自相关特征 系统分析2000-2011年县级单元PM2.5年均浓度的全局 Moran's I指数发现(图6):研究时段内全局Moran's I指数均为正值,且通过显著性检验(p = 0.05),表明PM2.5年均浓度在空间上呈现显著的空间正自相关,空间集聚特征明显。从全局Moran's I指数的时间序列分析得到2006年全局Moran's I指数达到最大值,随后基本呈现逐年下降态势,该转折点与年均浓度的时间序列转折点一致,表明PM2.5年均浓度的空间集聚性呈先升后降的时间序列趋势,空间集聚程度在2006年达到顶峰。
图6 2000-2011年中国PM2.5局部空间自相关分析
Fig. 6 The spatial autocorrelation analysis of PM2.5 in China in 2000-2011
3.3.2 局部空间自相关 基于局部空间自相关分析结果,将呈现显著空间局部自相关的县级单元划分为四种类型。其中“高—高”类型,即PM2.5年均浓度高值集聚区,污染的热点集中分布在黄淮海平原、汾渭盆地、四川盆地及江汉平原地区,热点所包含的县级行政单元个数2000-2006年无较大变化,至2009年出现大幅增加随后回落;“低—低”类型,即PM2.5年均浓度低值集聚区,污染的冷点集中分布在东北地区北部、台湾、云南、青藏高原、新疆与内蒙古北部等边疆地区,冷点所包含的县级行政单元个数在时序变化上与热点类似,在2009年出现显著增加前变化不大,但在2011年减少至最低值;其余县级行政单元均未呈现出显著的局部空间自相关。研究时段内,未发现呈现“高—低”或“低—高”局部空间自相关类型的县级行政单元,表明PM2.5年均浓度呈现极具强烈的局部空间正自相关特性。
中国PM2.5浓度变化空间差异显著、成因复杂、驱动因素多样。总结发现驱动因素涉及大气环流、火山灰、森林火灾、沙漠裸地扬尘、风向风频,以及降雨等自然因素;同时也与工业烟尘排放、燃煤、秸秆燃烧、机动车尾气、建筑施工扬尘等人为因素关系紧密。为了更深入的对PM2.5浓度变化的驱动因素进行细致分析,本文选取2000年、2006年和2011年287个地级城市的面板数据,共计27839个样本,利用地理探测器探测空间分异特征与规律的优势,揭示其背后驱动因子,选取对PM2.5贡献较大的自然地理区划(X1)、人均GDP(X2)、人口密度(X3)、二产占比(X4)、建成区面积占比(X5)、城市绿化率(X6)、居民汽车保有量(X7)、播种面积(X8)、工业烟尘排放量(X9)、地均能源消费强度(X10)、地均钢铁产量(X11)11个指标因子对中国287个地级市PM2.5贡献程度进行计算(表2)。
表2 驱动要素地理探测分析表
Tab. 2 Geographical detection analysis of PM2.5
| 探测指标 | 2000年 | 2006年 | 2011年 | |||
|---|---|---|---|---|---|---|
| P | Q | P | Q | P | Q | |
| 自然地理区划(X1) | 0.7047 | 0.0000 | 0.7447 | 0.0000 | 0.7196 | 0.0000 |
| 人均GDP(X2) | 0.0077 | 0.9191 | 0.0062 | 0.9079 | 0.0068 | 0.8659 |
| 人口密度(X3) | 0.4320 | 0.0000 | 0.4372 | 0.0000 | 0.4120 | 0.0000 |
| 二产占比(X4) | 0.0984 | 0.0000 | 0.0665 | 0.0031 | 0.0917 | 0.0000 |
| 建成区面积占比(X5) | 0.0853 | 0.0030 | 0.0753 | 0.1033 | 0.1025 | 0.0282 |
| 城市绿化率(X6) | 0.0280 | 0.1503 | 0.0625 | 0.0319 | 0.0359 | 0.1083 |
| 居民汽车保有量(X7) | 0.0259 | 0.8637 | 0.0913 | 0.0226 | 0.1074 | 0.0080 |
| 农作物播种面积(X8) | 0.1396 | 0.0557 | 0.1487 | 0.0000 | 0.1046 | 0.0000 |
| 工业烟尘排放量(X9) | 0.0709 | 0.1537 | 0.0936 | 0.0000 | 0.0531 | 0.2766 |
| 地均能源消费强度(X10) | 0.3109 | 0.0000 | 0.4124 | 0.0000 | 0.4143 | 0.0000 |
| 地均钢铁产量(X11) | 0.2869 | 0.0000 | 0.3373 | 0.0000 | 0.3217 | 0.0000 |
地理探测分析表明PM2.5的浓度变化与区域自然因素密切相关。自然地理区划(X1)对PM2.5的影响最为显著,其对PM2.5的探测解释力P值2000年、2006年和2011年三个时间断面上分别为0.7047、0.7477与0.7196,充分表明大尺度地域分异规律,地貌、气候、水文、植被对PM2.5的形成机制具有重要的影响作用。时空格局部分识别出的四大PM2.5重污染区中,塔克拉玛干沙漠地区PM2.5的变化与地区大气环流以及局地沙尘天气密切相关,通过新疆88个监测站2000-2011年观测资料分析显示,新疆沙尘天气的高发区在塔克拉玛干沙漠及其南缘,年沙尘日数南疆是北疆的2.7倍,明显多于北疆[44],因此,PM2.5浓度值也呈现南疆高于北疆的空间耦合特征,同时新疆地区植被覆盖整体增加、降雨变化在一定程度上也影响着塔克拉玛干沙漠地区PM2.5的变化。此外,受洋流、东南季风、暖湿气候及大量降水的影响,人口稠密、产业集聚的珠三角地区、以及沿海的福建、台湾与海南等岛屿地区PM2.5年平均浓度则相对较低,受污染较轻。同样地处第一阶梯的青藏高原、第二阶梯的内蒙古高原与云贵高原等地区人类经济活动较少,PM2.5浓度也相对较低。
人类活动扰动深刻地影响着大气污染,城镇化建设过程中造成的扬尘、汽车增加导致的尾气排放、能源消耗与燃煤取暖、农业生产导致的秸秆燃烧均是PM2.5排放重要驱动因素。PM2.5重污染区中除了受自然因素强烈影响的新疆地区以外,其余三个高值区基本与中国人口密度空间分布一致。地理探测器研究表明PM2.5重污染地区主要集中在以京津冀为中心的华北平原、山东半岛、两湖平原、成渝盆地等人口密集地区,重污染地区与人口密集区域空间高度重合。
(1)城镇化建设驱动。通过地理探测对驱动PM2.5浓度变化的城市发展与城市建设因素分析表明,2000年、2006年和2011年三个时间断面上,城市人口密度(X3)对PM2.5的探测P值分别为0.4320、0.4372与0.4120,呈现倒“U”型变化特征,人口密度对地区PM2.5浓度变化贡献最大。建成区面积占比(X5)的探测P值分别为0.0853、0.0753与0.1025,其对地区PM2.5浓度变化贡献随着城市建设的加快逐渐增大。城市绿化率(X6)的探测P值分别为0.0280、0.0625与0.0359,其对地区PM2.5浓度变化贡献也呈现倒“U”型变化特征,虽然城市绿化一定程度上能阻滞尘埃,减轻PM2.5对大气的污染,但对PM2.5的影响甚微。人均GDP(X2)同样也影响较小。
(2)工业、能源(煤炭)消费驱动。地理探测对驱动PM2.5浓度变化的城市发展与城市建设因素分析表明,2000年、2006年与2011年三个时间断面上,第二产业占比(X4)对PM2.5的探测P值分别为0.0984、0.0665与0.0917,地均能源消费强度探测P值分别为0.3109、0.4124与0.4143,地均钢铁产量P值分别为0.2869、0.3373与0.3217,两者对PM2. 5污染的贡献程度显著(显著性水平为0.01),其在一定程度上代表了城市颗粒污染物的排放情况,是大部分城市与地区污染的主导因子。究其原因2000-2011中国能源消费总量增长了2.39倍,其中煤炭占能源的消费总量从2000年的69.21%下降到2011年的68.42%。煤炭始终是中国最主要能源消费对象,2015年能源消费结构中煤炭占比依然为68%以上,未出现实质性下降,其中重污染区域山东、内蒙古、山西、河北、河南与江苏煤炭消费总量都超过20000万t。2000-2011年中国煤炭消耗量巨大的钢铁行业主要位于长三角、黄淮海以及四川盆地三大区域,其中河北、天津、山东、陕西、江苏、辽宁、上海和四川等10省市成为中国最主要的钢铁产业集聚区,2011年10省的粗钢产量为49450万t,占当年全国产量的70.44%。因此煤炭消费与钢铁产业的空间集聚是导致PM2.5浓度的关键要素之一。
(3)机动车尾气排放驱动。地理探测对驱动PM2.5浓度变化的汽车因素分析表明,2000年、2006年与2011年三个时间断面上,居民汽车保有量(X7)对PM2.5的探测P值分别为0.0984、0.0665与0.0917,结果表明汽车保有量在2000年与2006年对PM2.5浓度影响不显著,然而2006年以后随着汽车数量的暴增,2011年呈现出较为显著的水平。2000-2011年,中国民用汽车拥有量增加了5.82倍,私人汽车拥有量更是增加了11.72倍,汽车的增速远高于经济(4.77倍)、人均收入(4.48倍)与公路里程(2.45倍)的增速。雾霾重度污染的北京、河北、江苏、浙江、山东等省市汽车保有量均超过了400万台。
(4)秸秆燃烧驱动。地理探测分析表明,间接代表秸秆燃烧的农作物播种面积(X8)在2000年、2006年与2011年三个时间断面上对PM2.5的探测P值分别为0.1396、0.1487与0.1046,呈现倒“U”型变化特征,秸秆燃烧对地区PM2.5浓度影响在2006年达到最大,之后呈现下降趋势。中国农业秸秆总量在6×10⁸ t,农村平均秸秆露天焚烧比例为18.59%,其产生的污染虽不到PM2.5总量的5%,但因焚烧空间集聚(以农业发达的华东和华北地区最为显著),燃烧时间集中,高峰为10月前后,且在1、2天时间内集中焚烧。因此,秸秆焚烧产生的PM2.5可能占当天空气中PM2.5量的30%、40%,对区域大气污染产生显著影响[45]。
(1)2000-2011年中国PM2.5年均浓度呈现先快速增加,后趋于稳定的总体演变趋势,2006年是中国PM2.5浓度值总体变化的“拐点”。全国PM2.5年均浓度基本呈现持续高污染状态,且在国土空间上呈现明显扩散趋势。2011年PM2.5年浓度值栅格占总数相比2000年增加75.12%,其中年均浓度增幅超过一倍的栅格达13.20%。
(2)空间分析表明PM2.5污染整体呈现北方高于南方,东部高于中西部趋势特征,胡焕庸线为显著的分界线。PM2.5高污染与极高污染区域在国土空间上呈现快速扩张趋势,平均浓度值低于15 μg/m3区域则在持续减少,高于70 μg/m3的区域快速增加。污染较严重区域主要集中在华北地区,具有较明显的低地平原指向性。县级单元分析表明2000-2006年PM2.5污染程度持续上升的县级研究单元占到全国76.23%,该时段PM2.5污染加剧是全国大多数地区的总体趋势。
(3)重心分析表明中国PM2.5总体污染重心位于甘肃东部,2000-2004年PM2.5排放重心快速向东转移,年平均移动44.40 km,2004年后污染浓度高值区重心呈现明显东进趋势,低值区呈现西移趋势,两者重心背向而行。表明该时段东部地区PM2.5污染出现明显增加,东部PM2.5污染增加程度高于西部。空间自相关分析表明PM2.5年均浓度呈现强烈的局部空间正自相关特性,PM2.5“高—高”集聚区,连片分布在黄淮海平原、汾渭盆地、四川盆地及江汉平原地区;PM2.5“低—低”集聚区,集聚分布在内蒙古与黑龙江北部,台湾、海南与福建等东南沿海及岛屿,以及青藏高原及新疆北部等边疆地区。
(4)驱动因素解析表明自然原因与人类活动共同对PM2.5污染空间特征演变产生影响,其中自然地理区划对PM2.5的驱动影响最为显著,探测解释力P值三个时段的平均值高于0.7240;另外,大气条件、人口增长(人口密度)、工业排放、秸秆燃烧、能源消费增长、机动车保有量增加、尾气排放总量短期内快速增加均是中国PM2.5浓度变化的主要驱动因素。
科学识别PM2.5浓度空间变化特征与规律,准确掌握其驱动因素及其机制,是中国经济快速发展与环境保护协调发展的关键,其不仅能缓解居民对“雾霾猛于虎也”的恐怖心理,也能为区域大气联动治理、污染产业的空间布局、城市空间优化(风道、绿带等)、产业结构与能源结构调整提供科学依据。由于数据原因国内关于大尺度PM2.5浓度演化研究起步较晚,已有研究多利用环境监测站点数据展开,利用截面数据展开季节与日变化分析。本文利用1999-2012年NASA大气反演数据,一定程度上弥补了2000-2011年中国大尺度PM2.5数据缺失、以及中西部地区监测站点较少、区域信息失真对研究的限制问题。本文揭示的PM2.5空间分布格局结论与已有研究[25, 40]结论契合,且能更长时间序列、更精细、整体的反映监测点较为稀疏区域的空间特征。然而,中国PM2.5变化的驱动因素错综复杂,除了大气环流、极端天气、地貌地形、区域传输等自然原因外,工业污染、煤炭燃烧、机动车排放、扬尘、生物质燃烧、汽车尾气与垃圾焚烧等人为原因是重要驱动因素。由于各个地区或城市产业结构、能源结构、消费结构等差距较大,因此,导致PM2.5驱动变化的关键因素也不尽相同。目前国家经济发展正处在“调结构、稳增长与绿色发展”的关键转型时期,准确预见大气污染物复杂性和治理长期性,持续的开展“大气灰霾追因与控制”与“雾霾与健康关系”等关键科学问题是国家急需突破的科学发展难关,也是未来研究探索的重点。
The authors have declared that no competing interests exist.
| [1] |
Urban sprawl and air quality in large US cities. https://doi.org/10.1016/j.jenvman.2006.12.034 URL PMID: 17368703 [本文引用: 1] 摘要
This study presents the results of a paper of urban spatial structure and exceedances of the 8-h national ambient air quality standard for ozone in 45 large US metropolitan regions. Through the integration of a published index of sprawl with metropolitan level data on annual ozone exceedances, precursor emissions, and regional climate over a 13-year period, the association between the extent of urban decentralization and the average number of ozone exceedances per year, while controlling for precursor emissions and temperature, is measured. The results of this analysis support the hypothesis that large metropolitan regions ranking highly on a quantitative index of sprawl experience a greater number of ozone exceedances than more spatially compact metropolitan regions. Importantly, this relationship was found to hold when controlling for population size, average ozone season temperatures, and regional emissions of nitrogen oxides and volatile organic compounds, suggesting that urban spatial structure may have effects on ozone formation that are independent of its effects on precursor emissions from transportation, industry, and power generation facilities.
|
| [2] |
Chemical characterisation of PM2.5, PM10 and coarse particles at urban, near-city and rural sites in Switzerland. https://doi.org/10.1016/j.atmosenv.2004.10.027 URL [本文引用: 1] 摘要
When performing a mass closure, the annual average of the sum of aerosol chemical components was 22–27% for PM10 and 8–15% for PM2.5 lower than the PM mass. A drying procedure applied to a subset of PM10 samples and model calculations for PM2.5 samples according to their inorganic composition were used to estimate the contribution of retained water to the unaccounted mass at 50% RH. The obtained average water content was 10.6% for PM10 and 13–23% for PM2.5, clearly indicating that water is a major contributor to the unaccounted mass. Furthermore, a pronounced seasonal variation was observed with relatively lower water content in the colder season, indicating that the inorganic salts were mainly crystalline in winter, whereas they were probably dissolved during the rest of the year.
|
| [3] |
Spatio-temporal variation trends of satellite-based aerosol optical depth in China during1980-2008. https://doi.org/10.1016/j.atmosenv.2011.03.068 URL [本文引用: 1] 摘要
This paper analyzes TOMS AOD at 500 nm (1980–2001), along with MODIS data (2000–2008) at 550 nm to investigate variations at one-degree grid over eight typical regions in China and the trends in AODs, temporally and spatially. In contrast to recently reported global decrease in AOD over global ocean beginning around 1990, we find there virtually exists no apparent AOD transition in China for that: firstly no notable upward tendencies in AOD during 1980–1992 for the relative low value (+0.001/decade), then during 1996–2001 a discernible ascending tendency with larger magnitude at 0.01/decade, and finally, since 2000, a weak upward trend with +0.004/decade. The large increases during 1996–2001 are presumably consequences of large increases in industrial activities and bear a strong resemblance to the long-term decreasing observations of incident solar radiation and cloud cover in China. Specifically, in late 1990’s, only in Taklimakan Desert a negative trend with a maximum magnitude of 610.04/decade is detected. However, over regions such as Jingjinji and Pearl River Delta influenced by industrial activities, positive tendencies at +0.01/decade are observed.Seasonal patterns in the AOD regional long-term trend are evident. AODs exhibit generally similar seasonality and the summer dominates higher AOD value than the autumn. In particular, during the period 1980–2001, all the eight regions except Taklimakan Desert witness the maximum aerosols in winter while there is not such seasonality during the period 2000–2008. Geographically, we also document spatial patterns of AOD variations over China. Results reveal that no apparent upward trends in AOD (about 15% per decade) are observed in 1980’s, while beginning 1990 till 2008, both data (TOMS and MODIS) are indicative of a significant AOD increase across China, especially in 1990’s it is indeed the case, roughly in accordance with the overall trends at regional scale.Highlights? We investigate the spatio-temporal trends in AOD in eight typical regions of China. ? Transition in overall AOD trend from downward to upward is observed beginning 1990. ? The spatial variation in AOD suggests no apparent upward trends in 1980’s. ? Since 1990, both TOMS and MODIS indicate a significant AOD increase across China.
|
| [4] |
Hazy weather research in China in the last decade: A review.
Systematic research on haze in China has been on-going for a decade.The rapid economic expansion and urbanization has led to worsening particulate matter(PM) pollution and more frequent poor visibility events.A rapid increase in the number of hazy days has been seen over eastern China.The culprit of hazy weather is fine PM pollution.Hazy weather is often associated with photochemical pollution and composition of aerosols responsible for haze is rather complicated.In recent years,hazy weather,due to its significant environmental impacts and climatic effects,has become a hot topic,attracting wide attention from scientific community,government departments and the public.This paper surveys the literature in Chinese in the recent decade to provide a review on the process of understanding haze and research progress in hazy weather.Future research directions are also discussed.
|
| [5] |
Atmospheric environmental protection in China: Current status, developmental. https://doi.org/10.1016/j.enpol.2006.01.019 URL [本文引用: 1] |
| [6] |
An association between air pollution and mortality in six U.S. cities. https://doi.org/10.1056/NEJM199312093292401 URL PMID: 8179653 [本文引用: 1] 摘要
The effects of air pollution on mortality are analyzed taking into account individual risk factors such as cigarette smoking. "Survival analysis including Cox proportional-hazards regression modeling was conducted with data from a 14-to-16-year mortality follow-up of 8111 adults in six U.S. cities. Mortality rates were most strongly associated with cigarette smoking. After adjusting for smoking and other risk factors we observed statistically significant and robust associations between air pollution and mortality." (EXCERPT)
|
| [7] |
The role of particle composition on the association between PM2.5 and mortality. https://doi.org/10.1097/EDE.0b013e3181812bb7 URL PMID: 3755878 摘要
Background: Although the association between exposure to particulate matter (PM) mass and mortality is well established, there remains uncertainty about which chemical components of PM are most harmful to human health. Methods: A hierarchical approach was used to determine how the association between daily PM mass and mortality was modified by PM composition in 25 US communities. First, the association between daily PM and mortality was determined for each community and season using Poisson regression. Second, we used meta-regression to examine how the pooled association was modified by community and season-specific particle composition. Results: There was a 0.74% (95% confidence interval = 0.41%–1.07%) increase in nonaccidental deaths associated with a 10 μg/m06 increase in 2-day averaged PM mass concentration. This association was smaller in the west (0.51% [0.10%–0.92%]) than in the east (0.92% [0.23%–1.36%]), and was highest in spring (1.88% [0.23%–1.36%]). It was increased when PM mass contained a higher proportion of aluminum (interquartile range = 0.58%), arsenic (0.55%), sulfate (0.51%), silicon (0.41%), and nickel (0.37%). The combination of aluminum, sulfate, and nickel also modified the effect. These species proportions explained residual variability between the community-specific PM mass effect estimates. Conclusions: This study shows that certain chemical species modify the association between PM and mortality and illustrates that mass alone is not a sufficient metric when evaluating health effects of PM exposure.
|
| [8] |
Review: Epidemiological basis for particulate air pollution health standards. https://doi.org/10.1080/027868200303885 URL 摘要
There are now more than 150 published epidemiologic studies of health effects of particulate air pollution and dozens of related literature reviews. This article explores the basic inferences currently being drawn from the literature regarding the epidemiologic evidence particulate pollution induced health effects. Although there is not a complete consensus of opinion, most reviewers conclude that the overall epidemiologic evidence suggests that particulate air pollution, especially fine combustion-source pollution common to many urban and industrial environments, is an important risk factor for cardiopulmonary disease and mortality. Most of the epidemiological effort has focused on effects of acute exposure, but effects of chronic exposure may be more important in terms of overall public health relevance. Some reviewers contend that long-term, repeated exposure likely increases the risk of chronic respiratory disease and the risk of cardiorespiratory mortality. There is more general (but still not unanimous) agreement that short-term exposures to particulate pollution can exacerbate existing cardiovascular and pulmonary disease and increase the number of persons in a population who become symptomatic, require medical attention, or die.
|
| [9] |
Lung cancer, cardiopulmonary mortality, and long-term exposure to fine particulate air pollution. https://doi.org/10.1001/jama.287.9.1132. URL PMID: 11879110 [本文引用: 1] 摘要
CONTEXT: Associations have been found between day-to-day particulate air pollution and increased risk of various adverse health outcomes, including cardiopulmonary mortality. However, studies of health effects of long-term particulate air pollution have been less conclusive. OBJECTIVE: To assess the relationship between long-term exposure to fine particulate air pollution and all-cause, lung cancer, and cardiopulmonary mortality. DESIGN, SETTING, AND PARTICIPANTS: Vital status and cause of death data were collected by the American Cancer Society as part of the Cancer Prevention II study, an ongoing prospective mortality study, which enrolled approximately 1.2 million adults in 1982. Participants completed a questionnaire detailing individual risk factor data (age, sex, race, weight, height, smoking history, education, marital status, diet, alcohol consumption, and occupational exposures). The risk factor data for approximately 500 000 adults were linked with air pollution data for metropolitan areas throughout the United States and combined with vital status and cause of death data through December 31, 1998. MAIN OUTCOME MEASURE: All-cause, lung cancer, and cardiopulmonary mortality. RESULTS: Fine particulate and sulfur oxide--related pollution were associated with all-cause, lung cancer, and cardiopulmonary mortality. Each 10-microg/m(3) elevation in fine particulate air pollution was associated with approximately a 4%, 6%, and 8% increased risk of all-cause, cardiopulmonary, and lung cancer mortality, respectively. Measures of coarse particle fraction and total suspended particles were not consistently associated with mortality. CONCLUSION: Long-term exposure to combustion-related fine particulate air pollution is an important environmental risk factor for cardiopulmonary and lung cancer mortality.
|
| [10] |
Potential role of ultrafine particles in associations between airborne particle mass and cardiovascular health. https://doi.org/10.1289/ehp.7938 URL PMID: 1280331 [本文引用: 1] 摘要
Numerous epidemiologic time-series studies have shown generally consistent associations of cardiovascular hospital admissions and mortality with outdoor air pollution, particularly mass concentrations of particulate matter (PM) < or = 2.5 or < or = 10 microm in diameter (PM2.5, PM10). Panel studies with repeated measures have supported the time-series results showing associations between PM and risk of cardiac ischemia and arrhythmias, increased blood pressure, decreased heart rate variability, and increased circulating markers of inflammation and thrombosis. The causal components driving the PM associations remain to be identified. Epidemiologic data using pollutant gases and particle characteristics such as particle number concentration and elemental carbon have provided indirect evidence that products of fossil fuel combustion are important. Ultrafine particles < 0.1 microm (UFPs) dominate particle number concentrations and surface area and are therefore capable of carrying large concentrations of adsorbed or condensed toxic air pollutants. It is likely that redox-active components in UFPs from fossil fuel combustion reach cardiovascular target sites. High UFP exposures may lead to systemic inflammation through oxidative stress responses to reactive oxygen species and thereby promote the progression of atherosclerosis and precipitate acute cardiovascular responses ranging from increased blood pressure to myocardial infarction. The next steps in epidemiologic research are to identify more clearly the putative PM casual components and size fractions linked to their sources. To advance this, we discuss in a companion article (Sioutas C, Delfino RJ, Singh M. 2005. Environ Health Perspect 113:947-955) the need for and methods of UFP exposure assessment.
|
| [11] |
Association of fine particulate matter from different sources with daily mortality in six US cities. https://doi.org/10.2307/3435052 URL PMID: 11049813 摘要
Previously we reported that fine particle mass (particulate matter 2.5 m; PM2.5), which is primarily from combustion sources, but not coarse particle mass, which is primarily from crustal sources, was associated with daily mortality in six eastern U.S. cities (1). In this study, we used the elemental composition of size-fractionated particles to identify several distinct source-related fractions of fine particles and examined the association of these fractions with daily mortality in each of the six cities. Using specific rotation factor analysis for each city, we identified a silicon factor classified as soil and crustal material, a lead factor classified as motor vehicle exhaust, a selenium factor representing coal combustion, and up to two additional factors. We extracted daily counts of deaths from National Center for Health Statistics records and estimated city-specific associations of mortality with each source factor by Poisson regression, adjusting for time trends, weather, and the other source factors. Combined effect estimates were calculated as the inverse variance weighted mean of the city-specific estimates. In the combined analysis, a 10 g/ m3 increase in PM2.5 from mobile sources accounted for a 3.4% increase in daily mortality [95% confidence interval (CI), 1.7-5.2%], and the equivalent increase in fine particles from coal combustion sources accounted for a 1.1% increase [CI, 0.3-2.0%). PM2.5 crustal particles were not associated with daily mortality. These results indicate that combustion particles in the fine fraction from mobile and coal combustion sources, but not fine crustal particles, are associated with increased mortality.
|
| [12] |
Fine particulate air pollution and mortality in 20 U.S. cities, 1987-1994. https://doi.org/10.1056/NEJM200012143432401 URL PMID: 11114312 [本文引用: 1] 摘要
Air pollution in cities has been linked to increased rates of mortality and morbidity in developed and developing countries. Although these findings have helped lead to a tightening of air-quality standards, their validity with respect to public health has been questioned.We assessed the effects of five major outdoor-air pollutants on daily mortality rates in 20 of the largest cities and metropolitan areas in the United States from 1987 to 1994. The pollutants were particulate matter that is less than 10 microm in aerodynamic diameter (PM10), ozone, carbon monoxide, sulfur dioxide, and nitrogen dioxide. We used a two-stage analytic approach that pooled data from multiple locations.After taking into account potential confounding by other pollutants, we found consistent evidence that the level of PM10 is associated with the rate of death from all causes and from cardiovascular and respiratory illnesses. The estimated increase in the relative rate of death from all causes was 0.51 percent (95 percent posterior interval, 0.07 to 0.93 percent) for each increase in the PM10 level of 10 microg per cubic meter. The estimated increase in the relative rate of death from cardiovascular and respiratory causes was 0.68 percent (95 percent posterior interval, 0.20 to 1.16 percent) for each increase in the PM10 level of 10 microg per cubic meter. There was weaker evidence that increases in ozone levels increased the relative rates of death during the summer, when ozone levels are highest, but not during the winter. Levels of the other pollutants were not significantly related to the mortality rate.There is consistent evidence that the levels of fine particulate matter in the air are associated with the risk of death from all causes and from cardiovascular and respiratory illnesses. These findings strengthen the rationale for controlling the levels of respirable particles in outdoor air.
|
| [13] |
Reduction in fine particulate air pollution and mortality: Extended follow-up of the Harvard six cities study. https://doi.org/10.1164/rccm.200503-443OC URL [本文引用: 1] |
| [14] |
Age specific and sex-specific mortality in 187 countries, 1970-2010: A systematic analysis for the global burden of disease study 2010. https://doi.org/10.1016/S0140-6736(12)61719-X URL [本文引用: 1] |
| [15] |
Beijing smog: When growth trumps life in China, BBC, Beijing , |
| [16] |
Evaluating PM2.5 ionic components and source apportionment in Jinan, China from 2004 to 2008 using trajectory statistical methods. https://doi.org/10.1039/c0em00756k URL [本文引用: 1] 摘要
The mass concentrations and major chemical components of PM(2.5) in Jinan, Shandong Province, China from Dec. 2004 to Oct. 2008 were analyzed using backward trajectory cluster analysis in conjunction with the potential source contribution function (PSCF) model. The aim of this work was to study the inter-annual variations of mass concentrations and major chemical components of PM(2.5), evaluate the air mass flow patterns and identify the potential local and regional source areas that contributed to secondary sulfate and nitrate in PM(2.5) in Jinan. The annual mean concentrations of PM(2.5), sulfate and nitrate in 2004-2008 were almost the highest in the world. The most significant air parcels contributing to the highest mean concentrations of mass and secondary ions in PM(2.5) originated from the industrialized areas of Shandong Province. Clusters with a lower ratio of NO(3)(-)/SO(4)(2-) in PM(2.5) originated from the Yellow Sea, while a higher ratio was observed in the clusters passing through Beijing and Tianjin. PSCF modeling indicated that the provinces of Shandong, Henan, Jiangsu, Anhui and the Yellow Sea were the major potential source regions for sulfate, in agreement with the cluster analysis results. Regional and long-range transport of NH(4)NO(3) played an important role in the nitrate concentration of Jinan. By comparing the distributions of secondary sulfate and nitrate over three years, enhanced emission control management before and during the 29(th) Olympic Games led to a discernible decrease in source contributions from Beijing and its environs in 2007-2008.
|
| [17] |
Modeling the spatio-temporal heterogeneity in the PM10-PM2.5 relationship. https://doi.org/10.1016/j.atmosenv.2014.11.062 URL [本文引用: 1] 摘要
61This study explores the spatio-temporal patterns of particulate matter (PM).61Spatial heterogeneity of the PM data is identified using fuzzy clustering.61PM10-PM2.5 relationship is modeled by GWR and GTWR.61GTWR provides spatio-temporal variations of the PM10-PM2.5 relationship.
|
| [18] |
Social and economic drivers of PM2.5 and their spatial relationship in China. 中国PM2.5污染与社会经济的空间关系及成因 . |
| [19] |
Satellite retrieval of a heavy pollution process in January 2013 in China. https://doi.org/10.13227/j.hjkx.2015.03.006 URL [本文引用: 1] 摘要
利用第三代空气质量模型CMAQ( community multiscale air quality modelling system)模拟的PM2.5垂直分层数据和中尺度气象模型WRF( weather research and forcasting model)模拟的高分辨率湿度数据,分别对MODIS AOD( aerosol optical depth)资料进行垂直与湿度订正,建立了订正后的AOD数据与PM2.5地面监测数据之间的线性拟合模型,其线性相关系数r=0.77( n=57,P﹤0.01).基于此线性拟合模型,首次反演了2013年1月全国10 km分辨率PM2.5月均浓度的空间分布特征,并分析了人口暴露水平.结果表明,2013年1月我国PM2.5月均浓度大于100μg·m-3、200μg·m-3的面积占国土面积的比例分别高达10.99%、1.34%,暴露人口占全国总人口的比例分别高达45.01%、6.31%.
中国2013年1月PM2.5重污染过程卫星反演研究, https://doi.org/10.13227/j.hjkx.2015.03.006 URL [本文引用: 1] 摘要
利用第三代空气质量模型CMAQ( community multiscale air quality modelling system)模拟的PM2.5垂直分层数据和中尺度气象模型WRF( weather research and forcasting model)模拟的高分辨率湿度数据,分别对MODIS AOD( aerosol optical depth)资料进行垂直与湿度订正,建立了订正后的AOD数据与PM2.5地面监测数据之间的线性拟合模型,其线性相关系数r=0.77( n=57,P﹤0.01).基于此线性拟合模型,首次反演了2013年1月全国10 km分辨率PM2.5月均浓度的空间分布特征,并分析了人口暴露水平.结果表明,2013年1月我国PM2.5月均浓度大于100μg·m-3、200μg·m-3的面积占国土面积的比例分别高达10.99%、1.34%,暴露人口占全国总人口的比例分别高达45.01%、6.31%.
|
| [20] |
Estimating ground-level PM2.5 in the eastern using satellite remote sensing. https://doi.org/10.1021/es049352m URL PMID: 15926578 [本文引用: 1] 摘要
An empirical model based on the regression between daily PM2.5 (particles with aerodynamic diameters of less than 2.5 microm) concentrations and aerosol optical thickness (AOT) measurements from the multiangle imaging spectroradiometer (MISR) was developed and tested using data from the eastern United States during the period of 2001. Overall, the empirical model explained 48% of the variability in PM2.5 concentrations. The root-mean-square error of the model was 6.2 microg/m3 with a corresponding average PM2.5 concentration of 13.8 microg/m3. When PM2.5 concentrations greater than 40 microg/m3 were removed, model results were shown to be unbiased estimators of observations. Several factors, such as planetary boundary layer height, relative humidity, season, and other geographical attributes of monitoring sites, were found to influence the association between PM2.5 and AOT. The findings of this study illustrate the strong potential of satellite remote sensing in regional ambient air quality monitoring as an extension to ground networks. With the continual advancement of remote sensing technology and global data assimilation systems, AOT measurements derived from satellite remote sensors may provide a cost-effective approach as a supplemental source of information for determining ground-level particle concentrations.
|
| [21] |
Establishment and application of pollutant Inventory-Chemical Mass Balance (I-CMB) model for source apportionment of PM2.5. 大气PM2.5源解析“源清单化学质量平衡法(I-CMB)”模型的建立与应用 . |
| [22] |
Examination of pollution trends in Santiago de Chile with cluster analysis of PM10 and ozone data. https://doi.org/10.1016/j.atmosenv.2006.03.062 URL [本文引用: 1] 摘要
Because of the high levels of pollution that Santiago de Chile experiences every year in winter, the government has set up an air quality monitoring network. Information from this network is employed to alert people about the quality of air and to enforce several control strategies in order to limit pollution levels. The monitoring network has 8 stations that measure PM 10, carbon monoxide (CO), sulphur dioxide (SO 2), ozone (O 3) and meteorological parameters. Some stations also measure nitrogen mono- and dioxide (NO x), fine particles (PM 2.5) and carbon. In this study we have examined the PM 10 and O 3 data generated by this network in the year 2000 in order to determine the seasonal trends and spatial distribution of these pollutants over a year's period. The results show that concentration levels vary with the season, with PM 10 being higher in winter and O 3 in summer. All but one station, show a peak in PM 10 at 8:00 indicating that during the rush hour there is a strong influence from traffic, however, this influence is not seen during the rest of the day. In winter, the PM 10 maximum occurs at 24:00 h in all stations but Las Condes. This maximum is related to decreased wind speed and lower altitude of the inversion layer. The fact that Las Condes station is at a higher altitude than the others and it does not show the PM 10 increase at night, suggest that the height of the inversion layer occurs at lower altitude. Cluster analysis was applied to the PM10 and O 3 data, and the results indicate that the city has four large sectors with similar pollution behavior. The fact that both pollutants have similar distribution is a strong indication that the concentration levels are primarily determined by the topographical and meteorological characteristics of the area and that pollution generated over the city is redistributed in four large areas that have similar meteorological and topographical conditions.
|
| [23] |
A framework to spatially cluster air pollution monitoring sites in US based on the PM2.5 composition. https://doi.org/10.1016/j.envint.2013.06.003 URL PMID: 3878877 [本文引用: 1] 摘要
61A framework for spatial clustering of sites based on PM2.5 composition is presented.61Sites are grouped using k-means cluster analysis.61Clustering process is guided by specific air pollution characteristics.61Validity based on chemical, geographical and weather characteristics.61Sensitivity analysis confirmed that clustering was robust.
|
| [24] |
Emission inventories of primary particles and pollutant gases for China. https://doi.org/10.1360/972010-1375 URL [本文引用: 1] 摘要
利用政府部门公布的最新数据,包括社会-经济数据、化石燃料和生物质燃料消耗数据等,同时采用一些新的、中国特有的排放因子,计算了中国大陆2007年高时空分辨率的颗粒物及污染气体的排放源清单.计算的年排放量分别是:PM2.51321.2万吨,BC139.9万吨,OC294.6万吨,SO23158.4万吨,NOx2324.8万吨,NH31601.7.0万吨,CO16485.6万吨,VOCs3546.4万吨.计算出的全国和各地区的排放量采用0.5°×0.5°的网格来图示,表明沿海地区及部分中部地区的排放强度明显高于西部地区;部分污染物的排放具有较强的季节性,主要是由于自然因素及居民采暖、农业秸秆的露天焚烧的季节性等所致.分析对比表明,本文计算的排放结果与其他清单基本相当,但在不同污染物分类别的排放量上则不尽相同;估算误差相对以往清单小.
中国区域主要颗粒物及污染气体的排放源清单 .https://doi.org/10.1360/972010-1375 URL [本文引用: 1] 摘要
利用政府部门公布的最新数据,包括社会-经济数据、化石燃料和生物质燃料消耗数据等,同时采用一些新的、中国特有的排放因子,计算了中国大陆2007年高时空分辨率的颗粒物及污染气体的排放源清单.计算的年排放量分别是:PM2.51321.2万吨,BC139.9万吨,OC294.6万吨,SO23158.4万吨,NOx2324.8万吨,NH31601.7.0万吨,CO16485.6万吨,VOCs3546.4万吨.计算出的全国和各地区的排放量采用0.5°×0.5°的网格来图示,表明沿海地区及部分中部地区的排放强度明显高于西部地区;部分污染物的排放具有较强的季节性,主要是由于自然因素及居民采暖、农业秸秆的露天焚烧的季节性等所致.分析对比表明,本文计算的排放结果与其他清单基本相当,但在不同污染物分类别的排放量上则不尽相同;估算误差相对以往清单小.
|
| [25] |
Fine particulate matter (PM2.5) in China at a city level. https://doi.org/10.9734/JSRR/2015/14076 URL [本文引用: 2] 摘要
This work aims to explain seasonal changes in frugivorous bird species richness, abundance and diversity, addressing climatic and habitat variables (rainfall, Photosynthetically Active Radiation as PPDF) and species trait factors (diet), while considering the effect of phylogenetic constraints.Forest Reserve of Chancan, C rdoba Province, Argentina (31 2' S and 65 25' W), during 1995-1996.In the study area two randomly located sampling points separated each other by two km were established. Phenological records for seven forest plant species producing fruits were taken monthly, along with habitat and climatic variables (PPDF, rainfall). Bird sampling was done monthly. Fourteen transects, each of 50 m long were permanently marked from randomly located points in N-S direction. While slowly walking along each transect, all bird sightings as well as hearings both to right and left sides were recorded. The bird species and the vegetation stratum where the sighting occurred were also recorded.For all the bird species and for frugivorous species, bird species richness (S), species abundance as sightings, diversity (Shannon Index H) and evenness (H /lnS) were calculated for each sampling date. Friedman test was used to test differences in species richness and sightings among dates. For frugivorous bird data analysis, two approaches were used, one with the species values taken as independent data points, and the other removing phylogenetic effects by means of the analysis of independent contrasts. Categorical Principal Component Analysis (CATPCA) was used to explore the relationships among species dates of sighting initiation, duration of the sighting period and abundances at peak dates, using species values and independent contrasts. CATPCA (with species values) was also used to explore the relationships among frugivorous bird species richness, abundance and diversity, and climatic (rainfall) and habitat (PPDF and fruit abundance) variables. A total of 67 species were recorded during the sampling period. Richness rose in spring, peaked during summer and then declined smoothly to winter. In contrast, abundance maintained fluctuating values during the sampling period, with a small peak in autumn. There were no significant differences in vegetation strata occupancy by different species of birds, although some groups showed a degree of preference. Considering frugivorous birds, a total of 29 frugivorous species were recorded during the sampling period. The temporal trend of species richness and diversity was similar to the pattern showed by all the species, although abundance showed a bimodal trend. CATPCA using species values and independent contrasts showed common overall results for the variables initiation and maximum of frugivorous species abundance, that were inversely or not correlated with duration of sightings, maximum abundance and total abundance along the sampling period. However, the behaviour of the variable Diet changed when independent contrasts were used. From a closer relationship with sighting initiation and peak and a greater importance with species values data, Diet showed a more distant relationship with these sightings variables and a negligible value when independent contrasts were used. Besides, using independent contrasts many species were differently related with the variables and the dispersion of the species was greater in the ordination space.Regarding climatic and habitat variables, rainfall and PPDF showed an overall similar seasonal pattern, although PPFD began rising earlier during the dry season. Rainfall and PPDF were temporally correlated. Fruits began appearing in spring, peaked during this season, and then decreased sharply to disappear during winter. Fruit abundance was highly correlated with PPFD but not with rainfall. CATPCA of climatic, habitat, and frugivorous bird variables (richness, abundance and diversity) separated spring, summer and autumn sampling dates from the last autumn date and winter dates. PPDF and fruit abundance explained most of the variance in bird richness and diversity but not in abundance. Rainfall did not explain the behaviour of any bird variable.We conclude that habitat characteristics, mainly PPFD and fruit abundance, are shaping the seasonal species composition (richness and diversity), although not abundance, of frugivorous bird assemblages in semiarid Chaco forests. The importance of the frugivorous diet diversification, as a species trait factor that could be contributing to shape the seasonal arrangement of frugivorous birds, was secondary and mainly related to the timing of appearance in the favourable season. However, even this modest contribution of diet diminished when the phylogeny were taken into account, showing a strong phylogenetic signal.
|
| [26] |
Intercomparison between satellite- derived aerosol optical thickness and PM2.5 mass: Implications for air quality studies. https://doi.org/10.1029/2003GL018174 URL [本文引用: 1] 摘要
[1] We explore the relationship between column aerosol optical thickness (AOT) derived from the Moderate Resolution Imaging SpectroRadiometer (MODIS) on the Terra/Aqua satellites and hourly fine particulate mass (PM
|
| [27] |
Numerical study on the characteristics of regional transport of PM2.5 in China.
基于CAMx空气质量模型的颗粒物来源追踪技术(PSAT)定量模拟了全国PM2.5及其化学组分的跨区域输送规律,建立了全国31个省市(源)向333个地级城市(受体)的PM2.5及其化学组分传输矩阵.基于此传输矩阵,从区域、省、城市3个空间尺度解析了PM2.5及其主要组分,包括一次PM2.5、硫酸盐、硝酸盐和铵盐的空间来源.结果表明,跨区域传输对重点区域、省及京津冀典型城市的PM2.5污染均有显著贡献,其中京津冀、长江三角洲、珠江三角洲区域及成渝城市群PM2.5年均浓度受区域外省市的贡献分别达到22%、37%、28%、14%;海南、上海、江苏、浙江、吉林、江西等省PM2.5年均浓度受省外源贡献超过45%;北京、天津、石家庄PM2.5年均浓度受省外源影响分别达到37%、42%、33%.
PM2. 5跨区域传输特征数值模拟研究 .
基于CAMx空气质量模型的颗粒物来源追踪技术(PSAT)定量模拟了全国PM2.5及其化学组分的跨区域输送规律,建立了全国31个省市(源)向333个地级城市(受体)的PM2.5及其化学组分传输矩阵.基于此传输矩阵,从区域、省、城市3个空间尺度解析了PM2.5及其主要组分,包括一次PM2.5、硫酸盐、硝酸盐和铵盐的空间来源.结果表明,跨区域传输对重点区域、省及京津冀典型城市的PM2.5污染均有显著贡献,其中京津冀、长江三角洲、珠江三角洲区域及成渝城市群PM2.5年均浓度受区域外省市的贡献分别达到22%、37%、28%、14%;海南、上海、江苏、浙江、吉林、江西等省PM2.5年均浓度受省外源贡献超过45%;北京、天津、石家庄PM2.5年均浓度受省外源影响分别达到37%、42%、33%.
|
| [28] |
A hybrid approach to estimating national scale spatiotemporal variability of PM2.5 in the contiguous United States. https://doi.org/10.1021/es400039u URL PMID: 23701364 [本文引用: 1] 摘要
Airborne fine particulate matter exhibits spatiotemporal variability at multiple scales, which presents challenges to estimating exposures for health effects assessment. Here we created a model to predict ambient particulate matter less than 2.5 mu m in aerodynamic diameter (PM2.5) across the contiguous United States to be applied to health effects modeling. We developed a hybrid approach combining a land use regression model (LUR) selected with a machine learning method, and Bayesian Maximum Entropy (BME) interpolation of the LUR space-time residuals. The PM2.5 data set included 104,172 monthly observations at 1464 monitoring locations with approximately 10% of locations reserved for cross validation LUR models were based on remote sensing estimates of PM2.5, land use and traffic indicators. Normalized cross validated R-2 values for LUR were 0.63 and 0.11 with and without remote sensing, respectively, suggesting remote sensing is a strong predictor of ground level concentrations In the models including the BME interpolation of the residuals, cross validated R-2 were 0.79 for both configurations; the model without remotely sensed data described more line scale variation than the model including remote sensing. Our results suggest that our modeling framework can predict ground level concentrations of PM2.5 at multiple scales over the contiguous U.S.
|
| [29] |
PM2.5 chemical composition and spatiotemporal variability during the California Regional PM10/PM2.5 Air Quality Study (CRPAQS). https://doi.org/10.1029/2005JD006457 URL 摘要
The 14-month-long (December 1999 to February 2001) Central California Regional PM/PMAir Quality Study (CRPAQS) consisted of acquiring speciated PMmeasurements at 38 sites representing urban, rural, and boundary environments in the San Joaquin Valley air basin. The study's goal was to understand the development of widespread pollution episodes by examining the spatial variability of PM, ammonium nitrate (NHNO), and carbonaceous material on annual, seasonal, and episodic timescales. It was found that PMand NHNOconcentrations decrease rapidly as altitude increases, confirming that topography influences the ventilation and transport of pollutants. High PMlevels from November 2000 to January 2001 contributed to 50-75% of annual average concentrations. Contributions from organic matter differed substantially between urban and rural areas. Winter meteorology and intensive residential wood combustion are likely key factors for the winter-nonwinter and urban-rural contrasts that were observed. Short-duration measurements during the intensive operating periods confirm the role of upper air currents on valley-wide transport of NHNO. Zones of representation for PMvaried from 5 to 10 km for the urban Fresno and Bakersfield sites, and increased to 15-20 km for the boundary and rural sites. Secondary NHNOoccurred region-wide during winter, spreading over a much wider geographical zone than carbonaceous aerosol.
|
| [30] |
Incorporating local land use regression and satellite aerosol optical depth in a hybrid model of spatiotemporal PM2.5 exposures in the Mid-Atlantic states. https://doi.org/10.1021/es302673e URL PMID: 23013112 摘要
Satellite-derived aerosol optical depth (AOD) measurements have the potential to provide spatiotemporally resolved predictions of both long and short-term exposures, but previous studies have generally shown moderate predictive power and lacked detailed high spatio- temporal resolution predictions across large domains. We aimed at extending our previous work by validating our model in another region with different geographical and metrological characteristics, and incorporating fine scale land use regression and nonrandom missingness to better predict PM(2.5) concentrations for days with or without satellite AOD measures. We start by calibrating AOD data for 2000-2008 across the Mid-Atlantic. We used mixed models regressing PM(2.5) measurements against day-specific random intercepts, and fixed and random AOD and temperature slopes. We used inverse probability weighting to account for nonrandom missingness of AOD, nested regions within days to capture spatial variation in the daily calibration, and introduced a penalization method that reduces the dimensionality of the large number of spatial and temporal predictors without selecting different predictors in different locations. We then take advantage of the association between grid-cell specific AOD values and PM(2.5) monitoring data, together with associations between AOD values in neighboring grid cells to develop grid cell predictions when AOD is missing. Finally to get local predictions (at the resolution of 50 m), we regressed the residuals from the predictions for each monitor from these previous steps against the local land use variables specific for each monitor. "Out-of-sample" 10-fold cross-validation was used to quantify the accuracy of our predictions at each step. For all days without AOD values, model performance was excellent (mean "out-of-sample" R(2) = 0.81, year-to-year variation 0.79-0.84). Upon removal of outliers in the PM(2.5) monitoring data, the results of the cross validation procedure was even better (overall mean "out of sample"R(2) of 0.85). Further, cross validation results revealed no bias in the predicted concentrations (Slope of observed vs predicted = 0.97-1.01). Our model allows one to reliably assess short-term and long-term human exposures in order to investigate both the acute and effects of ambient particles, respectively.
|
| [31] |
Source apportionment of PM2.5 organic aerosol over Europe: Primary/secondary, natural/anthropogenic, and fossil/biogenic origin. https://doi.org/10.1029/2006jd008094 URL 摘要
On the basis of a 2-year comprehensive data set obtained within the CARBOSOL project, seasonal source apportionment of PM2.5 aerosol is attempted for five rural/remote sites in Europe. The approach developed combines radiocarbon measurements with bulk measurements of organic carbon (OC), elemental carbon (EC), and two organic tracers (levoglucosan and cellulose). Source types are lumped into primary emissions from fossil fuel combustion and biomass burning, bioaerosol, and secondary organic aerosol from precursors emitted by fossil and nonfossil sources. Bulk concentration ratios reported for these source types in the literature are used to estimate the source contributions which are constrained by measured radiocarbon concentrations. It has been found that while fossil-related sources predominate EC throughout the year at all sites, the sources of OC are primarily biogenic and markedly different between summer and winter. In winter biomass burning primary emission is the main source, with sizable additional contribution from fossil fuel combustion. In contrast, in summer secondary organic aerosol (SOA) from nonfossil sources becomes predominant (63 76% of TC), with some contribution of SOA from fossil fuel combustion. The results agree well with recent findings of other authors who established the predominance of biogenic SOA for rural sites in summer in Europe. An uncertainty analysis has been conducted, which shows that the main conclusions from this study are robust.
|
| [32] |
Spatio-temporal variation of PM2.5 concentrations and their relationship with geographic and socioeconomic factors in China. https://doi.org/10.3390/ijerph110100173 URL PMID: 3924439 摘要
The air quality in China, particularly the PM2.5 (particles less than 2.5 m in aerodynamic diameter) level, has become an increasing public concern because of its relation to health risks. The distribution of PM2.5 concentrations has a close relationship with multiple geographic and socioeconomic factors, but the lack of reliable data has been the main obstacle to studying this topic. Based on the newly published Annual Average PM2.5 gridded data, together with land use data, gridded population data and Gross Domestic Product (GDP) data, this paper explored the spatial-temporal characteristics of PM2.5 concentrations and the factors impacting those concentrations in China for the years of 2001-2010. The contributions of urban areas, high population and economic development to PM2.5 concentrations were analyzed using the Geographically Weighted Regression (GWR) model. The results indicated that the spatial pattern of PM2.5 concentrations in China remained stable during the period 2001-2010; high concentrations of PM2.5 are mostly found in regions with high populations and rapid urban expansion, including the Beijing-Tianjin-Hebei region in North China, East China (including the Shandong, Anhui and Jiangsu provinces) and Henan province. Increasing populations, local economic growth and urban expansion are the three main driving forces impacting PM2.5 concentrations.
|
| [33] |
Estimating regional spatial and temporal variability of PM2.5 Concentrations using satellite data, meteorology, and land use information. https://doi.org/10.1289/ehp.0800123 URL PMID: 19590678 [本文引用: 1] 摘要
Background: Studies of chronic health effects due to exposures to particulate matter with aerodynamic diameters 2.5 m$({\rm PM}_{2.5})$are often limited by sparse measurements. Satellite aerosol remote sensing data may be used to extend${\rm PM}_{2.5}$ground networks to cover a much larger area. Objectives: In this study we examined the benefits of using aerosol optical depth (AOD) retrieved by the Geostationary Operational Environmental Satellite (GOES) in conjunction with land use and meteorologic information to estimate ground-level${\rm PM}_{2.5}$concentrations. Methods: We developed a two-stage generalized additive model (GAM) for U.S. Environmental Protection Agency${\rm PM}_{2.5}$concentrations in a domain centered in Massachusetts. The AOD model represents conditions when AOD retrieval is successful; the non-AOD model represents conditions when AOD is missing in the domain. Results: The AOD model has a higher predicting power judged by adjusted R (0.79) than does the non-AOD model (0.48). The predicted${\rm PM}_{2.5}$concentrations by the AOD model are, on average, 0.8-0.9 g/m higher than the non-AOD model predictions, with a more smooth spatial distribution, higher concentrations in rural areas, and the highest concentrations in areas other than major urban centers. Although AOD is a highly significant predictor of${\rm PM}_{2.5}$, meteorologic parameters are major contributors to the better performance of the AOD model. Conclusions: GOES aerosol/smoke product (GASP) AOD is able to summarize a set of weather and land use conditions that stratify${\rm PM}_{2.5}$concentrations into two different spatial patterns. Even if land use regression models do not include AOD as a predictor variable, two separate models should be fitted to account for different${\rm PM}_{2.5}$spatial patterns related to AOD availability.
|
| [34] |
A distributed network of low-cost continuous reading sensors to measure spatiotemporal variations of PM2.5 in Xi'an, China. https://doi.org/10.1016/j.envpol.2015.01.013 URL PMID: 25618367 [本文引用: 1] 摘要
Fine particulate matter (PM2.5) is a growing public health concern especially in industrializing countries but existing monitoring networks are unable to properly characterize human exposures due to low resolution spatiotemporal data. Low-cost portable monitors can supplement existing networks in both developed and industrializing regions to increase density of sites and data. This study tests the performance of a low-cost sensor in high concentration urban environments. Seven Portable University of Washington Particle (PUWP) monitors were calibrated with optical and gravimetric PM2.5 reference monitors in Xi'an, China in December 2013. Pairwise correlations between the raw PUWP and the reference monitors were high (R 2 =0.86 0.89). PUWP monitors were also simultaneously deployed at eight sites across Xi'an alongside gravimetric PM2.5 monitors (R 2 =0.53). The PUWP monitors were able to identify the High-technology Zone site as a potential PM2.5 hotspot with sustained high concentrations compared to the city average throughout the day.
|
| [35] |
Application of land use regression to estimate long-term concentrations of traffic-related nitrogen oxides and fine particulate matter. https://doi.org/10.1021/es0606780 URL PMID: 17438795 摘要
Land use regression (LUR) is a promising technique for predicting ambient air pollutant concentrations at high spatial resolution. We expand on previous work by modeling oxides of nitrogen and fine particulate matter in Vancouver, Canada, using two measures of traffic. Systematic review of historical data identified optimal sampling periods for NO and N02. Integrated 14-day mean concentrations were measured with passive samplers at 116 sites in the spring and fall of 2003. Study estimates for annual mean NO and NO2 ranged from 5.4-98.7 and 4.8-28.0 ppb, respectively. Regulatory measurements ranged from 4.8-29.7 and 9.0-24.1 ppb and exhibited less spatial variability. Measurements of particle mass concentration (PM2.5) and light absorbance (ABS) were made at a subset of 25 sites during another campaign. Fifty-five variables describing each sampling site were generated in a Geographic Information System (GIS) and linear regression models for NO, NO2, PM2.5, and ABS were built with the most predictive covariates. Adjusted R(2) values ranged from 0.39 to 0.62 and were similar across traffic metrics. Resulting maps show the distribution of NO to be more heterogeneous than that of NO2, supporting the usefulness of this approach for assessing spatial patterns of traffic-related pollution.
|
| [36] |
Fine (PM2.5) and coarse (PM2.5-10) particulate matter on a heavily trafficked London highway: sources and processes. https://doi.org/10.1021/es050462i URL PMID: 16295835 摘要
A large dataset for PM2.5 and PMcoarse (PM2.5-10) concentrations monitored near a busy London highway (Marylebone Road) has been analyzed to define the factors that lead to high concentrations. The following have been highlighted as major influencing parameters: wind speed, prevailing wind direction (because of its role on the microscale dispersion within the street), the daily cycle of the atmospheric boundary layer (stable during the night/ convective and mixed during the day), and traffic density. The mainly diesel heavy-duty vehicles are the main source of fine particulate matter at Marylebone Road. In particular, lorries (trucks) dominate PM10 exhaust emissions which are mainly in the fine (<2.5 microm) size range. A strong correlation with PMcoarse suggests that the heavy-duty traffic is largely responsible for this component also. Substantial local increments in PM2.5 and PMcoarse due to traffic have been estimated and a large part of the increment in PMcoarse concentrations is inferred to arise from resuspended road dust emissions since the contribution of abrasion processes estimated from emission factors is modest. Despite the strong influence of traffic on PM concentrations measured at Marylebone Road the analysis of factors leading to the highest 5% of hourly concentrations of PM10 at Marylebone Road reveals that almost half of these events were due to building works. The other events occurred when all or most of the key factors occurred simultaneously (heavy traffic, poor dispersion, etc.). Some episodes of high PM2.5 concentrations were associated with long-range transport in which the regional PM2.5 constituted most of the local concentrations.
|
| [37] |
GIS-based identification of spatial variables enhancing heat and poor air quality in urban areas. https://doi.org/10.1016/j.apgeog.2011.06.008 URL [本文引用: 1] 摘要
A chemical characterization of different PM fractions complements the GIS based investigations. The analysis of toxicologically relevant components provides information on air quality at urban, suburban and rural sites. The results of the chemical analyses support the results obtained from geo-statistical modeling. It reveals high concentrations of health relevant airborne species like metals and polycyclic aromatic hydrocarbons within the zone of enhanced risk for the coincidence of temperature stress and PM pollution.
|
| [38] |
Association between mortality and indicators of traffic-related air pollution in the Netherlands: A cohort study. https://doi.org/10.1016/S0140-6736(02)11280-3 URL PMID: 12401246 [本文引用: 1] 摘要
Long-term exposure to particulate matter air pollution has been associated with increased cardiopulmonary mortality in the USA. We aimed to assess the relation between traffic-related air pollution and mortality in participants of the Netherlands Cohort study on Diet and Cancer (NLCS), an ongoing study.We investigated a random sample of 5000 people from the full cohort of the NLCS study (age 55-69 years) from 1986 to 1994. Long-term exposure to traffic-related air pollutants (black smoke and nitrogen dioxide) was estimated for the 1986 home address. Exposure was characterised with the measured regional and urban background concentration and an indicator variable for living near major roads. The association between exposure to air pollution and (cause specific) mortality was assessed with Cox's proportional hazards models, with adjustment for potential confounders.489 (11%) of 4492 people with data died during the follow-up period. Cardiopulmonary mortality was associated with living near a major road (relative risk 1.95, 95% CI 1.09-3.52) and, less consistently, with the estimated ambient background concentration (1.34, 0.68-2.64). The relative risk for living near a major road was 1.41 (0.94-2.12) for total deaths. Non-cardiopulmonary, non-lung cancer deaths were unrelated to air pollution (1.03, 0.54-1.96 for living near a major road).Long-term exposure to traffic-related air pollution may shorten life expectancy.
|
| [39] |
Spatial and temporal variation in PM2.5 chemical composition in the United States for health effects studies. https://doi.org/10.1289/ehp.9621 URL PMID: 1913582 [本文引用: 1] 摘要
Although numerous studies have demonstrated links between particulate matter (PM) and adverse health effects, the chemical components of the PM mixture that cause injury are unknown. This work characterizes spatial and temporal variability of PM2.5(PM with aerodynamic diameter < 2.5 μm) components in the United States; our objective is to identify components for assessment in epidemiologic studies. We constructed a database of 52 PM2.5component concentrations for 187 U.S. counties for 2000–2005. First, we describe the challenges inherent to analysis of a national PM2.5chemical composition database. Second, we identify components that contribute substantially to and/or co-vary with PM2.5total mass. Third, we characterize the seasonal and regional variability of targeted components. Strong seasonal and geographic variations in PM2.5chemical composition are identified. Only seven of the 52 components contributed ≥ 1% to total mass for yearly or seasonal averages [ammonium (NH4+), elemental carbon (EC), organic carbon matter (OCM), nitrate (NO361), silicon, sodium (Na+), and sulfate (SO4261)]. Strongest correlations with PM2.5total mass were with NH4+(yearly), OCM (especially winter), NO361(winter), and SO4261(yearly, spring, autumn, and summer), with particularly strong correlations for NH4+and SO4261in summer. Components that co-varied with PM2.5total mass, based on daily detrended data, were NH4+, SO4261,OCM, NO3261, bromine, and EC. The subset of identified PM2.5components should be investigated further to determine whether their daily variation is associated with daily variation of health indicators, and whether their seasonal and regional patterns can explain the seasonal and regional heterogeneity in PM10(PM with aerodynamic diameter < 10 μm) and PM2.5health risks.
|
| [40] |
Spatial-temporal characteristics of the PM2.5 in China in 2014. 2014年中国城市PM2.5浓度的时空变化规律 . |
| [41] |
The spatial characteristics and formation mechanism of the county urbanization in China. https://doi.org/10.11821/xb201208001 URL [本文引用: 1] 摘要
本文综合运用样带、地统计、地理探测器等多种研究方法,分析了1990年以来中国县域城镇化的时空特征及形成机理。研究表明:①中国县域城镇化水平时空动态的差异特征显著,北方边境县域高城镇化和东部沿海县域高城镇化形成的"人字形"空间形态逐渐凸显;以武汉都市圈为中心的两湖地区、成渝地区、关中—天水经济区的县域城镇化水平提升较快,西南地区、青藏高原地区保持较低的城镇化水平;②2000年以来中国县域城镇化水平及其变化速度的区域差异逐渐缩小,陇海兰新线、长江沿线、北方边境、106国道、东部沿海样带县域城镇化差异明显;县域经济发展阶段、固定资产投资、离中心城市距离、二三产业水平、农民人均纯收入、人口密度是影响县域城镇化空间分异的主要因素,同时粮食生产主导定位、非农业人口统计口径、城镇设置标准等因素也影响县域城镇化水平及发展过程。未来城镇化发展应遵循地域差异,凸显主导功能,推进优化与重点发展区的集约型城镇化、耕地与粮食主产区的分流型城镇化、生态与水源保护区的迁移型城镇化,以及园区与城镇近郊区的融入型城镇化,实现城乡土地资源集约利用,促进城镇化进程中人—地—业耦合与协调发展。
中国县域城镇化的空间特征与形成机理 .https://doi.org/10.11821/xb201208001 URL [本文引用: 1] 摘要
本文综合运用样带、地统计、地理探测器等多种研究方法,分析了1990年以来中国县域城镇化的时空特征及形成机理。研究表明:①中国县域城镇化水平时空动态的差异特征显著,北方边境县域高城镇化和东部沿海县域高城镇化形成的"人字形"空间形态逐渐凸显;以武汉都市圈为中心的两湖地区、成渝地区、关中—天水经济区的县域城镇化水平提升较快,西南地区、青藏高原地区保持较低的城镇化水平;②2000年以来中国县域城镇化水平及其变化速度的区域差异逐渐缩小,陇海兰新线、长江沿线、北方边境、106国道、东部沿海样带县域城镇化差异明显;县域经济发展阶段、固定资产投资、离中心城市距离、二三产业水平、农民人均纯收入、人口密度是影响县域城镇化空间分异的主要因素,同时粮食生产主导定位、非农业人口统计口径、城镇设置标准等因素也影响县域城镇化水平及发展过程。未来城镇化发展应遵循地域差异,凸显主导功能,推进优化与重点发展区的集约型城镇化、耕地与粮食主产区的分流型城镇化、生态与水源保护区的迁移型城镇化,以及园区与城镇近郊区的融入型城镇化,实现城乡土地资源集约利用,促进城镇化进程中人—地—业耦合与协调发展。
|
| [42] |
Geodetector: Principle and prospective.
地理探测器: 原理与展望 .
|
| [43] |
Temporal-spatial pattern and contributing factors of urban RBDs in Beijing. https://doi.org/10.11821/dlxb201508003 URL [本文引用: 1] 摘要
城市休闲商务区(RecreationalBusinessDistrict,RBD)作为城市重要的游憩空间,为外来游客和城市居民提供休闲消费的场所,逐渐受到学界和业界重视。目前大多数研究还停留在概念层面,在分类、空间结构、分布规律、分异成因等方面上还缺乏一定的实证和定量研究。结合前人研究经验,重新定义RBD,并依据城市RBD的特征和属性将其分为大型购物中心、休闲商业街、城市休闲区三类。选取1990年、2000年、2014年三个时间截面对北京各类城市RBD点进行统计,采用基尼系数、空间插值、核密度分析、地理探测器等方法,结合ArcGIS软件,对北京城市RBD的时空分布特征和成因进行分析,得出以下结论:①时序上看,北京城市RBD的数量和规模不断增加,增速变快,不同类型的RBD出现不同幅度的空间扩张;②北京城市RBD的空间集聚程度不断加强,不同类型的RBD,存在一定的增幅和增速差异;③北京城市RBD的整体空间结构呈“单核聚集一双核发展一网状扩散”的发展模式;④城市RBD多选址在交通便利、临近旅游景区、居民和游客密度较高、地价相对较高的地区。⑤游客密度对各类型的城市RBD规模均有较大影响;对于不同类型的城市RBD,各因素对其规模的影响也有所不同。
北京城市休闲商务区的时空分布特征与成因 .https://doi.org/10.11821/dlxb201508003 URL [本文引用: 1] 摘要
城市休闲商务区(RecreationalBusinessDistrict,RBD)作为城市重要的游憩空间,为外来游客和城市居民提供休闲消费的场所,逐渐受到学界和业界重视。目前大多数研究还停留在概念层面,在分类、空间结构、分布规律、分异成因等方面上还缺乏一定的实证和定量研究。结合前人研究经验,重新定义RBD,并依据城市RBD的特征和属性将其分为大型购物中心、休闲商业街、城市休闲区三类。选取1990年、2000年、2014年三个时间截面对北京各类城市RBD点进行统计,采用基尼系数、空间插值、核密度分析、地理探测器等方法,结合ArcGIS软件,对北京城市RBD的时空分布特征和成因进行分析,得出以下结论:①时序上看,北京城市RBD的数量和规模不断增加,增速变快,不同类型的RBD出现不同幅度的空间扩张;②北京城市RBD的空间集聚程度不断加强,不同类型的RBD,存在一定的增幅和增速差异;③北京城市RBD的整体空间结构呈“单核聚集一双核发展一网状扩散”的发展模式;④城市RBD多选址在交通便利、临近旅游景区、居民和游客密度较高、地价相对较高的地区。⑤游客密度对各类型的城市RBD规模均有较大影响;对于不同类型的城市RBD,各因素对其规模的影响也有所不同。
|
| [44] |
Analysis on changes of basic climatic elements and extreme events in Xinjiang, China during 1961-2010. |
| [45] |
Inventory of atmospheric pollutants discharged from biomass burning in China continent in 2007.
采用排放因子法计算了中国2007年间CH4、SO2、NOx、NH3、EC、OC、NMVOC、CO、CO2、TSP、PM10、PM2.5的排放总量,建立了生物质燃烧污染物排放清单,计算了各污染物总排放量的空间分布及不同生物质燃烧类型对各污染物总排放量的贡献率,重点完善了各省市生物质燃烧排放不同粒径颗粒物清单.结果显示,2007年我国大陆生物质燃烧排放CH4、SO2、NOx、NH3、OC、EC、NMVOC、CO、CO2、TSP、PM10、PM2.5排放总量分别分为3332.7, 335.3, 951.3, 7754.9, 783.7, 267.7, 6049.6, 76579.6, 743743.7, 7677.8, 6668.9, 4043.7kt.四川、安徽、广西、山东、河南、江苏等地区生物质燃烧各污染物排放量较高,北京、天津、海南、宁夏、青海和西藏等省区各污染物排放量较少.不同地区排放污染物的主要生物质类型存在较大的差异,单位面积排放强度和人均排放量区域间差异显著.人类活动是生物质燃烧排放污染物的主要影响因素,秸秆和薪柴燃烧是污染物排放量最大的2种生物质,其对各种污染物的贡献率为93.8%~98.7%.
2007年中国大陆地区生物质燃烧排放污染物清单 .
采用排放因子法计算了中国2007年间CH4、SO2、NOx、NH3、EC、OC、NMVOC、CO、CO2、TSP、PM10、PM2.5的排放总量,建立了生物质燃烧污染物排放清单,计算了各污染物总排放量的空间分布及不同生物质燃烧类型对各污染物总排放量的贡献率,重点完善了各省市生物质燃烧排放不同粒径颗粒物清单.结果显示,2007年我国大陆生物质燃烧排放CH4、SO2、NOx、NH3、OC、EC、NMVOC、CO、CO2、TSP、PM10、PM2.5排放总量分别分为3332.7, 335.3, 951.3, 7754.9, 783.7, 267.7, 6049.6, 76579.6, 743743.7, 7677.8, 6668.9, 4043.7kt.四川、安徽、广西、山东、河南、江苏等地区生物质燃烧各污染物排放量较高,北京、天津、海南、宁夏、青海和西藏等省区各污染物排放量较少.不同地区排放污染物的主要生物质类型存在较大的差异,单位面积排放强度和人均排放量区域间差异显著.人类活动是生物质燃烧排放污染物的主要影响因素,秸秆和薪柴燃烧是污染物排放量最大的2种生物质,其对各种污染物的贡献率为93.8%~98.7%.
|

/
| 〈 |
|
〉 |