孙斌栋 , 张婷麟
, 张婷麟
SUN Bindong, ZHANG Tinglin
通讯作者:
收稿日期: 2016-02-12
修回日期: 2016-05-6
网络出版日期: 2016-11-28
版权声明: 2016 《地理学报》编辑部 本文是开放获取期刊文献,在以下情况下可以自由使用:学术研究、学术交流、科研教学等,但不允许用于商业目的.
基金资助:
作者简介:
作者简介:孙斌栋(1970-), 男, 河北阜平人, 博士, 教授, 博士生导师, 中国地理学会会员(S110006693M), 主要研究方向为城市地理、城市规划和区域经济。E-mail: bdsun@re.ecnu.edu.cn
展开
摘要
随着中国经济发展和居民生活水平的提升,超重和肥胖问题开始显现,严重影响到居民的身体健康。基于中国家庭追踪调查的全国抽样数据,采用结构方程模型检验社区建成环境对居民个体超重的影响。研究发现,控制社会经济属性后,提高社区人口密度或设施可达性、缩短居民到公交站距离,可以通过减少个体机动化出行倾向而间接降低超重的可能性,但对超重的直接效应及总效应为正。这一结论与西方发达国家的经验不同,因此制定健康政策需要基于中国自身国情和规律,在建成环境方面应重点提高室外空间可步行性和休闲吸引力。
关键词:
Abstract
With the rapid economic development and living condition improvement in China, the problem of obesity becomes increasingly serious and threats to the residents' health. Based on the data of China family panel studies, this study examined the association among community built environment, individual commuting mode choice and overweight of adults with the structural equation model. It is concluded that community built environment has a significant effect on individual commuting mode choice and overweight. After social economic factors are controlled, improving population density and degree of accessibility of facilities, shortening the distance to the nearest bus station will lower the likelihood of overweight by the intermediary role of reducing private motorized commuting; however, the direct and total effects are positive. The latter conclusion contrasts with findings from western developed countries. In order to alleviate the obesity problem of China through geographical perspective, we should make urban planning policy according to China's own conditions and rules.
Keywords:
改革开放以来,随着中国经济发展和生活水平的提升,中国居民平均寿命由1981年的67.77岁增长到2015年的76.34岁;但另一方面,高血压、糖尿病等严重危害人类健康的慢性病发病率呈现上升趋势,健康问题日益严重。十八届五中全会将“健康中国”上升为国家战略,这既是广大民众收入水平提高后对高生活质量的诉求,也是提高国民素质、实现国富民强的必然选择。健康与地理环境的关系密不可分,《黄帝内经》中已阐述了地理环境差异对群体健康产生的不同影响,并指出地理知识对于医生的重要性,“地方病”便是地理环境影响健康的典型例子。现代社会中越来越突出的肥胖问题同样与地理建成环境密切相关。个人体重是能量摄入和能量消耗平衡的结果[1],而建成环境能够通过影响体力活动和食品环境对能量消耗和摄入产生作用,从而进一步影响肥胖和健康。肥胖本身不仅是一种慢性病,而且肥胖患者更容易患高血压、糖尿病等慢性病,对人类健康产生极大威胁。《中国居民营养与慢性病状况报告(2015)》显示,中国成年人超重率在2002-2012年间,由22.8%迅速上升为30.1%,但国内鲜有文献从建成环境视角研究肥胖问题。因此,本文探讨建成环境与出行方式及超重的关系,旨在为“健康中国”战略的政策制定提供科学依据。
建成环境因素主要包括密度、土地利用混合度、设计、距公交站距离和设施可达性[2],可步行性、城市蔓延、食品环境也作为影响肥胖的建成环境因素而经常被考虑[3]。
从已有文献可以看出,建成环境对肥胖的影响主要通过改变出行方式而改变体力消耗实现[4]。通常来说,随着密度的提高,城市紧凑发展,出行方式由私人机动车向公共交通系统、体力型交通转变[5-8],可以降低肥胖风险[9-10],但一项对中国南京的研究表明密度的提高会增加肥胖的可能性[11]。土地混合利用可以增加目的地的可达性,提高使用体力型交通方式的可能性[8, 12],从而降低肥胖风险[13-15]。运用不同方法测度的土地利用混合度,其研究结果不尽相同[16],有研究发现土地混合利用会提高饭店、快餐店的可达性,从而增加体重[17]。在设计方面,对社区附近公园进行改造升级后,公园使用者及其体力活动量均有所提升[18];距公交站距离越近,居民乘坐公交出行的意愿会越高,同时会带动体力型交通方式的使用,从而降低肥胖风险[9, 15-16];居住地附近公共服务设施可达性越高、体系越完善、品质越好,道路连通性越高,都会增加体力型交通出行的概率[19],从而降低肥胖风险[20-21]。可步行性以及城市蔓延是由密度、土地混合利用程度、道路联通性等因素组成的综合变量,用于探讨建成环境对超重和肥胖的影响。可步行性高的街区,会引导居民体力型交通出行,降低肥胖风险[22-23],而城市蔓延则带来城市无序增长,小汽车依赖增强,以至于较高的超重和肥胖风险[24-25],结论并不完全一致[17]。此外,具有较多饭店、快餐店的食品环境则会提高食品或者高热量食品的可接近性,增加肥胖风险[13, 26]。由于建成环境对肥胖的作用可能受到居民“自选择”即对出行方式或者生活态度偏好的影响,部分研究控制了居民对与社区或者交通方式的自选择,不过结论并不统一[27-29]。此外,肥胖问题还受到年龄、性别、种族、收入、社区安全等方面的影响,并且在不同的地域范围,建成环境对肥胖问题的影响也有所差异[16, 26, 28-30]。
综上,目前关于建成环境对肥胖或超重影响的文献主要集中在美国等西方发达国家,对于中国的研究鲜见,中国建成环境及国情与发达国家差别较大[8],并且已有证据显示中国可能具有与发达国家不同的规律[11],因此,国外经验不能直接应用于指导中国实践,迫切需要开展针对中国的专门研究。其次,建成环境通过出行方式影响个体超重是多数研究默认的影响路径,已有研究多采用单方程模型,难以验证该路径的有效性[31],而且也忽视了可能存在的其他影响路径。最后,个体研究往往存在位于一个地理单元内的空间自相关问题,已有研究较少考虑解决这一问题,对结果的真实性造成一定影响[13, 15]。因此,本文基于中国个体数据来探讨建成环境对个体超重的影响,运用结构方程模型来更准确地检验建成环境、出行与超重三者之间的因果关系,采用聚类标准误解决样本个体的空间自相关问题,使研究结论更加稳健可靠。
根据数据可得性,鉴于建成环境、出行方式和超重之间存在复杂的因果关系,本文构建联立的结构方程来检验多个影响路径的存在,即建成环境不仅直接作用于个体超重,还通过出行方式间接作用于个体超重。联立的一个方程检验建成环境对出行方式的影响,另一个方程检验建成环境和出行方式对超重的影响。由于样本个体位于不同的区县,而每个区县内的个体具有空间相关性,故在模型中采用聚类标准误来达到个体独立的统计要求。此外,为了尽可能地减轻自选择所带来的偏误,在模型中加入每日锻炼时间这一变量,以控制居民个体对锻炼的偏好或对体重控制的态度。
本文使用数据全部来自北京大学“985”项目资助、北京大学中国社会科学调查中心执行的中国家庭追踪调查(CFPS),数据共两期,分别收集于2010年与2012年,样本覆盖约占全国总人口(不含港、澳、台)95%的25个省、市、自治区。CFPS抽样方式为多阶段、多层次、与人口规模成比例的概率抽样,第一阶段为行政性区县抽样,第二阶段为行政性村、居委会抽样,前两阶段以社会经济水平作为主要分层变量,保证样本可以反映全国真实经济水平状况;第三阶段为家庭抽样,使用地图地址法,并采用随机起点的循环等距抽样方式抽取样本家庭,可以确定其在村、居委会中的随机分布,因此样本具有全国代表性,适合针对全国个体的微观研究。此套数据包含本研究所需的重要数据,包括建成环境、家庭及个人的经济属性、出行方式行为等数据,满足研究的数据需求。调查的地理单元为较小尺度的村、居委会,适合进行建成环境对居民行为及健康的研究。本文首先选出两期都被访问的成人个体,删除缺失数据样本,最终用于分析的样本包含15356个个体,分布在158个区县中的507个居、村委会。用于分析的变量分为3类,分别为建成环境特征、个人出行特征以及个人或家庭的健康和社会经济特征。
由于数据限制,本文中的建成环境变量包括居/村委会人口密度、设施可达性、城乡属性及居住地距最近公交车站的距离。人口密度由社区常住人口除以社区面积得到。单位面积中各类公共设施的个数越多代表设施越临近、可达性越高,因此,本文用单位面积内公共设施个数代表设施可达性。城乡属性依据国家统计局定义的城乡划分标准,将城区和镇区定义为城镇,其余为乡村。
个人出行特征在本文中主要指出行方式,分为个体机动化与非个体机动化两大类,前者包括小汽车、出租车、摩托车、电动自行车和农用机动车,个体机动化出行方式的体力消耗要低于非个体机动化方式。个体机动化出行被赋值为1,非个体机动化出行被赋值为0。抽样调查中的被调查者汇报了两种出行方式,为了给被调查者的出行方式赋以确定的值,本文假定以下赋值原则,机动化方式优先于非机动化方式,个体机动化方式优先于非个体机动化方式。这样的假定符合中国实际情况,购买小汽车者,通常以自驾车为主要出行方式,有机动化交通工具者,主要出行方式是机动车。
表1给出了各变量的描述性统计。个人健康和社会经济特征包括是否超重、年龄、性别、婚姻、工作状况、饮食状况、家庭人均收入和各类活动时间。根据被调查者报告的身高体重计算身体质量指数(BMI=体重(kg)/身高(m)2),用以衡量居民的肥胖程度,并依据2010年卫生部发布的《营养改善工作管理办法(卫疾控发[2010]73号)》中的标准,对BMI ≥ 24 kg/m2的成年个体定义为超重,样本个体超重比例达到34%,与社会经济统计数据相仿。
表1 变量描述性统计
Tab. 1 Descriptive statistics of variables
| 变量名 | 样本数量 | 均值 | 标准差 | 最大值 | 最小值 | 中值 |
|---|---|---|---|---|---|---|
| 超重(超重=1) | 15356 | 0.34 | 0.47 | 1.00 | 0.00 | 0.00 |
| 人口密度(万人/km2) | 15356 | -1.87 | 2.28 | 7.26 | -9.98 | -2.24 |
| 设施可达性(万个/km2) | 15356 | -6.73 | 2.31 | 2.92 | -15.57 | -7.09 |
| 距最近公交站距离(km) | 15356 | -1.04 | 1.64 | 2.30 | -6.91 | -0.69 |
| 城乡属性(农村=1) | 15356 | 0.48 | 0.50 | 1.00 | 0.00 | 0.00 |
| 年龄(岁) | 15356 | 48.78 | 14.69 | 93.00 | 18.00 | 48.00 |
| 性别(男性=1) | 15356 | 0.49 | 0.50 | 1.00 | 0.00 | 0.00 |
| 婚姻状况(已婚=1) | 15356 | 0.87 | 0.34 | 1.00 | 0.00 | 1.00 |
| 工作状况(工作=1) | 15356 | 0.56 | 0.50 | 1.00 | 0.00 | 1.00 |
| 家庭人均收入(万元) | 15356 | -0.31 | 1.28 | 5.02 | -9.90 | -0.08 |
| 过去一周是否食肉(是=1) | 15356 | 0.85 | 0.35 | 1.00 | 0.00 | 1.00 |
| 过去一周是否吃“垃圾”食品(是=1) | 15356 | 0.31 | 0.46 | 1.00 | 0.00 | 0.00 |
| 日平均通勤时间(h) | 15127 | 0.49 | 0.32 | 1.79 | 0.00 | 0.69 |
| 日平均睡眠时间(h) | 15127 | 2.07 | 0.18 | 2.48 | 1.39 | 2.08 |
| 日平均吃饭时间(h) | 15127 | 0.26 | 0.51 | 1.79 | -2.30 | 0.00 |
由于2012年问卷中并不包含社区尺度的建成环境,首先考虑到建成环境变化速度十分缓慢,2010-2012年间不会发生显著变化;其次,建成环境对超重的影响有一定的滞后性,将建成环境属性滞后更有助于减轻内生性,构造更加符合因果关系作用机制,因此,采用2010年建成环境数据具有合理性。交通出行方式、三类活动时间也未在2012年问卷中给出,考虑生活习惯不会在短期内改变,同样采用2010年数据。超重及其他数据采用2012年口径。由于本文样本选自全国25个省级行政单位,因此其建成环境、社会经济属性均会有较大的差异,统计上呈现出明显右偏态分布,即非正态分布。为避免极值对结果的影响,对连续变量数据进行对数处理以获得较为平稳的数据分布,同时取对数后并不会改变数据的相对大小,因此不会影响研究结果。
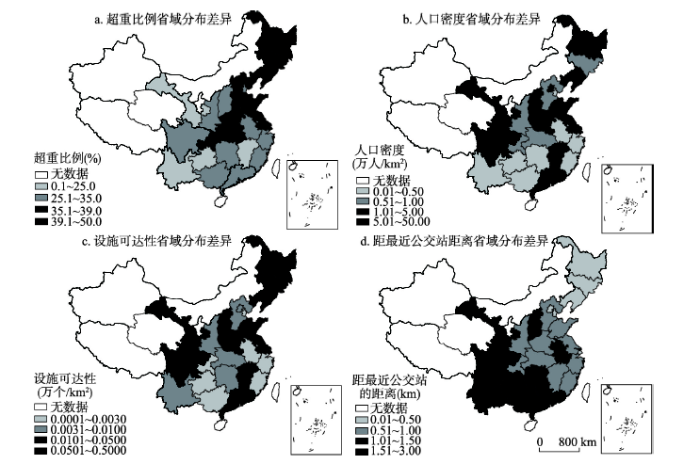
基于问卷数据,图1给出以省为单位的超重比例、人口密度、设施可达性和距最近公交站距离4个变量的空间分布。从图1中可以看出,环渤海湾地区成年人超重比例最高,这一地区对应的社区人口密度和设施可达性也位于高值区,这一相关关系似乎与西方文献中的经验并不一致,不过,更可靠的结论需要多元分析才能得出。距最近公交站距离明显与超重负相关。
由于人口密度和设施可达性之间存在高度共线性,因此,分别把两个变量加入结构方程模型,得到结果(表2,表3)。其中,模型1反映了建成环境对出行方式的影响以及对超重的直接影响,未考虑建成环境通过出行方式对超重产生的间接影响;模型2在对超重的回归中加入出行方式,考虑建成环境通过出行方式对个体超重产生的间接作用;建成环境的差异可能会导致居民生活习惯的分异,而且居民生活习惯同时会影响其是否超重,故模型3在对超重的回归中加入通勤时间、睡眠时间和吃饭时间,以进一步探究建成环境影响超重的路径。从拟合优度来看,3个模型的CFI均大于0.9,RMSEA均小于0.05,表明模型拟合程度较好,而且3个模型的结果基本一致,因此回归结果具有稳健性。
表2 结构方程回归结果(1)
Tab. 2 Regression result of structure equation model (1)
| 模型1 | 模型2 | 模型3 | ||||||
|---|---|---|---|---|---|---|---|---|
| 个体机动化出行 | 超重 | 个体机动化出行 | 超重 | 个体机动化出行 | 超重 | |||
| 人口密度 | -0.043*** | 0.023*** | -0.043*** | 0.026*** | -0.044*** | 0.026*** | ||
| 距最近公交站距离 | 0.026** | -0.020** | 0.026** | -0.022*** | 0.026** | -0.020** | ||
| 农村 | 0.202*** | -0.183*** | 0.202*** | -0.198*** | 0.200*** | -0.193*** | ||
| 年龄 | 0.011** | 0.067*** | 0.011** | 0.066*** | 0.014*** | 0.066*** | ||
| 年龄二次项 | 0.000*** | -0.001*** | 0.001*** | -0.001*** | 0.000*** | -0.001*** | ||
| 男性 | 0.539*** | 0.131*** | 0.539*** | 0.090*** | 0.542*** | 0.074*** | ||
| 已婚 | 0.413*** | 0.108*** | 0.413*** | 0.076** | 0.419*** | 0.079** | ||
| 工作 | 0.146*** | -0.038 | 0.146*** | -0.050* | 0.140*** | -0.050* | ||
| 家庭人均收入 | 0.060*** | 0.048*** | 0.060*** | 0.043*** | 0.062*** | 0.043*** | ||
| 家庭人均收入二次项 | 0.006* | 0.006* | 0.006* | |||||
| 摄入肉类食品 | 0.014 | 0.014 | 0.010 | |||||
| 摄入垃圾食品 | 0.114*** | 0.115*** | 0.118*** | |||||
| 日平均通勤时间 | -0.074* | |||||||
| 日平均睡眠时间 | -0.111* | |||||||
| 日平均吃饭时间 | -0.038 | |||||||
| 个体机动化出行 | 0.076*** | 0.075*** | ||||||
| RMSEA | 0.04 | 0.04 | 0.029 | |||||
| CFI | 0.913 | 0.913 | 0.901 | |||||
| N | 15356 | 15356 | 15127 | |||||
表3 结构方程回归结果(2)
Tab. 3 Regression result of structure equation model (2)
| 模型1 | 模型2 | 模型3 | ||||||
|---|---|---|---|---|---|---|---|---|
| 个体机动化出行 | 超重 | 个体机动化出行 | 超重 | 个体机动化出行 | 超重 | |||
| 设施可达性 | -0.027** | 0.019** | -0.027** | 0.021*** | -0.029*** | 0.020*** | ||
| 距最近公交站距离 | 0.027** | -0.020** | 0.027** | -0.022*** | 0.028** | -0.021** | ||
| 农村 | 0.224*** | -0.190*** | 0.224*** | -0.207*** | 0.221*** | -0.201*** | ||
| 年龄 | 0.011** | 0.067*** | 0.011** | 0.066*** | 0.014*** | 0.066*** | ||
| 年龄二次项 | 0.000*** | -0.001*** | 0.000*** | -0.001*** | 0.000*** | -0.001*** | ||
| 男性 | 0.537*** | 0.131*** | 0.537*** | 0.091*** | 0.540*** | 0.076*** | ||
| 已婚 | 0.413*** | 0.107*** | 0.413*** | 0.077** | 0.419*** | 0.079** | ||
| 工作 | 0.147*** | -0.039 | 0.147*** | -0.049* | 0.142*** | -0.051* | ||
| 家庭人均收入 | 0.055*** | 0.050*** | 0.055*** | 0.046*** | 0.057*** | 0.046*** | ||
| 家庭人均收入二次项 | 0.006* | 0.006* | 0.007* | |||||
| 摄入肉类食品 | 0.014 | 0.014 | 0.010 | |||||
| 摄入垃圾食品 | 0.113*** | 0.113*** | 0.117*** | |||||
| 日平均通勤时间 | -0.074* | |||||||
| 日平均睡眠时间 | -0.115* | |||||||
| 日平均吃饭时间 | -0.038 | |||||||
| 个体机动化出行 | 0.074*** | 0.073*** | ||||||
| RMSEA | 0.04 | 0.04 | 0.029 | |||||
| CFI | 0.913 | 0.913 | 0.902 | |||||
| N | 15356 | 15356 | 15127 | |||||
表2中3个模型的方程1结果都显示,控制社会经济属性后,人口密度、设施可达性与个体机动化出行方式显著负相关,而距最近公交站距离、农村社区则与个体机动化出行方式显著正相关。人口密度大、设施可达性较高的地区,一方面公共交通设施完善,另一方面各类公共设施分布均匀,有利于居民就近出行,因此可选用步行、公交等交通方式,这与大部分文献结论一致[6-8]。家庭住所距最近公交站距离越远,使用公共交通出行越不便利,会驱动居民采取其他出行方式,包括小汽车、助动车等个体机动化出行方式。农村地区由于公共交通设施不完善,因而外出多依靠摩托车、电动自行车等交通工具。
3个模型的方程2显示了建成环境对超重影响。在模型1中,没有控制出行方式对超重的影响,人口密度与超重显著正相关。模型2的方程2加入了出行方式,发现个体机动化出行方式会增加超重可能,与理论预期和以往文献结论一致,不过人口密度仍然与超重正相关,这说明人口密度不仅会通过出行方式间接影响超重,还会通过其他途径影响超重,而且这一影响是正效应。为了探究可能的影响途径,模型3的方程2控制了更多的因素,人口密度仍然显示出对超重的显著正影响,而且系数没有变小,说明人口密度对超重的正向效应还有其他渠道。这一结果与发达国家的研究结果截然相反,在那里的经验多数显示出高密度与较低的超重或肥胖率显著相关,不过一项针对中国南京的个体研究同样发现密度与超重正相关[11],这说明中国可能存在与西方发达国家不同的规律。关于其中原因分析将在后面的讨论中进一步展开。表2结果也显示,距最近公交站距离越大,超重概率越低,即使控制了个体机动化出行方式依然如此,这个结果也与西方发达国家研究结果相左。农村地区居民有较低的超重可能性,原因可能是农村地区居民从事较多的体力型工作,有更多的户外活动时间,而且在饮食方面趋向于低脂低油。
自选择是影响出行方式及超重的一个重要因素,本文控制了与超重关系更为直接的锻炼时间,结果表明自选择并不会改变上述建成环境对超重的影响。
表3汇报了将人口密度替换为设施可达性的结果,可达性越高,居民超重概率越高,同样与西方发达国家研究结果不相符[14],其原因也将在后文中进一步分析。表2、表3同时报告了个人家庭社会经济属性对于超重及出行方式的影响。性别方面,男性超重可能性显著高于女性,即使控制了个体机动化出行方式也如此。就业人群一方面更可能选择个体机动化出行而增加超重可能,但另一方由于在通勤、工作中会有更多的体力消耗而降低了超重的可能。相比于未婚者,已婚者超重概率和个体机动化出行概率也更大。家庭人均收入水平的一次项和二次项都与个体机动化出行正相关,呈U型曲线关系,不过二次曲线顶点左侧样本数远远少于右侧,因而可以基本认为人均收入水平与超重呈现正相关。年龄对超重的影响呈现非线性关系,中年人超重概率最大,这是因为中年人生活节奏更快,运动时间不足。反映饮食习惯的变量中,过去一周有垃圾食品摄入会增加超重可能,而过去一周是否有肉类摄入与超重无关,这是因为中国现阶段的居民多数都有肉食摄入。表征生活状况的3个变量中,长时间通勤、充足的睡眠时间会降低超重,均与预期相符。
以上结果显示,居住在较高人口密度和设施可达性社区的居民,拥有较高的超重概率,这与西方发达国家的大多数研究结果截然相反,因而有必要进一步讨论其结果的可靠性以及原因所在。首先要排除与密度和设施可达性相关的竞争性假设。因为本文研究对象为全国范围的跨城市样本,不同地区的社区在收入和城市化发展阶段上存在显著差异,在中国当前收入和城市化水平快速提高的发展阶段,收入和城市化水平较高的社区,其居民往往因营养较好、接触高热量西式快餐的概率较大、生活压力较大和静态活动时间较多等原因而具有更高的超重可能。如果排除收入和城市化水平对超重的影响之后,密度和设施可达性仍然对超重具有显著正影响,那么密度和设施可达性的作用才可以真正被确认。城市化水平一方面从社区属性即城市社区还是农村社区可以得到区分,关于这一点在前面结果中已有阐述;另一方面,由于调查问卷出于数据保密的原因没有给出个体所在城市,因而无法得到城市化水平数据,但城市化水平与收入显著正相关,这是公认的事实,因而可以根据收入和其他相关生活状态数据来间接反映出来。因此,表4按照密度高低,将样本均分为3部分,对比不同密度地区居民的社会经济属性差异后显示,中国高密度地区往往是经济发展水平较高的地区,居民收入也相应较高,营养条件更好,在饮食方面倾向于高脂肪、高热量食品,外出就餐频率较高;在生活状态方面,静态活动时间较多,睡眠时间较少;在出行方式上也与低密度地区有显著差异。这些因素也都与城市化发展阶段有直接联系,并且根据本文统计检验结果都会对超重概率产生一定的影响。同理,表4也显示低密度地区72%的居民来自于农村社区,符合实践认知。所有这些因素都会对密度和设施可达性的显著作用产生竞争。为了剥除这些因素的影响,获得密度和设施可达性的真实作用,在前文的实证模型中对城乡属性及上述因素变量都进行了控制,发现部分因素确实对超重产生一定作用,但密度和设施可达性与超重的显著正相关依然存在,说明密度这种影响是可靠的,收入和城市化发展阶段即使影响个体超重,但不会改变密度和设施可达性的作用。
表4 不同密度地区被调查居民的社会经济属性差异
Tab. 4 Social and economic characteristics of respondents in differently dense areas
| 变量名 | 高密度地区 | 中等密度地区 | 低密度地区 |
|---|---|---|---|
| 农村 | 0.22 | 0.50 | 0.72 |
| 家庭人均收入(万元) | 0.00 | -0.43 | -0.51 |
| 过去一周是否食肉 (是=1) | 0.88 | 0.85 | 0.83 |
| 过去一周是否吃“垃圾”食品(是=1) | 0.32 | 0.33 | 0.29 |
| 个体机动化出行(是=1) | 0.35 | 0.46 | 0.49 |
| 日平均通勤时间(h) | 0.50 | 0.48 | 0.49 |
| 日平均睡眠时间(h) | 2.04 | 2.08 | 2.08 |
| 日平均吃饭时间(h) | 0.21 | 0.32 | 0.26 |
| 高频率外出就餐(是=1) | 0.20 | 0.12 | 0.11 |
| 日平均静态活动时间(h) | 1.19 | 1.03 | 0.96 |
| 日平均锻炼时间(h) | 0.45 | 0.44 | 0.45 |
密度影响超重的机制存在多个路径。密度高的社区会减少个体机动化出行乃至降低超重风险,这一点在模型结果中得到验证。但表4显示高密度社区居民的吃饭、睡眠时间更短,医学结果显示,吃饭速度快和睡眠时间短都会增加体重;高密度社区还会因为空间限制,在家静态活动时间变长,或者由于具有更密集的饮食设施而增加外出就餐频率,这些都会导致体重增加;把这些变量加入模型后,并不影响密度正显著的结果。其中,外出就餐频率、运动锻炼活动时间和在家静态活动时间3个变量会因为与吃饭和睡眠时间两个变量共线,导致结构模型拟合出现问题,因而需要单独放入,篇幅限制这里不给出具体结果。
还有一个路径不能忽视,即高密度地区各类生活设施临近,可达性高,因此导致居民非刚性出行距离减少,在既定的出行方式下,体力消耗降低,导致超重可能性增加,这也是外文文献中忽视的一点。在本文模型中加入数据可得的通勤时间变量,发现与超重显著负相关,说明通勤时间越长,体力消耗越大,因而降低超重风险,这在一定程度上支持了上述路径的存在。不过通勤时间不能反映出行距离,也不能反映所有的户外活动范围和活动距离,因而将来在数据可得的情况下还需进一步验证。日本的一个研究也表明人口密度与体力活动量成反比[32]。
这样一来,密度通过出行影响超重存在两个相反的作用机制,一方面,高密度会减少个体机动化出行而降低超重可能;另一方面,高密度还会减少出行和活动距离而增加超重风险。但西方发达国家的结果是,密度对超重的综合效应为负,而本文关于中国的研究结果与其相反,这与中外国情不同有关。西方发达国家郊区化导致部分社区密度非常低,高度依赖于小汽车出行,当提高密度时,出行方式会由小汽车转为非机动化出行,体力消耗增加超过了因为出行距离变短导致的消耗减少效应,因而密度的综合效应为负。而中国社区密度本身就很高,进一步提高密度对出行方式的改变有限;而且当今阶段中国小汽车出行具有刚性需求特点,人口密度提高对减少个体机动化出行的弹性较低,这两点可以通过模型中方程1的密度系数较小得到验证。再者,中国的经济发展水平决定采用小汽车、出租车等个体机动化出行的比例远远低于西方发达国家,样本显示仅为7.89%,而中国公交出行比重相对较高,对本文的样本进一步分析发现,虽然提高密度会降低个体机动化出行,但会增加公交出行概率,公交出行的体力消耗要低于步行和自行车。总之,提高中国社区人口密度虽然可以降低个体机动化出行和超重的可能性,但效应较低,这使得密度对超重的综合影响效应为正。
与人口密度类似,较高的设施可达性虽然降低了个体机动化出行可能,降低了超重可能,但较高的设施高可达性也缩短了出行距离,从而减少了出行中的体力消耗,导致较高的超重概率,后者效应大于前者导致了设施可达性对超重的净效应为正。
距最近公交站距离的增加会降低公交出行可能性,增加个体机动化出行概率,考虑到中国个体机动化出行比重总体水平较低,这一路径导致的超重增加效应不高。而进一步数据显示,距最近公交站距离的增加还会提高非机动化出行可能性,降低超重风险,这一降低效应大于前者增加效应应该是导致最终综合效应显著为负的原因。
本文采用结构方程探讨建成环境对于超重的影响。结果显示,与西方发达国家截然不同的是,提高中国社区人口密度和设施可达性,以及使公交站临近居民,都会增加超重的可能性。其机制在于,较高的人口密度和设施可达性虽然会减少个体机动化出行而降低超重风险,但同时也可能降低出行和活动距离而减少体力消耗,在中国本身密度较高和小汽车出行比重相对较低的情况下,前者效应弱于后者,导致最终效应是增加超重的可能。后一效应在理论上是存在的,不过由于缺乏数据,本文并没能给出实证支持。同样的道理,距最近公交站距离越近,出行体力消耗越少,也会提高超重可能性。
本文结论的启示:① 中国国情不同于西方国家,制定健康政策不能盲目照搬西方经验,应基于自身发展规律。具体来说,在城市规划中不能通过提高密度来达到减少肥胖的目的,基于中国室外公共空间步行友好性还存在很多不足,应该在提高可步行性和增加休闲吸引力方面下功夫。② 中国与西方的经验都表明,个体机动化出行方式会显著提高超重概率,因此与西方政策取向相同的是,需要倡导居民采用公共交通及体力型交通出行,在规划中增加公交专用道、自行车道以及美化人行道。
The authors have declared that no competing interests exist.
| [1] |
The energy balance equation: Looking back and looking forward are two very different views. https://doi.org/10.1111/j.1753-4887.2009.00197.x URL PMID: 19386028 [本文引用: 1] 摘要
The energy balance equation has served as an important tool for the study of bioenergetics. It is based on one of the most fundamental properties of thermodynamics and has been invaluable in understanding the interactions of energy intake, energy expenditure, and body composition. Recently, however, the obesity epidemic has extended the use of the equation to the creation of public health messages for preventing or even reversing secular trends in body mass index. This usage often fails to consider how changes in any one term of the equation can lead to accommodations in one or both of the other two terms. It is concluded that research and public health messages should not simply consider how interventions affect just energy expenditure or energy intake, but rather how they affect the balance or gap between energy intake and expenditure.
|
| [2] |
Travel demand and the 3Ds: Density, diversity, and design. https://doi.org/10.1016/S1361-9209(97)00009-6 URL [本文引用: 1] 摘要
The built environment is thought to influence travel demand along three principal dimensions —density, diversity, and design. This paper tests this proposition by examining how the ‘3Ds’ affect trip rates and mode choice of residents in the San Francisco Bay Area. Using 1990 travel diary data and land-use records obtained from the U.S. census, regional inventories, and field surveys, models are estimated that relate features of the built environment to variations in vehicle miles traveled per household and mode choice, mainly for non-work trips. Factor analysis is used to linearly combine variables into the density and design dimensions of the built environment. The research finds that density, land-use diversity, and pedestrian-oriented designs generally reduce trip rates and encourage non-auto travel in statistically significant ways, though their influences appear to be fairly marginal. Elasticities between variables and factors that capture the 3Ds and various measures of travel demand are generally in the 0.06 to 0.18 range, expressed in absolute terms. Compact development was found to exert the strongest influence on personal business trips. Within-neighborhood retail shops, on the other hand, were most strongly associated with mode choice for work trips. And while a factor capturing ‘walking quality’ was only moderately related to mode choice for non-work trips, those living in neighborhoods with grid-iron street designs and restricted commercial parking were nonetheless found to average significantly less vehicle miles of travel and rely less on single-occupant vehicles for non-work trips. Overall, this research shows that the elasticities between each dimension of the built environment and travel demand are modest to moderate, though certainly not inconsequential. Thus it supports the contention of new urbanists and others that creating more compact, diverse, and pedestrian-orientated neighborhoods, in combination, can meaningfully influence how Americans travel.
|
| [3] |
The built environment and obesity. URL PMID: 32820133725232022567292223222217533172814059645358781727800 [本文引用: 1] |
| [4] |
The built environment and human activity patterns: Exploring the impacts of urban form on public health. |
| [5] |
How the built environment affects physical activity: Views from urban planning. https://doi.org/10.1016/S0749-3797(02)00475-0 URL PMID: 12133739 [本文引用: 1] 摘要
The link between the built environment and human behavior has long been of interest to the field of urban planning, but direct assessments of the links between the built environment and physical activity as it influences personal health are still rare in the field. Yet the concepts, theories, and methods used by urban planners provide a foundation for an emerging body of research on the relationship between the built environment and physical activity. Recent research efforts in urban planning have focused on the idea that land use and design policies can be used to increase transit use as well as walking and bicycling. The development of appropriate measures for the built environment and for travel behavior is an essential element of this research. The link between the built environment and travel behavior is then made using theoretical frameworks borrowed from economics, and in particular, the concept of travel as a derived demand. The available evidence lends itself to the argument that a combination of urban design, land use patterns, and transportation systems that promotes walking and bicycling will help create active, healthier, and more livable communities. To provide more conclusive evidence, however, researchers must address the following issues: An alternative to the derived-demand framework must be developed for walking, measures of the built environment must be refined, and more-complete data on walking must be developed. In addition, detailed data on the built environment must be spatially matched to detailed data on travel behavior.
|
| [6] |
the role of land use in travel mode choice: Evidence from Boston and Hong Kong. https://doi.org/10.1080/01944360408976383 URL [本文引用: 1] 摘要
This paper presents a study that analyzed the influence of land use on travel mode choice using survey data from metropolitan Boston and Hong Kong. In Boston, the focus of inquiry was on whether land use would still matter for mode choice when mode attributes and traveler socioeconomic factors were taken into account. In Hong Kong, where the role of land use in mode choice is obvious due to the densely built environment, the focus was on whether land use completely explained the transit-dominated travel pattern. Empirical modeling confirmed that the role of land use in influencing travel was independent from travel time and monetary costs. Elasticity estimates show that the composite effect of land use on driving could be comparable in magnitude to that of driving cost. Yet, being place specific, land use strategies are limited by the spatial extent to which they can be implemented. Land use strategies influence travel more effectively when complemented by pricing policies.
|
| [7] |
Impacts of mixed use and density on utilization of three modes of travel: Single-occupant vehicle, transit, and walking. URL 摘要
Findings from an empirical analysis to test the impacts of land-use mix, population density, and employment density on the use of the single-occupant vehicle (SOV), transit, and walking for both work trips and shopping trips are presented. The hypothetical relationships tested focused on whether there is a relationship between urban form and modal choice, whether this relationship exists when controlling for non-urban form factors, whether this relationship is linear or nonlinear, and whether a stronger relationship exists between modal choice and urban form when they are measured at both trip ends as opposed to either the origin or the destination. A review of the literature and experiences suggested that a fair amount of information is known about the impacts of density on mode choice. However, considerable debate exists over whether density itself is actually the causal stimulus or a surrogate for other factors. To address this issue a data base was developed with a comprehensive set of variables for which density may be a proxy, for example, demographics and level of service. This analysis employed a correlational research design in which mode choice was compared among census tracts with differing levels of density and mix. Findings from this research indicate that density and mix are both related to mode choice, even when controlling for non-urban form factors for both work trips and shopping trips. Furthermore, the relationship between population and employment density and mode choice for SOV, transit, and walking is nonlinear for both work and shopping trips. Transit usage and walking increase as density and land-use mix increase, whereas SOV usage declines. The findings from this research suggest that measuring urban form at both trip ends provides a greater ability to predict travel choices than looking at trip ends separately. The findings also suggest that increasing the level of land-use mix at the trip origins and destinations is also related to a reduction in SOV travel and an increase in transit and walking.
|
| [8] |
Impact of urban built environment on residential choice of commuting mode: A case study of Shanghai. https://doi.org/10.11821/dlxb201510010 URL Magsci [本文引用: 4] 摘要
<p>伴随中国快速城市化与机动化进程,私人汽车拥有量不断增长,由此引起的交通拥堵和环境问题已成为制约中国城市可持续发展的难题。基于上海市区的居民通勤问卷调查数据,采用多项Logit模型检验了街道尺度城市建成环境对于居民通勤方式选择的影响,结果表明,在控制了其他因素后,提高居住地的人口密度、土地利用混合度与十字路口比重,可以减少小汽车通勤方式的选择,而就业地建成环境对居民通勤方式选择影响相对较弱;建成环境对通勤方式选择的影响会因个体的社会经济异质性而不同。这些结论为通过优化土地利用规划来优化居民通勤结构的城市交通和城市规划政策提供了启示。</p>
上海城市建成环境对居民通勤方式选择的影响 .https://doi.org/10.11821/dlxb201510010 URL Magsci [本文引用: 4] 摘要
<p>伴随中国快速城市化与机动化进程,私人汽车拥有量不断增长,由此引起的交通拥堵和环境问题已成为制约中国城市可持续发展的难题。基于上海市区的居民通勤问卷调查数据,采用多项Logit模型检验了街道尺度城市建成环境对于居民通勤方式选择的影响,结果表明,在控制了其他因素后,提高居住地的人口密度、土地利用混合度与十字路口比重,可以减少小汽车通勤方式的选择,而就业地建成环境对居民通勤方式选择影响相对较弱;建成环境对通勤方式选择的影响会因个体的社会经济异质性而不同。这些结论为通过优化土地利用规划来优化居民通勤结构的城市交通和城市规划政策提供了启示。</p>
|
| [9] |
DiezRoux A V, Freeman L M, et al. The urban built environment and obesity in New York City: A multilevel analysis. |
| [10] |
The link between obesity and the built environment: Evidence from an ecological analysis of obesity and vehicle miles of travel in California. https://doi.org/10.1016/j.healthplace.2005.09.001 URL PMID: 16253540 [本文引用: 1] 摘要
Conclusion : This analysis adds to the growing evidence supporting the association between VMT (a measure of automobile transportation) and obesity. An urban design characterized by over dependence on motorized transportation may be related to adverse health effects.
|
| [11] |
Residential density and adolescent overweight in a rapidly urbanising region of mainland China. URL PMID: 3289072800100402549339292223222219858540814032923872579665583 [本文引用: 3] |
| [12] |
Built environments and mode choice: Toward a normative framework. https://doi.org/10.1016/S1361-9209(01)00024-4 URL [本文引用: 1] 摘要
Compact, mixed-use, and walk-friendly urban development, many contend, can significantly influence the modes people choose to travel. Despite a voluminous empirical literature, most past studies have failed to adequately specify relationships for purposes of drawing inferences about the importance of built-environment factors in shaping mode choice. This paper frames the study of mode choice in Montgomery County, Maryland around a normative model that weighs the influences of not only three core dimensions of built environments – density, diversity, and design – but factors related to generalized cost and socio-economic attributes of travelers as well. The marginal contributions of built-environment factors to a traditionally specified utility-based model of mode choice are measured. The analysis reveals intensities and mixtures of land use significantly influence decisions to drive-alone, share a ride, or patronize transit, while the influences of urban design tend to be more modest. Elasticities that summarize relationships are also presented, and recommendations are offered on how outputs from conventional mode-choice models might be “post-processed” to better account for the impacts of built environments when testing land-use scenarios.
|
| [13] |
Built environment, adiposity, and physical activity in adults aged 50-75. https://doi.org/10.1016/j.amepre.2008.03.021 URL PMID: 2459142 Magsci [本文引用: 3] 摘要
<h4 id="absSec_N415a8bd0N36131228">Background</h4><p id="simple-para0025">Few studies have investigated the built environment and its association with health—especially excess adiposity—and physical activity in the immediate pre-Baby Boom/early-Baby Boom generations, soon to be the dominant demographic in the U.S. The purpose of this study was to examine this relationship.</p><h4 id="absSec_N415a8bd0N36131288">Methods</h4><p id="simple-para0030">This study used a cross-sectional, multilevel design with neighborhoods as the primary sampling unit (PSU). Residents (N=1221; aged 50–75) were recruited from 120 neighborhoods in Portland OR. The independent variables at the PSU level involved GIS-derived measures of land-use mix, distribution of fast-food outlets, street connectivity, access to public transportation, and green and open spaces. Dependent variables included resident-level measures of excess adiposity (BMI ≥25), three walking activities, and physical activity. Data were collected in 2006–2007 and analyzed in 2007.</p><h4 id="absSec_N415a8bd0N361312e8">Results</h4><p id="simple-para0035">Each unit (i.e., 10%) increase in land-use mix was associated with a 25% reduction in the prevalence of overweight/obesity. However, a 1-SD increase in the density of fast-food outlets was associated with a 7% increase in overweight/obesity. Higher mixed-use land was positively associated with all three types of walking activities and the meeting of physical activity recommendations. Neighborhoods with high street connectivity, high density of public transit stations, and green and open spaces were related in varying degrees to walking and the meeting of physical activity recommendations. The analyses adjusted for neighborhood- and resident-level sociodemographic characteristics.</p><h4 id="absSec_N415a8bd0N36131348">Conclusions</h4><p id="simple-para0040">Findings suggest the need for public health and city planning officials to address modifiable neighborhood-level, built-environment characteristics to create more livable residential communities aimed at both addressing factors that may influence unhealthy eating and promoting active, healthy lifestyles in this rapidly growing population.</p>
|
| [14] |
Walkability and body mass index. https://doi.org/10.1016/j.amepre.2008.05.028 URL Magsci [本文引用: 1] 摘要
<h4 id="absSec_N33676650N34072a28">Background</h4><p id="simple-para0055">Rising rates of overweight and obesity in the U.S. have increased interest in community designs that encourage healthy weight. This study relates neighborhood walkability—density, pedestrian-friendly design, and two novel measures of land-use diversity—to residents' excess weight.</p><h4 id="absSec_N33676650N34072a88">Methods</h4><p id="simple-para0060">Walkable-environment measures include two established predictors—higher density and pedestrian-friendly design (intersections within 0.25 mile of each address)—and two new census-based, land-use diversity measures: the proportion of residents walking to work and the median age of housing. In 2006, weight, height, age, and address data from 453,927 Salt Lake County driver licenses for persons aged 25–64 years were linked to 2000 Census and GIS street-network information that was analyzed in 2007–2008. Linear regressions of BMI and logistic regressions of overweight and obesity include controls for individual-level age and neighborhood-level racial/ethnic composition, median age of residents, and median family income.</p><h4 id="absSec_N33676650N34072ae8">Results</h4><p id="simple-para0065">Increasing levels of walkability decrease the risks of excess weight. Approximately doubling the proportion of neighborhood residents walking to work decreases an individual's risk of obesity by almost 10%. Adding a decade to the average age of neighborhood housing decreases women's risk of obesity by about 8% and men's by 13%. Population density is unrelated to weight in four of six models, and inconsistently related to weight measures in two models. Pedestrian-friendly street networks are unrelated to BMI but related to lower risks of overweight and obesity in three of four models.</p><h4 id="absSec_N33676650N34072b48">Conclusions</h4><p id="simple-para0070">Walkability indicators, particularly the two land-use diversity measures, are important predictors of body weight. Driver licenses should be considered as a source of data for community studies of BMI, as they provide extensive coverage at low cost.</p>
|
| [15] |
Mixed land use and walkability: Variations in land use measures and relationships with BMI, overweight, and obesity. https://doi.org/10.1016/j.healthplace.2009.06.008 URL [本文引用: 3] 摘要
Few studies compare alternative measures of land use diversity or mix in relationship to body mass index. We compare four types of diversity measures: entropy scores (measures of equal distributions of walkable land use categories), distances to walkable destinations (parks and transit stops), proxy measures of mixed use (walk to work measures and neighborhood housing ages), and land use categories used in entropy scores. Generalized estimating equations, conducted on 5000 randomly chosen licensed drivers aged 25-64 in Salt Lake County, Utah, relate lower BMIs to older neighborhoods, components of a 6-category land use entropy score, and nearby light rail stops. Thus the presence of walkable land uses, rather than their equal mixture, relates to healthy weight.
|
| [16] |
Mixed land use and obesity: An empirical comparison of alternative land use measures and geographic scales. https://doi.org/10.1080/00330124.2011.583592 URL PMID: 3365604 [本文引用: 3] 摘要
Obesity is a growing epidemic in the United States. Walkable neighborhoods, characterized as having the three Ds of walkability (population , land use , and pedestrian-friendly ), have been identified as a potentially promising factor to prevent obesity for residents. Past studies examining the relationship between obesity and walkability vary in geographic scales of neighborhood definitions and methods of measuring the three Ds. To better understand potential influences of these sometimes arbitrary choices, we test how four types of alternative measures of land use diversity measured at three geographic scales relate to body mass index for 4,960 Salt Lake County adults. Generalized estimation equation models demonstrate that optimal diversity measures differed by gender and geographic scale and that integrating walkability measures at different scales improved the overall performance of models.
|
| [17] |
Food environment, built environment, and women's BMI: Evidence from Erie County, New York. https://doi.org/10.1177/0739456X10367804 URL [本文引用: 2] 摘要
The authors present the results of a neighborhood-scaled exploratory study that tests the association of the food environment and the built environment with women’s body mass index (BMI) in Erie County, New York. The proximity of women’s homes to a supermarket relative to a convenience store is associated with lower BMI. A diverse land use mix in a neighborhood is positively associated with women’s BMI, especially when restaurants dominate nonresidential land use. The article offers suggestions for how food environments may be improved using planning strategies.
|
| [18] |
Park improvements and park activity: A natural experiment. https://doi.org/10.1016/j.amepre.2012.02.015 URL PMID: 22608379 Magsci [本文引用: 1] 摘要
Background: Parks are an important setting for leisure-time physical activity. Understanding how to attract residents to parks and encourage park users to be physically active is an important public health initiative. Natural experiments are a research priority for investigating whether changes to the physical environment affect physical activity; however, natural experiments involving parks have rarely been conducted.<br/>Purpose: This natural experiment examined whether improvements to a park in Victoria, Australia, increased its use and park-based physical activity of users.<br/>Methods: Observational data were collected on park use and park-based activity among park users at the intervention park and a control park at three time points; baseline (T1, August 2009); post-improvement (T2, March 2010); and 12 months after baseline (T3, August 2010). At each time point, observations were undertaken during three 1.5-hour periods each day on 9 days. Analyses were conducted in 2011.<br/>Results: In the intervention park, there were significant increases from pre- to post-improvement in the number of park users (T1 = 235, T3 = 985) and the number of people observed walking (T1 = 155, T3 = 369) and being vigorously active (T1 = 38, T3 = 257). At the control park, counts of usage decreased over the same period and no differences in walking or vigorous activity were observed.<br/>Conclusions: Improving the features of a local neighborhood park may lead to increased usage and physical activity. (Am J Prev Med 2012; 42(6):616-619) Crown Copyright (C) 2012 Published by Elsevier Inc. on behalf of American Journal of Preventive Medicine
|
| [19] |
Self-selection in the relationship between the built environment and walking: Empirical evidence from Northern California. |
| [20] |
How does the built environment relate to body mass index and obesity prevalence among public housing residents? https://doi.org/10.4278/ajhp.22.3.187 URL PMID: 18251120 [本文引用: 1] 摘要
Abstract PURPOSE: This study examined associations of environmental variables with obesity prevalence and individual body mass index (BMI) among impoverished residents of public housing developments. DESIGN: Cross-sectional data were drawn from two studies in the same Midwestern metropolitan area of participants within neighborhoods. SETTING: Pathways to Health interviewed housing development residents and Understanding Neighborhood Determinants of Obesity assessed built environment factors in the surrounding neighborhoods (i.e., 800-m radius from center of housing development). SUBJECTS: Four hundred twenty-one residents participated (mean age = 43.8 years; 72.0% women, 59.6% high school degree, 79.6% African-American). Fifty-five physical activity resources were identified and assessed. MEASURES: Demographics and measured weights and heights were obtained for participants. The Physical Activity Resource Assessment measured the type, accessibility, features, amenities, qualities, and incivilities of physical activity resources. Neighborhood street connectivity was also measured. RESULTS: Average age-adjusted BMI was 31.4 (SD = 1.3), with 45% of residents obese. High negative correlations were found between BMI and street connectivity (p = .05) and between obesity prevalence and resource accessibility (p = .09), number of amenities (p = .04), and amenity quality (p = .04). Higher resource accessibility, feature quality, number of amenities, and fewer incivilities per resource accounted for 71% of obesity variance (p < .05). Male gender and higher feature quality, F(11, 407) 37.19 and 12.66, p < .001, predicted lower BMI among residents. CONDUSION: Supportive neighborhood environments were related to lower obesity prevalence and lower BMI among residents.
|
| [21] |
Understanding the independent and joint associations of the home and workplace built environments on cardiorespiratory fitness and body mass index. American Journal of |
| [22] |
Active community environments and health: The relationship of walkable and safe communities to individual health. https://doi.org/10.1080/01944360608976721 URL [本文引用: 1] 摘要
Walkability and safety are key elements of active community environments. This study examines the relationship of walkable and safe environments to indicators of health in the resident population, while adequately controlling for individual characteristics related to health. A multilevel analysis approach is employed, using data from the National Health and Nutrition Examination Survey III, 1988-1994. Results show that individuals who live in counties that are more walkable and have lower crime rates tend to walk more and to have lower body mass indices (BMI) than people in less walkable and more crime-prone areas. Among lifelong residents of an area, lesser walkability and more crime were also associated with respondents reporting weight-related chronic illness and lower ratings of their own health. The effect of high crime rates was substantially stronger for women than for men, and taking this interaction into account eliminated gender differences in walking, BMI, weight-related chronic conditions, and self-reported poor health. These findings indicate that planners should consider community walkability, crime prevention and safety in their efforts to promote activity and public health.
|
| [23] |
Many pathways from land use to health: Associations between neighborhood walkability and active transportation, body mass index, and air quality. https://doi.org/10.1080/01944360608976725 URL [本文引用: 1] 摘要
Previous studies have shown that low-density land development and disconnected street networks are positively associated with automobile dependence and negatively associated with transit use and walking. These factors in turn appear to affect health by influencing emissions of air pollutants, physical activity and obesity. In the present study, the authors evaluated the association between a single index of walkability that incorporates land use mix, street connectivity, net residential density and retail floor area ratios, with health-related outcomes in King County, Washington. Results showed a 5% increase in walkability to be associated with a 32.1% increase in time spent in physically active travel, a 0.23-point reduction in body mass index, 6.5% fewer vehicle miles traveled, 5.6% fewer grams of oxides of nitrogen emitted, and 5.5% fewer grams of volatile organic compounds emitted per capita. Although the actual amount of change in each outcome is modest, the combined effects on public health could be considerable.
|
| [24] |
The built environment and physical activity levels: The Harvard Alumni Health Study. https://doi.org/10.1016/j.amepre.2009.06.007 URL PMID: 2749578 Magsci [本文引用: 1] 摘要
<h4 id="absSec_N3c2ee3b0N3bbc8498">Background</h4><p id="simple-para0020">Physical activity is associated with better health, but many individuals are insufficiently active. Modifying the built environment may be an approach capable of influencing population-wide levels of physical activity, but few data exist from longitudinal studies that can minimize bias from active people choosing activity-friendly neighborhoods.</p><h4 id="absSec_N3c2ee3b0N3bbc84f8">Purpose</h4><p id="simple-para0025">This study aims to examine cross-sectional and longitudinal associations between the built environment and physical activity on a large scale.</p><h4 id="absSec_N3c2ee3b0N3bbc8558">Methods</h4><p id="simple-para0030">This study examined cross-sectional associations between urban sprawl (mapping addresses to corresponding counties) and physical activity (self-reported) among men throughout the U.S. in 1993 and in 1988, and longitudinal associations between changes in exposure to urban sprawl for movers and physical activity, 1988–1993. Included were 4997 men (mean age, 70 years) in the 1993 cross-sectional study; 4918 men in the 1988 cross-sectional study; and 3448 men in the longitudinal study, 1988–1993. Data were collected prospectively in 1988 and 1993, and analyses were performed in 2007–2008.</p><h4 id="absSec_N3c2ee3b0N3bbc85b8">Results</h4><p id="simple-para0035">In cross-sectional analyses, less sprawl was significantly associated with more walking OR, comparing least with most sprawling areas, for meeting physical activity recommendations by walking=1.38 [95% CI=1.09, 1.76] in 1993 and 1.53 [1.19, 1.96] in 1988). Less sprawl also was associated with lower prevalence of overweight (corresponding OR=0.79 [0.64, 0.98] in 1993 and 0.81 [0.66, 1.00] in 1988). However, longitudinal analyses assessing change did not show that decreasing sprawl was associated with increased physical activity or decreased BMI.</p><h4 id="absSec_N3c2ee3b0N3bbc8618">Conclusions</h4><p id="simple-para0040">These findings suggest that the cross-sectional results may reflect self-selection, rather than indicating that the built environment—as measured by urban sprawl—increases physical activity. However, the longitudinal findings were limited by small numbers of men changing residence and associated sprawl levels.</p>
|
| [25] |
Urban sprawl and risk for being overweight or obese. https://doi.org/10.2105/AJPH.94.9.1574 URL PMID: 15333317 [本文引用: 1] 摘要
I examined the association between urban sprawl and the risk for being overweight or obese among US adults.A measure of urban sprawl in metropolitan areas was derived from the 2000 US Census; individual-level data were obtained from the Behavioral Risk Factor Surveillance System. I used multilevel analysis to assess the association between urban sprawl and obesity.After I controlled for gender, age, race/ethnicity, income, and education, for each 1-point rise in the urban sprawl index (0-100 scale), the risk for being overweight increased by 0.2% and the risk for being obese increased by 0.5%.The current obesity epidemic has many causes, but there is an association between urban sprawl and obesity.
|
| [26] |
Multilevel built environment features and individual odds of overweight and obesity in Utah. https://doi.org/10.1016/j.apgeog.2014.10.006 URL [本文引用: 2] 摘要
Based on the data from the Behavioral Risk Factor Surveillance System (BRFSS) in 2007, 2009 and 2011 in Utah, this research uses multilevel modeling () to examine the associations between neighborhood built environments and individual odds of after controlling for individual risk factors. The BRFSS data include information on 21,961 individuals geocoded to zip code areas. Individual variables include BMI (body mass index) and socio-demographic attributes such as age, gender, race, marital status, education attainment, employment status, and whether an individual smokes. Neighborhood built environment factors measured at both zip code and county levels include street connectivity, walk score, distance to parks, and food environment. Two additional neighborhood variables, namely the poverty rate and urbanicity, are also included as control variables. results show that at the zip code level, poverty rate and distance to parks are significant and negative covariates of the odds of ; and at the county level, food environment is the sole significant factor with stronger fast food presence linked to higher odds of . These findings suggest that risk factors lie in multiple neighborhood levels and built environment features need to be defined at a neighborhood size relevant to residents' activity space.
|
| [27] |
Stepping towards causation: Do built environments or neighborhood and travel preferences explain physical activity, driving, and obesity? https://doi.org/10.1016/j.socscimed.2007.05.053 URL PMID: 17644231 [本文引用: 1] 摘要
Evidence documents associations between neighborhood design and active and sedentary forms of travel. Most studies compare travel patterns for people located in different types of neighborhoods at one point in time adjusting for demographics. Most fail to account for either underlying neighborhood selection factors (reasons for choosing a neighborhood) or preferences (neighborhoods that are preferred) that impact neighborhood selection and . Known as self-selection, this issue makes it difficult to evaluate causation among built form, , and associated outcomes and to know how much more walking and less driving could occur through creating environments conducive to active . The current study controls for neighborhood selection and preference and isolates the effect of the built environment on walking, car use, and . Separate analyses were conducted among 2056 persons in the Atlanta, USA based Strategies for Metropolitan Atlanta's Regional Transportation and Air Quality (SMARTRAQ) travel survey on selection factors and 1466 persons in the SMARTRAQ community preference sub-survey. A significant proportion of the population are "mismatched" and do not live in their preferred neighborhood type. Factors influencing neighborhood selection and individual preferences, and current neighborhood walkability explained vehicle travel distance after controlling for demographic variables. Individuals who preferred and lived in a walkable neighborhood walked most (33.9% walked) and drove 25.8 miles per day on average. Individuals that preferred and lived in car dependent neighborhoods drove the most (43 miles per day) and walked the least (3.3%). Individuals that do not prefer a walkable environment walked little and show no change in prevalence regardless of where they live. About half as many participants were (11.7%) who prefer and live in walkable environments than participants who prefer car dependent environments (21.6%). Findings suggest that creating walkable environments may result in higher levels of physical activity and less driving and in slightly lower prevalence for those preferring walkability.
|
| [28] |
Re-visiting the relationship between neighborhood environment and BMI: An instrumental variables approach to correcting for residential selection bias. https://doi.org/10.1186/1479-5868-10-27 URL PMID: 6 [本文引用: 1] 摘要
BACKGROUND: A burgeoning literature links attributes of neighbourhoods' built environments to residents' physical activity, food and transportation choices, weight, and/or obesity risk. In cross-sectional studies, non-random residential selection impedes researchers' ability to conclude that neighbourhood environments cause these outcomes. METHODS: Cross-sectional data for the current study are based on 14,689 non-Hispanic white women living in Salt Lake County, Utah, USA. Instrumental variables techniques are used to adjust for the possibility that neighbourhoods may affect weight but heavier or lighter women may also choose to live in certain neighbourhoods. All analyses control for the average BMI of siblings and thus familial predisposition for overweight/obesity, which is often an omitted variable in past studies. RESULTS: We find that cross-sectional analyses relating neighbourhood characteristics to BMI understate the strength of the relationship if they do not make statistical adjustments for the decision to live in a walkable neighbourhood. Standard cross-sectional estimation reveals no significant relationship between neighbourhood walkability and BMI. However, the instrumental variables estimates reveal statistically significant effects. CONCLUSIONS: We find evidence that residential selection leads to an understatement of the causal effects of neighbourhood walkability features on BMI. Although caution should be used in generalizing from research done with one demographic group in a single locale, our findings support the contention that public policies designed to alter neighbourhood walkability may moderately affect the BMI of large numbers of individuals.
|
| [29] |
Neighborhood built environment and income: Examining multiple health outcomes. https://doi.org/10.1016/j.socscimed.2009.01.017 URL PMID: 19232809 [本文引用: 1] 摘要
There is growing interest in the relation of built environments to physical activity, obesity, and other health outcomes. The purpose of the present study was to test associations of neighborhood built environment and median income to multiple health outcomes and examine whether associations are similar for low- and high-income groups. This was a cross-sectional study of 32 neighborhoods in Seattle, WA and Baltimore, MD regions, stratified by income and walkability, and conducted between 2001 and 2005. Participants were adults aged 20-65years (n=2199; 26% ethnic minority). The main outcomes were daily minutes of moderate-to-vigorous physical activity (MVPA) from accelerometer monitoring, body mass index (BMI) based on self-report, and mental and physical quality of life (QoL) assessed with the SF-12. We found that MVPA was higher in high- vs. low-walkability neighborhoods but did not differ by neighborhood income. Overweight/obesity (BMI > or = 25) was lower in high-walkability neighborhoods. Physical QoL was higher in high-income neighborhoods but unrelated to walkability. Adjustment for neighborhood self-selection produced minor changes. We concluded that living in walkable neighborhoods was associated with more physical activity and lower overweight/obesity but not with other benefits. Lower- and higher-income groups benefited similarly from living in high-walkability neighborhoods. Adults in higher-income neighborhoods had lower BMI and higher physical QoL.
|
| [30] |
Impact of policy and built environment changes on obesity-related outcomes: A systematic review of naturally occurring experiments. https://doi.org/10.1111/obr.12269 URL PMID: 25753170 [本文引用: 1] 摘要
Policies and changes to the built environment are promising targets for obesity prevention efforts and can be evaluated as 'natural'- or 'quasi'-experiments. This systematic review examined the use of natural- or quasi-experiments to evaluate the efficacy of policy and built environment changes on obesity-related outcomes (body mass index, diet or physical activity). PubMed (Medline) was searched for studies published 2005-2013; 1,175 abstracts and 115 papers were reviewed. Of the 37 studies included, 18 studies evaluated impacts on nutrition/diet, 17 on physical activity and 3 on body mass index. Nutrition-related studies found greater effects because of bans/restrictions on unhealthy foods, mandates offering healthier foods, and altering purchase/payment rules on foods purchased using low-income food vouchers compared with other interventions (menu labelling, new supermarkets). Physical activity-related studies generally found stronger impacts when the intervention involved improvements to active transportation infrastructure, longer follow-up time or measured process outcomes (e.g., cycling rather than total physical activity), compared with other studies. Only three studies directly assessed body mass index or weight, and only one (installing light-rail system) observed a significant effect. Studies varied widely in the strength of their design and studies with weaker designs were more likely to report associations in the positive direction.
|
| [31] |
BMI, auto use, and the urban environment in San Francisco. |
| [32] |
Perceived neighborhood environment and physical activity in 11 countries: Do associations differ by country? https://doi.org/10.1186/1479-5868-10-57 URL PMID: 1180 [本文引用: 1] 摘要
BACKGROUND: Increasing empirical evidence supports associations between neighborhood environments and physical activity. However, since most studies were conducted in a single country, particularly western countries, the generalizability of associations in an international setting is not well understood. The current study examined whether associations between perceived attributes of neighborhood environments and physical activity differed by country. METHODS: Population representative samples from 11 countries on five continents were surveyed using comparable methodologies and measurement instruments. Neighborhood environment 脳 country interactions were tested in logistic regression models with meeting physical activity recommendations as the outcome, adjusted for demographic characteristics. Country-specific associations were reported. RESULTS: Significant neighborhood environment attribute 脳 country interactions implied some differences across countries in the association of each neighborhood attribute with meeting physical activity recommendations. Across the 11 countries, land-use mix and sidewalks had the most consistent associations with physical activity. Access to public transit, bicycle facilities, and low-cost recreation facilities had some associations with physical activity, but with less consistency across countries. There was little evidence supporting the associations of residential density and crime-related safety with physical activity in most countries. CONCLUSION: There is evidence of generalizability for the associations of land use mix, and presence of sidewalks with physical activity. Associations of other neighborhood characteristics with physical activity tended to differ by country. Future studies should include objective measures of neighborhood environments, compare psychometric properties of reports across countries, and use better specified models to further understand the similarities and differences in associations across countries.
|

/
| 〈 |
|
〉 |