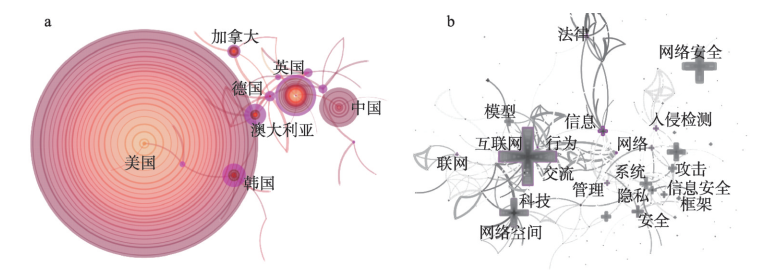
As a new spatial form of human activities, cyberspace is the common carrier of human and information. Cyberspace security is an important foundation of national security. The scientific description of cyberspace is an important cornerstone of cyber event analysis, cyberspace governance and cyber security guarantee, and also a new field of geographic science research in the information age. In the context of rapid development and fierce competition in global cyberspace, it is urgent to strengthen the intergration of geography and cyberspace security, and to carry out theoretical and methodological innovations based on traditional geosciences, and to create cyberspace geography. Cyberspace geography is the extension of geoscience research content from real space to virtual space. Its theoretical basis has evolved from the traditional theory of man-land relationship to the theory of man-land-network relationship; its research contents include constructing the mapping relationship between cyberspace and real space, redefining the basic concepts of distance and region in cyberspace, constructing the language, model and method system of cyberspace visualization, drawing the cyberspace map and exploring the evolution laws of the structure and behavior of cyberspace; its technical path includes the data collection and fusion of cyberspace elements, the visualization of cyberspace and the intelligent cognition of cyberspace situation and behavior. The intelligent cognition covers the assessment of cyberspace situation, transmission and traceability analysis of network hot events, situation simulation and risk prediction of cyber events, etc. The establishment of cyberspace geography will certainly provide a new perspective for the scientific cognition of cyberspace, the discipline construction of geography and cyberspace security science, as well as the prevention and control of national cyber security and the construction of a community of common future in cyberspace.
Based on the data of rainfall intensity and sediment concentration measured in different periods of three typical small watersheds in the loess hilly region, the relationship between rainfall intensity and sediment concentration at different spatial scales was analyzed in this study. The results show that the sediment concentration generally increases with the increase of rainfall intensity on the slope scale. However, on the catchment scale of both slopes and gullies, regardless of the level of the watershed or the area of the valley, there is a significant threshold phenomenon in the effects of rainfall intensity on sediment concentration. When the rainfall intensity exceeds the threshold, the flood sediment concentration will no longer increase with the increase of rainfall intensity. The rainfall intensity threshold increases with the increase of forest and grass coverage. For example, the threshold of rain intensity under the condition of underlying surface in the study area from 1956 to 1969 was 10-15 mm/h, and it reached 20 mm/h from 1990 to 1997, and about 40 mm/h now. Because the rainfall with the intensity of 10-15 mm/h happened almost every year on the basin scale, the vegetation did not change much from the 1950s to the 1980s, and the sediment yield in loess hilly area mainly depended on the soil erosion caused by surface flow while the surface flow speed did not increase indefinitely with the increase of the flow discharge, so the annual maximum sediment concentration of the tributaries in loess area was basically stable before the 1990s.
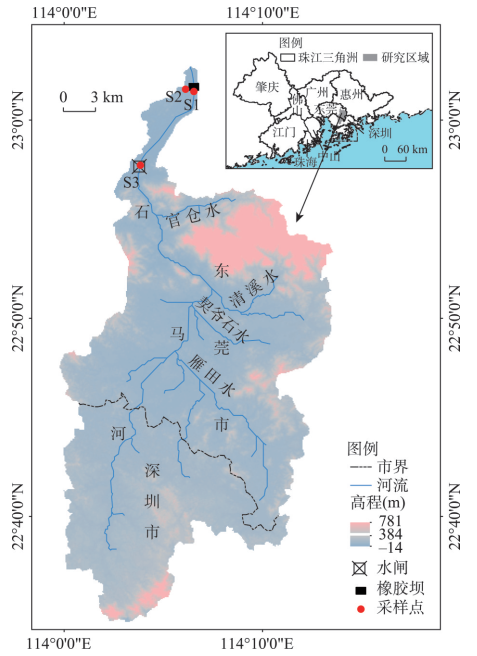
In order to study the response characteristics of precipitation-runoff under the influence of human activities, this paper took Shima River, a typical urbanized catchment in the Pearl River Delta as the research area. Daily samples of precipitation and river water were collected from January to December and hourly samples were collected during three typhoon rainstorms in 2017. Based on the stable isotope data (δD, δ 18O), the characteristics of hydrogen and oxygen isotopes were analyzed. Two-component isotope-based hydrograph separation was used to study the contribution of pre-event water and event water to the runoff process during three typhoon events. The results showed that δD and δ 18O in precipitation ranged from -105.10‰ to 9.98‰ and -14.80‰ to -0.55‰, respectively, and the annual weighted mean values were -57.88‰ and -8.61‰. The Local Meteoric Water Line was δD=7.70δ 18O+8.61(R 2=0.98). δD and δ 18O in river water ranged from -91.23‰ to -15.96‰ and -12.66‰ to -4.01‰, respectively. δD-δ 18O basically fell on the LMWL indicated that precipitation was the main source of runoff in the Shima River catchment. During the three typhoons, the proportion of event water was 59.7%, 55.0% and 69.4%, respectively, which was higher than that of pre-event water. In the early stage of flood, pre-event water and event water increased synchronously. In the late stage of flood, the proportion of event water increased gradually which was more than 80% during the peak period. This indicated that the increase of impervious areas in the urban regions would significantly alter the hydrological cycle. The results of this study could provide the theoretical foundations for hydrological forecast of urbanized basins in Pearl River Delta.
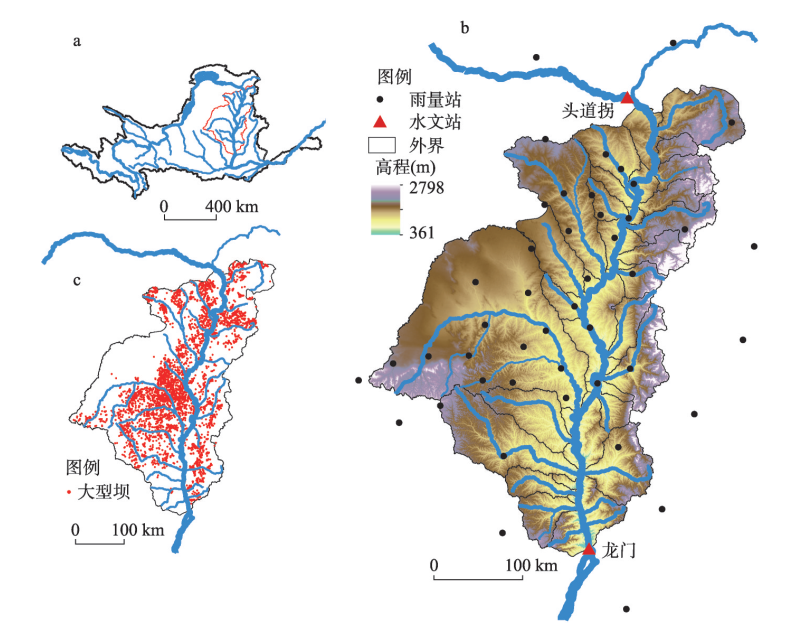
Since 2000, the amount of sediment loads in the Yellow River has decreased sharply. It is of great practical significance to scientifically understand the reasons for the sediment load change in the Yellow River. This study selected the Hekou-Longmen (HL) section, which consists of main sand producing areas of the Yellow River, as the study region, analyzed the sediment discharge change trend, constructed the calculation method of the contribution rate for the sediment reduction of major soil and water conservation measures, such as terraces, check dams, and vegetation, and expounded the reasons of sediment load reduction on the HL section since 2000. The main results were as follows: (1) From 1952 to 2017, there was no significant change of annual precipitation in the HL section, and the annual runoff and annual sediment load both showed an extremely significant (p < 0.001) declining trend. (2) The two mutation years for sediment load reduction in the HL section were in 1979 and 1999, respectively. The average annual sediment loads decreased from 9.30×10 8 t during 1952-1979, to 4.20×10 8 t during 1980-1999, it was, and in 2000-2017, it dropped to 1.03×10 8 t, a decrease of 89%. (3) Influenced by vegetation and terraces, the amount of soil erosion on the slope of the HL section decreased year by year from 2000 to 2015, changing from 1.90×10 8 t to 5.13×10 8 t, and the average annual sediment reduction of check dams from 2000 to 2011 was 1.38×10 8 t. (4) Vegetation restoration was the main reason for the reduction of sediment loads in the HL section, with a contribution rate of 54%. Terraces and check dams, and reservoir and water diversion contributed 34%, and 12%, respectively. (5) Vegetation restoration mainly led to reduced runoff sediments, while check dam construction played a major part in reducing the sediment transport ratio of the basin. According to the changing trend of sediment load, countermeasures are put forward.
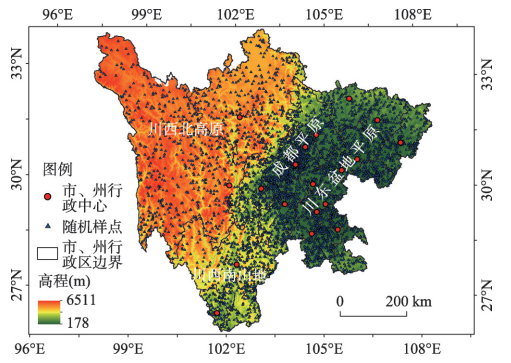
Many studies have shown the importance of using remote sensing to establish a vegetation index for land surface processes and global change research, it is of great significance to understand the driving factors of vegetation change, but the causes for vegetation change and the impact of geographical factors on vegetation change remain elusive. In this study, we examined the geographical factors and spatial patterns of vegetation change and the interactive effects of the geographical factors on vegetation change, and identified the most suitable characteristics of the main geographical factors that promote vegetation growth using the Geographical Detector Model, a new method of spatial counting to detect spatial variability and identify the driving factors. Our results showed that the vegetation cover was in good condition, the coverage area was of medium height, and there was more than 94% of high height vegetation. The spatiotemporal change in vegetation cover was significant from 2000-2015; the transformation of the normalized differential vegetation index (NDVI) was manifested as the transformation of NDVI > 0.4, and the cover area of medium and high height vegetation had a significant decreasing and increasing trend, respectively. The vegetation cover was better in the western and northern Sichuan plateau, while it was poor in the central urban areas of the Sichuan Basin and the Panxi area. Soil type, elevation, and the average annual temperature change could well explain the variability in vegetation condition. The influence of geographical factors on NDVI was interactive; the synergistic effect of the geographical factors on NDVI showed mutual and non-linear enhancement, and the interaction of the two factors enhanced the influence of a single factor on NDVI. This study reveals the most suitable characteristics and the main factors that promote vegetation growth, which is helpful to better understand the influence of natural factors and the driving mechanisms of vegetation NDVI change.
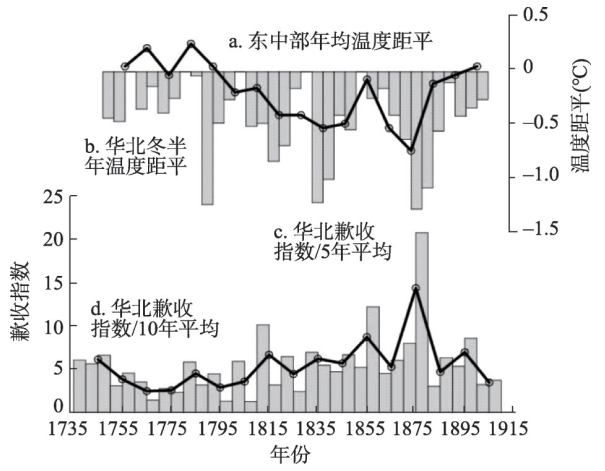
The relationship between grain crop harvest and climate change (temperature and precipitation) has been a major topic in the research on social impact of climate change in the past. With 5099 records on poor and bumper autumn harvests kept in historical chorography, annual harvest grade at county scale is quantified using semantic differential method, and the poor/bumper autumn harvest index series in North China from 1739 to 1911 is reconstructed. The variable characteristics of autumn harvest and its relationship with climate change are analyzed, and the reliability and applicability of historical harvest records from chorography are discussed by comparing them with those of the records from official documents in the Qing Dynasty. Results show that, first, the poor harvest records from chorography are more reliable than the bumper ones, and the poor harvest index series can reflect the fluctuation of overall autumn harvest to some extent. At the centennial scale, the autumn harvest markedly turned worse in the 19th century than in the 18th century. Second, the poor harvest index series are significantly and negatively correlated with temperature change at 10- and 5-year scales. Therefore, the poor harvest is sensitive to temperature decline. At an annual scale, the poor harvest is also significantly and negatively correlated with precipitation change, and the correlation coefficient between the poor harvest and drought index is up to 0.71 (p < 0.001). That is, drought is a larger threat to crop production than flood in North China. Third, compared with the harvest records kept in official documents that are reported to the government by local officials, the records from chorography have some advantages in the reconstruction of historical harvest. The records on poor harvest from chorography are more reliable than those from official documents, thereby allowing the index series to describe extreme events of crop production drop exactly. The two historical data sources can be complementary to each other; however, direct interpolation without data rectification may increase the system errors. This study is expected to contribute to the method improvement in the usage of historical documents in reconstructing the social impacts of climate change and the deepening in scientific knowledge on the impact rules of climate change on the agricultural production in the past.
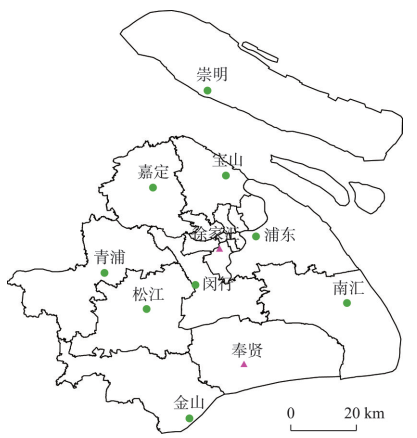
Under the background of global warming, heat waves are expected to be more frequent and long lasting. Cities endure greater risk under heat wave events because of the pre-existing urban heat island. However, research on the interaction between heat wave and urban heat island is still lacking. Based on hourly data of air temperature, wind speed, relatively humidity, and eddy covariance energy flux data from Shanghai urban (XJH) and rural site (FX) during two summers (June-August) in 2016-2017, the difference of urban heat island (UHI) between heat wave (HW) and non-heat wave (NHW) conditions is analysed. In addition, an advection-diffusion analytical model has been used to unravel the mechanism of the interaction between UHI and HW. Results show that the UHI intensity is obviously enhanced during HWs, and the enhancement is stronger during daytime than that of nighttime, which indicates the synergistic effect between UHI and HW. The relative humidity ratio of urban and suburban areas during HWs significantly decreases compared with NHW conditions, indicating the urban surface becomes even drier than suburban areas during HWs that suppresses evaporation and intensifies UHI intensity. The mean wind speed also has an obvious decrease, leading to weaker advection cooling effect, which has a positive effect on UHI intensity. The increase of net radiation at the urban site is larger than that of the suburban site during HWs so that urban area receives more radiation input. Due to low vegetation cover and more impervious surfaces, the latent heat flux at the urban site has a slight decrease while it has an obvious increase at the suburban site. The increase of the urban sensible heat flux is larger than that of the suburban site. This change of the partition between sensible and latent heat flux also exacerbates the UHI intensity. This study has important implications for cities to cope with intensified thermal risks.
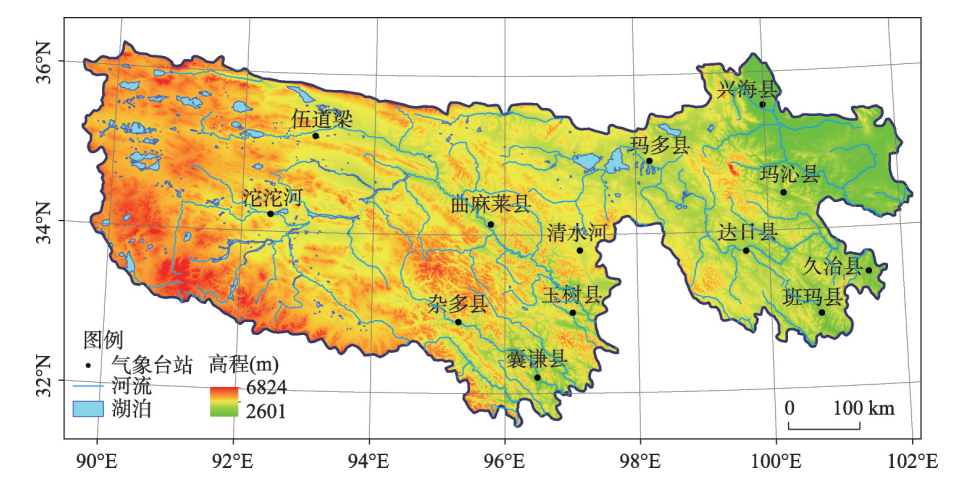
The Three Rivers' Headstream Region in Qinghai Province is the area with the most fragile ecosystem in China, its annual changes of the precipitation in the growing season are the key to the security of the water resources and the sustainable development of the ecosystem in the local area and the lower Lantsang River, Yellow River and Yangtze River. This paper studied the spatial-temporal characteristics of the precipitation in the Three Rivers' Headwater Region during the last 56 years by using the linear regression, Mann-Kendall test, heuristic segmentation algorithm, R/S, and EEMD et al. The results show that there is an obvious difference in the spatial-temporal characteristics of the precipitation with the variation of area and reason. The results are as follows: The precipitation series of study area showed a weak trend of getting-humid, and it increased significantly since the 21st century, the climate tendency rates of precipitation in the three sub-headwaters region are not the same; The annual and seasonal precipitation decreased from southeast to northwest, the summer precipitation of the Lantsang River Headwater Region and the autumn precipitation of the Yellow River Headwater Region decreased weakly, the areas where precipitation reduced weakly spotted in spacial distribution, the order of seasonal precipitation climate tendency rates of the Lantsang River and the Yellow River Headwater Region are spring, winter, autumn and summer precipitation, while the Yangtze River Headwater Region are spring, summer, winter and autumn precipitation(which are all positive); The decadal variation and the climate tendency rates of precipitation are more obvious; The multiple correlation coefficient between the climatic tendency rates of precipitation in spring, summer and longitude, latitude, altitude are significantly higher than that in winter; There was a wet turning signal in the middle and late 1990s, but the catastrophe point of the precipitation time series occurred around 2002; Inter-annual and low-value Inter-decadal prominent period are the main factors which caused the precipitation variation; With the exception of summer precipitation in the Lantsang River Headwater Region, the other seasonal and the annual precipitation changes showed a trend of different getting-humid; By comparison, the precipitation change in the Yangtze River Headwater Region is more representative than the other two regions in climate change of the Tibetan Plateau. Therefore, it is necessary to continue the research with more characterizing methods to further improve the detection accuracy of the variation process of the characteristics of climate series.
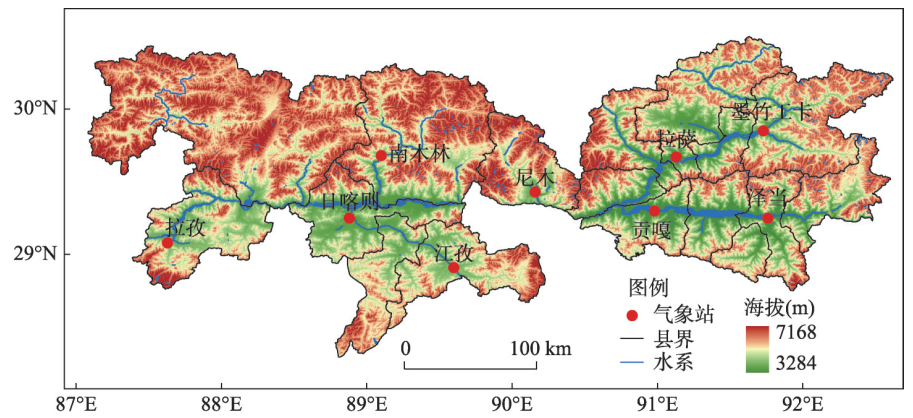
Based on daily mean soil temperature at 5-cm depth from 9 meteorological stations in the Yarlung Zangbo River and its two tributaries in Tibet from 1981 to 2017, the spatial-temporal distribution and climate abrupt characteristics of the mean soil temperature and its critical temperature at 5-cm depth have been comprehensively analyzed using the methods of linear regression and Mann-Kendall test. In particular, the dependence of the change rates of mean soil temperature at 5-cm depth has been explored on the altitudes and longitudes as well. The results show that the annual and seasonal mean soil temperature at 5-cm depth increases gradually from west to east but decreases with the altitude. During 1981-2017, the monthly mean soil temperature exhibits a significantly increasing trend with a rate of 0.23-0.98 ℃/10a, with a peak value occurring in April and the trough value in July. Also, the annual mean soil temperature exhibits a significant upward trend at a rate of 0.58 ℃/10a. Noticeably, the maximum increasing rate occurs in spring and the minimum in summer. In terms of the critical soil temperature ≥ 12 ℃ at 5-cm depth, the first day occurred much earlier, whereas the terminal day was postponed, the duration and elevated accumulated temperature were prolonged. Similarly, the critical soil temperature ≥ 14 ℃ exhibits a similar pattern albeit a larger amplitude. As for the trend over decadal timescale, the annual and seasonal mean soil temperature at 5-cm depth in the watershed investigated here exhibits a pronounced increasing trend. The selection of ≥ 12 ℃ (14 ℃) critical soil temperature at 5-cm depth points to the predated first day, prolonged duration and increased cumulated temperature in the first decade of the 21st century. The M-K mutation test shows that the abrupt change of seasonal mean soil temperature at 5-cm depth in spring and autumn occurred in 2004 and 2005, respectively, whereas the abrupt changes occurred in the winter of 1997, and the mutation of annual mean soil temperature was found in 2005. Furthermore, it was also found that abrupt change point occurred in 2004 for the first day of critical soil temperature ≥ 12 ℃, and a later abrupt point happened in 2014 for the terminal day, as compared to the duration in 1997, and the accumulated temperature occurred in 2005. By comparison, the abrupt change point for the first day, the terminal day, the duration and the accumulated temperature for the critical soil temperature ≥ 14 ℃ at 5-cm depth occurred around 2004. Compared to the variation in air temperature, soil temperature at 5-cm depth from 1981 to 2017 had a larger increasing rate of temperature and but a delayed abruption change point.
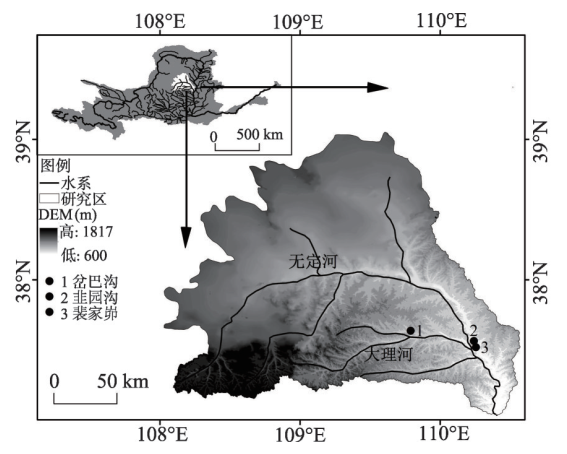
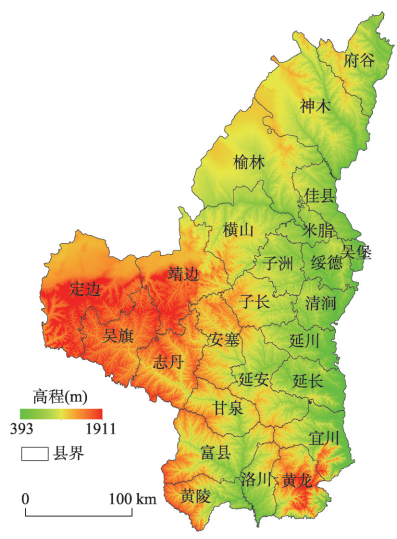
The study took northern Shaanxi, a key region of Grain for Green Project, as the research area. We firstly analyzed the spatiotemporal patterns of cropland during 2000-2013 using the remotely sensed time series cropland. The RUSLE model was improved by taking terraced fields as a parameter, and then the soil erosion modulus (SEM) was simulated using the calibrated model. Finally, the impacts of the Grain for Green Project on the soil erosion were assessed by comparing SEM changes in shifted and unshifted cropland. The results indicated that, the SEM across the areas of "Grain for Green" decreased by 22.70 t/hm 2 from 2000 to 2010, accounting for 47.08% of that from the returned cropland in 2000. In the same period, the SEM from the unreturned cropland decreased by 10.99 t/hm 2, accounting for 28.60% of that from the unreturned land in 2000. For the whole study area, the SEM of different land use types averagely decreased by 14.51 t/hm 2, which is 41.87% of the SEM in northern Shaanxi in 2000. We concluded that "Grain for Green" could effectively reduce the SEM in northern Shaanxi and made the most contribution to soil protection. The Grain for Green Project entered a consolidation period after 2000 (during 2010-2013 in this study), and changes of the SEM during this period were thus relatively low.
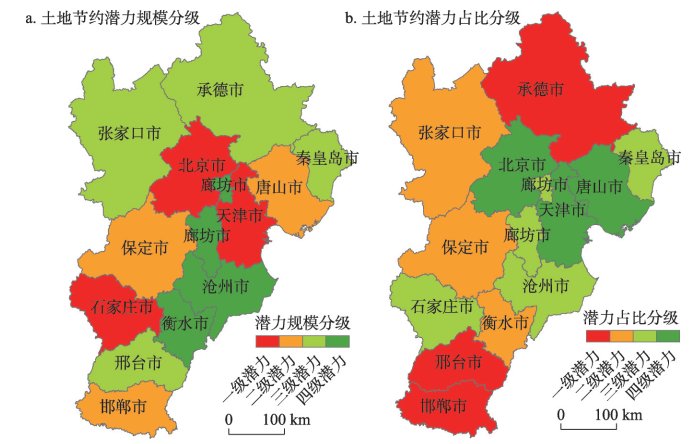
The existing studies on potential evaluation of urban land intensive use mainly adopt the multi-index comprehensive evaluation approach, which has defects such as insufficient basis, incomparability of results and difficulty in reflecting dynamic changes. In view of this, this study introduced the theory and method of technical efficiency measurement into the potential evaluation of urban land intensive use. The potential of urban land intensive use can be defined as the land savings or output growths potential brought by the possible improvement of technical efficiency. Based on measuring the technological efficiency of urban land use with the SFA method, this paper constructed the quantitative evaluation models of land saving and output growth potential of urban land intensive use, and then measured and analyzed the scale and proportion of land saving and output growth potential in the Beijing-Tianjin-Hebei region during 2006-2015. The results show that the potential scale of urban land intensive use in the study area is very large and continuously increasing. The annual average of land saving potential scale is 709.80 km 2, and the net increment in the 10 years is 543.96 km 2, while the output growth potential scale is 420.76 billion yuan (the constant price in 2005), and the net increment in the 10 years is 342.86 billion yuan. The results also indicate that the potential proportion of urban land intensive use in the Beijing-Tianjin-Hebei region is quite high and continuously rising. The annual average of land saving potential proportion is 21.80%, or an increase of 10.56 percentage points in the 10 years, while the annual average of output growth potential proportion is 26.12%, or an increase of 14.73 percentage points in the 10 years. The potential ranking between the 13 cities is stable and the gap is widening, showing the general rule that it is more difficult for developed cities and easier for underdeveloped cities to explore potentialities, as well as the Matthew effect that it is easier for the easy and more difficult for the difficult. The research can provide scientific guidance for the practice and management of urban land intensive use and facilitate the dialogue and exchange between intensification evaluation and efficiency measurement.
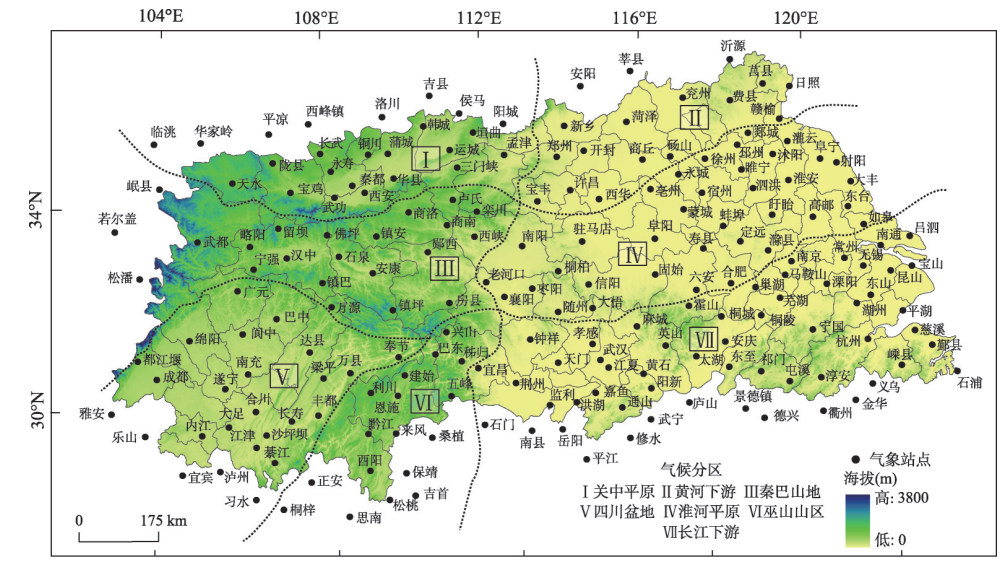
Using daily temperature observations from the National Meteorological Information Center of China, we analyzed the spatiotemporal variation in actual heating energy efficiency in areas south and north of the Qinling Mountains-Huaihe River (hereafter Qinling-Huanhe Line) over the period 1960-2016. The dynamic heating index, defined as the difference between fixed and dynamic heating energy consumption during the entire heating season, was used. Specifically, we analyzed the spatiotemporal response of actual heating energy efficiency to the Arctic Oscillation (AO) index, where changes in the circulation pattern bring frigid winter air to eastern China in the negative phase, resulting in increased heating energy demand. The results showed that: (1) spatial pattern of heating energy consumption in areas south and north of the Qinling-Huaihe Line was high in the eastern and southern regions, but low in the western and northern regions. The signal of decreasing heating energy demand in the lower latitudes of the region occurred earlier than in the higher latitudes. (2) On the whole, actual regional heating energy efficiency showed a decreasing trend that was corresponded with regional warming. In the north, however, the decreasing trend was weaker than in the south during the study period. This implies that residents continued to adopt a fixed-date strategy in the heating season, thus heating energy waste would increase consistently throughout the seven sub-regions, especially in the south. (3) Comparing the situation before and after climate change, i.e., 1960-1990 versus 1990-2016, we found that substantial changes were not evident in the spatial pattern of heating energy consumption in areas south and north of the Qinling-Huaihe Line. Nevertheless, there were differences in the response of temperature variations to climate change. The lower reaches of the Yangtze River, the Hanjiang River Basin, and the Wushan Mountains were some areas where heating energy waste was slowly increasing. A faster increase in heating energy waste mainly occurred in the eastern Huaihe Plain, the northwestern lower Yellow River Basin, and the Qinling-Bashan Mountains. (4) Actual heating energy efficiency had a close relationship with AO in the south-north transitional zone of China. Over the past 57 years, the AO alternated between positive and negative phases. Starting in the 1990s, the AO tended to be more of a positive phase pattern, in which higher pressure at the mid-latitudes drove warm air farther north, bringing warmer winters to the Qinling-Huaihe region, and thus decreased heating energy consumption. Spatially, the most sensitive responses of heating energy efficiency to climate change occurred in the southern Huaihe Plain and the northern regions of the lower Yangtze River Basin. In future, we should mitigate the risks of extreme climate change in sharply negative phases of the AO warrant attention, and develop policies concerning household heating in the south-north transitional zone of China.
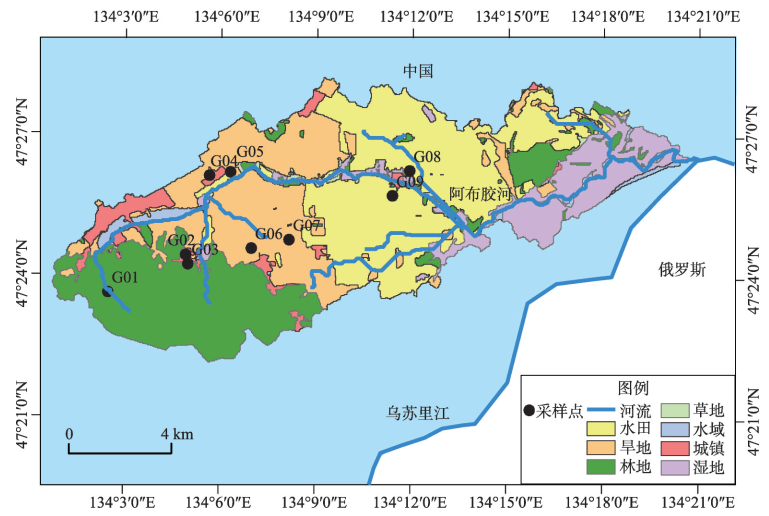
Identifying the sources and fate of nitrogen in groundwater is challenging in areas with diverse land use types and multiple potential inputs. The Abujiaohe river basin in China's Sanjiang Plain, which has mixed land use types, including forestland, upland, paddy fields, and residential areas, was selected as the study area. Multiple environmental tracers, including hydrochemical and stable isotopes of nitrate (δ 15N-NO3 - and δ 18O-NO3 -) from groundwater, were examined. A biplot approach (δ 15N-NO3 - and δ 18O-NO3 -) combined with multivariate statistical analysis of hydrochemical data was used to investigate the sources and fate of nitrogen in groundwater. The results showed that severe nitrogen pollution—the highest concentration found in this study exceeded the national limit by four times—was present in both towns and agricultural areas. Land use was not only the dominant determining factor of nitrogen concentration and groundwater chemistry type, but also had a key impact on the regional nitrogen cycle and nitrogen sources. In the forestland, dominant nitrate was mainly derived from organic nitrogen nitrification in the soil. In residential areas, excessive NO3 - with high Cl - concentrations derived from manure and septic waste, which was controlled by the nitrification process. In paddy fields, low NO3 -, combined with high NH4 + and stable isotopes of nitrate concentrations, was observed. The linear relationship between δ 15N-NO3 - and δ 18O-NO3 -indicated that the occurrence of significant denitrification led to the limited presence of isotopic tracer. The uplands, affected by multiple factors such as rainfall and denitrification, had a more complex N cyclic process. Ultimately, multivariate statistical analysis results showed that the reduction of nitrogen fertilizer input was the main reason for nitrogen pollution. Therefore, the combined approach of using nitrogen isotopic ratios and conventional multivariate statistical analysis allowed for the more reliable separation of nitrogen sources in groundwater. This approach can help us to initiate more targeted remediation strategies.
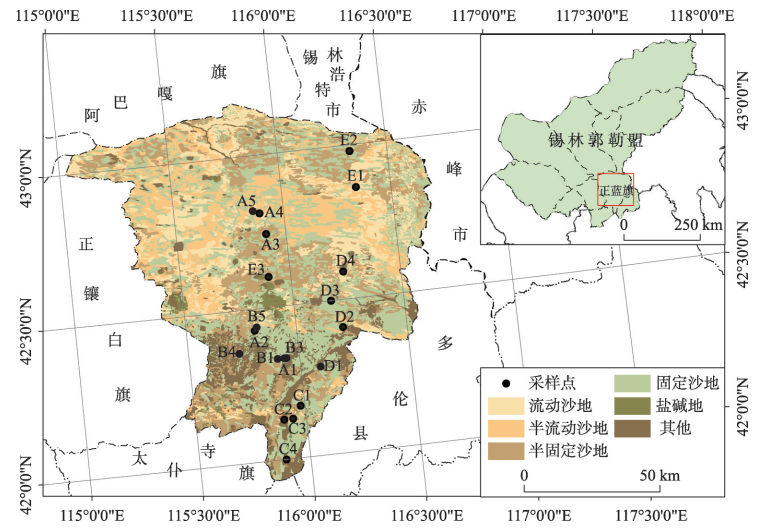
Wind-driven soil erosion results in land degradation, desertification, atmospheric dust, and sandstorms. The Hunshandake Sandy Land, an important part of the Two Barriers and Three Belts project, plays important roles in preventing desert and sandy land expansion and in maintaining local sustainability. Hence, assessing soil erosion and soil accumulation moduli and analyzing the dynamic changes are valuable. In this paper, Zhenglan Banner, located on the southern margin of the Hunshandake Sandy Land, was selected as the study area. The soil erosion and accumulation moduli were estimated using the 137Cs and 210Pbex composite tracing technique, and the dynamics of soil erosion and soil accumulation were analyzed during two periods. The results are as follows: (1) the regional 137Cs reference inventory was 2123.5±163.94 Bq·m -2, and the regional 210Pbex reference inventory was 8112±1787.62 Bq·m -2. (2) Based on the 137Cs isotope tracing analysis, the erosion moduli ranged from -483.99 to 740.31 t·km -2·a -1. Based on the 210Pbex isotope tracing analysis, the erosion moduli was from -441.53 to 797.98 t·km -2·a -1. (3) Compared with the 1920-1970s, since the 1970s lower soil erosion moduli and accumulation moduli were observed. Therefore, the activities of local sand dunes weakened, and the quality of the local ecological environment improved. The multi-isotope composite tracing technique combining the tracers 137Cs and 210Pbex has potential for similar soil erosion studies in arid or semiarid regions around the world.
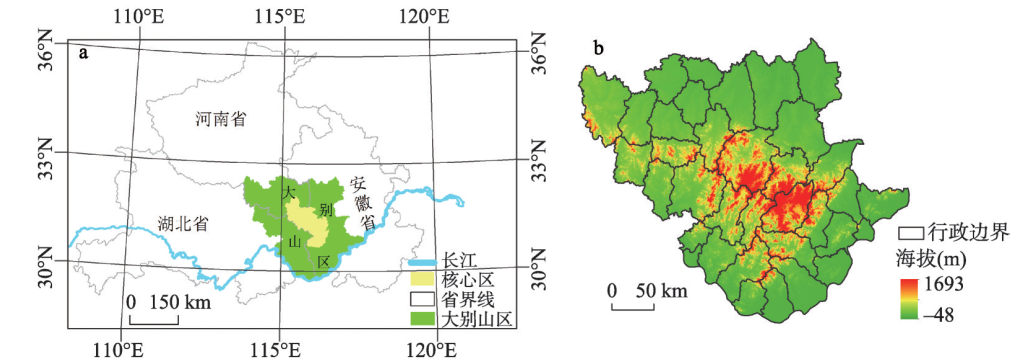
Ecosystem services play an important role in regional ecological balance, ecosystem health, land and ecological security, and global climate change. The response characteristics of scale and the spatial differentiation mechanism of the ecological service value are worth discussing. Taking the Dabie Mountain area located in central China as the research object, based on the data of land use classification, this paper applied the methods of spatial statistics, hot spot analysis and geographical detector to examine the dynamic evolution characteristics, scale effect and spatial differentiation mechanism of the ecological service value of Dabie Mountain area from 1970 to 2015. The results show that over the 50 years, the overall value of ecological services in the Dabie Mountain area increased by 951 million yuan, while in recent years it decreased by 395 million yuan, accounting for 41.54% of the total value added. Scale is helpful for understanding the pattern and process of ecosystem. To strengthen the study of scale characteristics in the evaluation of ecosystem service function can improve the objectivity, credibility and practicability of the evaluation results. Therefore, in this paper, we made a comparative analysis through the scale of four types, which includes 9-level amplitude. The results show that the unit scale of township is the characteristic scale of the spatial differentiation of ecological service value in Dabie Mountain area, and the spatial difference information of the ecological service value at the township unit scale is rich, and the type of township unit scale is a more appropriate research scale level in the study area. To strengthen the geographical exploration of the spatial differentiation of ecosystem service value will be helpful to carry out regional ecological planning and ecosystem regulation. In this study, we analyzed the spatial differentiation mechanism of ecosystem service value in Dabie Mountain area by using the geographical detector. The results show that the explanatory power q value of the ecological land use proportion, land use degree and human influence composite index among the 16 influencing factors contributing to the spatial differentiation of ecological service value is nearly 40%, which is the main reason for the spatial differentiation. Elevation and slope factor q value is nearly 30%, which is a secondary factor. There are mainly three categories and 30 types of interaction combinations with an interactive detection q value of more than 50%. The interaction and synergistic effects of natural factors, human disturbance factors and landscape pattern factors enhance the explanatory power of spatial differentiation of ecological service value. Our work may provide a theoretical basis for the precise and diversified regulation of ecosystem functions in Dabie Mountain area.
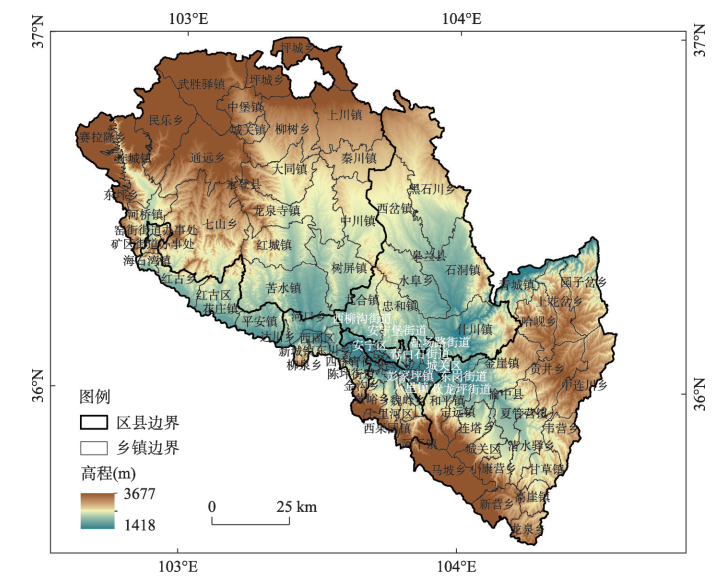
The sustainable supply of ecosystem services is the basis of the sustainable development. Human beings satisfy the demand and improve their own well-being through the consumption of ecosystem services. It is of great significance for the management of regional ecosystems and the effective allocation of resources to study the demand and consumption of ecosystem services and to analyze the supply and demand characteristics of ecosystem services and their spatial trade-offs. Based on the multi-source data such as land cover, meteorological observation and statistical yearbook in Lanzhou in 2017, the spatial analysis tools including InVEST model, ArcGIS and GeoDA were used to calculate the supply and demand of water yield, food supply, carbon storage and soil conservation. The supply and demand matching of ecosystem services in the study area was analyzed and evaluated. The results show that: (1) The supply and demand of ecosystem services have obvious spatial heterogeneity. The total supply of services is greater than the total demand, but there are differences between different sub-regions and different kinds of ecosystem services. (2) The supply-demand ratio of comprehensive ecosystem services is 0.039. There are differences in supply-demand matching of different kinds of ecosystem services: water yield service (0.098) > carbon storage service (0.066) > food supply service (0.030) > soil conservation service (0.001), and there are significant differences in supply-demand matching between urban and rural areas. (3) There are different kinds of spatial matching pattern between supply and demand of ecosystem services, including "high-high spatial matching", "low-low spatial matching", "high-low spatial dislocation" and "low-high spatial dislocation". (4) There are obvious synergic effects in the balance of supply and demand of services in Lanzhou, which are "high-high synergy" and "low-low synergy".