

1 引言
粮食安全关乎国计民生,是国家安全的重要基础。耕地作为主要的农业生产资料,是影响粮食综合生产能力的关键要素之一,其利用方式的变化会直接影响粮食安全。第三次全国国土调查数据显示,截至2019年末,全国耕地面积为12786.19万hm2,较二调数据下降幅度超过5%。国务院办公厅先后出台了《关于坚决制止耕地非农化行为的通知》《关于防止耕地非粮化稳定粮食生产的意见》等一系列要求,要求严守耕地红线,坚决制止各类耕地非农化,防止耕地非粮化倾向。然而,耕地非农化和非粮化现象在部分地区依然较为突出,并有进一步加剧的趋势[1-2]。从保障粮食供给角度来看,大量耕地因非农化丧失了粮食生产功能,部分非粮化产业对优质耕作层产生负面影响,水稻、小麦、玉米和豆薯类等种植面积减少,对粮食生产稳定性造成不利影响[3]。此外,农户生计策略转变的同时降低了耕地生产功能[4],被动非农化和非粮化进一步降低农村人口从事农业生产的意愿,加剧农村青壮年劳动力流失,农村在保障国家粮食安全中的角色被削弱[5-6]。这不仅会造成短期内的缺粮现象,更会给粮食主产区带来长远的压力。
受人口增长、气候变化和地缘政治等的影响,中国粮食安全的复杂性、脆弱性和不确定性不断增加。在粮食安全视角下,如何妥善解决非农化和非粮化问题已引起政府与学界广泛关注。因此,科学认知非农化和非粮化的动态演变,深入剖析驱动机制对于精准制定决策和保障新时期粮食安全至关重要。目前,针对非农化和非粮化的研究,一方面是从定量或者定性的角度分析现状特征及治理对策,如通过采用重心转移模型[7]、Theil指数[8]揭示非农化和非粮化演变特征及扩散路径。有研究表明中国主粮(水稻、小麦和玉米)作物的播种比例由1980年的82.7%下降至2011年的50.7%,且在城郊地区下降更为突出[9]。就粮食主产区而言,河北、河南、山东和安徽四省2013年的非粮化率高达61.1%[10],部分粮食主产区由于农地流转导致非粮化呈现扩大趋势[11];空间上,非农化和非粮化规模与城镇化进程存在联动性,总体呈现以城市为中心向远郊递减扩散的规律[12⇓-14]。另一方面则是基于微观农户调查[15-16]、农业统计资料或遥感数据[17-18]分析非农化和非粮化的驱动因子。分析方法主要包括传统计量模型和统计模型,如主成分分析法[19]、Tobit模型[20]、Logit模型等[21]。从人口就业、产业和土地等视角分析非农化和非粮化产生的原因,提出农户就业非农化与耕地非农化扩张并行发展[22]。2013—2018年流转土地中用于种植粮食的比例低于57%[23],农业结构内部调整和农民逐利行为导致耕地向果园、畜牧业等用途转变[24],农地适度资本化会抑制非粮化而过度资本化会促进非粮化[25]。
从研究尺度看,既有研究多集中在省域或市域的大尺度研究,或耕地集中区的非农化和非粮化问题,较少关注精细尺度的非农化和非粮化演变特征,尤其对主销区和产销平衡区的变化关注不足[14,19,26]。不同县域之间的社会经济水平、农户生计策略和粮食安全状况存在较大差异,以省、市为尺度难以刻画内部演变的差异,这在一定程度上限制了研究精度和成果的应用价值。随着社会经济的快速发展,中国的非农化和非粮化现象发生了深刻的变化,但变化的格局、过程和特征尚未得到系统的展现。因此,有必要引入县级尺度数据对非农化和非粮化开展综合分析,为相关政策的制定及保障粮食安全提供详实参考。不同发展阶段的社会经济、资源禀赋不同,以往研究忽略了不同地区自然和社会经济条件的差异,以及非粮化的规模、类型以及扩张机制可能随时间和空间而变化的事实,对非农化和非粮化驱动因子的动态性缺乏考虑,定量测度不同经济发展阶段的关键驱动要素的研究相对缺乏。因此,遏制非农化、防止非粮化亟需综合评估其动态演变特征及驱动机制。
因此,本文基于1980—2020年中国土地利用数据和县级作物播种面积数据库,识别了非农化和非粮化空间演化及其集聚特征,在此基础上分析不同时段的变化趋势。系统构建驱动力指标体系,借助地理探测器模型识别非农化和非粮化的主要控制因子,为保障耕地红线,提高粮食安全提供科学依据。
2 数据与方法
2.1 研究区和数据
以中国2856个县级单元为研究对象,非粮食作物播种面积、农作物总播种面积统计数据及相关农业经济数据均来自国家统计局国家数据平台(
表1 中国粮食生产功能区划分
Tab. 1
| 粮食生产功能区 | 省份 |
|---|---|
| 主产区 | 河北、内蒙古、吉林、黑龙江、辽宁、江苏、安徽、江西、山东、河南、湖北、湖南、四川 |
| 主销区 | 北京、天津、上海、浙江、福建、广东、海南 |
| 产销平衡区 | 山西、广西、贵州、云南、重庆、西藏、陕西、甘肃、青海、宁夏、新疆 |
注:数据暂未含港澳台。
2.2 研究框架与理论支撑
根据农业可持续发展理论,在保障农业生产能力和农民收入的基础上,需要实现生态、经济和社会的协调发展。而非农化和非粮化作为耕地利用实践过程暴露出来的管理问题,是农业生产方式转型的表现,虽然可以在一定程度上带来经济效益,但也会带来环境污染、生态破坏等问题,甚至会影响农业生产的长期发展。此外,根据农业生产方式理论[31],农业生产包括传统农业生产方式和现代农业生产方式,非农化和非粮化是一种农业生产方式的转型。农业区位理论[32]指农业生产围绕城市形成多个同心圆,因其与中心城市的距离不同而引起生产基础和利润收入的地区差异,该理论一定程度上表明了农业生产的布局方式和客观要求。综上所述,农业生产方式理论、农业区位理论和农业可持续发展理论是将非农化和非粮化转化成科学问题的理论基础。需要从这些理论的角度出发,科学认知非农化和非粮化的动态演变,深入剖析驱动机制,为实现农业可持续发展提供理论基础。
在驱动机制方面,根据土地经济理论,土地利用实际上是人与地、人与人之间互动的结果。同样地,耕地非农化和非粮化现象也是由“人—地”和“人—人”之间的相互作用所驱动的,同时受到自然、经济、社会、制度等多种因素的影响。在不同尺度下,耕地非农化和非粮化现象的驱动因素也会有所不同,但主要可以归纳为3类因素:农户自身的主观因素、耕地的自然环境、以及由“人—地”互动关系所引发的社会经济因素。
根据分析框架(图1),本文首先基于相关理论将耕地利用实践过程暴露的管理问题转为科学问题,揭示非农化和非粮化1980—2020年的演变特征,基于土地经济理论建立驱动因素的指标体系,在此基础上量化单因子的影响程度及多因子交互作用,从而提出治理对策,促进农业可持续发展。
图1
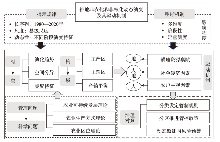
图1
耕地非农化、非粮化动态演变及其驱动机制分析框架
Fig. 1
The dynamic evolutions of cultivated land non-agricultural and non-grainand and their driving mechanism analysis framework
2.3 研究方法
2.3.1 空间自相关
式中:
2.3.2 核密度分析
2.3.3 指标构建
土地利用变化是人地关系的外在表现,能够客观反映人类经济活动对自然生态系统的累积作用。同样,耕地非农化和非粮化也是人地关系交互作用的结果。尽管不同尺度下非农化和非粮化的主导因子存在差异,变化机制也不尽相同,综合起来主要由耕地资源本底、社会经济及农户主观因素三方面驱动。
耕地资源和气候条件是农业生产的基础。中国呈现水热资源空间分布不匹配、耕地质量整体不高的特点,而作物对水热的需求和适应程度存在差异,导致了耕地用途和种植结构发生变化[37]。地形起伏较大、气候适宜性低、土壤肥力及酸碱性限制的区域粮食产量较低,降低了农户种植粮食意愿,加剧被动非农化和非粮化现象。因此,本文选取地形起伏度、气候生产潜力、土壤侵蚀程度、土壤有机碳含量、土壤pH反映农业资源环境本底。
用地方式及种植策略差异产生的比较效益是非农化和非粮化形成的重要原因。受农村发展经济需求和经济效益驱使,主动非农化和非粮化倾向不利于粮食的可持续供应[38]。城市化发展伴随着经济结构和人口结构的非农化,建设用地扩张和新兴产业均加剧了耕地非农化现象[39]。同时,农业劳动力的外流导致耕地撂荒或改种劳动力投入低、经济价值高的速生杨、苗木[6]。耕地流转后,单纯以经济效益为导向的种植决策加速了耕地非粮化[40]。此外,居民生活水平的提高产生了多样的食物需求,也促使农户放弃种植粮食转而种植收益高的经济作物[41]。因此,本文选取城镇化水平、地区生产总值、城乡人均可支配收入差距、农业比较效益和农业劳动力反映经济利益相关的驱动过程。
政策因素会通过影响农业生产结构从而加剧非粮化,但政策因素较为抽象,且长序列数据获取受限。乡村振兴及工商资本下乡会直接影响农业种植结构调整,其中耕地经营规模和农村固定资产投资指标是土地制度的直接体现,因此本文选用这两个指标反映管理水平和政策制度。此外,农民个体的行为会影响其对生产方式的选择,主要包括经营收益、劳动力本身的流动及结构,因此本文将性别比、农业劳动力,农业比较效益纳入非粮化的驱动指标。
表2 非农化驱动因子指标体系
Tab. 2
| 准则 | 维度 | 因子 | 描述 | 数据来源 |
|---|---|---|---|---|
| 自然环境 | 地形条件 | 地形起伏度(X1) | 地形起伏度是区域海拔高度和地表切割程度的综合表征 | 参考文献[45] |
| 气候条件 | 气候生产潜力(X2) | 最适气候状态下可能获得的最高单产 | FAO ( | |
| 土壤质量 | 土壤侵蚀(X3) | 单位面积和单位时段内被剥蚀并发生位移的土壤侵蚀量以土壤侵蚀模数表示 | 中国科学院资源环境科学数据中心( | |
| 土壤有机碳含量(X4) | 反映土壤养分状况,土壤中各种正价态的含碳有机化合物 | 国家地球系统科学数据中心土壤分中心( | ||
| 土壤pH(X5) | 不同作物对土壤酸碱性要求存在差异,粮食作物存在最适宜pH区间 | 国家地球系统科学数据中心土壤分中心( | ||
| 社会经济 | 生产条件 | 农业机械总动力(X6) | 农、林、牧、渔业的各种动力机械的动力总和,机械化程度高,可以显著提高经济作物生产效率 | 国家统计局 |
| 有效灌溉面积(X7) | 地块比较平整,有一定水源、灌溉设施配套,在一般年景下当年能进行正常灌溉的农田面积 | 国家统计局 | ||
| 旱涝保收面积(X8) | 按一定设计标准建造水利设施以保证遇到旱涝灾害仍能高产稳产的农田的面积 | 国家统计局 | ||
| 经济水平 | 城镇化水平(X9) | 城镇人口占年末常住人口的比重 | 国家统计局 | |
| 地区生产总值(X10) | 本地区所有常住单位在一定时期内生产活动的最终成果 | 国家统计局 | ||
| 城乡人均可支配收入差距(X11) | 城镇居民可支配性收入减去农村居民人均纯收入 | 国家统计局 | ||
| 农户因素 | 经营收益 | 农业比较效益(X12) | 农业收入占农林牧渔总产值的比重 | 国家统计局 |
| 劳动力流动 | 农业劳动力(X13) | 参加农业劳动的劳动力的数量,外出务工会减少农业劳动力 | 国家统计局 |
表3 非粮化驱动因子指标体系
Tab. 3
| 准则 | 维度 | 因子 | 描述 | 数据来源 |
|---|---|---|---|---|
| 自然环境 | 地形条件 | 地形起伏度(Y1) | 地形起伏度是区域海拔高度和地表切割程度的综合表征 | 参考文献[45] |
| 气候条件 | 气候生产潜力(Y2) | 最适气候状态下可能获得的最高单产 | FAO( | |
| 土壤质量 | 土壤侵蚀(Y3) | 单位面积和单位时段内被剥蚀并发生位移的土壤侵蚀量以土壤侵蚀模数表示 | 中国科学院资源环境科与数据中心( | |
| 土壤有机碳含量(Y4) | 反映土壤养分状况,土壤中各种正价态的含碳有机化合物 | 国家地球系统科学数据中心土壤分中心( | ||
| 土壤PH(Y5) | 不同作物对土壤酸碱性要求存在差异,粮食作物存在最适宜PH区间 | 国家地球系统科学数据中心土壤分中心( | ||
| 社会经济 | 生产条件 | 农业机械总动力(Y6) | 农、林、牧、渔业的各种动力机械的动力总和,机械化程度高,可以显著提高经济作物生产效率 | 国家统计局 |
| 有效灌溉面积(Y7) | 地块比较平整,有一定水源、灌溉设施配套,在一般年景下当年能进行正常灌溉的农田面积 | 国家统计局 | ||
| 旱涝保收面积(Y8) | 按一定设计标准建造水利设施以保证遇到旱涝灾害仍能高产稳产的农田的面积 | 国家统计局 | ||
| 工商资本下乡 | 耕地经营规模(Y9) | 农村居民家庭经营耕地面积反映农户耕种行为 | 国家统计局 | |
| 农村固定资产投资(Y10) | 农村固定资产投资额,反映工商资本对农村经济的投资情况 | 国家统计局 | ||
| 消费需求的变化 | 恩格尔系数(Y11) | 居民家庭中食物支出占消费总支出的比重,反映消费结构的变化 | 国家统计局 | |
| 农户因素 | 经营收益 | 农业比较效益(Y12) | 农业收入占农林牧渔总产值的比重 | 国家统计局 |
| 劳动力流动 | 农业劳动力(Y13) | 农林牧渔业劳动力(人),参加农业劳动的劳动力的数量,外出务工会减少农业劳动力 | 国家统计局 | |
| 劳动力结构 | 性别比(Y14) | 人口性别比(女性=100),反映劳动力本身的结构变化 | 国家统计局 |
2.3.4 地理探测器
地理探测器可以从定性和定量两方面检测影响因变量的独立因素,并确定因子之间的相互作用[49]。本文拟利用地理探测器检测:① 个体驱动因子对因子检测的解释力;② 不同因素之间的交互作用。因子检测的公式如下:
式中:q是指标对非农化或非粮化的解释程度;h为指标分级的数量;
表4 解释变量之间的交互作用
Tab. 4
| 因子关系 | 交互结果 |
|---|---|
| q(X1∩X2)<Min(q(X1),q(X2)) | 非线性减弱 |
| Min(q(X1),q(X2))<q(X1∩X2)<Max(q(X1)),q(X2)) | 单因子非线性减弱 |
| q(X1∩X2)>Max(q(X1),q(X2)) | 双因子增强关系 |
| q(X1∩X2)=q(X1)+q(X2) | 两因子独立 |
| q(X1∩X2)>q(X1)+q(X2) | 非线性增强 |
3 结果分析
3.1 非农化和非粮化空间演化特征
中国耕地非农化和非粮化呈现明显的空间分异。东北、华北和华南地区非农化较为严重,西北、西南以及东南沿海部分地区非粮化程度较高(图2、图3)。1980—1990年耕地非农化程度最高,内蒙部分县域较为严重,其中扎鲁特旗达到2014.36 km2。2015—2020年耕地非农化面积为101873.16 km2,内蒙、黑龙江、甘肃等省份的非农化程度显著高于周边省份。2015—2020年有68.57%的县非农化速度低于2000—2015年,平均增速降低了24.17%。整体上,中国耕地非农化呈扩大态势,但增幅逐渐减小,“胡焕庸线”以东的非农化程度较高,“非农”建设重心逐步向东南沿海区域转移,反映出人口及经济发展在其动态演化过程中的关键作用。
图2
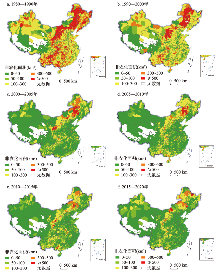
图2
1980—2020年中国县域耕地非农化现状空间分布
Fig. 2
Spatial distribution of non-agricultural level during 1980-2020
图3
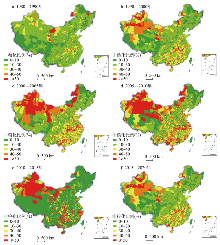
图3
1980—2020年中国县域耕地种植结构非粮化空间分布
Fig. 3
Spatial distribution of non-grain during 1980-2020
非粮化现象呈现由东北向西南逐渐加剧的空间格局,耕地非粮化程度较为严重的为西北、华东及华南地区。总体上,东北平原、华北平原等粮食主产区保持着较高的粮食种植水平,非粮化利用程度较低。而西北干旱地区、西南丘陵山区以及东南沿海地带耕地粮食播种面积占比相对较低,耕地非粮化趋势明显。1980年以来,中国耕地种植结构非粮化变迁主要经历了3个阶段,2005年之前为非粮化扩张阶段,非粮食作物播种面积大幅增加,种植结构发生显著变化。2005年后进入稳定阶段,粮食播种面积占比下降趋势得到改善,2015年后非粮化呈现下降态势。2015—2020年非粮食作物播种比例为29.51%,与2010—2015年相比下降3.12%。宁夏、陕西和新疆非粮化趋势增强。部分粮食主产区的县域也呈现非粮化加剧的趋势,例如河南中牟县2015—2020年非粮化程度比1980—1990年高出54.68%。1980—2000年、2000—2010年、2010—2020年分别有76.91%、55.96%和60.87%的县域呈现非粮化加剧趋势,可见尽管耕地非粮化增量未得到有效遏制,但空间范围逐渐缩小。
从粮食生产功能区来看,粮食主产区非农化面积由1980—1990年的245.94 km2下降至2015—2020年的43.66 km2,下降幅度为82.25%(表5)。主销区和产销平衡区的非农化程度分别下降84.07%、79.73%,反映了生产功能区在分担粮食生产责任时,粮食面积底线的保障是维持口粮自给率的必要条件。粮食主产区非农化面积在2000—2005年呈现大幅下降,然而东北地区非农化较为严重,为粮食安全和可持续发展带来挑战,需要高度警惕非农化和非粮化导致的耕地“量减质退”。主产区非粮化程度由1980—1990年的21.28%下降至2015—2020年的11.90%,而主销区仅下降0.83%,产销平衡区非粮化程度基本不变。粮食生产功能区非粮化程度均呈现先增长后下降的趋势,但下降拐点时间存在差异,其中主销区、产销平衡区在2005—2010年达到峰值(37.03%和31.85%),主产区在2000—2005年达到峰值(29.42%),表明主产区较早关注耕地非粮化问题,保持粮食播种面积稳中有增的态势。
表5 1980—2020年中国粮食生产功能区非农化面积及非粮化占比
Tab. 5
| 类型 | 粮食产区 | 1980—1990年 | 1990—2000年 | 2000—2005年 | 2005—2010年 | 2010—2015年 | 2015—2020年 |
|---|---|---|---|---|---|---|---|
| 非农化 面积(km2) | 主产区 | 245.94 | 192.10 | 67.70 | 61.10 | 57.09 | 43.66 |
| 主销区 | 158.33 | 128.86 | 42.67 | 51.67 | 33.19 | 25.22 | |
| 产销平衡区 | 272.91 | 192.47 | 64.05 | 67.12 | 67.56 | 55.33 | |
| 非粮化 占比(%) | 主产区 | 21.28 | 25.10 | 29.42 | 28.69 | 25.70 | 11.90 |
| 主销区 | 21.08 | 29.45 | 35.11 | 37.03 | 35.77 | 20.25 | |
| 产销平衡区 | 17.55 | 23.72 | 28.93 | 31.85 | 30.53 | 17.02 |
空间自相关分析结果表明中国的非农化和非粮化具有空间聚集特征(图4)。具体而言,全国22.14%的县呈现出非粮化高—高集聚现象,主要分布在新疆、湖南、广西和浙江等地区。另外,52.26%的县呈现非粮化低—低集聚,主要分布在东北地区和黄淮海平原,这与粮食主产区的分布基本一致。全国24.40%的县呈现高—高集聚,表明这些县的非农化水平较高且相互之间存在集聚现象。这些县主要分布在东北、华北、华中及华南地区,包括重庆、贵州、内蒙古、山西、黑龙江和北京等省份。另一方面,全国54.56%的县呈现低—低集聚,表明这些县的非农化水平相对较低且存在集聚现象,这些县主要分布在东南沿海及青藏高原地区。值得注意的是,尽管东南沿海地区的非农化总量不高,但其非农化耕地占总耕地面积的比例相对较高。非农化和非粮化在2000年和2010年后呈现出空间自相关减弱的趋势(表6),表明大规模连片的非农化和非粮化现象得到了缓解。Moran's I在所有阶段均在p < 0.05的显著性水平上显著,这说明非农化和非粮化空间分布符合地理学第一定律。这意味着需要加强区域联动管护方案,采取更加综合协调的方法防止耕地非粮化、遏制耕地非农化。
图4
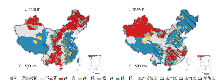
图4
2015—2020年中国县域耕地非农化和非粮化空间集聚图
Fig. 4
Spatial agglomeration of non-agricultural and non-grain in China's counties during 2015-2020
表6 1980—2020年中国非农化和非粮化空间分布全局莫兰指数
Tab. 6
| 类型 | 年份 | Moran's I | Z | p |
|---|---|---|---|---|
| 非农化 | 1980—1990年 | 0.22 | 85.08 | <0.001 |
| 1990—2000年 | 0.22 | 87.67 | <0.001 | |
| 2000—2005年 | 0.21 | 80.15 | <0.001 | |
| 2005—2010年 | 0.22 | 86.32 | <0.001 | |
| 2010—2015年 | 0.16 | 61.77 | <0.001 | |
| 2015—2020年 | 0.19 | 73.34 | <0.001 | |
| 非粮化 | 1980—1990年 | 0.18 | 69.75 | <0.001 |
| 1990—2000年 | 0.31 | 120.13 | <0.001 | |
| 2000—2005年 | 0.29 | 112.64 | <0.001 | |
| 2005—2010年 | 0.23 | 89.98 | <0.001 | |
| 2010—2015年 | 0.22 | 85.26 | <0.001 | |
| 2015—2020年 | 0.22 | 86.12 | <0.001 |
3.2 非农化和非粮化时间变化特征
从非粮化变化趋势来看,在大多数县域中,耕地非粮化速度< 5 %/a,但在西北及西南地区,非粮化转移的速度逐渐加快(>10 %/a)(图5)。1980—2000年间全国76.76%的县呈现小幅度增加趋势,非粮化变化速度的中值为0.48 %/a。其中青海省治多县和曲麻莱县的非粮化增长每年分别为5.21%和11.98%。2000—2010年全国非粮化趋势中值为0.17 %/a,而小幅度增加比例下降至54.56%,这意味着虽然非粮化现象有所扩大,但增速相对较缓和,且超过一半的县区得以保持相对稳定。不过在西藏、青海和甘肃地区非粮化现象正在逐渐加速,其中阿巴嘎旗、改则县和天峻县的增加幅度大于10%。2010—2020年非粮化趋势中值为0.25%/a,全国有56.59%的县区出现了小幅度增加趋势,新疆、甘肃、内蒙古和西藏地区的非粮化现象加剧程度较大。1980—2020年随着时间推移,非粮化呈现出“增长—平稳”的变化过程。核密度曲线位置整体呈现左移趋势,并且非粮化波峰存在变宽态势。此外,曲线峰值随着时间的推移先下降后上升,表明非粮化在县级尺度的异质性先增大后减小。
图5
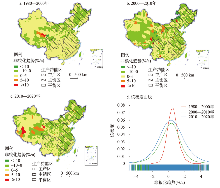
图5
1980—2020年中国非粮化趋势空间分布及核密度曲线
Fig. 5
Spatial distribution and kernel density curve of non-grain trend in China during 1980-2020
从不同粮食分区来看,尽管主产区、主销区和产销平衡区的非粮化均呈现先减弱再增强的变化趋势,但各功能区非粮化的变化幅度存在明显差异(表7)。1980—2020年主产区非粮化进程减缓,在2000—2010年甚至呈现下降趋势,反映了主产区农业生产仍以粮食作物为主。2010—2020年主销区非粮化增长速度分别为主产区和产销平衡区的1.49倍和1.33倍,表明经济发展的同时伴随着农业结构的转型。
表7 中国粮食生产功能区非农化和非粮化变化趋势
Tab. 7
| 类型 | 粮食产区 | 1980—2000年 | 2000—2010年 | 2010—2020年 |
|---|---|---|---|---|
| 非农化 (km2/a) | 主产区 | 21.91 | 6.44 | 5.04 |
| 主销区 | 2.92 | 4.72 | 14.36 | |
| 产销平衡区 | 6.19 | 6.60 | 23.43 | |
| 非粮化 (%/a) | 主产区 | 0.34 | -0.43 | 0.41 |
| 主销区 | 0.74 | 0.03 | 0.61 | |
| 产销平衡区 | 0.63 | 0.46 | 0.46 |
中国的非农化程度在1980—2020年逐渐减弱。其中,在1980—2000年,中国非农化趋势为15.03 km2/a,县域非农化超过20 km2/a的县占比高达35.77%,超过30 km2/a的县占比高达17.69%,其中黑龙江、内蒙、陕西、重庆、贵州、云南等省份较为突出。2000年后,非农化趋势得以缓解,2000—2010年仅为3.48 km2/a,县域非农化超过20 km2/a的县占比也相应地下降为4.43%,华南、华中地区的非农化趋势减弱。2010—2020年非农化趋势再次下降到了3.09 km2/a,县域非农化超过20 km2/a的县占比进一步减少至2.83%。可见,中国的非农化程度呈现出逐渐减弱的趋势,并且范围也在缩小(图6)。一定程度上证实了耕地“库兹涅茨曲线”假说,即当经济发展到一定程度,非农化受经济的影响会逐渐小,即非农化动态演化过程与经济发展存在倒“U”型关系[27]。事实上,1980—2020年非农化趋势曲线逐渐左移,1980—2000年曲线的形态具有右拖尾特征,表明少数区域的非农化程度相对较高,呈现出“高值聚集”的现象。2000年后,这种趋势有所减缓,即多数区域的非农化速度在向平均值靠拢。核密度曲线的波峰(即非农化在某个程度最高点)变窄,说明不同地区之间的非农化差距在逐渐缩小。
图6
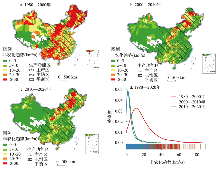
图6
1980—2020年中国非农化趋势空间分布及核密度曲线
Fig. 6
Spatial distribution and kernel density curve of non-agricultural trend in China during 1980-2020
粮食生产功能区的耕地非农化现象在各分区间存在明显差异,粮食主产区耕地非农化速度慢于主销区,主销区慢于产销平衡区。1980—2000年由于粮食主产区耕地面积基数较大,因而耕地面积减少的绝对值更大,2000年后主产区的非农化速度明显减缓,这一时期明确了不同地区粮食生产的责任,强化了由南粮北调转为北粮南运的粮食生产格局,在保护耕地、限制非农建设方面实行了严格的管制,一定程度上限制了主产区耕地向非农产业转移。与1980—2000年相比,2010—2020年主产区的非农化速度下降了77%,而产销平衡区非农化的增加速度分别是主销区和主产区的1.63倍和4.65倍。
3.3 非农化和非粮化驱动机制分析
非粮化的驱动因子在不同阶段呈现差异。农业结构调整是导致粮食播种面积减少的主要原因,这可能与近年来乡村振兴战略的实施有关,新型农业经济主体和工商资本下乡,从事非粮化农业生产,从而威胁到粮食安全。同时,在指标上体现为耕地经营规模、农村固定资产投资对耕地非粮化的主导作用。在这一过程中,其他社会经济因素也发挥了重要作用,2000年之后经济因素对非粮化的解释力增加。例如,消费需求、经营收益等都会影响农民的作物选择和土地利用方式。随着土地流转市场的发展和农业比较效益的逐渐形成,非粮食作物的经济效益逐步显现。此外,劳动力对对非粮化的解释力逐渐增加,反映了当人口结构失衡时,可能会出现劳动力短缺或者劳动力过剩的情况。这些变化会影响到该地区的农业生产结构,例如耕作技术的选择、农产品价格等方面。
1980—2020年社会经济是导致中国耕地非农化的首要驱动因素,而自然因素的驱动作用逐渐增强(图7)。其中,1980—2000年农业劳动力和农业比较效益对非农化的解释力分别为18.36%和8.48%。2000年后,自然因素对于耕地非农化的作用越来越重要,尤其是影响粮食生产的关键因子,例如气候生产潜力和耕地资源禀赋,而这些因素也反映了环境对于农业发展的重要性。2000—2010年气候生产潜力的解释力为17.11%,土壤有机质含量解释力为12.11%,加之城镇化发展浪潮(0.80%),导致耕地撂荒等现象加剧[50],这一阶段农业劳动力仍是社会经济维度对非农化解释力最大的因子(10.57%)。2010—2020年,城乡经济发展不平衡,结构性矛盾逐渐突出,地区生产总值和农业比较效益逐渐成为耕地非农化主要因素。粮食价格倒挂导致农民种植粮食的意愿降低,城镇化对非农化的解释力由1980—2000年的1.47%增长至5.66%。总体而言,城乡经济发展不平衡、城乡收入差距扩大、粮食价格倒挂等因素都在推动着中国耕地非农化。
图7
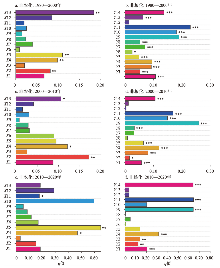
图7
2000—2020年不同时段各因子对中国非农化和非粮化的影响程度
注:图a、c、e指标缩写对应
Fig. 7
The impact of various factors on China 's non-agricultural and non-grain from 2000 to 2020
从各因子的交互效应来看,交互作用对非农化和非粮化的影响高于单因子影响程度,且表现为非线性增强(图8)。对于非粮化,自然条件和社会经济因子存在较强的交互作用,不同阶段因子之间的交互作用存在一定的差异,但普遍为地形、土壤因子叠加耕地经营规模、农村固定资产投资和恩格尔系数。农业劳动力、耕地土壤质量和经济发展程度对非农化的驱动存在交互作用。具体而言,1980—2000年农业劳动力与耕地质量的交互作用较强,这一时期农业生产主要依靠人力驱动,而耕地质量是影响产出的重要因素之一。2000年之后,随着技术的进步和现代化程度的提高,生产条件和耕地质量的交互作用对非农化具有一定的解释作用。近年来,随着经济的快速发展,城市扩张和工商业的增加导致部分质量不高的耕地被占用,主导交互作用因子为经济发展程度与耕地质量。
图8
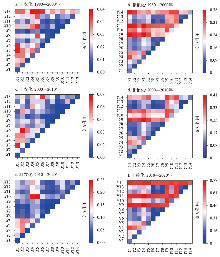
图8
不同时段各因子对中国非农化和非粮化的交互作用
注:图a、c、e指标缩写对应
Fig. 8
The interaction of various factors in China's non-agricultural and non-grain in different periods
4 讨论
4.1 非农化和非粮化演变特征及驱动因子比较
在保障粮食安全、确保粮食供给上升为国家重大战略任务,遏制非农化、防止非粮化上升为重大政治责任的背景下,本文对中国非农化和非粮化动态演变特征及其驱动因素进行系统且深入研究,对推动农地非农化和非粮化管控意义重大。
研究发现,1980—2020年中国非农化现象得到有效控制,南方地区存在非粮化叠加风险,这与中国近年来粮食生产重心北移的格局一致。从演变特征来看,非农化和非粮化趋势在一定程度上相关,但在发展速度和拓展方向存在差异。1980—2020年中国的非农化程度不断减弱,而非粮化存在明显的阶段性特征。需要指出的是,华东和西南地区虽然非农化趋势有所好转,但非粮化趋势却仍十分明显。在拓展方向上,非农化,非农化是向外延伸,而非粮化则涉及农村内部种植结构的变化。长远来看,北方耕地利用和灌溉强度高的区域粮食生产范围正在扩大[54],而南方降水充足、适宜性较高的区域却退出粮食主产区,无序非农化和非粮化扩大了土地和用水强度较高地区的耕地比例,对中国农业的可持续发展带来了潜在挑战[55]。这表明区域经济水平、发展战略和地域功能的差异性,决定了各地区之间耕地非农化和非粮化的规模和程度差异。
单因子分析和交互作用分析均表明社会经济是驱动非农化的首要因素,这与已有的研究结果一致[13,15]。本文的分阶段结果显示,2010—2020年城镇化水平对非农化的解释程度相较于1980—2000年增加了2.85倍。一方面,城镇化过程导致耕地占用,预计在2000年至2030年期间,全球因城市扩张而损失的耕地的1/4将发生在中国[56]。然而,经济社会发展对建设用地的需求和土地非农化之间存在平衡点,适度非农化阈值有助于提高城镇化与粮食安全的协调度[57]。另一方面,城镇化过程中农村青壮年劳动力由第一产业流向第三产业,作为农业最主要的生产要素,农业劳动力的老弱化导致耕地撂荒现象加剧[58-59]。此外,居民生活水平的提高产生了多样化的食物和营养需求,也促使农户放弃种植粮食转而种植比较收益更高的水果、蔬菜等经济作物[60]。自然和经济社会因素叠加,导致不同地区各有差异。自然地理条件和经济发展水平地域分异显著,不同地区发展战略和政策环境也各不相同,导致不同区域之间耕地非农化和非粮化类型和规模的差异。西北、西南等边远山区和经济落后地区由于地形、水源限制等不适宜规模化经营,加之农业生产要素短缺,耕地被动撂荒现象较多[61-62]。经济发达地区受农村发展和经济效益驱动,地方政府和农民往往愿意主动调整农业种植结构、改变土地利用方式,发展耕地多功能利用[63-64]。尤其在气候变化加剧背景下,西北、江淮等地区旱情严重,影响农户种植粮食意愿,耕地撂荒明显,加速驱动耕地向非农化和非粮化转变[65]。
4.2 政策建议
在中国粮食供需紧平衡态势下,本文结合相关结果提出以下政策建议:
(1)科学划分非农化和非粮化类别,分类设定管制规则和补贴机制。粮食生产格局演变是自然、经济、社会等多重因素长期综合作用的结果,中国耕地非农化和非粮化存在显著的空间差异性特征,需要根据粮食生产功能区差异,构建长效化、区域化的治理方案。系统梳理各种耕地非粮化行为,根据对耕作层的破坏及其粮食生产能力恢复的难易程度,以及对耕地安全的影响程度,分门别类地进行类别划分,明确每个类别的确切内涵与划分标准。在明确非粮化类别的基础上,制定差别化管制措施与处置办法。如,对于类似挖塘养鱼彻底破坏耕作层的行为,应严格禁止并责令其恢复原状;对于会带走大量表土或破坏土壤理化特征、严重影响粮食生产能力的行为,应严格控制并制定相应的土壤保护措施;对于有利于恢复耕地地力的耕地轮作种植行为,则应有计划地给予适当鼓励。对于粮食主销区、产销平衡区和主产区需要实行差异化粮食补贴政策。同时,逐步构建不同区域的粮食生态补偿机制。通过粮食主销区的财政转移支付支持粮食外销区,让其有更大的粮食生产积极性并得到相应的经济补偿,从而保障中国粮食安全。
(2)合理识别非农化和非粮化成因,分区推进管控政策。深入识别不同区域非农化和非粮化主控因素及其形态特征,据此分区制定管理政策。应高度重视粮食主产区耕地非粮化趋势,严防任何形式的耕地非粮化。加强生态脆弱区农田基础设施建设,完善干旱区水利设施,推广高效节水灌溉,加大丘陵山区农田防护林、农业机械化投入,减少资源环境限制,促进土地规模化经营。科学评估非农化和非粮化的综合风险等级分布,适当鼓励经济发达地区农业种植结构调整,充分利用耕地资源,发展乡村产业,提高农民收入,实现乡村振兴。
(3)加强动态监测与风险预警,确保非农化和非粮化可逆、可控。探索实行省、市、县、乡、村多级联动、空间全覆盖的耕地保护网格化跟踪监管。充分运用卫星遥感影像等信息技术手段,结合实地调查,对全国耕地非农化和非粮化的数量、质量、分布等进行全方位科学评估,建立综合评价、动态监测的耕地非农化和非粮化风险预警平台。通过动态监测和风险预警,确保耕地非农化和非粮化始终在警戒线以下,非粮化耕地可以随时重新播种粮食作物。
(4)以“党政同责”为抓手,加强责任监督与考核。健全责任考核机制,将防止耕地非农化和非粮化,稳定粮食生产列入地方政府党政主要负责同志政绩考核和离任审计事项,将耕地质量保护提升、粮食种植面积和产量保障、高标准农田建设等纳入政绩考核范围,切实提高粮食主产区保障粮食安全的动力,提升主销区和产销平衡区保供的危机感。进一步完善土地管理相关法律和制度,明晰责任主体,压实土地用途管制责任。
4.3 研究展望
本文从多时段识别了县级尺度非农化和非粮化的时空分异和驱动机制,弥补了大尺度、长序列研究的不足。为今后更全面、系统地揭示机制、实施管控提供理论依据。尽管非粮食作物播种比例并不等同于耕地非粮化生产类型,但其变化能在一定程度上反映非粮化的整体态势,能够从宏观尺度上反映中国非粮化的整体态势,但其无法进一步反映耕地内部结构的变化和非粮化扩张的空间格局,后续有待结合遥感数据对非粮化数量、类型、空间分布等进行更深入的分析。同时,在农业转型升级和可持续发展的背景下,非农化和非粮化的定义在不断更新。具体而言,耕地非农化的传统定义主要强调耕地非农化是指将耕地转变为非农用地的过程。新时期耕地非农化不仅是耕地利用结构的调整,还是农业生产方式的转型,非农化包括耕地向城市或工业、服务业部门的转移,还包括耕地转为林地、草地等其他农用地及农业设施建设用地,例如绿化造林、城乡绿化建设、扩大自然保护地占用的耕地。近年来中国粮食需求端正在发生重大变化,城乡居民饮食消费已实现由“吃得饱”向“吃得好”的历史性转变,食物结构呈现多源化、营养化的特点,而非粮化能够增加蔬菜、水果等食物的供给,一定程度上有利于居民膳食结构优化和增强粮食利用水平。因此,从不同角度考虑(供给侧、需求侧),非粮化会产生不同的粮食安全效应,非粮化政策中的“粮”应从本意的传统粮食(谷类、薯类、豆类)延伸扩展到食物,以准确评估非粮化对不同层次粮食安全的影响程度。
5 结论
非农化和非粮化演变特征及其驱动机制的识别是稳定粮食生产、保障粮食安全的重要内容,同时也是区域治理非农化和非粮化的科学依据。破解非农化和非粮化难题成为新时期国家粮食安全战略的重要内容。本文以阶段性演化为切入视角,揭示了1980—2020年中国县域尺度非农化和非粮化状态及动态演变特征,揭示非农化和非粮化的主要驱动因子。主要得到以下结论:
(1)中国非农化和非粮化具有明显的空间聚集效应,分别有22.14%、24.40%的县呈现高—高集聚,“胡焕庸线”以东的非农化程度较高,东南沿海地区的非农化程度在2000年后逐渐减弱。非粮化现象呈现由东北向西南逐渐加剧的空间格局,且1980年以来呈现逐步扩大的态势。
(2)1980—2020年非农化程度减弱且范围缩小,2010—2020年非农化平均速度为3.09 km2/a,较1980—2000年趋势减弱79.40%。非粮化经历了“增长—平稳“的变化过程,2005年之前为非粮化扩张阶段,2005年后进入稳定阶段,2015年后非粮化呈现下降态势。
(3)粮食生产功能区的耕地非农化和非粮化现象在各分区间存在明显差异,1980—2020年主产区非粮化进程减缓,在2000—2010年甚至呈现下降趋势,而2010—2020年主销区非粮化增长速度分别为主产区和产销平衡区的1.49和1.33倍。粮食主产区耕地非农化速度慢于主销区,主销区慢于产销平衡区。与1980—2000年相比,2010—2020年主产区的非农化速度下降了77%,而产销平衡区非农化的增加速度分别是主销区和主产区的1.63倍和4.65倍。
(4)非农化和非粮化的主要驱动因子随发展阶段而异。耕地资源禀赋是导致非粮化的基础原因,农民的逐利行为是决定耕地非粮化根本原因,且土壤质量、地形因子与社会经济交互作用较为显著。农业劳动力为非农化的显著影响因子,城镇化对非农化的解释力逐渐增强。
参考文献
The debate on the advantages and disadvantages of industrial and commercial capital going to the countryside: Based on the perspective of interest game
工商资本下乡利弊之争: 基于利益博弈的视角
Urban and rural integration and rural revitalization in the new era of China
DOI:10.11821/dlxb201804004
[本文引用: 1]

Cities and villages are components of a specific organism. Only the sustainable development of two parts can support the prosperous development as a whole. According to the theory of man-earth areal system, urban-rural integrated system and rural regional system are the theoretical bases for entirely recognizing and understanding urban-rural relationship. To handle the increasingly severe problems of "rural disease" in rapid urbanization, accelerating rural revitalization in an all-round way is not only a major strategic plan for promoting the urban-rural integration and rural sustainable development, but also a necessary requirement for solving the issues related to agriculture, rural areas, and rural people in the new era and securing a decisive victory in building a moderately prosperous society in all respects. This study explores the basic theories of urban-rural integration and rural revitalization and analyzes the main problems and causes of rural development in the new era, proposing problem-oriented scientific approaches and frontier research fields of urban-rural integration and rural revitalization in China. Results show that the objects of urban-rural integration and rural revitalization is a regional multi-body system, which mainly includes urban-rural integration, rural complex, village-town organism, and housing-industry symbiosis. Rural revitalization focuses on promoting the reconstruction of urban-rural integration system and constructs a multi-level goal system including urban-rural infrastructure networks, zones of rural development, fields of village-town space and poles of rural revitalization. Currently, the rural development is facing the five problems: high-speed non-agricultural transformation of agriculture production factors, over-fast aging and weakening of rural subjects, increasingly hollowing and abandoning of rural construction land, severe fouling of rural soil and water environment and deep pauperization of rural poverty-stricken areas. The countryside is an important basis for the socioeconomic development in China, and the strategies of urban-rural integration and rural revitalization are complementary. The rural revitalization focuses on establishing the institutional mechanism for integrated urban-rural development and constructs the comprehensive development system of rural regional system, which includes transformation, reconstruction and innovation in accordance with the requirements of thriving businesses, pleasant living environments, social etiquette and civility, effective governance, and prosperity. Geographical research on rural revitalization should focus on the complexity and dynamics of rural regional system and explore new schemes, models and scientific approaches for the construction of villages and towns, which are guided by radical cure of "rural disease", implement the strategy of rural revitalization polarization, construct the evaluation index system and planning system of rural revitalization, thus providing advanced theoretical references for realizing the revitalization of China's rural areas in the new era.
中国新时代城乡融合与乡村振兴
DOI:10.11821/dlxb201804004
[本文引用: 1]
城市与乡村是一个有机体,只有二者可持续发展,才能相互支撑。依据人地关系地域系统学说,城乡融合系统、乡村地域系统是全新认知和理解城乡关系的理论依据。针对日益严峻的“乡村病”问题,全面实施乡村振兴,既是推进城乡融合与乡村持续发展的重大战略,也是破解“三农”问题,决胜全面建成小康社会的必然要求。本文探讨了新时代城乡融合与乡村振兴的基础理论,剖析了乡村发展面临的主要问题,提出了问题导向的中国城乡融合与乡村振兴科学途径及研究前沿领域。结果表明:① 城乡融合与乡村振兴的对象是一个乡村地域多体系统,包括城乡融合体、乡村综合体、村镇有机体、居业协同体,乡村振兴重在推进城乡融合系统优化重构,加快建设城乡基础网、乡村发展区、村镇空间场、乡村振兴极等所构成的多级目标体系。② 中国“三农”问题本质上是一个乡村地域系统可持续发展问题,当前乡村发展正面临主要农业生产要素高速非农化、农村社会主体过快老弱化、村庄建设用地日益空废化、农村水土环境严重污损化和乡村贫困片区深度贫困化等“五化”难题。③ 乡村是经济社会发展的重要基础,城乡融合与乡村振兴战略相辅相成,乡村振兴应致力于创建城乡融合体制机制,推进乡村极化发展,按照产业兴旺、生态宜居、乡风文明、治理有效、生活富裕的要求,构建乡村地域系统转型—重构—创新发展综合体系。④ 乡村振兴地理学研究应着眼于乡村地域系统的复杂性、综合性、动态性,探究以根治“乡村病”为导向的新型村镇建设方案、模式和科学途径,为实现新时代中国乡村振兴战略提供理论参考。
Resilient space for arable land conservation in China under multi-scenario food security bottom-line constraints
DOI:10.11821/dlxb2022003014
[本文引用: 1]
Under new international and domestic situations, scientific analysis of China's cultivated land quantity and its protection ways is of great significance for ensuring national food security and sustainable resources and environment development. This paper analyzes the amount of cultivated land under the constraints of multi-scenario food security within shared social-economic paths (SSPs), using model methods such as cultivated land retention, population forecast, food demand estimation, and yield potential decay. According to the multi-dimensional urgency assessment framework based on productivity characteristics-health status-farming, China's resilience-space for cultivated land protection is delineated by coupling the quantitative boundary control of time series and the regional rules of spatial scale. On the premise of satisfying the assumption of individual basic nutrition security and the constant variables of crop yield conditions, we obtain the following findings. (1) China's multi-scenario cultivated land retention will decline from 2020 to 2100. Existing cultivated land is sufficient to maintain long-term food security, but it barely reaches the critical range of theoretical food security (140 million-159 million hm2) in the short term. (2) The urgency of cultivated land protection in different dimensions presents different distribution characteristics within the nine agricultural zones. The North China Plain and the Middle-lower Yangtze River, which have superior natural conditions suitable for farming, are clusters of high-value plots of comprehensive urgency. (3) The sustainable scenario (SSP1) and the regional conflict scenario (SSP3) represent the minimum and maximum cultivated land retention scenarios under the constraints of food security bottom line. Given the current international situation, China should ensure that the short-term (before 2035) fallow land is not higher than 9.29%. (4) The resilience-space of cultivated land protection delineated based on time and space coupling can be divided into priority protection area, strict control area, rest area, strategic reserve area, comprehensive consolidation area, and special protection area. The flexibility, objectives and tasks of cultivated land protection in different divisions have their priorities. Overall, delineating resilience-space for cultivated land protection facilitates the establishment of spatial planning systems for cultivated land, such as agricultural structure adjustment and fallow policy improvement. This study provide a reference for research on the transformation of China's cultivated land protection system.
多情景粮食安全底线约束下的中国耕地保护弹性空间
DOI:10.11821/dlxb2022003014
[本文引用: 1]
科学解析中国耕地数量保多少与如何保等问题对保障国家粮食安全与资源环境可持续发展具有重要意义。面向共享社会经济路径(SSPs)的多情景粮食安全底线约束,本文试图利用耕地保有量、人口预测、粮食需求估算、单产提升潜力衰减等模型方法,依据产能特征—健康状态—耕作条件—利用水平的多维度耕地保护紧迫性评估框架,通过耦合时间序列的数量边界控制与空间尺度的区域规则约束刻画出中国的耕地保护弹性空间。在满足个人基本营养安全与作物单产条件干扰变量恒定的假设前提下,研究发现:① 中国多情景耕地保有量在2020—2100年间呈下降态势,现有耕地数量足以维持长期的粮食安全,但短期内则仅勉强达到理论粮食安全的临界区间1.40×10<sup>8</sup>~1.59×10<sup>8</sup> hm<sup>2</sup>。② 不同维度耕地保护紧迫性在九大农业区划内呈现差异化分布特征,自然条件优越且适宜耕作的黄淮海平原区与长江中下游地区是综合紧迫性高值地块集聚区域。③ 可持续情景与区域冲突情景分别代表粮食安全底线约束下的最小与最大耕地保有量情景,在当前国际形势下,中国应保证短期(2035年内)可休耕量不高于9.29%。④ 基于时空耦合划定的耕地保护弹性空间可分为优先保护、严格管控、休养生息、战略储备、整治修复和特殊保护6类,不同空间的耕地保护弹性强度、目标与任务各有侧重。整体而言,耕地保护弹性空间的划定思路有助于农业结构调整、休耕政策完善等耕地空间规划体系构建,对中国耕地保护制度转型具有借鉴价值。
Systematic cognition and research framework of arable land non-food: From food security to multi-dimensional security
耕地非粮化的系统认知与研究框架: 从粮食安全到多维安全
Analysis on influencing factors of rice acreage evolution in Dongting Lake area in recent 30 years
DOI:10.31497/zrzyxb.20201015
[本文引用: 2]
It is of great significance to study the spatial and temporal evolution and driving mechanism of multi-cropping rice area to ensure Chinese grain production and security. The Nich index and geo-detector model were used to explore the spatial and temporal dynamics and main influencing factors of one-cropping rice and double-cropping rice planting in Dongting Lake Area from 1987 to 2017. The results show that: (1) In the past 30 years, the proportion of one cropping rice in the hilly area was greater than that in the central plain, and the overall trend was increasing; with a tendency to decrease first and then increase in Wuling district, Yuanjiang city and other places from 2007 to 2017. (2) From 1987 to 2002, the relative development rates of the area of one-cropping rice and double-cropping rice showed a high gradient pattern in the west and low in the east. From 2002 to 2017, one-cropping rice showed a high-low-high banding pattern, while double-cropping rice showed a pattern of high in the north and low in the south. (3) The results of geo-detector models in 1987 and 2017 showed that the effect of effective irrigation area, industrial workers, agricultural workers, and the total output value of agriculture, forestry, animal husbandry and fishery exerted influence on rice area. This research results provide a basis for optimizing the adjustment of rice planting structure.
近30年来洞庭湖地区水稻种植面积演变的影响因素分析
DOI:10.31497/zrzyxb.20201015
[本文引用: 2]
研究多熟制水稻面积时空演变及驱动机制对保障我国粮食生产和安全具有重要意义。综合运用Nich指数和地理探测器模型,探讨了洞庭湖地区1987—2017年一季稻和双季稻种植面积的时空动态变化及主要影响因素。结果表明:(1)近30年来,位于丘岗山地区的一季稻面积比例大于中部平原地区,整体呈上升的变化趋势;武陵区、沅江市等地在2007—2017年呈先降后升的变化趋势。(2)1987—2002年间一季稻和双季稻面积相对变化率呈西高东低的梯度型变化模式;2002—2017年间一季稻呈高—低—高的条带状变化模式,双季稻呈北高南低的变化发展模式。(3)1987年和2017年地理探测模型结果表明,有效灌溉面积、工业从业人员、农业从业人员、农林牧渔总产值对水稻面积影响程度不断加深。研究结果可为水稻种植结构调整提供参考依据。
Spatial characteristics and migration path of cultivated land non-agricultural in Guangxi border region
广西边境地区耕地非农化的空间特征与迁移路径
Spatio-temporal differentiation of arable land and its driving mechanism in Guangdong Province
DOI:10.18402/resci.2022.03.05
[本文引用: 1]
Food security is the cornerstone of national economic development and social stability. The increasingly serious problem of cultivated land non-grain conversion intensifies the risk of food insecurity and directly affects the sustainable development of China's social and economic systems. From the perspective of non-grain production of food, this study selected Guangdong Province as the research area and county as the evaluation unit and based on socioeconomic statistics and geospatial data, using Theil index, spatial autocorrelation model, random forest model, principal component analysis, and cluster analysis to examine the spatiotemporal characteristics, influencing factors, and driving types of cultivated land non-grain conversion in 2005 and 2019. The results show that: (1) The non-grain rate of cultivated land in Guangdong Province increased from 48.47% in 2005 to 54.65% in 2019. The non-grain degree of cultivated land had changed from low to moderate, and the spatial differentiation of non-grain rate of cultivated land showed a decreasing trend, especially in the Pearl River Delta area. (2) The spatial distribution of non-grain cultivated land maintained a stable agglomeration state and showed high concentration in the Pearl River Delta area and low concentration in the east wing, west wing, and mountainous sub-regions of the province. (3) Road network density and GDP per square kilometer had significant promoting effects on cultivated land non-grain conversion, while the proportion of labor force in rural primary industry and distance between counties and provincial capital cities were important factors to restrain the cultivated land non-grain conversion. (4) The main driving type of cultivated land non-grain conversion was economy driven (44.63%), mainly distributed in the Pearl River Delta area. This was followed by agriculture supporting type (33.06%), mostly distributed in the mountainous areas. The resource dependency type was the least dominant (22.31%) and was concentrated in the east and west wing sub-regions. This research result is conducive to accurately identify the spatiotemporal characteristics of cultivated land non-grain conversion in Guangdong Province, improve the risk control level of local cultivated land non-grain conversion, and has important theoretical and practical significance for sustainable agricultural development and ensuring regional food security.
广东省耕地非粮化的时空分异及其驱动机制
DOI:10.18402/resci.2022.03.05
[本文引用: 1]
粮食安全是保障国家经济发展和社会稳定的基石,日益严峻的耕地非粮化问题加剧了粮食安全风险,直接影响中国社会经济的可持续发展。本文从食物性生产的非粮化角度,选取广东省为研究区域,以县域为评价单元,运用社会经济统计数据及地理空间数据,集成Theil指数、空间自相关模型、随机森林模型、主成分分析和聚类分析等方法,从全省四大区域角度探讨了广东省2005和2019年耕地非粮化的时空演变特征、影响因素及其驱动类型。结果表明:①广东省耕地非粮化率由2005年的48.47%上升至2019年的54.65%,耕地非粮化程度由低度为主转向中度为主,且耕地非粮化利用空间差异呈现缩小态势,以珠三角的演变差异最为显著。②耕地非粮化的空间分布保持稳定的集聚状态,并以珠三角的高高集聚和东翼、西翼、山区的低低集聚为主。③路网密度、地均GDP对耕地非粮化存在显著的推动作用,农村第一产业劳动力占比、各县到省会城市距离是抑制耕地非粮化的重要因素。④耕地非粮化驱动类型以经济驱动型为主(44.63%),主要分布在珠三角;其次是农业支持型(33.06%),大多分布在山区;资源依赖型占比最少(22.31%),集聚在东、西两翼。研究结果有利于精准识别广东省耕地非粮化的时空特征,提升当地耕地非粮化的风险管控水平,对于农业可持续发展以及保证地区的粮食安全具有重要的理论与现实意义。
Spatiotemporal changes of cropping structure in China during 1980-2011
DOI:10.1007/s11442-018-1535-4
[本文引用: 1]
Understanding the spatial and temporal variations of cropping systems is very important for agricultural policymaking and food security assessment, and can provide a basis for national policies regarding cropping systems adjustment and agricultural adaptation to climate change. With rapid development of society and the economy, China’s cropping structure has profoundly changed since the reform and opening up in 1978, but there has been no systematic investigation of the pattern, process and characteristics of these changes. In view of this, a crop area database for China was acquired and compiled at the county level for the period 1980-2011, and linear regression and spatial analysis were employed to investigate the cropping structure type and cropping proportion changes at the national level. This research had three main findings: (1) China’s cropping structure has undergone significant changes since 2002; the richness of cropping structure types has increased significantly and a diversified-type structure has gradually replaced the single types. The single-crop types—dominated by rice, wheat or maize—declined, affected by the combination of these three major food crops in mixed plantings and conversion of some of their planting area to other crops. (2) In the top 10 types, 82.7% of the county-level cropping structure was rice, wheat, maize and their combinations in 1980; however, this proportion decreased to 50.7% in 2011, indicating an adjustment period of China’s cropping structure. Spatial analysis showed that 63.8% of China’s counties adjusted their cropping structure, with the general change toward reducing the main food types and increasing fruits and vegetables during 1980-2011. (3) At the national level, the grain-planting pattern dominated by rice shifted to coexistence of rice, wheat and maize during this period. There were significant decreasing trends for 47% of rice, 61% of wheat and 29.6% of maize cropping counties. The pattern of maize cropping had the most significant change, with the maize proportion decreasing in the zone from northeastern to southwestern China during this period. Cities and their surroundings were hotspots for cropping structural adjustment. Urbanization has significantly changed cropping structure, with most of these regions showing rapid increases in the proportion of fruit and vegetables. Our research suggests that the policy of cropping structural adjustment needs to consider geographical characteristics and spatial planning of cropping systems. In this way, the future direction of cropping structural adjustment will be appropriate and scientifically based, such as where there is a need to maintain or increase rice and wheat cropping, increase soybean and decrease maize, and increase the supply of fruit and vegetables.
How to get out of the "non-grain" dilemma of land transfer
如何走出土地流转非粮化困局
Spatio-temporal evolution and macro mechanism of land transfer price in China
DOI:10.18402/resci.2018.11.07
[本文引用: 1]
In recent years, the studies of land circulation are frequently seen in research field, but, up to now, there is still no general judgement on the basic situation of land circulation price in China. Based on the land circulation price data at the provincial level of 2009 and 2017, this paper adopts ESDA method and space econometric model to carry out the analysis of the spatio-temporal evolution and macro differentiation mechanism of land circulation price in China. The results show that land circulation price overall rose 33.28% between 2009 and 2017, but the growth rates were uneven among provinces. In general, the superposition area of the eastern developed regions and the main grain producing areas increased greatly, while the southeast coastal areas and the northwest hinterland increased slowly. Besides, the land circulation price was decreasing from east to west, and presented inverted u-shaped structure from north to south. Moreover, Land circulation price showed a significant "HH-LL" clustering structure among provinces, and with the development of land circulation market, the spillover effect is further strengthened. Finally, spatial econometric analysis shows that the differentiation of land circulation price among provinces in China is mainly affected by regional economic factors. With the development of land circulation market, the role of natural factors is decreasing, while the influence of regional economic factors and cultivated land resources endowment is further strengthened. Based on this study, this paper suggests that we should follow the objective law of spatial differentiation of land circulation price in China, avoid blind price comparison, timely regulate the land circulation price and restrain excessive capitalization of cultivated land.
中国土地流转价格时空演化与宏观机制研究
DOI:10.18402/resci.2018.11.07
[本文引用: 1]
虽然近年来有关土地流转的研究频繁见诸报端,但至今对中国土地流转价格的基本情况仍缺少总体判断。为此,本文以2009年和2017年2期省域层面的土地流转价格数据为基础,采用ESDA方法和空间计量模型,开展了全国土地流转价格时空演化及宏观分化机制的分析。研究结果表明:2017年土地流转价格较2009年整体上涨,但各省域之间的增幅不均衡,东部发达地区和粮食主产区的叠加区增幅较大,而东南沿海和西北腹地增幅较缓,京沪地区基本持平;土地流转价格在全国尺度上呈现出“东西向递减,南北向U型”的分布格局;土地流转价格在省域之间呈现出显著的“HH-LL”聚类结构,且随着土地流转市场的发展,外溢作用进一步加强;宏观机制分析发现,中国省域间的土地流转价格分化主要受区位经济因素影响,随着土地流转市场的发育,自然因素的作用在减小,而区位经济因素和人地资源禀赋因素的影响则进一步增强。基于研究结果,本文建议,应遵循中国土地流转价格空间分化规律,避免盲目的价格攀比,并适时调控流转价格,抑制土地过度资本化。
Spatial pattern evolution and influencing factors of rural non-agricultural land in typical suburban counties: A case study of Xiangtan county, Hunan province
典型城郊县域乡村土地非农化空间格局演变及影响因素研究: 以湖南省湘潭县为例
Characteristics and mechanism of arable land ungrain in rapid urbanization area
快速城镇化地区的耕地非粮化特征及其机理
Spatial pattern differentiation of non-grain cultivated land in main grain producing areas and its causes
粮食主产区耕地非粮化空间格局分异及其成因
The degree difference and driving force of rural non-agricultural industrialization in Yishui county, Shandong province
DOI:10.11821/dlxb201506013
[本文引用: 2]
In the rapid process of industrialization and urbanization, non-agriculturalization has become one important tendency of Chinese rural evolution, which at the same time indicates obvious spatial heterogeneity. The participatory rural appraisal is employed, which involves 16 typical villages of Yishui County in Shandong Province, to explore the rural non-agricultural differences and its driving factors. In terms of regional differentiation, the livelihood activities of rural households were divided into four types: non-agricultural employment outside the county, non-agricultural employment inside the county, part-time non-agricultural employment inside the county and agricultural production. Then, we quantified the non-agricultural level by estimating the proportion of rural non-agricultural labor, non-agricultural income and non-agricultural time in 2013. On the basis of this estimation, we discussed the spatial differences and driving forces of rural non-agriculturalization in the study area. The results showed that, (1) Non-agricultural level of the villages was between 37.54% and 90.65%, which indicated that non-agriculturalization was a common phenomenon in traditional agricultural regions. Suburban independent non-agricultural villages developed their own industries, while rural households of other villages were employed in non-agricultural industries outside their villages. It is indicated that the study area was underdeveloped in non-agricultural economy. (2) Suburban villages hold the highest non-agricultural level. Food crops dominated villages showed higher level of non-agriculturalization in the regions near town, while economic crops dominated villages showed lower level of non-agriculturalization. In the same geomorphologic region, food crops dominated villages showed higher level of non-agriculturization than economic crops dominated villages. Spatial differentiation of rural non-agriculturalization was remarkable in traditional agricultural regions at the county scale. (3) As the distances to town became shorter, there was a decline in the proportion of non-agricultural employment outside the county (labor, income, and time), and that inside the county was on the rise, and the proportion of part-time non-agricultural employment inside the county showed an inverted "U"-shaped pattern. (4) The driving mechanism showed that economic diffusing efficiency and the regional accessibility were both deeply influencing employment structure of rural labors, which kept the suburban villages at the highest non-agricultural level. Agricultural income and the demand for labor made non-agricultural level of food crops dominated villages higher than that of economic crops dominated villages. As the distances to town became shorter, owing to economic diffusing efficiency and agricultural income increase, food crops dominated villages showed higher level of non-agriculturalization while economic crops dominated villages showed lower level. Non-agricultural differentiation is an important development trend of traditional agricultural regions in East China. Therefore, the authors suggest that the governments should take concrete measures on rural development management that keep consistent with non-agricultural characteristics and its driving mechanism of different villages.
山东省沂水县农村非农化程度差异及驱动力
DOI:10.11821/dlxb201506013
[本文引用: 2]
非农化是中国快速工业化、城镇化进程中农村演变的重要趋势,呈现出明显的空间异质性。以山东省沂水县为例,选取16个典型样点村,根据农户就业地域空间差异,将农户就业划分为县域外非农就业、县域非农就业、县域非农兼业和农业生产4类,在此基础上,选取非农就业劳动力、收入和时间比例3个指标研究县域农村非农化程度差异及驱动力。结果表明,沂水县农村非农化程度介于37.54%~90.65%,非农化现象普遍。县域农村非农化程度的总体分布特征为:近郊村最高;随着与城镇的临近,粮食作物主导村提高、经济作物主导村降低;同一地形区内,粮食作物主导村高于经济作物主导村。农村非农分化趋势明显。驱动力研究表明,受县域城镇经济实力、农村到城镇的可达性,农业收益及劳动需求量等的综合影响,不同类型农村劳动力就业结构存在差异,进而导致县域农村非农化程度的差异。研究认为,当前农村非农化普遍,且非农分化明显。政府应根据不同类型农村非农化程度差异的内容及驱动因素,实施差别化的农村发展管理措施。
Study on farmers' crop selection mechanism in the intercropping zone: A case study of Taiwusi Banner, Inner Mongolia
农牧交错区农户作物选择机制研究: 以内蒙古太仆寺旗为例
Research progress and prospect of information acquisition methods of abandoned farmland
撂荒耕地信息获取方法研究进展与展望
A new framework to map fine resolution cropping intensity across the globe: Algorithm, validation, and implication
Spatial pattern differentiation and driving mechanism of non-grain arable land in China
中国耕地非粮化空间格局分异及驱动机制
Farmers' non-farming, interest awakening and homestead transfer: Based on the questionnaire survey and orderly Logit model of Zhejiang farmers
农户非农化、利益唤醒与宅基地流转: 基于浙江农户问卷调查和有序Logit模型
Socio-economic driving forces of land-use change in Kunshan, the Yangtze River Delta economic area of China
This paper analyzes characteristics, major driving forces and alternative management measures of land-use change in Kunshan, Jiangsu province, China. The study used remote sensing (RS) maps and socio-economic data. Based on RS-derived maps, two change matrices were constructed for detecting land-use change between 1987 and 1994, and between 1994 and 2000 through pixel-to-pixel comparisons. The outcomes indicated that paddy fields, dryland, and forested land moderately decreased by 8.2%, 29% and 2.6% from 1987 to 1994, and by 4.1%, 7.6% and 8% from 1994 to 2000, respectively. In contrast, the following increased greatly from 1987 to 1994: artificial ponds by 48%, urban settlements by 87.6%, rural settlements by 41.1%, and construction land by 511.8%. From 1994 to 2000, these land covers increased by 3.6%, 28.1%, 23.4% and 47.1%, respectively. For the whole area, fragmentation of land cover was very significant. In addition, socio-economic data were used to analyze major driving forces triggering land-use change through bivariate analysis. The results indicated that industrialization, urbanization, population growth, and China's economic reform measures are four major driving forces contributing to land-use change in Kunshan. Finally, we introduced some possible management measures such as urban growth boundary (UGB) and incentive-based policies. We pointed out that, given the rapidity of the observed changes, it is critical that additional studies be undertaken to evaluate these suggested policies, focusing on what their effects might be in this region, and how these might be implemented.
Food production security in major producing areas: Status, challenge and guarantee path
主产区粮食生产安全: 地位、挑战与保障路径
On land consolidation and rural space reconstruction
Currently, the implementation of new type industrialization, new type urbanization and agricultural modernization strategy lacks of a major hand grip and spatial sustain platform, due to long-term existed "dual-track" structure of rural-urban development in China as well as unstable rural development institution and mechanism and backward rural and agricultural infrastructures, which greatly affects the advancement of urban-rural integration development. It is necessary to restructure rural production, living and ecological space by carrying out land consolidation, so as to establish a new platform for building new countryside and realize urban-rural integration development in China. This paper develops the concept and connotation of rural spatial restructuring, i.e., an optimization and adjustment even utterly changing process of rural production, living and ecological space accompanied by rural socio-economic structure reshaping under the pressure of rapid industrialization and urbanization. The connotations of rural spatial restructuring involve three aspects of assembling industrial development, centralizing farmers' living and intensive resources utilization. Based on the effects analysis of industrialization and urbanization on rural production, living and ecological space, this paper also probes the mechanism which push forward rural spatial restructuring by carrying out land consolidation, an important approach to supplying cultivated land, revitalizing the stock land, optimizing rural-urban land, utilizing land intensively, and increasing land productivity. A conceptualization of the models of rural production, living and ecological environment spatial restructuring is analyzed in combination with agricultural land consolidation, hollowed villages consolidation and industrial and mining land consolidation. Finally, the author argues that a "bottom-up" restructuring strategy accompanied by a few "top-down" elements is helpful for smoothly pushing forward current rural spatial restructuring in China. The optimization and restructuring of rural intensive and high-efficient production space, suitable living space with amenity and ecological space with beautiful mountain and clean water will rely on the innovation of regional engineering technology, policy mechanism and mode of rural land consolidation, and more attentions should be paid to rural space, the foundation base and platform for realizing urban-rural integration development.
论土地整治与乡村空间重构
目前,中国新型工业化、城镇化和农业现代化的推进仍缺乏重要抓手和空间支撑平台,严重影响了城乡一体化发展进程。亟需通过开展农村土地综合整治,重构乡村生产、生活和生态空间,为推进新农村建设和城乡一体化发展搭建新平台。本文在界定了乡村空间重构,即在快速工业化和城镇化进程中,伴随乡村内生发展需求和外源驱动力综合作用下导致的农村地区社会经济结构重新塑造,乡村地域上生产空间、生活空间和生态空间的优化调整乃至根本性变革的过程,及其产业发展集聚、农民居住集中和资源利用集约3 个方面内涵的基础上,分析了工业化和城镇化进程对乡村生产、生活和生态空间的影响;探讨了乡村空间重构的土地整治类型及助推机制;结合农用地整治、"空心村"整治和工矿用地整治提出了乡村生产、生活和生态空间重构的模式与途径,以及依托土地整治的以"自下而上"为主、"自上而下"为辅的乡村空间重构战略。作为城乡一体化发展根基的乡村空间其重要性和基础平台作用应受到足够重视,乡村集约高效的生产空间、宜居适度的生活空间和山清水秀的生态空间的优化重构,有赖于区域农村土地整治工程技术、政策机制与模式的创新。
Research on the non-grain of cultivated land from the perspective of agricultural land capitalization
农地资本化视角下的耕地非粮化研究
Spatial differentiation and influencing factors of cultivated land "non-grain" in Shandong province
山东省耕地非粮化空间分异特征及其影响因素分析
30 m annual land cover dataset and its dynamics in China from 1990 to 2019
DOI:10.5194/essd-13-3907-2021
URL
[本文引用: 2]
. Land cover (LC) determines the energy exchange, water and carbon cycle between Earth's spheres. Accurate LC information is a fundamental parameter for the environment and climate studies. Considering that the LC in China has been altered dramatically with the economic development in the past few decades, sequential and fine-scale LC monitoring is in urgent need. However, currently, fine-resolution annual LC dataset produced by the observational images is generally unavailable for China due to the lack of sufficient training samples and computational capabilities. To deal with this issue, we produced the first Landsat-derived annual China land cover dataset (CLCD) on the Google Earth Engine (GEE) platform, which contains 30 m annual LC and its dynamics in China from 1990 to 2019. We first collected the training samples by combining stable samples extracted from China's land-use/cover datasets (CLUDs) and visually interpreted samples from satellite time-series data, Google Earth and Google Maps. Using 335 709 Landsat images on the GEE, several temporal metrics were constructed and fed to the random forest classifier to obtain classification results. We then proposed a post-processing method incorporating spatial–temporal filtering and logical reasoning to further improve the spatial–temporal consistency of CLCD. Finally, the overall accuracy of CLCD reached 79.31 % based on 5463 visually interpreted samples. A further assessment based on 5131 third-party test samples showed that the overall accuracy of CLCD outperforms that of MCD12Q1, ESACCI_LC, FROM_GLC and GlobeLand30. Besides, we intercompared the CLCD with several Landsat-derived thematic products, which exhibited good consistencies with the Global Forest Change, the Global Surface Water, and three impervious surface products. Based on the CLCD, the trends and patterns of China's LC changes during 1985 and 2019 were revealed, such as expansion of impervious surface (+148.71 %) and water (+18.39 %), decrease in cropland (−4.85 %) and grassland (−3.29 %), and increase in forest (+4.34 %). In general, CLCD reflected the rapid urbanization and a series of ecological projects (e.g. Gain for Green) in China and revealed the anthropogenic implications on LC under the condition of climate change, signifying its potential application in the global change research. The CLCD dataset introduced in this article is freely available at https://doi.org/10.5281/zenodo.4417810 (Yang and Huang, 2021).
The economic mechanism and governance path of farmland "non-grain"
耕地“非粮化”的经济机制与治理路径
Problems, causes and countermeasures of "non-grain conversion" of cultivated land
耕地非粮化问题、成因及对策
Analysis on the difference of "non-grain conversion" of different types of farmers to agricultural land
不同类型农户转入农地的“非粮化”差异分析
Marx and Engels' theory of agricultural production mode and its practical significance
马克思恩格斯农业生产方式理论及其现实意义
Simple diagnostic tests for spatial dependence
DOI:10.1016/0166-0462(95)02111-6 URL [本文引用: 1]
The dynamic evolution and trend prediction of green TFP growth: An empirical study based on five major urban agglomerations in China
绿色TFP增长的动态演进及趋势预测: 基于中国五大城市群的实证研究
How global warming alters future maize yield and water use efficiency in China
Spatiotemporal coupling evolution and regional regulation of grain-tillage value ratio and planting structure in China
DOI:10.11821/dlxb202211003
[本文引用: 1]
Both the food production value on arable land and the structure of food crop cultivation have impacted on national food security. Therefore, exploring changes in their spatial and temporal coupling patterns can help us to understand their relationships and to further improve food security. In this research, we took provincial-level regions in China as the object, and based on an in-depth interpretation of the connotation of the grain-to-arable value ratio and cropping structure, Simpson's index model, coupling coordination model and spatial auto-correlation are comprehensively used to study the spatial and temporal evolution patterns of grain-to-arable value ratio and cropping structure in the study area from 2004 to 2020, and the spatial and temporal dynamics between them in different regions are revealed in consequence. The results show that: (1) The spatial distribution of the grain-to-arable value ratio in all the provincial-level regions from 2004 to 2020 shows a double-decreasing characteristic, one from north to south and the other from west to east; (2) The spatial pattern of cropping structure shows a Hu-Huanyong-line-ridge in terms of spatial distribution, where Northeast, North and East China witness a significant decrease in crop diversity; (3) The degree of coupling coordination between the grain-to-arable value ratio and cropping structure is found between barely coupled and coordinated and highly coupled and coordinated, showing regular spatial clustering characteristics. In the central, western and northeastern China, there is a high-high concentration with matching advantage; in the southeast coastal region, there is a low-low concentration for matching improvement; and the overall distribution presents a pattern of high in the northeast and central regions, and low in the southeast. The study believes that, based on the heterogeneous characteristics of the spatial concentration and diffusion of factors, the synergistic evolution of food quality and diversity on arable land should be encouraged according to the local conditions, so as to promote the harmonious development of food structure and efficiency.
中国粮耕价值比与种植结构时空耦合演化及分区调控
DOI:10.11821/dlxb202211003
[本文引用: 1]
耕地粮食产出价值与种植结构均深刻影响着国家粮食安全,探讨耕地粮食产出价值与种植结构的时空耦合变化,可理清两者关系,助力粮食安全保障能力的提升。本文以中国省级行政单元为研究对象,在深刻解读粮耕价值比和种植结构内涵的基础上,综合利用Simpson指数、耦合协调度模型和空间自相关等方法,分析2004—2020年中国粮耕价值比和种植结构耦合时空演化,以揭示其时空动态关系。结果表明:① 2004—2020年各省份粮耕价值比空间分布特征表现为“由北向南”和“由西向东”的双重递减态势;② 种植结构空间格局呈现由“胡焕庸线”沿线区域向两侧递减的空间分布形态,东北、华北和华东地区多样性递减明显;③ 粮耕价值比与种植结构耦合协调度介于勉强耦合协调与高度耦合协调之间,表现为规律性空间集聚,中西部及东北地区呈高高集聚,具有“匹配性优势”,东南沿海地区呈低低集聚,有待“匹配性改良”,总体表现为:“东北、中部高,东南部低”的态势。本文认为应依据要素空间集聚和扩散的分异特征,因区施策引导耕地粮食品质化与多元化协同演进,促进粮食结构与效益匹配发展。
Coupling relationship and spatial characteristics of ecological civilization construction and urbanization in the Yellow River Economic Belt
DOI:10.31497/zrzyxb.20210106 URL [本文引用: 1]
黄河经济带生态文明建设与城市化耦合关系及空间特征研究
Elastic space of arable land protection in China under the constraint of multi-scenario grain security bottom line
DOI:10.11821/dlxb2022003014
[本文引用: 1]
Under new international and domestic situations, scientific analysis of China's cultivated land quantity and its protection ways is of great significance for ensuring national food security and sustainable resources and environment development. This paper analyzes the amount of cultivated land under the constraints of multi-scenario food security within shared social-economic paths (SSPs), using model methods such as cultivated land retention, population forecast, food demand estimation, and yield potential decay. According to the multi-dimensional urgency assessment framework based on productivity characteristics-health status-farming, China's resilience-space for cultivated land protection is delineated by coupling the quantitative boundary control of time series and the regional rules of spatial scale. On the premise of satisfying the assumption of individual basic nutrition security and the constant variables of crop yield conditions, we obtain the following findings. (1) China's multi-scenario cultivated land retention will decline from 2020 to 2100. Existing cultivated land is sufficient to maintain long-term food security, but it barely reaches the critical range of theoretical food security (140 million-159 million hm2) in the short term. (2) The urgency of cultivated land protection in different dimensions presents different distribution characteristics within the nine agricultural zones. The North China Plain and the Middle-lower Yangtze River, which have superior natural conditions suitable for farming, are clusters of high-value plots of comprehensive urgency. (3) The sustainable scenario (SSP1) and the regional conflict scenario (SSP3) represent the minimum and maximum cultivated land retention scenarios under the constraints of food security bottom line. Given the current international situation, China should ensure that the short-term (before 2035) fallow land is not higher than 9.29%. (4) The resilience-space of cultivated land protection delineated based on time and space coupling can be divided into priority protection area, strict control area, rest area, strategic reserve area, comprehensive consolidation area, and special protection area. The flexibility, objectives and tasks of cultivated land protection in different divisions have their priorities. Overall, delineating resilience-space for cultivated land protection facilitates the establishment of spatial planning systems for cultivated land, such as agricultural structure adjustment and fallow policy improvement. This study provide a reference for research on the transformation of China's cultivated land protection system.
多情景粮食安全底线约束下的中国耕地保护弹性空间
DOI:10.11821/dlxb2022003014
[本文引用: 1]
科学解析中国耕地数量保多少与如何保等问题对保障国家粮食安全与资源环境可持续发展具有重要意义。面向共享社会经济路径(SSPs)的多情景粮食安全底线约束,本文试图利用耕地保有量、人口预测、粮食需求估算、单产提升潜力衰减等模型方法,依据产能特征—健康状态—耕作条件—利用水平的多维度耕地保护紧迫性评估框架,通过耦合时间序列的数量边界控制与空间尺度的区域规则约束刻画出中国的耕地保护弹性空间。在满足个人基本营养安全与作物单产条件干扰变量恒定的假设前提下,研究发现:① 中国多情景耕地保有量在2020—2100年间呈下降态势,现有耕地数量足以维持长期的粮食安全,但短期内则仅勉强达到理论粮食安全的临界区间1.40×10<sup>8</sup>~1.59×10<sup>8</sup> hm<sup>2</sup>。② 不同维度耕地保护紧迫性在九大农业区划内呈现差异化分布特征,自然条件优越且适宜耕作的黄淮海平原区与长江中下游地区是综合紧迫性高值地块集聚区域。③ 可持续情景与区域冲突情景分别代表粮食安全底线约束下的最小与最大耕地保有量情景,在当前国际形势下,中国应保证短期(2035年内)可休耕量不高于9.29%。④ 基于时空耦合划定的耕地保护弹性空间可分为优先保护、严格管控、休养生息、战略储备、整治修复和特殊保护6类,不同空间的耕地保护弹性强度、目标与任务各有侧重。整体而言,耕地保护弹性空间的划定思路有助于农业结构调整、休耕政策完善等耕地空间规划体系构建,对中国耕地保护制度转型具有借鉴价值。
Research on the legal regulation of preventing farmland from becoming "non-grain"
防止耕地非粮化的法律规制研究
Will the transfer of agricultural land lead to the utilization of agricultural land "non-grain"? Empirical analysis based on the plot level
农地流转会导致农地利用非粮化吗? 基于地块层面的实证分析
Research on China's food security under global climate change
DOI:10.31497/zrzyxb.20180436
[本文引用: 1]
Food is one of the basic human needs. Achieving food security is one of the important goals of “The 2030 Agenda for Sustainable Development”. However, there is lack of system review of mutual influence between safeguarding food security and global climate change. Accordingly, this paper reports a critical review of the existing researches related to interactions between ensuring food security and global climate change. Effects of global climate change on the food system, impacts of ensuring food security on global climate change and adapting food security strategies against global climate change were systematically reviewed. The results indicated that, firstly, global climate change had increased uncertainty in the food system which had great impact on China’s food production. Secondly, demand for food was one of the main drivers of global climate change, and the reconfiguration of crop production elements exacerbated global climate change. Thirdly, a synthetic approach is required for food security adaption strategies against global climate change, specifically, in the micro-level promoting technological progress and scientific management, in the meso-level strengthening resources and environment protection, and in the macro-level adhering to the laws of market and improving food policy system. Moreover, under the background of global climate change, research on ensuring food security presents two major trends: one is the change from single discipline, one dimension and single means into multi-disciplinary, multi-scale, multi-factor, comprehensive and integrated approach; the other is to turn a high-carbon food system into a low-carbon and high-efficient food system.
全球气候变化下的中国粮食安全问题研究
DOI:10.31497/zrzyxb.20180436
[本文引用: 1]
粮食是人类生存的基础,保障粮食安全是“2030年可持续发展议程”的重要目标之一。论文基于粮食系统视角,从全球气候变化对粮食系统的作用、保障粮食安全对全球气候变化的影响,以及应对全球气候变化的粮食安全适应性策略出发,揭示粮食安全与全球气候变化的相互作用,系统梳理全球气候变化下的中国粮食安全问题。研究结果表明:1)全球气候变化导致粮食系统不确定性增加,且对中国粮食生产的影响加剧;2)粮食需求是全球气候变化的主要驱动力,粮食生产要素的重新配置加剧了全球气候变化;3)多尺度有机结合应对全球气候变化保障粮食安全需在微观上“藏粮于技”实现提质增效,在中观上“藏粮于地”注重生态建设,在宏观上坚持市场为主导完善粮食政策体系。全球气候变化背景下,保障粮食安全研究呈现从单一学科、单一维度、单一手段向依靠多学科开展多尺度、多要素、系统综合集成研究保障粮食安全转变,从高碳粮食系统向低碳高效粮食系统转变的趋势。
Geographical detectors‐based health risk assessment and its application in the neural tube defects study of the Heshun region, China
DOI:10.1080/13658810802443457 URL [本文引用: 2]
Chinese topographic relief kilometer grid dataset
中国地形起伏度公里网格数据集
Identification of the spatial distribution pattern and driving forces of underground parking space based on multi-source data: A case study of Fuzhou city in China
Quantifying influences of natural factors on vegetation NDVI changes based on geographical detector in Sichuan, western China
DOI:10.1016/j.jclepro.2019.05.355 URL [本文引用: 1]
Attribution analysis of land degradation in Hainan Island based on geographical detector
Geoprobe: Principles and prospects
DOI:10.11821/dlxb201701010
[本文引用: 1]
Spatial stratified heterogeneity is the spatial expression of natural and socio-economic process, which is an important approach for human to recognize nature since Aristotle. Geodetector is a new statistical method to detect spatial stratified heterogeneity and reveal the driving factors behind it. This method with no linear hypothesis has elegant form and definite physical meaning. Here is the basic idea behind Geodetector: assuming that the study area is divided into several subareas. The study area is characterized by spatial stratified heterogeneity if the sum of the variance of subareas is less than the regional total variance; and if the spatial distribution of the two variables tends to be consistent, there is statistical correlation between them. Q-statistic in Geodetector has already been applied in many fields of natural and social sciences which can be used to measure spatial stratified heterogeneity, detect explanatory factors and analyze the interactive relationship between variables. In this paper, the authors will illustrate the principle of Geodetector and summarize the characteristics and applications in order to facilitate the using of Geodetector and help readers to recognize, mine and utilize spatial stratified heterogeneity.
地理探测器: 原理与展望
DOI:10.11821/dlxb201701010
[本文引用: 1]
空间分异是自然和社会经济过程的空间表现,也是自亚里士多德以来人类认识自然的重要途径。地理探测器是探测空间分异性,以及揭示其背后驱动因子的一种新的统计学方法,此方法无线性假设,具有优雅的形式和明确的物理含义。基本思想是:假设研究区分为若干子区域,如果子区域的方差之和小于区域总方差,则存在空间分异性;如果两变量的空间分布趋于一致,则两者存在统计关联性。地理探测器q统计量,可用以度量空间分异性、探测解释因子、分析变量之间交互关系,已经在自然和社会科学多领域应用。本文阐述地理探测器的原理,并对其特点及应用进行了归纳总结,以利于读者方便灵活地使用地理探测器来认识、挖掘和利用空间分异性。
The extent of farmland abandonment and its impact on grain yield in major grain-producing areas of China
DOI:10.31497/zrzyxb.20210607
[本文引用: 1]
Cultivated land abandonment has a profound impact on China's food security. Taking the main grain producing areas in China as an example and based on the identification of the distribution of abandoned land, this paper measured the spatial distribution pattern of abandoned land, established the mediating effect model of cultivated land abandonment, and explored the influence mechanism of cultivated land abandonment on regional grain yield. The results showed that: (1) The area of abandoned cultivated land in the main grain producing areas of China was 4.0553 million hectares, with a rate of 5.85%; the distribution of abandoned land presented a T-shaped pattern, mainly concentrated in the Northeastern Heilongjiang, Northwestern Jilin and Southern Inner Mongolia. (2) Cultivated land abandonment had a significant negative impact on the grain yield of the main grain producing areas. In 2017, these areas lost a farmland production potential of 13.3915 million tons, and the loss of grain output was as high as 22.656 million tons, accounting for 4.69%; Inner Mongolia was the most affected region. (3) Grain sown area, farmland production potential, and agricultural technology input all played an intermediary role, and their regression coefficients were -0.194, -0.025 and 0.006, respectively. (4) We should follow the trend of urban-rural integration and agricultural-rural development, strengthen the input of modern agricultural production factors and policy support in major grain producing areas, and construct the flexible mechanism of spatial transformation between grain production and cultivated land fallow to ensure food security in China.
中国粮食主产区耕地撂荒程度及其对粮食产量的影响
DOI:10.31497/zrzyxb.20210607
[本文引用: 1]
耕地撂荒严重地影响着我国的粮食安全。以我国粮食主产区为研究区域,在识别撂荒地分布的基础上,测度了撂荒地空间分布格局,并建立耕地撂荒中介效应模型,探究了耕地撂荒对区域粮食产量的影响机制。结果表明:(1)中国粮食主产区耕地撂荒规模为405.53万hm<sup>2</sup>,撂荒率约为5.85%;空间上撂荒地规模分布呈“T”字形空间格局,黑龙江东北部、吉林西北部以及内蒙古南部地区为撂荒地主要集聚区。(2)耕地撂荒对于粮食主产区粮食产量具有显著负向影响,2017年我国粮食主产区因耕地撂荒损失的农田生产潜力达到1339.15万t,损失的粮食产量高达2265.6万t,损失比例达4.69%;内蒙古自治区成为粮食产出损失量和损失比例最大的地区。(3)粮食播种面积、农田生产潜力和农业技术投入均发挥了部分中介作用,系数分别为-0.194、-0.025和0.006。(4)应遵从城乡融合以及农业农村发展态势,强化粮食主产区农业生产现代要素投入与政策扶植,构建粮食生产—耕地休耕空间转换弹性机制,保障我国粮食安全。
Spatial distribution characteristics of negative external benefits of non-grain cultivation in grain production and marketing balance area
粮食产销平衡区耕地非粮化负外部效益空间分布特征
Spatio-temporal differences of food security level in food functional areas and diagnosis of obstacles
我国粮食功能区粮食安全水平的时空差异及障碍诊断
Assessing the consequence of land use change on agricultural productivity in China
DOI:10.1016/j.gloplacha.2008.12.012 URL [本文引用: 1]
Progress towards sustainable intensification in China challenged by land-use change
DOI:10.1038/s41893-018-0076-2 [本文引用: 1]
Future urban land expansion and implications for global croplands
DOI:10.1073/pnas.1606036114
PMID:28028219
[本文引用: 1]
Urban expansion often occurs on croplands. However, there is little scientific understanding of how global patterns of future urban expansion will affect the world's cultivated areas. Here, we combine spatially explicit projections of urban expansion with datasets on global croplands and crop yields. Our results show that urban expansion will result in a 1.8-2.4% loss of global croplands by 2030, with substantial regional disparities. About 80% of global cropland loss from urban expansion will take place in Asia and Africa. In both Asia and Africa, much of the cropland that will be lost is more than twice as productive as national averages. Asia will experience the highest absolute loss in cropland, whereas African countries will experience the highest percentage loss of cropland. Globally, the croplands that are likely to be lost were responsible for 3-4% of worldwide crop production in 2000. Urban expansion is expected to take place on cropland that is 1.77 times more productive than the global average. The loss of cropland is likely to be accompanied by other sustainability risks and threatens livelihoods, with diverging characteristics for different megaurban regions. Governance of urban area expansion thus emerges as a key area for securing livelihoods in the agrarian economies of the Global South.
Research on moderate non-agricultural land in China's Bohai Rim
中国环渤海地区县域土地适度非农化研究
DOI:10.11849/zrzyxb.2013.06.001
[本文引用: 1]
基于土地非农化与经济发展阶段耦合规律的理论分析,应用承载力模型,开展了2008年环渤海地区县域土地非农化适度性的评价和土地适度非农化阈值的界定。结果表明:①受区域土地资源禀赋与经济社会需求的影响,经济社会发展对非农建设用地的需求与建设用地供给之间呈现为正反双向的"S"型曲线,两者之间的耦合变化规律以工业化完成阶段最为显著;②工业化初期至后期阶段土地非农化趋势表现为缓慢增长,土地适度非农化阈值为10.0%~17.5%;③工业化与城镇化驱动作用强度决定着土地非农化规模的区域差异。因地制宜、科学调控土地非农化进程是区域可持续发展的重要保障。
Progress in research on urban-rural relations and its implications for rural revitalization
DOI:10.11821/dlyj020180880
[本文引用: 1]
With the implementation of rural vitalization strategy, China has stepped into a critical period with the dramatic changes of urban-rural relations and the accelerating transformation development of rural territorial system. Scientifically understanding the research progress of urban-rural relation theory and evolution rule is of great significance for boosting rural vitalization, narrowing urban-rural disparity, adjusting urban-rural structure and optimizing urban-rural patterns. This paper elaborates the research progress of urban-rural relations and rural development in China from the dimensions of economy, society, ecology and culture based on the review of foreign urban-rural relations and the characteristics of domestic rural development, as well as the evolution of urban-rural relation. Furthermore, prospect of research focus or key fields in the future were given. Firstly, transforming the development idea from productivism oriented to post-productivism oriented and attaching importance to the multiple values of rural areas should be emphasized. Therefore, it is necessary to carry out intensive studies about the mechanism, regional path selection and development mode of rural vitalization based on the theory of rural multiple function transition. Understanding the relationship of different functions is essential for dealing with rural decline and realizing the comprehensive vitalization. Meanwhile, we should focus on the mechanism and format of rural vitalization based on different territorial types. Against the context of rural-urban integrated development, we should promote the supply-side reform and activate the forces of socio-economic growth in underdeveloped areas. As for the developed rural areas, the “hybridity” should be emphasized and further studies should be conducted. In some rural areas, the phenomenon of the hybridity of development agents, the combination of production space and living space, the mixture of rurality and modernism have emerged. Accordingly, more emphasis should be placed on the heterogeneity and diversity in the process of rural restructuring. Secondly, with the emergence of new factors or new technologies, we should focus on the new morphology of rural development, such as characteristic towns, rural complex and “Taobao village”. In recent years, China's rural areas have undergone intensive restructuring motivated by e-commerce, which has triggered a new wave of rural rejuvenation. But how e-commerce affects rural development and the characteristics of this process are still unclear, and this is important for understanding the urban-rural relations under the context of informatization. Thirdly, the mechanism and format of urban-rural spatial restructuring should be emphasized. From the perspective of urban-rural interaction, the theory of urban-rural network may be practical and meaningful for optimizing the spatial distribution of infrastructure construction and industrial development. Lastly, creating or improving the theory and improving the path of rural vitalization according to the national conditions are meaningful for realizing the strategy.
城乡关系研究进展及其对乡村振兴的启示
DOI:10.11821/dlyj020180880
[本文引用: 1]
随着乡村振兴战略的实施,我国已经进入城乡关系变革及乡村发展快速转型的关键时期。科学认知国内外城乡关系理论发展和演变规律对实施乡村振兴战略、缩小城乡差距、调整城乡结构和优化城乡格局具有重要意义。本文在系统梳理国外城乡关系理论及我国乡村发展与城乡关系演进的阶段性特征的基础上,从经济、社会、生态及文化的视角阐述了我国乡村发展与城乡关系研究的相关进展,并在此基础上探讨了未来重点的研究领域和方向。乡村发展思维应由生产主义导向转向后生产主义,关注乡村多元价值,深化基于乡村多功能转型理论的乡村振兴机制、区域路径与模式研究;在科技迅速发展,新事物新因素大量涌现的新时代,应关注特色小镇、田园综合体、民宿及乡村电子商务等新兴乡村转型发展形态的形成机制;同时,基于不同地域类型的乡村振兴的机制与模式研究也应得到重视,结合国际乡村地理学前沿,深入开展发达地区乡村的混杂性研究。广泛的城乡空间重构进程对乡村地区产生剧烈的影响与挑战,对于乡村振兴视角下城乡空间重构的动力机制与模式的研究仍需持续关注;根据我国的特殊国情,创新适合我国基本国情与发展实际的乡村振兴理论与实现路径,推动城乡融合发展。
Differentiation of farmland abandonment degree and spatial pattern in Chinese terraces
DOI:10.11821/dlxb202301001
[本文引用: 1]
With urbanization and industrialization, cultivated land in hilly regions of China has been gradually marginalized. Abandoned cultivated lands have ranged from inferior sloping land and extended to high-quality terraces. The abandonment of terraces will lead to a series of social and ecological problems, especially with large-scale abandonment. Therefore, the degree and spatial distribution of terrace abandonment should be evaluated scientifically to address the issue of abandonment as well as its effects. This study investigated the extent of terrace abandonment in China via a questionnaire sampling method. Based on 560 village questionnaires from 329 counties in China, the scale of terrace abandonment was calculated and the spatial heterogeneity characteristics and primary reasons for terrace abandonment were further analyzed. Study results showed that: (1) The phenomenon of terrace abandonment was observed throughout China, occurring in 54% of all the villages investigated; 9.79% of the total terraced areas have been abandoned. (2) The degree of terrace abandonment showed a spatial pattern of "high in the south and low in the north". The degree of terrace abandonment was higher in the southern hilly mountains, and the middle and lower reaches of the Yangtze River was the most serious. (3) The primary factors related to terrace abandonment were found to be labor migration, the degree to which terraces have been mechanized, irrigation conditions, and farming traffic conditions. Measures that include improving the degree of terrace mechanization should be enacted to address the problem of terrace abandonment. An orderly "conversion of cropland" could be applied to poor-quality terraces. Changing the planting structure, strengthening new agricultural infrastructure, and encouraging circulation and large-scale operations are options that could be applied to good-quality terraces.
中国梯田撂荒程度及空间格局分异研究
DOI:10.11821/dlxb202301001
[本文引用: 1]
在城镇化和工业化的驱动下,中国丘陵山区耕地逐渐被边际化,耕地撂荒范围也迅速从劣质的坡耕地延展至优质的梯田,大规模梯田撂荒将会引发一系列社会和生态效应,科学评估中国山区梯田的撂荒程度及空间分布将有助于有效地应对耕地撂荒问题。本文通过全国抽样调查的方式对中国梯田的撂荒程度进行了调查,利用获取的中国329个县的560份村问卷测算了中国梯田撂荒规模,并进一步分析了梯田撂荒空间分异特征及驱动因素。结果显示:① 全国梯田撂荒现象分布广泛,发生梯田撂荒的村庄占总调查村庄的比例为54%,撂荒面积占梯田总面积的比例达到9.79%;② 梯田撂荒程度呈现“南高北低”的特征,南方丘陵山区较为严重,尤以长江中下游地区为最;③ 梯田撂荒的主要因素可归结为农业劳动力外出务工、梯田耕作机械化程度、灌溉条件、耕作交通条件等。减缓梯田撂荒,应因区精准施策,提高梯田区机械化水平等措施具有普适性,针对质量较差的梯田,可有序“退耕”,对于质量较好的梯田,可采用调整种植结构、加强农业基础设施建设、鼓励流转与规模经营等方式。
Spatial and temporal characteristics of arable land abandonment in China from 1992 to 2017 based on meta-analysis
DOI:10.11821/dlxb201903001
[本文引用: 1]
Cropland abandonment has increasingly occurred in China, which potentially affects national food and ecological security. This study collected existing publications focusing on cropland abandonment. Then, we extracted the key characteristics of cropland abandonment events, including time, location, magnitude, and driving force. The meta-analysis was carried out on these items to disclose the spatio-temporal pattern and main drivers of cropland abandonment in China in the last three decades. We found that there were a total of 163 counties in which cropland abandonment occurred according to the existing literature. These counties were mostly located in southern China and, in particular, exhibited a pattern of a T-shape on 90 degree anticlockwise rotation. The vertical axis exhibited a north-south belt across southeastern Gansu Province, eastern Sichuan Province, Chongqing, western Guizhou Province, and northern Yunnan Province. The horizontal axis exhibited a west-east belt along the middle to lower reaches of the Yangtze River across southern Hubei Province, northern Hunan Province,w and central to southern Anhui Province. In the provinces of Hunan, Sichuan, and Anhui, cropland abandonment can be found in 24, 23, and 21 counties, respectively; in Hubei, Chongqing, Fujian, Gansu, and Yunnan provincial-level areas, there are more than 10 counties with cropland abandonment. The formation of the “T” structure underwent two stages. Before 2010, there were 102 counties with cropland abandonment that mainly existed along the middle to lower reaches of the Yangtze River, where the horizontal axis occurred. Since 2010, there have been 63 counties with cropland abandonment, mostly existing in the north-south belt from southeastern Gansu to northern Guizhou, where the vertical axis occurred. The spatio-temporal patterns of cropland abandonment events matched well with the labor emigration from agriculture in the context of regional economic development and industrial restructuring. The low economic efficiency of agriculture and the shortage of agricultural labor are two common drivers leading to cropland abandonment in 86% and 78% of counties, respectively.
1992—2017年基于荟萃分析的中国耕地撂荒时空特征
DOI:10.11821/dlxb201903001
[本文引用: 1]
当前耕地撂荒已成为一种日益普遍的土地利用变化现象,对粮食安全和生态环境具有重要影响。为揭示1992-2017年中国耕地撂荒的时空特征及驱动机制,采用集成分析的思路,对县(市)域尺度撂荒的研究成果进行了汇总梳理,从中提取撂荒时间、位置、规模(程度)、成因等信息,并进行了荟萃分析。结果发现:1992-2017年全国范围内有撂荒记录的县(市)共165个,主要分布于南方,集中分布区呈逆时针旋转90°的“T”字型,纵轴自北至南贯穿甘肃东南部、四川东部、重庆境内,直至贵州西部和云南北部;横轴位于长江中下游地区,自西向东贯穿湖北、湖南、安徽、江西。其中,湖南、四川、安徽有撂荒记录的县(市)数量较多,分别为24个、23个、21个,其次是湖北、重庆、福建、甘肃、云南,均超过10个。“T”字型结构的形成经历两个阶段,大致以2010年为界,此前有撂荒记录的县(市)为102个,集中分布于沿长江中下游的东西向带状区域,形成横轴;此后新增63个县(市),集中分布于自甘肃东南部至贵州西部和云南北部地区的南北向带状区域,形成纵轴。撂荒格局的形成过程与区域经济发展和产业结构调整背景下的农业劳动力析出基本同步。农业收益低和劳动力不足分别是86%和78%的县(市)撂荒形成的共性因素。
Comparative study on Influencing factors of farmers' irrigation decision-making behavior
农户灌溉决策行为影响因素比较研究
Spatio-temporal characteristics and driving mechanism of functional evolution of cultivated land in Huang-Huai-Hai Plain
DOI:10.11821/dlxb201803010
[本文引用: 1]
Taking counties as the basic unit, this paper establishes the evaluation index system of farmland functions from the dimensions of economy, society and ecology, adopts the method combining entropy weighting and multiple correlation coefficient weighting to determine the weights, and calculates the farmland function indices of each county. Subsequently, the spatio-temporal characteristics of farmland functions evolution were analyzed and the coupling relationships between the sub-functions were explored based on the coupling coordination model, simultaneously, the dynamic mechanism of farmland functions evolution was quantitatively probed by applying the spatial econometric regression analysis method in this research. Major conclusions were drawn as follows: (1) The farmland economic function generally presented a declining trend during 1990-2010. Especially, the function is strengthened in underdeveloped and agriculture dominated counties, and weakened continuously in developed areas on contrary; 60.29% of the counties decrease in farmland social function, whereas some counties, which are mostly located in the north of Zhengzhou, the west of Dezhou and Cangzhou, Yantai and Weihai, have experienced an obvious increase; The dramatic decline of farmland ecological function has occurred around Beijing, Tianjin and Jinan. Areas located in northern Henan Province and central Shandong Province has witnessed an increase of ecological function. (2) There is a significant spatial difference in the coupling degree and coordination degree of the sub-functions, and the decoupling phenomenon gradually highlights. The changes of social function and ecological function lag behind those of economic function in developed areas, but they are highly coupled in some underdeveloped areas. (3) The evolution of farmland functions in the Huang-Huai-Hai Plain resulted from the comprehensive effects of regional basic conditions and external driving factors. Furthermore, the transition of population and industry in the process of urbanization and industrialization plays a decisive role in evolution intensity and direction of farmland sub-systems including economy, society and ecology. According to the results above mentioned, agricultural modernization, industrialization and promoting the transformation of traditional agriculture should be regarded as an important engine driving the sustainable development of Huang-Huai-Hai Plain. In view of regional differentiation characteristics of farmland functions evolution, differentiated and diversified farmland use and management modes should be implemented from developed urban areas to underdeveloped traditional agricultural areas.
黄淮海平原耕地功能演变的时空特征及其驱动机制
DOI:10.11821/dlxb201803010
[本文引用: 1]
本文以县域为基本研究单元,从经济、社会及生态三个维度构建了耕地功能评价指标体系,分析了黄淮海平原耕地功能演化的时空特征,利用耦合动态度模型探讨了耕地功能间耦合关系的演变。在此基础上,利用空间计量模型,对耕地功能演化的驱动机制进行了定量分析。研究结果表明:① 1990-2010年间,冀中南及豫东地区部分欠发达县市耕地经济功能明显增强,发达的城市群及其腹地受工业化及城镇化影响较大,耕地经济功能持续下降;60.29%的县域单元耕地的社会功能下降,增强区主要集聚于郑州北部、德州及沧州西部、烟台、威海等区域;生态功能变化在空间格局上基本形成了以豫北、山东中部山地丘陵区为核心的增长区以及以环京津、环济南地区为核心的持续下降区。② 黄淮海平原耕地经济、社会及生态功能的耦合度及协调度空间差异显著,且退耦化现象日渐突出;经济发达地区耕地的社会及生态功能演化速率普遍滞后于经济功能。③ 黄淮海平原耕地的功能演化是区域本底因素与外部驱动因素综合作用的结果;城镇化与工业化进程中人口、产业的转型对耕地经济、社会及生态功能演化的强度及方向起决定性作用。并指出:黄淮海平原应激活农业现代化、产业化发展动力,促进传统农业的转型升级,充分考虑耕地功能演化的区域分异特征,实行由发达城市地区到欠发达传统农区的差异化、多元化的耕地多功能利用与管理模式。
