

1 引言
无论是以大城市为主的极化模式,还是以中小城市为主的分散模式,亦或是大中小城市协调发展的均衡模式,都需要厘清区域城市体系城市规模结构演化的驱动机制。尤其是在实现共同富裕战略目标的背景下,城市群建设需要充分发挥大城市溢出效应,带动周边城市发展,实现区域协调发展和均衡发展,探究区域中心城市对于周边城市人口规模的影响过程与机制就显得尤为重要。孙斌栋等以长三角和京津冀等区域为例,证明了上海、北京等大城市对周边城市发展的显著影响[7-8]。对于不同区域中心城市促进或抑制周边城市发展的机制,已有的文献主要从制度文化和运输成本两个角度进行解释[9⇓-11]。由于制度和文化等变化较为缓慢,适用于解释不同区域或国家间的差异,亦或是长历史周期的变化,但并不适用于解释20世纪末以来发展中国家在较短时间内快速城镇化过程中区域城市体系的动态演化。加之,即使在政治制度较为接近、市场机制相对完善的国家间,城市体系的极化程度也存在差异。如Storper的研究表明美国城市体系的极化程度要明显高于欧洲[12]。而运输成本的相关实证研究的结果存在不确定性,有些研究结果甚至完全相反[13]。如有研究表明高铁强化了南昌等中心城市的极化效应,导致高铁沿线城市愈发不均衡[14-15];但是也有研究认为高铁开通扩大了中心城市对周边城市的溢出效应[16-17]。
为解释城市的增长,Krugman提出了一个一般性的理论框架,即第一自然和第二自然。第一自然即是自然状态下城镇所在区位的资源禀赋,包括河流、土地等;第二自然是区域和城市间由人类社会经济联系所建构的联系网络和空间结构,即强调城市间紧密的社会经济联系网络对于特定城市发展的影响[18]。这一理论框架被广泛应用于国内外城市发展的实证研究[19⇓-21]。产业联系无疑是城市间社会经济联系的重要内容。学者们对于中国大都市区的研究表明产业联系强度显著影响了中心城市对于周边城市的溢出效应,进而导致不同城市群间大中小城市分布的结构性差异[22]。而且不同行业的产业联系网络存在明显的异质性[23],这很大程度上是由于不同行业产品的实体化程度决定的[24-25]。陆大道在对区域空间结构的分析时,也认为产业类型很大程度上影响了区域空间结构的极化与均衡过程,而区域城市体系中的大中小城市分布特征即是区域空间结构的重要表征[26]。
因此,本文将以第一自然和第二自然的理论框架为基础,从产业异质性的角度出发,重点分析中心城市产业结构对周边城市人口增长的影响过程和机制,进而探究产业结构演进对于区域城市体系极化与均衡动态演化过程的影响。
2 研究对象、数据与方法
2.1 研究对象
有研究表明城市间的空间相互作用主要为高等级城市对低等级城市的影响,而同层级中小城市之间的空间关联效应相对微弱[7],因此研究重点关注规模大、等级高的中心城市产业结构对区域城市体系的影响。本文依据2010年住房和城乡建设部发布的《全国城镇体系规划(2010—2020年)》所确定的北京、天津、上海、广州、重庆5大国家中心城市,重点分析以国家中心城市为核心的区域城市体系。区域城市体系范围主要依据中心城市市场潜力确定,即对于一个城市来说,其作为5个中心城市中市场潜力最大城市的腹地城市。由于市场潜力由中心城市人口规模和城市间空间距离决定,而空间距离是固定的,因此区域城市体系的范围会随着不同年份5个国家中心城市人口规模的变化,而有所调整。
图1

图1
2020年中国不同规模城市分布特征
注:基于自然资源部标准地图服务网站GS(2016)1554号标准地图绘制,底图边界无修改;数据来源于:United Nations, Department of Economic and Social Affairs, Population Division, World Urbanization Prospects。
Fig. 1
Spatial distribution characteristics of cities of different sizes in China in 2020
表1 2020年5个国家级中心城市影响范围内中等规模及以上城市分布情况
Tab. 1
| 类型 | 北京 | 广州 | 上海 | 天津 | 重庆 |
|---|---|---|---|---|---|
| 超大型城市数量(个) | 1 | 2 | 1 | 1 | 1 |
| 特大型城市数量(个) | 3 | 2 | 5 | 0 | 2 |
| I型大城市数量(个) | 5 | 2 | 10 | 1 | 3 |
| Ⅱ型大城市数量(个) | 24 | 15 | 45 | 3 | 8 |
| 中等规模城市数量(个) | 50 | 20 | 71 | 1 | 29 |
| 总计(个) | 83 | 41 | 132 | 6 | 43 |
2.2 研究数据
研究尽管以中国城市体系为例,但是核心是探求产业结构影响区域城市体系空间结构的普遍性规律和机制,因此与其他国家具有可比性非常重要。研究采用联合国经济和社会部(UN DESA)的城市群(Urban Agglomeration)人口数据,数据集涵盖自1950年以来的人口规模在30万级以上的392个城市(包括直辖市、地级市、县级市),每5年的人口数据。同时,由于伊宁和玉树两个城市控制变量等相关数据不可得,研究仅包括390个城市样本。5个国家中心城市的产业结构数据来源于各中心城市的统计年鉴。
除核心变量外,研究数据还包括从业人员、平均工资、万人医生数等控制变量相关数据,这些数据均来自于1981年以来的城市统计年鉴和各省统计年鉴,缺失数据采用所在省平均增长率或两个年份平均值的方法进行补充完善。
研究聚焦1980年以来的城市人口变化,一方面由于研究重点关注在市场经济条件下的极化和均衡规律,中国市场机制自1978年改革开放以后才逐步发挥作用;另一方面是由于改革开放前的城市统计数据缺失较多,从业人员、工资、医生等控制变量数据可得性较差。
2.3 研究方法
为了直观反映产业结构对区域城市体系极化与均衡过程的影响,本文采用基尼系数测度区域新增城镇人口在各城市分布的情况,具体公式如下:
式中:n表示区域城市系统中的城市数量;S表示整个城市体系的新增人口总规模;T是城市体系中各城市之间的新增人口规模之差的绝对值总和;Gi反映区域城市体系i中新增人口在少数城市中的集中程度。基尼指数的取值范围在0~1之间,基尼指数越接近0,表明新增人口在区域各城市中分布相对平均,将促进区域城市体系更加均衡;越接近1,表明新增人口倾向于向少数城市集中,可能导致区域城市体系更加极化[27]。
2.4 计量模型构建
表2 自变量列表
Tab. 2
| 变量名称 | 指标描述及计算过程 |
|---|---|
| 1980年人口规模(Pop 1980) | 1980年的人口规模 |
| 全部城市市场潜力(MPAC) | |
| 中心城市市场潜力(MPCC) | |
| 中心城市产业结构(IM) | IMmm为工业占比,IMs为服务业占比,IM为工业与服务业比值 |
| 市场潜力与产业结构交叉项(MP×IM) | 中心城市市场潜力与工业/服务业占比交叉项(MPCC×IM) |
| 从业人员数(Employment) | 城市第二和第三产业从业人员数 |
| 工资水平(Wage) | 职工平均工资 |
| 公共服务水平(Urban Amenity) | 万人医生数 |
| 到第二层级中心城市距离 (Distance 2ndRC) | 距离城市i最近的第三层级中心城市到最近的第二层级中心城市的距离,即增量距离 |
| 到第三层级中心城市距离 (Distance 3rdRC) | 城市i到最近的第三层级中心城市距离,如距离第二层级中心更近,则该值为零 |
表3 主要变量统计描述
Tab. 3
| 1980年 人口规模 (千人) | 从业 人员数 (万人) | 工资 水平 (元) | 万人 医生数(个) | 全部城市市场 潜力 | 中心城市市场 潜力 | 到第二层级中心城市 距离(km) | 到第三层级中心城市 距离(km) | 中心城市工业占比(%) | 中心城市服务业 占比(%) | |
|---|---|---|---|---|---|---|---|---|---|---|
| 均值 | 229.54 | 20.72 | 17815.93 | 28.87 | 388.06 | 32.74 | 198.27 | 100.33 | 40.58 | 49.76 |
| 标准差 | 354.61 | 30.3 | 22620.51 | 16.02 | 216.18 | 42.71 | 331.23 | 123.93 | 12.74 | 15.36 |
| 最小值 | 12.00 | 0.44 | 20.15 | 1.59 | 32.98 | 1.49 | 19.63 | 0.00 | 16.12 | 22.58 |
| 最大值 | 3418 | 536.06 | 576545 | 146.30 | 1299.84 | 569.09 | 2741.12 | 911.22 | 66.66 | 79.65 |
需要说明的是产业效应(industrial effect)的变量集。市场潜力(MP)和产业结构(IM)是研究的核心变量,产业结构的二次项主要测度产业结构的非线性影响,市场潜力和产业结构的交叉项测度5个全国层面的中心城市产业结构对市场潜力的影响。其中,产业结构分别以第二产业中的工业在GDP中的占比、服务业(第三产业)占比以及工业与服务业的比值进行测度,前两个更多表征工业或服务业自身特征,而工业与服务业比值测度两大产业的比例关系,反映产业结构的动态演进;产业效应变量集中的市场潜力关注5个国家中心城市产生的市场潜力(MPCC)。同时,研究还考虑了所有城市对特定城市产生的市场潜力(MPAC)。本质上所有城市的市场潜力反映了其他城市对特定城市的影响,而对5个中心城市的关注即是进一步聚焦中心城市对周边城市发展的影响。本文借鉴Ioannides等的测度方法[19],5个全国层面中心城市市场潜力(MPCC)和所有城市市场潜力(MPAC)的计算公式如下:
式中:
第二层级和第三层级中心城市的确定主要是依据服务业从业人员规模,5个全国层面中心城市服务业从业人员规模都在100万以上,第二层级中心城市为50万~100万,第三层级为20万~50万人的省会城市。第二层级中心城市包括武汉、西安、杭州、南京、沈阳、成都、济南、哈尔滨等区域中心城市,第三层级城市主要是其他省会城市,不同时期第二和第三层级城市略有变化。
3 中心城市产业结构对周边城市人口增长的影响过程与机制
3.1 中心城市产业结构影响周边城市人口增长的实证分析
表4 工业影响下的回归结果
Tab. 4
| 固定效应(FE) | 随机效应(RE) | ||||||
|---|---|---|---|---|---|---|---|
| 模型1 | 模型2 | 模型3 | 模型1 | 模型2 | 模型3 | ||
| 1980年人口规模 (Pop 1980) | 0.2767*** (0.000) | 0.2799*** (0.000) | 0.2742*** (0.000) | ||||
| 全部城市市场潜力 (MPAC) | -0.0163 (0.511) | -0.0416 (0.197) | -0.0538 (0.115) | 0.0704*** (0.001) | -0.0058 (0.824) | -0.0136 (0.598) | |
| 中心城市市场潜力 (MPCC) | 0.2065 (0.221) | 0.0130 (0.958) | 0.5872*** (0.000) | -0.1643 (0.498) | |||
| 工业占比 (IMmm) | 2.4347* (0.017) | 2.3598* (0.021) | 1.8534 (0.099) | 4.0999*** (0.000) | 3.8838*** (0.000) | 2.7550*** (0.010) | |
| 工业占比二次项 (IMmm2) | -0.0479*** (0.000) | -0.0484*** (0.000) | -0.0452*** (0.000) | -0.0519*** (0.000) | -0.0533*** (0.000) | -0.0462*** (0.000) | |
| 市场潜力与工业占比交叉项 (MP×IMmm) | 0.0099* (0.028) | 0.0246*** (0.000) | |||||
| 到第二层级中心城市距离 (Distance 2ndRC) | -0.0558* (0.011) | -0.0553* (0.012) | -0.0545* (0.013) | -0.0120 (0.346) | -0.0083 (0.511) | -0.0040 (0.745) | |
| 到第三层级中心城市距离 (Distance 3rdRC) | -0.0744* (0.032) | -0.0735* (0.034) | -0.0739* (0.033) | -0.0494 (0.076) | -0.0401 (0.148) | -0.0340 (0.218) | |
| 从业人员数 (Employment) | 0.0814 (0.473) | 0.0608 (0.596) | 0.0909 (0.441) | 0.3765*** (0.001) | 0.3204** (0.006) | 0.4330** (0.000) | |
| 工资水平 (Wage) | 0.0004** (0.006) | 0.0005** (0.004) | 0.0005** (0.004) | 0.0002 (0.151) | 0.0003 (0.056) | 0.0003 (0.057) | |
| 万人医生数 (# of Doctors per 10000 Population) | -0.6359*** (0.001) | -0.6372*** (0.001) | -0.6355*** (0.001) | -0.4259** (0.019) | -0.4410** (0.015) | -0.4249** (0.019) | |
| R2 | 0.1152 | 0.1203 | 0.1305 | 0.3570 | 0.3740 | 0.3793 | |
| 样本数量 | 2695 | 2695 | 2695 | 2695 | 2695 | 2695 | |
| F/Wald Test | 17.17 | 15.43 | 14.01 | 634.98 | 673.67 | 714.17 | |
| 0.0000 | 0.0000 | 0.0000 | 0.0000 | 0.0000 | 0.0000 | ||
注:括号内为p值;*p < 0.05,**p < 0.01,***p < 0.001。
表5 服务业影响下的回归结果
Tab. 5
| 固定效应(FE) | 随机效应(RE) | ||||||
|---|---|---|---|---|---|---|---|
| 模型1 | 模型2 | 模型3 | 模型1 | 模型2 | 模型3 | ||
| 1980年人口规模 (Pop 1980) | 0.2742*** (0.000) | 0.2760*** (0.000) | 0.2693*** (0.000) | ||||
| 全部城市市场潜力 (MPAC) | -0.0482 (0.080) | -0.0811* (0.023) | -0.0984 (0.007) | 0.0519* (0.028) | -0.0374 (0.201) | -0.0386 (0.183) | |
| 中心城市市场潜力 (MPCC) | 0.246 (0.148) | 1.6532* (0.013) | 0.6194*** 0.000) | 2.5873*** 0.000) | |||
| 服务业占比 (IMs) | 7.2876*** (0.000) | 7.5254*** (0.000) | 6.9504*** (0.000) | 6.3217*** (0.000) | 7.0160*** (0.000) | 6.2005*** (0.000) | |
| 服务业占比二次项 (IMs2) | -0.0563*** (0.000) | -0.0571*** (0.000) | -0.0486*** (0.000) | -0.0595*** (0.000) | -0.0623*** (0.000) | -0.0492*** (0.000) | |
| 市场潜力与服务业占比交叉项 (MP×IMs) | -0.0179* (0.029) | -0.0304*** (0.000) | |||||
| 到第二层级中心城市距离 (Distance 2ndRC) | -0.0533* (0.015) | -0.0529* (0.016) | -0.0505* (0.021) | -0.0128 (0.313) | -0.0097 (0.441) | -0.0024 (0.848) | |
| 到第三层级中心城市距离 (Distance 3rdRC) | -0.0684* (0.048) | -0.0674* (0.051) | -0.0684* (0.048) | -0.0497 (0.075) | -0.0419 (0.130) | -0.0308 (0.263) | |
| 从业人员数 (Employment) | 0.1525 (0.183) | 0.13332 (0.248) | 0.1954 (0.100) | 0.4076*** (0.000) | 0.3662** (0.002) | 0.5229*** (0.000) | |
| 工资水平 (Wage) | 0.0004** (0.009) | 0.0004** (0.007) | 0.0004** (0.009) | 0.0003 (0.065) | 0.0004* (0.027) | 0.0003* (0.030) | |
| 万人医生数 (# of Doctors per 10,000 Population) | -0.5836** (0.002) | -0.5829** (0.002) | -0.5877** (0.002) | -0.3910* (0.031) | -0.3393* (0.027) | -0.3883* (0.031) | |
| R2 | 0.1264 | 0.1348 | 0.1595 | 0.3602 | 0.3779 | 0.3881 | |
| 样本数量 | 2695 | 2695 | 2695 | 2695 | 2695 | 2695 | |
| F/Wald Test | 18.82 | 16.97 | 15.77 | 649.03 | 695.04 | 746.91 | |
| 0.0000 | 0.0000 | 0.0000 | 0.0000 | 0.0000 | 0.0000 | ||
注:括号内为p值;*p < 0.05,**p < 0.01,***p < 0.001。
就市场潜力而言,国家中心城市对周边城市发展具有正向带动作用,而其他城市整体上呈现负向影响或没有显著影响。结果显示在不考虑国家中心城市影响(MPCC)时,所有城市所产生的市场潜力(MPAC)总体影响并不显著,但是加入国家中心城市影响后,表5显示所有城市产生的市场潜力显著为负,而国家中心城市的影响则显著为正。这很大程度上表明国家中心城市对于周边城市的人口增长具有正向影响,但除国家中心城市外,其他所有城市整体上对于特定城市可能不产生影响或影响为负。同时,当考虑工业与国家中心城市市场潜力交叉项后,国家中心城市的正向影响也不再显著,表明国家中心城市市场潜力的正向效应,很大程度上来自中心城市与周边城市间的工业经济联系。
此外,1980年的人口规模、平均工资两个变量呈现显著的正向作用,到第二和第三等级中心城市距离影响为负,这些结果均符合预期。1980年的人口规模表征第一自然,表明城市的初始自然条件和资源禀赋对城市的人口增长依然有显著正向作用;城市平均工资越高,越有利于吸引外来人口;到第二和第三等级中心城市距离影响为负,表明距离区域中心城市越远,越不利于城市人口增长。随机效应模型的结果表明从业人员数对于城市人口增长也具有正向作用,这一定程度上说明较多的就业岗位对于城市的人口迁入也有正向作用。
随着城市的发展,主导产业将从第二产业向第三产业演进,制造业占比将降低,而服务业则增加。未来明确产业结构演进对区域城市体系演化的影响,进一步分析了中心城市工业与服务业的比例关系对周边城市人口增长的影响。以上研究表明工业和服务业占比与周边城市人口增长都呈现非线性关系,因此预期工业与服务业之比与周边城市人口同样是非线性的关系。从工业与服务业之比的二次项和三次项结果来看,中心城市的工业与制造业之比和周边城市人口增长同样是负二次项关系,即倒“U”型关系(表6)。豪斯曼检验结果表明固定效应更为适用,因此根据固定效应的结果,国家中心城市市场潜力按照其均值32.74计算,工业占比达到服务业92.04%时,即工业与服务业之比为47.93∶52.07左右,国家中心城市对周边城市发展的促进作用最大。
表6 产业结构(工业与服务业之比)的回归结果
Tab. 6
| 固定效应(FE) | 随机效应(RE) | ||||
|---|---|---|---|---|---|
| 模型1 | 模型2 | 模型1 | 模型2 | ||
| 1980年人口规模 (Pop 1980) | 0.2662*** (0.000) | 0.2659*** (0.000) | |||
| 全部城市市场潜力 (MPAC) | -0.0840* (0.017) | -0.0826* (0.020) | 0.0378 (0.164) | 0.0380 (0.165) | |
| 中心城市市场潜力 (MPCC) | -0.3508 (0.128) | -0.2417 (0.475) | -0.4579* (0.023) | -0.5130 (0.105) | |
| 工业/服务业 (IM) | -0.4406*** (0.000) | -0.4394*** (0.000) | -0.2966*** (0.000) | -0.2957*** (0.000) | |
| 工业/服务业与市场潜力交叉项 (IM×MPCC) | 0.01380*** (0.001) | 0.0100 (0.288) | 0.0256*** (0.000) | 0.0276** (0.004) | |
| 工业/服务业的二次项与市场潜力交叉项 ((IM)2×MPCC) | -0.00006*** (0.000) | -0.00002 (0.788) | -0.00005*** (0.000) | -0.00001 (0.237) | |
| 工业/服务业的三次项与市场潜力交叉项 ((IM)3×MPCC) | -0.0000001 (0.659 | -0.00000001 (0.830) | |||
| 到第二层级中心城市距离 (Distance 2ndRC) | -0.0507* (0.019) | -0.0506* (0.019) | -0.0052 (0.676) | -0.0051 (0.680) | |
| 到第三层级中心城市距离 (Distance 3rdRC) | -0.0698* (0.041) | -0.0696* (0.042) | -0.0353 (0.197) | -0.0352 (0.198) | |
| 从业人员数 (Employment) | 0.1747 (0.132) | 0.1710 (0.141) | 0.5427*** (0.000) | 0.5483*** (0.000) | |
| 工资水平 (Wage) | 0.0005*** (0.001) | 0.0005*** (0.001) | 0.0003* (0.044) | 0.0003* (0.045) | |
| 万人医生数 (# of Doctors per 10,000 Population) | -0.6217*** (0.001) | -0.6223*** (0.001) | -0.4300* (0.017) | -0.4274* (0.018) | |
| R2 | 0.1422 | 0.1415 | 0.3857 | 0.3861 | |
| 样本数量 | 2695 | 2695 | 2695 | 2695 | |
| F/Wald Test | 18.40 | 16.74 | 777.06 | 782.77 | |
| 0.000 | 0.000 | 0.000 | 0.000 | ||
注:括号内为p值;*p < 0.05,**p < 0.01,***p < 0.001。
3.2 中心城市产业结构对于周边城市人口增长的作用过程与机制
实证研究的结果表明以制造业为主的工业经济能够增强中心城市对周边城市的溢出效应,进而促进了周边城市人口的增长,而服务业则降低了中心城市的溢出效应,从而阻碍周边城市人口的增长。制造业和服务业对于周边城市人口增长产生完全相反作用,其原因是制造业的产品多为中间品,且产品实体化的特点,考虑到货物运输的成本,因此更倾向于在中心城市附近区域形成上下游产业分工和区域性生产网络,强化中心城市与周边中小城市联系,增强溢出效应,从而促进周边城市人口增长;而服务业的产品是多为最终产品,需要寻求更大的市场,加之产品的非实体化特点,使得中心城市的服务业更倾向于与距离较远但市场规模大的城市产生联系,而弱化与周边城市联系,降低中心城市的溢出效应[25]。
4 中心城市产业结构演进对区域城市体系极化与均衡演化的影响
中心城市产业结构不仅影响了周边城市人口的增长,已有的研究表明产业结构对于城市自身的规模也有显著影响。Au等的研究表明在中国城市体系中,以服务业为主的城市达到效率最大化时的最优城市规模要远大于制造业[36],同时Hong等对美国城市规模与产业类型的研究也表明,以服务业为主的城市其规模要明显大于制造业城市[37]。综合考虑产业结构对于周边城市增长和城市自身规模的影响,发现以制造业为主的中心城市,其城市规模相对较小,同时强化对于周边城市的溢出效应,因此以该中心城市为核心的区域城市体系更容易形成大中小城市较为均衡的格局;而以服务业为主的中心城市,其城市规模相对较大,而对于周边城市的溢出效应较弱,因而更容易形成中心城市一城独大的极化型区域城市体系(图2)。
图2
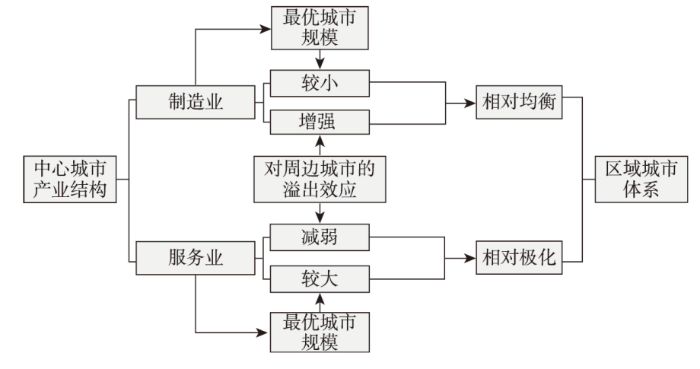
图2
中心城市产业结构对区域城市体系极化与均衡演化的影响过程示意图
Fig. 2
The influence of the industrial mix of core cities on the evolution of the regional urban system
最终,中心城市产业结构不仅影响了周边城市人口的增长,同时对于区域城市体系极化与均衡特征及其演化产生重要影响。考虑到后工业社会,区域中心城市产业逐步由制造业向高端服务业演进,特别是北京等国家中心城市将纽约等以高端服务业为核心的世界城市作为发展目标,在没有外部干预的情况下,中国的区域城市体系更可能向以超大城市和大城市为主的相对极化的方向演化。
表7 1980—2020年受5个国家级中心城市影响的主要城市新增人口增长分布的基尼系数测度
Tab. 7
| 1980—1985 | 1985—1990 | 1990—1995 | 1995—2000 | 2000—2005 | 2005—2010 | 2010—2015 | 2015—2020 | |
|---|---|---|---|---|---|---|---|---|
| 北京 | 0.5225 | 0.5470 | 0.5056 | 0.4901 | 0.5842 | 0.6177 | 0.6351 | 0.5911 |
| 广州 | 0.4998 | 0.6113 | 0.6407 | 0.6726 | 0.6444 | 0.6518 | 0.6144 | 0.6431 |
| 上海 | 0.5122 | 0.5299 | 0.4390 | 0.4834 | 0.5408 | 0.5627 | 0.5680 | 0.5318 |
| 天津 | 0.5687 | 0.6084 | 0.5916 | 0.5747 | 0.4770 | 0.4818 | 0.4832 | 0.4854 |
| 重庆 | 0.5586 | 0.5195 | 0.5747 | 0.5626 | 0.5985 | 0.6025 | 0.6074 | 0.5914 |
图3
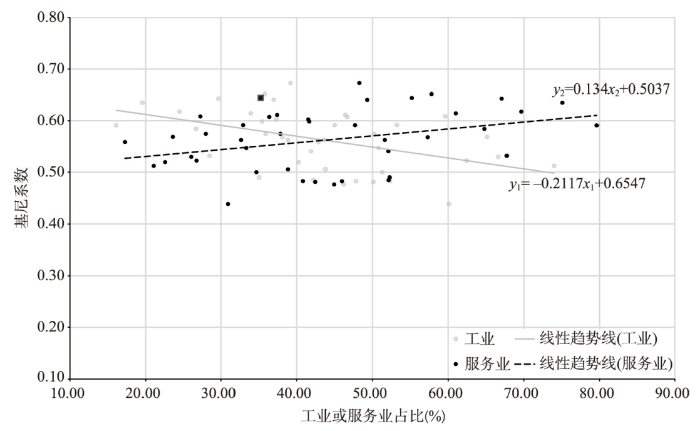
图3
新增人口的基尼系数与国家中心城市工业和服务业占比的相关性分析
注:工业或服务业占比数据来源于各城市统计年鉴
Fig. 3
Correlation analysis of the Gini coefficient of t population growth and the proportion of service in the central city
此外,结合Henderson等对于产业结构影响城市自身规模的研究结果[10],能够很好地解释了中心城市产业结构与周边城市人口增长的倒“U”型关系。北京等国家中心城市市辖区以非农产业为主,制造业和服务业是此消彼长的关系。城市中制造业占比过高,则服务业占比低,由于以制造业为主的城市其最优规模相对较小,正如孙斌栋等所指出的较小的城市规模对周边城市的影响有限[7],因而制造业城市对周边城市的溢出效应也小,难以带动周边城市人口增长;当城市服务业占据城市经济的绝对主导地位时,尽管其最优城市规模较大,但是由于服务业自身对于周边城市的负向作用,因而减缓了周边的中小城市人口增长。因此,随着城市由工业社会向后工业社会转变,较高的制造业占比开始降低,而服务业占比则增加,当在达到服务业负向作用超过制造业正向作用的临界点之前,制造业的正向溢出随着服务业和城市规模的增大而不断强化,从而促进周边中小城市人口增长,临界点之后由于服务业的负向作用,正向溢出逐渐转变为负向的虹吸效应,对周边中小城市人口增长的促进作用开始降低,最终导致中心城市产业结构与周边城市人口增长呈现倒“U”型关系。正如表6所示只有当制造业和服务业相对平衡时,城市不因制造业占比过高而规模太小,也不因服务业占比过高而呈现负向作用,中心城市对周边中小城市的溢出效应才能达到最大。
5 结论
本文从产业异质性的角度,实证分析了中国5个国家中心城市产业结构对周边城市人口增长的影响,并结合产业类型与城市自身规模的相关研究,进一步探究了产业结构对于区域城市体系极化与均衡演化的影响。结果表明:
(1)制造业强化了区域中心城市对于周边城市的溢出效应,促进周边中小城市人口规模的增长,而服务业则弱化了区域中心城市的溢出效应,进而阻碍了中小城市规模扩张。制造业和服务业表现出的差异化的产业区域空间效应,很好的解释了长三角、珠三角发达的制造业所形成的大中小城市相对均衡的区域城市体系,而北京、纽约等城市发达的高端服务业则使得区域呈现显著的极化特征。同时,生产性服务业和制造业在城市间分别呈现点状集聚和面状集聚的差异化特征,也进一步印证了产业对于区域城市体系极化与均衡的影响[38]。
(2)结合Henderson等产业类型对城市自身规模影响的相关研究[10],发现区域中心城市产业结构很大程度上影响了区域城市体系极化与均衡的特征及其演化过程。以制造业为主的区域中心城市更倾向于形成较为均衡的区域城市体系,而以服务业为主的区域中心城市倾向于导致较为极化的区域城市体系,因此中心城市产业很大程度上影响了区域的城镇化路径。随着国家中心城市以向纽约、伦敦等国际化大都市为目标,进一步聚焦发展高端服务业,中国区域城市体系将可能更加极化。同时,区域整体效率最优很可能与中心城市自身效率最优时的城市规模并不一致,因此城市的最佳规模需要平衡自身利益与区域整体利益,这常常被城市经济学家所忽略[2,36]。
(3)中心城市产业结构与周边城市人口增长存在明显的倒“U”型关系,即过高的制造业或服务业占比都不利于中心城市对周边城市的溢出效应。过高的制造业占比,导致最优城市规模较小,因而减弱城市的溢出效应;而过高的服务业占比,则是由于服务业对溢出效应的抑制作用,因而同样不利于周边城市的人口增长。本文的研究结果不仅验证了Krugman提出的第一自然和第二自然的一般性理论框架,而且从产业异质性的角度对其进行了拓展。同时,制造业和服务业内部不同行业间的差异依然十分明显,因此对于不同细分行业之间的差异化影响值得进一步深入分析。
参考文献
Urbanisation in China: Policy issues and options
中国的城市化: 面临的政策问题与选择
How big should a primary city be? The effects of national population, globalization and urbanization
首位城市该多大? 国家规模、全球化和城市化的影响
Strategic thinking on developing small and medium-sized cities to balance urbanization
Small and medium-sized cities have played important roles in China's new urbanization strategies. Small and medium-sized cities can not only help large cities avert over-concentration of population,but also avoid excessively decentralized rural industrialization in small towns. To develop small and medium-sized cities,characteristic industries and vocational education are required so that people can get employed in the cities and become residents easily. City infrastructure and public services are necessary for urban residents. Public-Private Partnership (PPP) may solve the problems of fund shortage that the local government is facing during the construction. Besides,supply system of accommodations should be modernized to help the rural-urban migration's dream of being settled down come true.
大力发展中小城市推进均衡城镇化的战略思考
发展更多中小城市,提升中小城市的竞争力和吸引力是我国均衡城镇化战略的重要组成部分。文章旨在讨论发展中小城市的战略意义与对策,认为发展中小城市能有效破解“半城镇化”难题,推进转移人口市民化,有助于实现农民工的就地城镇化与我国区域间协调发展。当前发展中小城市,实现农民工市民化,既要把中小城市建立在坚实的产业基础上,完善创业扶持体系和职业培训体系,提升中小城市对转移人口的吸引力,实现就地城镇化;又要创新公共私营合作机制,解决中小城市在公共服务和基础设施建设中的资金瓶颈问题,并构建多渠道的房屋供给体系,实现落户中小城市居民的“安居梦”。
Urbanization path and city scale in China: An economic analysis
中国城市化路径与城市规模的经济学分析
The theoretical cognition of the development law of China's urban agglomeration and academic contribution
DOI:10.11821/dlxb201804005
[本文引用: 1]

Urban agglomeration refers to a highly integrated city and town group. It comes into being with the development of industrialization and urbanization to the advanced stage. The formation and development of urban agglomeration is a long natural process, which is transformed from competition to cooperation. China is in a new stage of urbanization transition, and has entered a new era of leading the global urban agglomeration development in the 21st century. The research and experience model of China's urban agglomeration has been accepted by global urban agglomeration construction as reference. In this paper, the natural law of urban agglomeration is proposed, including developmental gradual law, multi-scale transmission law of space intensive utilization, the combination law of spatial crystal structure, the natural growth of the breeding tree, and the gradient upgrade law of sustainable development. Following these laws, Chinese geographers have made great contributions to the research and development of China's urban agglomerations, which focuses on academic theory, technical method, decision support and planning practice. We developed and scientifically defined the concept of urban agglomeration, and first adopted the identification standard of urban agglomeration space. We established the spatial intensive development and layout simulation decision support technology chain in urban agglomeration, and developed related software chain. We laid out the new pattern of 5+9+6 in the spatial organization of China's urban agglomerations, and formulated the first China's urban agglomeration planning technical regulation. We completed the development plan of most urban agglomerations in China, which has become an important basis for decision-making at the national level. In the future, geographers will play a growing role and shoulder the responsibility in the development of Chinese urban agglomerations. We should combine qualitative and quantitative methods, and use big data and intelligent decision support technology to solve a series of problems in the development of this cause. Only in this way can Chinese geographers make greater contributions to the development of urban agglomerations.
中国城市群形成发育规律的理论认知与地理学贡献
DOI:10.11821/dlxb201804005
[本文引用: 1]
城市群是国家工业化和城镇化发展到高级阶段的产物,是高度一体化和同城化的城市群体,城市群形成发育过程是一个各城市之间由竞争变为竞合的漫长自然过程,遵循自然发展规律。中国正处在新型城镇化转型发展的新阶段,已进入21世纪引领全球城市群发展的新时代,中国城市群研究与建设的经验模式正在被全球城市群建设所效仿和借鉴。本文从理论上梳理并提出了城市群形成发育遵循的自然规律,包括城市群形成发育的阶段性规律、城市群多尺度空间集约利用传导规律、城市群空间晶体结构组合规律、城市群自然生长的育树成林规律和城市群可持续发展的梯度爬升规律。地理学家遵循这些发展规律,从学术理论、技术方法、决策支持和规划实践等方面为中国城市群的研究和发展做出了不可替代的重大贡献,主要包括提出并科学界定了城市群概念,提出了城市群空间范围的识别标准,创建了城市群空间集约拓展与布局仿真决策支持技术链,研制了城市群空间集约拓展与布局仿真决策支持系统软件链,提出了中国城市群空间组织的“5+9+6”新格局,研制出国内第一部《城市群规划技术规程》,编制完成了全国多数城市群发展规划,转化为国家决策的重要依据。未来中国城市群的发展与研究中,地理学家发挥作用的空间越来越大,地理学家肩负着不可推卸的责任使命,应责无旁贷地采用定性与定量相结合的研究方法,引用大数据、智能决策支持技术等新手段解决城市群发展面临的一系列问题,一如既往地为城市群发展吸纳众智、献计献策,发挥更大作用,做出更大贡献。
Do large cities contribute to economic growth of small cities? Evidence from Yangtze River Delta in China
DOI:10.11821/dlyj201609002
[本文引用: 3]
Promoting coordinated development among large, medium-sized, and small cities as well as small towns, is highly emphasized in Chinese National New Urbanization Plan. Therefore, it is of great significance to clarify the spatial interactions between cities from different hierarchies, and to confirm whether large cities are really conducive to the economic growth of small cities. However, previous empirical literatures mainly focused on the spatial spillover effect between cities from the same hierarchy, and neglected the heterogeneity of urban hierarchy. Furthermore, the sample of previous studies generally included all the provinces or prefecture cities in China, which led to the lack of exploration on the internal spatial interactions within urban agglomerations such as the Yangtze River Delta. Taking 108 small cities in the Yangtze River Delta as study samples, this paper examines the spatial spillover effects between cities from both same and different hierarchies, by adding geographical distance to different-hierarchy cities, whether within administrative boundary or not and market potentials into classic economic growth model. It is found that approaching large cities may contribute to the economic growth of small cities, and the agglomeration shadow hypothesized by the New Economic Geography is not supported in the Yangtze River Delta. This also means the economic growth of small cities is still under the influence of metropolitan areas, which demonstrates the necessity and benefits of metropolitan development strategy. Secondly, spatial interactions are more likely to happen between high- and low-hierarchy cities, whereas those between same hierarchy cities are relatively weak. The positive growth spillover effect from sub-provincial city on small cities is found to be most significant. Thirdly, the market segmentation caused by administrative boundaries weakens the spatial spillover effect. The small cities under the administrative jurisdiction of the nearest prefecture city receive lower economic growth rate than those beyond the administrative boundary of their nearest prefecture city. Finally, policy implications are put forward on how to make use of spatial spillover effect and promote the coordinated development among large, medium-sized, and small cities as well as small towns. The first and foremost is to strengthen the radiation and impetus function of large cities. Considering the urban hierarchy heterogeneity of spatial interaction and breaking market segmentation caused by administrative boundaries are of great urgency as well.
大城市有利于小城市的经济增长吗? 来自长三角城市群的证据
DOI:10.11821/dlyj201609002
[本文引用: 3]
厘清大城市是否有利于小城市经济增长这一问题,对于贯彻大中小城市和小城镇协调发展的国家新型城镇化战略具有重要意义。以长三角108个小城市为例,在传统经济增长模型中加入到大城市的地理距离、行政边界、市场潜能等因素,估计不同等级的大城市对小城市经济增长的空间影响及其异质性。研究发现:临近大城市有助于促进小城市的经济增长,并未发现存在集聚阴影效应的直接证据;空间相互作用的方向更多体现为高等级城市对低等级城市的影响,来自副省级城市的增长溢出最为显著,同层级小城市之间的空间关联效应相对微弱;城市间存在一定程度的市场分割,行政边界的存在阻碍了空间溢出效应的发挥。最后从强化中心城市的辐射带动功能、促进不同规模城市空间溢出效应的全域性释放、破除行政区经济的束缚等方面提出了促进大中小城市和小城镇协调发展的政策启示。
Does "agglomeration shadow" exist in Beijing-Tianjin-Hebei region? Large cities' impact on regional economic growth
DOI:10.11821/dlyj201710010
[本文引用: 1]
In the context of the integrated development of Beijing-Tianjin-Hebei (BTH) region as a national strategy and the construction of Xiongan New Area, it is necessary to analyze the relationship of economic growth between large cities and small cities in this region. This paper examines the existence of "agglomeration shadow" and the "poverty belt around Beijing and Tianjin" suggested by the Asian Development Bank in 2005. The previous research of the "poverty belt around Beijing and Tianjin" did not conduct systematic analyses and empirical tests from the perspective of spatial interactions. The literature on spatial interactions has not reached an agreement on whether large cities are conducive to the economic growth of small cities. This paper aims to provide academic evidence for the coordinated development of the BTH region. The results reveal that the core cities in this region did curb the economic growth of small cities around them, supporting the "agglomeration shadow" proposed by new economic geography and the phenomenon "poverty belt around Beijing and Tianjin". Negative spillovers of economic growth exist among small cities as well, which could be attributed to the cut-throat competitions among small cities owing to the urgent desire for economic development of local governments. Compared with the Yangtze River Delta region where core cities benefit the economic growth of their adjacent cities, the radiating function and the trickle-down effect of core cities within the BTH region are obviously weak, and the development gap between large and small cities is greater. These conclusions indicate that to a great degree, the harmonious development of the BTH region is related to the radiation effects of the large cities, and the "agglomeration shadow" should be transformed into a sunshine zone of economic growth. In other words, a polycentric and reasonable urban hierarchy is crucial. From this point of view, the construction of the Xiongan New Area, as an anti-magnetic center just meets the need. This strategy will not only ease the pressure on Beijing, but also provide a new growth pole which helps to benefit the balance of regional economic growth and improve the "poverty belt around Beijing and Tianjin". The policy implications include: using the opportunity of constructing the Xiongan New Area to build a multi-centered spatial pattern with the government's active guidance and the function of the market mechanism; understanding the importance to form a rational and orderly spatial structure of urban system; breaking the obstacles owing to administrative boundaries among cities to promote the regional integration.
京津冀存在“集聚阴影”吗: 大城市的区域经济影响
DOI:10.11821/dlyj201710010
[本文引用: 1]
在京津冀协同发展上升为国家战略以及雄安新区战略提出的背景下,检验京津冀城市群大小城市间的经济增长关系,可以为地区协调发展提供学术依据。研究发现:核心城市抑制了周边小城市的经济增长,存在集聚阴影和“环京津贫困带”;小城市之间也存在经济增长负面溢出效应;与长三角城市群相比,京津冀城市群内核心城市辐射和带动功能明显不足,区内城市间的发展差距更大。未来应实现多中心空间发展战略,抓住雄安新区建设的战略契机,在政府积极引导和尊重市场规律的前提下,打破行政分割,促进区域协调分工,形成大中小城市合理有序的城市群空间结构体系。
The long shadow of history in China: Regional governance reform and Chinese territorial inequality
Urbanization and city growth: The role of institutions
DOI:10.1016/j.regsciurbeco.2006.11.008 URL [本文引用: 3]
Spatial evolution characteristics of Chinese urban agglomerations in high-speed rail era: Agglomeration or diffusion
高铁时代中国城市群空间演进: 集聚还是扩散
Analysis of the influence of high speed railway on the siphon effect in Jiangxi province
高速铁路对江西省虹吸效应的影响分析
The development of high-speed railway and the economic agglomeration of cities along the railway
高速铁路发展与铁路沿线城市经济集聚
Economic growth spillover and spatial optimization of high-speed railway
高速铁路影响下的经济增长溢出与区域空间优化
Does China's high-speed rail promote regional manufacturing agglomeration? Evidence from cities along beijing-Guangzhou high-speed railway line
高铁开通促进了地区制造业集聚吗? 基于京广高铁的准自然试验研究
First nature, second nature, and metropolitan location
DOI:10.1111/jors.1993.33.issue-2 URL [本文引用: 1]
Spatial evolution of the US urban system
DOI:10.1093/jeg/4.2.131 URL [本文引用: 2]
City seeds: Geography and the origins of the European city system
DOI:10.1016/j.jue.2015.09.003 URL [本文引用: 1]
Reshaping China's economic geography in the opening environment: Rediscovering of first nature and rebuilding of second nature
开放环境下的中国经济地理重塑: “第一自然”的再发现与“第二自然”的再创造
The formation of metropolitan shadow from the perspective of industry spatial contacts: A comparison between Changjiang River delta and beijing-Tianjin-hebei metropolitan region
DOI:10.13249/j.cnki.sgs.2013.09.1043
[本文引用: 1]
This article introduces the reaction degree coefficient and the influence coefficient, constructs the industrial contact intensity model, and analyzes the spatial network characteristics of industries in the Changjiang River Delta and Beijing-Tianjin-Hebei (BTH) metropolitan region through the model of industry contact intensity. It focuses on the difference between the two regions and research the formation of metropolis shadow. The results show: 1) the better the industries contacts among the cities in region, the higher the economy level of region; 2) the better the industries between central city and other cities in region, he higher the economy level of region; 3) from the perspective of industries spatial contacts, the weak industry contact between central city and outlying areas is the key reason for the metropolitan shadow’s formation.
基于产业空间联系的“大都市阴影区”形成机制解析: 长三角城市群与京津冀城市群的比较研究
DOI:10.13249/j.cnki.sgs.2013.09.1043
[本文引用: 1]
通过引入感应度系数和影响力系数,构建产业联系强度测度模型,探讨了当前长江三角洲与京津冀城市群产业空间联系特征,研究了两大城市群空间经济差异,基于产业空间联系视野对“大都市阴影区”的形成进行了实证研究。研究表明:① 城市群内部各城市间产业联系强度越高,城市群整体经济发展水平就越好;② 城市群的中心城市与其他各城市产业联系强度越高,城市群整体经济发展水平就越好、越趋于均衡;③从产业空间联系来看,中心城市与其邻近的外围地区的产业联系强度弱化是造成 “大都市阴影区”形成的关键因素。
Functional linkages in the Beijing-Tianjin-Hebei conurbation region and the evolution of the complex networks
京津冀城市群的功能联系及其复杂网络演化
Mapping producer services networks in mainland Chinese cities
DOI:10.1177/0042098014558541
URL
[本文引用: 2]
We analyse the geographies of urban networks created by leading producer services (PS) firms in China. Because of the national regulation of the Chinese state-led economy and the location strategies of global advanced producer services (APS) firms, the geography of global APS in China as examined by the Globalization and World Cities Research Network (GaWC) cannot be studied as a subnetwork of GaWC’s global network, but needs an empirical study based on a wide range of leading PS in the Chinese market. We explore the spatial differentiation in the connectivity of Chinese cities based on the location strategies of 323 APS firms in 287 Chinese cities. Beijing, Shanghai, Guangzhou and Shenzhen emerge as the primary nodes. The spatial distribution of banking, securities, and insurance services networks appears to be more even than those of non-financial PS firms. Regional disparity exists in terms of polycentric urban development in coastal China, as well as in the centralisation model in central and western areas. We suggest that owing to the continued tight regulation of China’s state-led economy and the nature of the location strategies of ‘globalised’ PS firms, the urban networks created by Chinese PS firms are not only an extension of urban networks at a global scale but also an embodiment of economic activities at other scales.
Regional spatial effect and mechanism of industry development
产业的区域空间效应及其作用机理
Lost in space: Population growth in the American hinterlands and small cities
DOI:10.1093/jeg/lbn038 URL [本文引用: 1]
The effects of factor proximity and market potential on urban manufacturing output
DOI:10.1016/j.chieco.2016.04.002 URL [本文引用: 1]
dynamic agglomeration economies: Spatial context and structural evolution behind urban growth
DOI:10.1111/pirs.v95.1 URL [本文引用: 1]
Selection on observed and unobserved variables: Assessing the effectiveness of Catholic schools
DOI:10.1086/426036 URL [本文引用: 1]
Gender identity and relative income within households
DOI:10.1093/qje/qjv001
URL
[本文引用: 1]
We examine causes and consequences of relative income within households. We show that the distribution of the share of income earned by the wife exhibits a sharp drop to the right of 12, where the wife’s income exceeds the husband’s income. We argue that this pattern is best explained by gender identity norms, which induce an aversion to a situation where the wife earns more than her husband. We present evidence that this aversion also impacts marriage formation, the wife’s labor force participation, the wife’s income conditional on working, marriage satisfaction, likelihood of divorce, and the division of home production. Within marriage markets, when a randomly chosen woman becomes more likely to earn more than a randomly chosen man, marriage rates decline. In couples where the wife’s potential income is likely to exceed the husband’s, the wife is less likely to be in the labor force and earns less than her potential if she does work. In couples where the wife earns more than the husband, the wife spends more time on household chores; moreover, those couples are less satisfied with their marriage and are more likely to divorce. These patterns hold both cross-sectionally and within couples over time.
The Hukou system and rural-urban migration in China: Processes and changes
DOI:10.1017/S0305741000001351
URL
[本文引用: 1]
Until recently, few people in mainland China would dispute the significance of the hukou (household registration) system in affecting their lives – indeed, in determining their fates. At the macro level, the centrality of this system has led some to argue that the industrialization strategy and the hukou system were the crucial organic parts of the Maoist model: the strategy could not have been implemented without the system. A number of China scholars in the West, notably Christiansen, Chan, Cheng and Seiden, Solinger, and Mallee, have begun in recent years to study this important subject in relation to population mobility and its social and economic ramifications. Unlike population registration systems in many other countries, the Chinese system was designed not merely to provide population statistics and identify personal status, but also directly to regulate population distribution and serve many other important objectives desired by the state. In fact, the hukou system is one of the major tools of social control employed by the state. Its functions go far beyond simply controlling population mobility.
The flat distribution of city size in China: A multidimensional regional validation and its economic interpretations
中国城市体系规模分布扁平化: 多维区域验证与经济解释
The spatial agglomeration and industrial network of strategic emerging industries and their impact on urban growth in mainland of China
Are Chinese cities too small?
DOI:10.1111/j.1467-937X.2006.00387.x URL [本文引用: 2]
The universal pathway to innovative urban economies
Cities recapitulate a universal pathway into innovative economies.
Spatial cluster characteristics and modes of producer services in China
DOI:10.13249/j.cnki.sgs.2014.04.385
[本文引用: 1]
In the past decade, rapid output growth and employment in the producer services of China have interested the academic sphere in spatial cluster and elaboration of locational theory concerning producer services' activities. The article examines spatial clusters and location characteristics of producer services in the Chinese urban system in the years 2000, 2005 and 2010. This study indicates that the location of cities of a large number of employments of service sectors is dispersed in China, comparing to geographical concentration of cities of developed manufacturing industry. Most of producer services experienced a spatially-centralization process in the period 2000-2010. However, there are different cluster modes in various service sectors. According to characteristics of industry agglomeration, these industries are classified into three modes, namely Primate City cluster mode, Rank-Size distribution mode and Balanced distribution mode. Primate City cluster mode means the largest city of industry have overwhelming employment scales, cluster characteristics of information service industry and business service industry. The number of employment of technology and science service industry as well as real estate in the largest cities is slightly more than other classes of cities. Thus these two industries are classified as Rank-Size distribution mode. Although the number of employment of finance and insurance service has increased in the first class cities, the largest city has no advantage of urban system and the number of employ is relatively balanced in urban system. Therefore, this industry is categorized as Balanced distribution mode. Moreover, the analysis of location quotient and scale of employment evidences there is positive correlation between amount of employment and the number of superiority functions. This means that distribution of producer services in China is in accordance with central place theory. Finally, the study also shows there are complementarities and division of labor among of cities in the same provinces and developed metropolitan regions.
中国生产性服务业空间集聚特征与模式研究: 基于地级市的实证分析
DOI:10.13249/j.cnki.sgs.2014.04.385
[本文引用: 1]
2000年以后,中国生产性服务业高速发展,产业格局逐渐形成。利用2000年、2005年和2010年3个年份地级市行业从业人员的数据,通过区位基尼系数和空间自相关性分析,发现中国生产性服务业在地理空间中整体呈现点状集中的模式,进而对不同行业的集聚特点进行比较分析,认为信息服务业和商务服务业是首位城市集聚模式,科研技术服务业和房地产业是位序规模分布的模式,金融业则是均衡分布的模式。最后,结合主要城市行业的相对优势度分析,得出随着从业人员的增加,承担的生产性服务功能更加综合,符合中心地理论的特点,在省域和城市群内各城市具有较好的职能分工和互补性。
