

1 引言
伴随以5G、云计算、大数据、物联网、人工智能等数字技术加速升级迭代并与经济社会各领域深度融合,新型数字基础设施受到各国普遍关注并成为提升综合竞争力的重要抓手[1]。当前,数字经济凭借其高渗透性、规模效应、网络效应成为驱动全球经济增长的新引擎,使数字化、在线化成为当前全球经济活动的重要组织形式[2-3],由此带动全球数据量呈现爆发式增长[4-5]。数据应用、数字化转型对以数据中心、海底光缆等为代表的数字基础设施造成了前所未有的压力[6],引发各类数字基础设施在全球范围内快速扩张。作为数字基础设施重要构成部分的数据中心具有强产业关联特性,在全球数据价值链中承担数据存储、分析等数据增值的核心功能,有效支撑整个国民经济发展[7]。特别是在数字经济时代,作为经济社会数字化发展的基石,数据中心有力支撑产业数字化转型,对打造区域创新发展新高地、应对国际竞争具有重要的战略意义[8-9]。
数据中心主题相关研究是数字经济时代的重要议题,已有研究主要从以下视角开展:① 数据中心软硬件设施。主要由计算机、信息通信等领域学者主导,聚焦数据中心关键核心技术研究,如IT设备、供电设备、温控设备、安全设备等硬件设施[10-11],以及云计算、网络结构、安全软件等软件系统等研究[12-13],力图通过核心技术升级增强数据中心运营效率,降低运营成本,保障运维安全。② 数据中心产业发展及效应。主要由管理学、经济学、地理学等领域学者开展,围绕数据中心对于经济发展、财政收入、生态环境等方面所产生的效应,以及数据中心企业发展对策、政府政策响应等内容开展[14⇓⇓-17]。③ 数据中心空间格局与优化。由地理学和经济学领域学者主导,主要围绕数据中心的空间格局、区位选择、协同布局、建设运营模式、地缘安全等方面开展[18⇓⇓⇓⇓-23],通过协同布局优化提高数据中心对数字经济的支撑作用及对关联产业的带动作用。总的来看,数据中心相关主题研究涉及多学科、多领域的共同参与,其中地理学在数据中心空间布局及产业发展等方面贡献突出,但受数据所限对全球尺度时空格局演化及机制探讨较少;研究方法以定性研究为主的同时融入多目标决策、GIS空间分析等定量研究方法,较少运用空间统计及计量分析方法;研究空间尺度通常以城市或城市内部的单一尺度为主,亟待开展多尺度对比研究。
社会经济现象的空间格局演化及其影响因素研究是地理学特别是人文地理学核心研究内容之一[24],遵循“格局—过程—机理”研究范式,已有研究涉及人口、产业、设施、社会经济联系等,有力地解释了各种地理现象的时空演化[25⇓⇓-28]。与此同时,空间尺度是地理学研究的重要概念,空间尺度效应表现为随空间尺度变动,被观测对象呈现不同的特征和结构,多尺度空间格局和影响因素的综合研究可以更充分地解释地理现象空间扩张的动力过程[29⇓-31],是理解地理现象扩张与集聚的重要视角。数据中心作为一类新型基础设施,使用人文地理学逻辑与方法探讨其多尺度扩张格局演变及其区位选择的影响因素,对于充分理解数据中心企业对于其扩张的区位选择与地理空间之间的相互关系,指导数据中心形成合理布局意义重大。特别是在当前全球数字科技竞争日益激烈、数字经济为全球经济发展注入新活力之时,把握数据中心扩张的空间格局及其影响机制恰逢其时。
综上所述,本文基于2005—2020年全球数据中心数据,融合空间统计、空间分析、计量分析等方法,从国家和城市尺度刻画全球主要国家数据中心扩张的区位选择特征、归纳扩张模式,系统揭示全球数据中心空间选择的时空演化规律,并探究影响因素,以期为全球及中国数据中心布局优化提供参考,同时丰富经济地理学及网络空间地理学相关理论与实践。
2 理论框架与研究方法
2.1 理论框架
2.1.1 数据中心的内涵属性
根据中国信息通信研究院关于数据中心规模的划分标准[33],以功率2.5 kW为一个标准机架,将数据中心划分为超大型、大型、中小型3种规模。其中,规模大于10000标准机架的为超大型数据中心,规模大于3000标准机架但小于10000标准机架的为大型数据中心,小于3000标准机架的为中小型数据中心。按服务范围大小可将数据中心划分为全球级、国家级、区域级和机构级4个等级。按运营模式可以分为企业数据中心、批发型数据中心、零售型数据中心、基础电信运营商数据中心等[34]。作为中国“新基建”的重要构成,数据中心建设已成为推动产业数字化转型的必然选择,也是发展数字产业并带动经济增长的重要举措[35-36]。
2.1.2 数据中心的区位指向
经济区位论是理解数据中心扩张的经典理论。数据中心作为一种数字基础设施,其区位选择综合了工业、商业、服务业等多种产业特性,涉及社会、经济、环境等多种因素[37]。总的来看,数据中心时空扩张是在市场规模、要素供给、运营环境等多种因素共同作用的结果,且在不同时空间尺度下,影响数据中心区位选择因素存在一定差异。
(1)广阔的需求市场:与商业、服务业设施类似,数据中心主要布局在数字经济发展水平较高、人口密度高、数据流量大等具有广阔市场的国家和区域以获取商业利益[38]。① 旺盛的算力需求。伴随数字经济对于全球经济增长的驱动作用不断强化,产业数字化和数字产业化进程深入推进,对算力提出了更高的需求[39],数字经济发展水平较高的国家、各国主要城市的数据流量经历了爆发式的增长,对以数据中心为代表的新型数字基础设施产生了大量需求,成为数据中心布局的重要区位。② 邻近相关机构与企业。终端客户需求对数据中心布局同样起着指引作用,券商、金融、游戏、科创等产业对低延时的实时算力有着强烈的需求,吸引数据中心进行本地化部署[40]。③ 较高的市场增长潜力。为了拓展和占领市场,数据中心运营商通常会抢先在市场潜力大或竞争压力小的区域进行布局,以取得先发优势。
(2)优质的要素供给:数据中心具有强生产要素指向特征,其建设和运营需要大量的自然资源和经济资源作为支撑与保障。① 低廉的建设与运营成本。数据中心在建设与运营过程中需要大量平整开阔的土地、低廉稳定的电力与网络供给[41],特别是电力资源在数据中心运营成本中占比超50%[42],考虑到降低建设、运营成本的需要,富能源、低地租地区成为数据中心布局的重要选择。② 优质的运维保障条件。数据中心运行和维护需要大量的专业性运维人才和管理人才提供技术支持;互联网骨干线路节点城市、海底光缆登陆站点城市等网络基础设施完备的地区,可以为数据中心提供廉价稳定的网络传输。③ 完善的配套设施。数据中心的运行与保障需要完善的交通条件和先进的技术水平,完善的配套成为吸引数据中心布局的重要因素[43]。
(3)稳定的运营环境:数据中心建设与运营需要适宜的自然环境、稳定的社会环境和优惠的政策环境。① 凉爽的气候条件。数据中心的散热系统能耗占比极高,仅次于IT设备用电[42],凉爽的气候对于降低数据中心能耗有显著效果,是数据中心区位选择的重要因素[44]。② 可靠的自然和社会环境。主要涉及自然环境安全、政治安全、军事安全、社会治安等对数据中心可靠性所造成的影响,需要尽量减少安全风险对于数据中心的冲击,特别是避免断电、断网、意外事故等安全因素对数据中心正常运转及数据安全造成影响[45]。作为一种邻避型基础设施,数据中心运营会产生大量的噪音和其他问题,因此在微观区位布局时,需尽量远离住宅区,避免对居民生活造成影响[46]。③ 优惠的政策环境。数据中心区位选择受政策影响显著,当前全球主要国家均认识到数据中心建设与运营大量耗费有限的土地、电力等资源,并产生大量的碳排放,从可持续发展角度出发,各国数据中心政策密集出台,通过税收减免等政策引导数据中心向富能源地区集约布局,并通过合并、改造或关闭的方式优化高能耗数据中心,亦或暂停新数据中心项目[8]。
(4)区位因素的综合权衡:数据中心区位选择是对多种因素综合权衡的结果,在某些因素发挥主导作用时,势必会减少对于其他因素的考虑。如数据中心与用户集聚地、能源供应地等既可整合又可分离,数据存储、离线分析等相关业务对实时算力要求相对较低,专注于此类服务的数据中心倾向于向低地租、富能源区域聚集而不是指向用户所在地;同时,数据中心布局时若优先考虑邻近服务对象,那么可能需要放弃低廉的电力和土地所带来的成本节约。
2.1.3 数据中心的空间扩张
具体而言,作为具有强市场指向性特征的新型基础设施,数据中心首先出现在互联网发达、具有先进数字化水平的算力需求旺盛、市场前景广阔的地区,数据中心在这些先发地区不断聚集增长带动其规模水平得到提升[32]。在随后的市场趋向饱和、竞争压力增大、关键要素成本上升、区域政策调整、外部环境波动等固定调节与随机扰动因素的多重自他组织作用下,数据中心向其他区域呈现邻近扩张或点状生长,并在这些区域进一步聚集增长,表现出路径依赖与路径创造特征[49]。在此过程中,多机制互动调节带动数据中心布局的空间结构不断演进,发育典型的等级性和层次性特征[50],聚集形成国家级、区域级、地方级的数据中心枢纽体系,多种等级枢纽在不同空间尺度上共同塑造形成单核心结构、多中心结构、“核心—边缘”结构、散布结构等多种空间形态[51],进而支撑互联网与数字经济的发展。伴随着数据中心的扩张与整合,整个区域的数据中心空间结构在错配无序与同配有序中往复发展并最终向高水平耦合演进[52]。
基于上述对于数据中心内涵属性、区位指向、空间扩张的理论分析,本文构建了数据中心扩张的理论框架(图1)。综合来看,数据中心的固有属性所产生的自组织机制、区域环境产生的他组织机制是数据中心扩张演化的主要动力,其产生的聚集力与扩散力促使数据中心表现路径依赖与路径突破特征并形成邻近扩张、点状生长、聚集增长等多种空间选择形式,共同塑造全球数据中心的空间结构不断演进。
图1
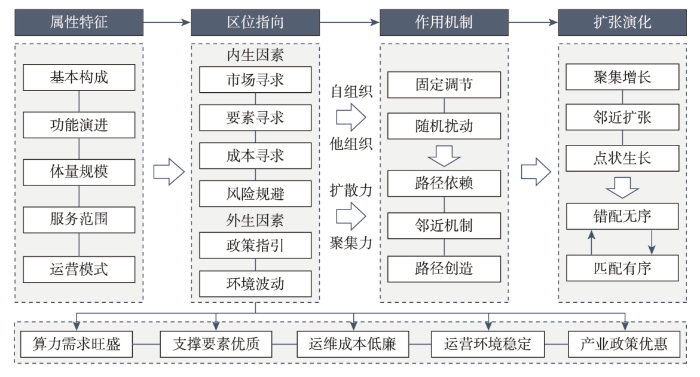
图1
数据中心扩张的理论框架
Fig. 1
The theoretical framework of the data center spatial expansion
2.2 研究假设
根据上述数据中心的区位指向分析,数据中心的区位选择是多种因素权衡后的结果。数据中心倾向于邻近具有广阔市场潜力的区域进行布局,其建设、运营既需要低廉、稳定的软硬件环境作为支撑保障,更需要适当的条件以降低运营成本,同时还会受政策等外部力量的影响。综合理论分析并结合数据可得性,本文提出以下研究假设:
H1:市场规模与潜力对数据中心的区位选择具有显著正向作用;
H2:生产要素规模与质量对数据中心的区位选择具有显著正向作用;
H3:生产要素成本对数据中心的区位选择具有显著负向作用;
H4:平均气温对数据中心的区位选择具有显著负向作用;
H5:社会安全水平对数据中心的区位选择具有显著正向作用。
2.3 研究方法与模型构建
本文主要使用数理统计、重心分析、图示化表达等分析方法对数据中心扩张的空间态势进行描绘;使用计量经济方法探讨数据中心区位选择的影响因素。为节省篇幅,仅对指标选取与模型构建进行说明。
2.3.1 指标选取
受数据可得性限制,本文主要从全球尺度和城市尺度对数据中心空间扩张的影响因素进行探讨。根据前文数据中心区位选择的理论分析,从市场规模、要素供给和运营环境3个方面确定指标,考虑到数据可得性,选取市场规模、网络条件、电力条件、人力条件、交通条件、技术条件、气候条件、安全水平等8项指标(表1)。
表1 数据中心区位选择的影响机制指标体系
Tab. 1
| 类别 | 指标(代码) | 国家尺度指标解释 | 城市尺度指标解释 |
|---|---|---|---|
| 市场规模 | 市场规模(IU) | 互联网用户数 | GaWC城市评分 |
| 要素供给 | 网络条件(IB) | 国际带宽 | 互联网宽带价格 |
| 电力条件(ER) | 通电率 | 工业电力平均价格 | |
| 人力条件(HR) | 软科TOP 500高校数量 | 软科TOP 500高校评分 | |
| 交通条件(TI) | 交通基础设施水平 | 航空通航城市数量 | |
| 技术条件(TC) | ITC服务出口额 | 专利申请数量 | |
| 运营环境 | 气候条件(AT) | 平均气温 | 平均气温 |
| 安全水平(SR) | 政治稳定性 | 安全指数 |
从国家尺度来看,市场因素中,数据中心主要服务互联网及数字经济发展带来的数据存储及处理活动,选用互联网用户数表征市场规模以反应国家(地区)对于数据中心的需求。要素供给因素中,网络基础设施、电力条件、人力资源、交通条件、科技条件是数据中心建设和运营的重要支撑,是数据中心运营商国家(地区)选择需考虑的支撑性因素,分别选用国际带宽、通电率、软科TOP 500高校数量、世界经济论坛各类交通基础设施发展水平之和、ICT服务出口额来表征。由于缺乏全球尺度土地资源的可比数据,故未将土地条件纳入到模型之中。气候条件中,可通过将数据中心布局在自然环境适宜地区以降低运营能耗,稳定的安全环境也是保障数据中心可靠性的重要因素,分别选用平均气温和政治稳定性进行表征。
城市尺度的指标体系与国家尺度一致,受数据可得性影响,指标内涵存在一定差异。市场因素中,使用GaWC评分表征市场规模,对各城市以GaWC等级由Alpha++到Sufficiency分别赋12~1分,其他城市赋分0。要素供给因素中,使用价格表征网络和电力条件;使用各城市软科TOP 500高校得分衡量人力条件,以10%为间隔,排名前10%到100%分别赋值10~1分;使用航空通航城市数量和专利申请数量表征城市的交通条件和技术条件。受数据限制,模型同样暂不对土地条件进行考虑。运营环境因素中,分别使用平均气温和NUMBEO的城市安全指数表征气候条件和安全水平。
2.3.2 回归模型
全球数据中心扩张数据为计数数据,且被解释变量存在过度离散现象,因此选用负二项回归模型对全球数据中心空间扩张的影响因素进行识别分析[25]。全球尺度和城市尺度影响因素模型构建分别如下:
式中:α是常数项;εi是随机误差项;DCi为国家(地区)、城市i新增数据中心数量;IUi表示国家(地区)、城市i的数据中心市场规模;IBi表示国家(地区)、城市i的网络条件;ERi表示国家(地区)、城市i的电力条件;HRi表示国家(地区)、城市i的人力条件;TIi表示国家(地区)、城市i的交通条件;TCi表示国家(地区)、城市i的科技条件;ATi表示国家(地区)、城市i的气候条件;SRi表示国家(地区)、城市i的安全水平。为减少指标数据存在的波动性并消除异方差,部分指标取对数形式[55]。
模型检验结果显示,模型参数Alpha值不等于0,prob > chi2 = 0.000。对所有变量进行多重共线性检验,VIF值均小于5,不存在明显多重共线性问题,模型构建良好。需要说明的是,负二项回归的伪R2值通常会远低于普通最小二乘法模型的R2值,当伪R2值大于0.2时即可被认为拥有极佳的拟合度[56]。为了验证模型的稳健性,选择以替换变量法将机架数量作为因变量、替换自变量两种方式重新构建模型,回归结果呈现较强的一致性,表明模型构建较为稳健,具有较强解释力。
2.4 数据来源与数据处理
2.4.1 数据中心基础数据
数据中心基础数据主要来源于数据中心知识库(451 Research Datacenter Knowledge Base),数据中心知识库是标普集团旗下的权威数据集,该数据集收录了全球100多个国家(地区)主要数据中心的建设时间、规模等信息。同时,使用多源数据①(① 主要包括来源于www.datacenterhawk.com、www.baxtel.com、www.cloudscene.com、www.datacenters.com、www.datacentermap.com等网站、数据库以及主要数据中心运营商网站的相关属性数据。)对部分缺失信息进行补充。数据中心在20世纪末进入建设萌芽期,随后在21世纪初迎来繁荣发展。本文主要目的是考察不同时间阶段全球数据中心在不同空间尺度上的区位选择偏好,更加关注各阶段新建数据中心,为此选择2005—2020年新增数据中心作为主要研究对象,并分为2005—2010年、2011—2015年、2016—2020年3个时段进行讨论。
2.4.2 解释变量来源与处理
国家尺度指标数据主要来源于国际电信联盟、世界银行、世界经济论坛、软科、全球治理指标数据库等。城市尺度指标数据主要来源于各国及欧盟统计局、全球化与世界级城市研究小组与网络(GaWC)、NUMBEO、CLIMATE-DATA.org、软科、OAG Schedules Analyzer、世界知识产权组织以及《全球城市竞争力报告》等权威报告。
由于城市尺度部分城市的部分数据存在缺失,故使用估算方式进行补充。其中互联网宽带价格缺失数据使用国内邻近城市或国家尺度数据进行补充。电力价格在欧盟使用城市尺度数据,在中国使用省级数据,美国使用州级数据,其他国家使用国家尺度数据。安全指数缺失城市使用邻近的国内城市或所在国平均水平补充,若所在国家无城市有安全指数数据,则根据全球治理指标数据库中的政治稳定性进行估算。由于机场通常服务于所在城市及其邻近城市,且部分城市机场并非位于市域范围内,因此将通航城市数量赋予所在城市及主要服务城市。
3 全球数据中心扩张的空间特征
3.1 全球尺度:地域范围不断扩张,形成三大增长核心
全球数据中心地域范围不断扩张,覆盖国家持续增加,在全球范围内呈现多中心增长态势。2005年以来,全球数据中心空间扩张表现出明显的“空间粘性”和“马太效应”特征,位于北半球的北美、西欧、东亚三大全球数据中心聚集区由于高度发达的互联网及数字经济,是全球扩张的主要动力,其中美国、中国始终引领着全球数据中心增长。南半球新建数量和规模均远低于北半球,始终处于较低水平,其中澳大利亚、巴西、南非等国是南半球建设的主导力量。随着数据中心在全球范围的广泛扩散,数据中心的地理重心与全球经济重心表现出一致的系统性东移现象,东亚地区在全球数据中心扩张中的地位愈加重要[57]。经过多年的扩张演化,全球数据中心的空间分布最终由北美、西欧、东亚“三核心”格局成长为东亚、西欧、北美为全球核心,印度、新加坡、澳大利亚、巴西等为区域中心的“三核心、多中心”格局,与全球人口和经济活动分布表现出较强的空间同配特征。数据中心在全球各国分布表现出明显的长尾分布特征,大部分数据中心集中分布于数量排名前列的国家,数字基础设施发展不平衡进一步拓宽了全球“数字鸿沟”,在一定程度上制约了部分“南方国家”数字经济发展能力[58](图2)。
图2
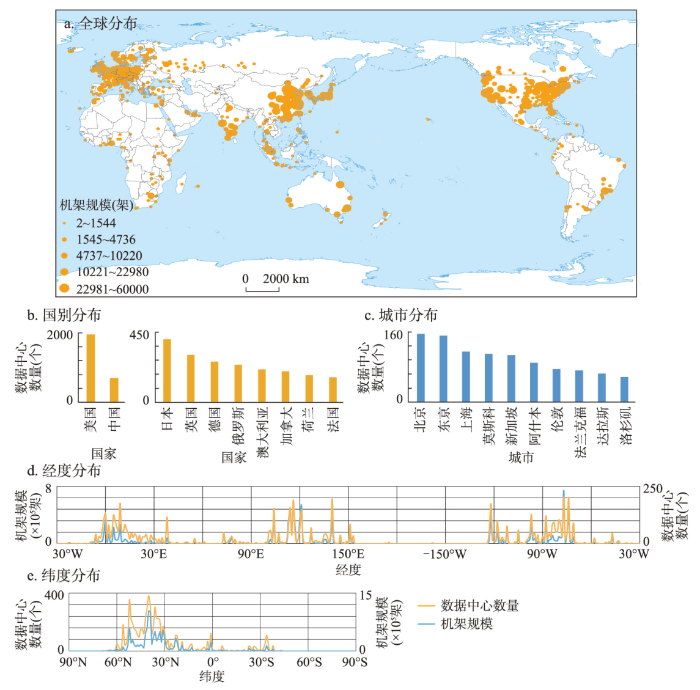
图2
2020年全球数据中心空间格局
注:基于自然资源部标准地图服务网站审图号为GS(2016)1665号的标准地图制作,底图边界无修改。
Fig. 2
Distribution of global data centers in 2020
(1)2005—2010年新建数据中心高度集聚在北美、西欧、东亚3个地区,在全球范围内形成三大核心(图3a)。① 新建数据中心的国别分布表现为首位型分布(|q| = 1.58),不同国家增速差异显著。数据中心新建数量前20位的国家集中了超过90%的项目,其中美国、中国、英国等因在ICT领域领先的地位成为本阶段增长的主导力量,集中了超过50%的新建项目。南美、中亚、东南亚和非洲算力需求有限导致新建规模相对较小,主要位于这些地区经济相对发达的国家。② 粗放式发展使得中小型数据中心主导本时段数据中心的扩张,而大型及超大型数据中心新建数量较少,主要分布于美国和中国,其中超大规模项目高度集中于美国。
图3
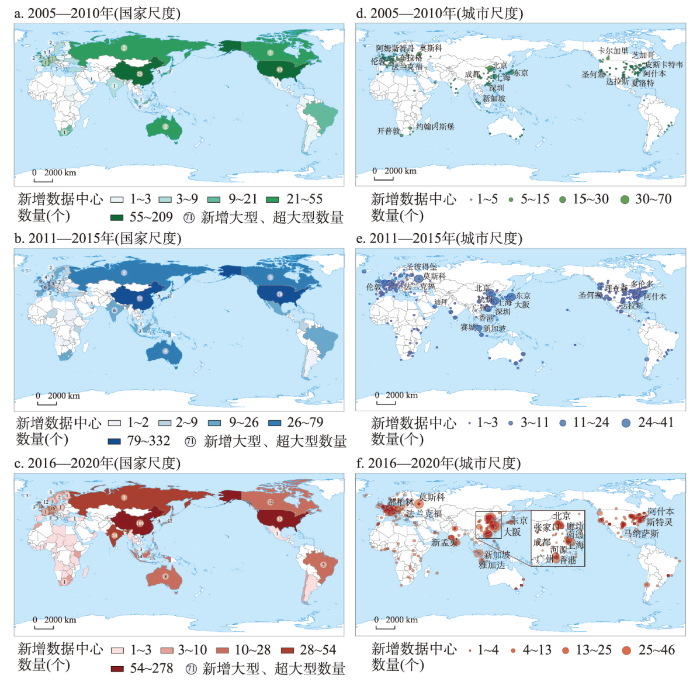
图3
2005—2020年全球数据中心扩张的空间格局演化
注:基于自然资源部标准地图服务网站审图号为GS(2016)1665号的标准地图制作,底图边界无修改。
Fig. 3
Spatial evolution of data centers expansion from 2005 to 2020
(2)2011—2015年全球数据中心地域范围进一步扩展,呈现邻近扩张和点状生长并行态势,大型化特征开始显现(图3b)。① 建设数据中心的国家数量大幅增长,美国、中国和日本仍是全球数据中心扩张的主导国家,南半球新建数量有小幅提升,但增速与北半球相比差距显著。② 全球数据中心地域范围呈现邻近扩张和点状生长并行态势。一方面,围绕北美、西欧、东亚三大核心区域向邻近国家表现邻近扩张现象;另一方面,非洲互联网的进一步发展带动尼日利亚、肯尼亚、摩洛哥等国家表现为“路径创造”式的点状生长模式,但新增数据中心规模通常较小。③ 规模大型化趋势开始显现。美国、中国仍是大型及超大型数据中心的主要建设地,与此同时,伴随后发国家互联网迅猛发展,南亚、东南亚、南非等地区也出现了大型及超大型数据中心。
(3)2016—2020年全球数据中心扩张放缓,中国、印度增长动力强劲,大型化趋势进一步凸显,“三核心、多中心”空间格局进一步巩固(图3c)。① 全球数据中心新建进入调整巩固阶段,增长的主要动力发生变动,建设重心东移趋势显著。受数据中心建设运营成本的大幅增长,能耗与碳排放问题受到重视,欧美国家增速普遍放缓。中国因其数字经济和数字化转型迅猛发展带动数据中心建设,取代美国成为全球扩张的最主要引擎,且以大型及超大型规模为主。印度的地位得到凸显,新建数量仅次于美国。更多非洲国家出现了数据中心建设,但仍以中小型为主,超过30%的数据中心由国外数据中心供应商投资建设,这一比重远超其他国家和地区。② 大型化趋势进一步凸显,大型、超大型数据中心取代中小型占据增长的主导地位,地域集中度进一步提升。在政策及市场的自他组织作用下,中国算力需求大幅增长的同时,政策指引数据中心集约化、大型化发展,使得中国成为大型、超大型数据中心的主要新建地,占比超过50%,数量远超其他国家,其次是美国和印度。而欧洲国家大型及超大型新增数量显著少于亚洲国家。
3.2 城市尺度:集中于发达大城市,邻近扩张趋势显著
全球数据中心在城市尺度上扩张同样存在明显的空间差异。新建数据中心的城市数量经历了由增加到收缩的动态演化过程,各城市新建“位序—规模”呈现典型幂律分布特征。数据中心扩张的主导城市与人口分布及经济发展水平表现出空间同配性,多集中于人口30万以上的经济发达、高科技产业集聚、重要国际网络节点的沿海大城市,特别是各国大城市群或都市区的核心城市是扩张的重点区域,如中国的长三角城市群、京津冀城市群、粤港澳大湾区,美国的纽约都会区、华盛顿都会区,加拿大的大多伦多地区、英国的伦敦都市区等地区中的城市数据中心建设密集。数据中心在不同国家城市扩张存在阶段差异,欧美日国家城市因其数字经济和互联网的高度发展以及发达的ICT技术,在数据中心扩张中处于领先地位,并在自身属性及外部区域政策的自他组织作用影响下及邻近性机制作用下经历了由大城市中心向周边中小城市的转向过程,而中国、印度以及非洲城市正经历上述过程。不同国家城市数据中心扩张表现出显著差异,欧美国家如美国、荷兰等国数据中心增长由多个城市共同作用,参与新建的城市数量较多,但各城市新增数量较少;中国数据中心建设由几个城市主导,高度集中于北上广等三大城市群的核心城市,城际增长差异较大。经过多年的扩张演化,数据中心在全球各城市分布同样表现出明显的长尾分布特征,高度集中于少数头部城市,在全球范围内形成北京、东京、上海、莫斯科、新加坡等多个数据中心枢纽,全球数据中心在各国主要城市间的空间布局向与经济社会高水平耦合演进。
(1)2005—2010年参与建设的城市较少,地域范围相对集中,以各国首都和经济发达的大城市为主(图3d)。① 各城市新建数量存在显著差异。参与数据中心建设的城市高度集中于美国,其次是中国和法国,各城市建设数量多为3个以下。新建数量排名前列的城市多位于亚洲,北京是本阶段全球数据中心增长的动力核心,新建数量远超其他城市,处于绝对的主导地位,其次是上海和莫斯科。② 北京在不同规模扩张中均处于首位。北京、新加坡、阿什本新建大型、超大型数据中心超过3个,其余90个大型及超大型数据中心新建于其他71个城市(图4)。北京、上海中小型数据中心新建数量同样位于前列,占据新增总量的10%。③ 各国首都及经济发达的大城市是各国数据中心首选布局区位,欧美国家由于成本和政策因素出现向大城市周边扩散趋势。中国新建数据中心高度集中于北上广3个城市,其次是深圳及各省的省会;日本高度集中于东京和大阪;美国新建数据中心主要分布于芝加哥、达拉斯、圣何塞等大城市,以及位于华盛顿都会区的阿什本、纽约都会区的皮斯卡塔韦等中小城市或镇区;英国新建数据中心集中分布在伦敦和位于其西部的斯劳。尽管欧美国家在政策及成本因素等自他组织机制作用下已经出现向大城市周边城市转移的趋势,但首都、各州的首府或经济发达城市仍是首选区位。
图4
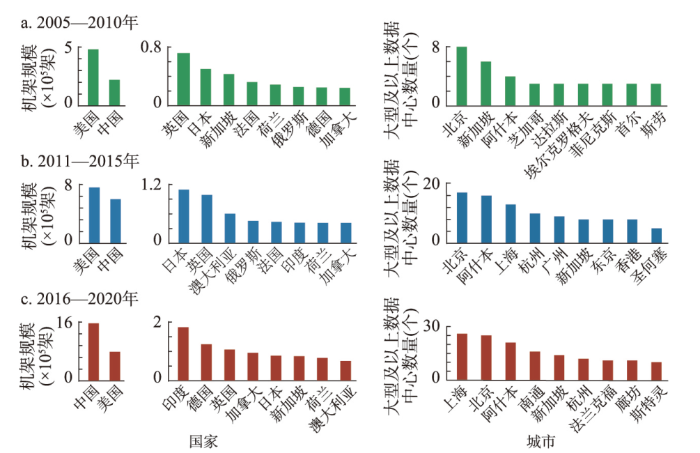
图4
2005—2020年全球主要国家新增机架规模和主要城市新增大型及以上数据中心数量
Fig. 4
The scale of new racks in major countries and the growth trend of large scale data centers in major cities, 2005-2020
(2)2011—2015年参与数据中心建设的城市数量大幅提升,特别是亚洲城市带动作用显著,欧美城市数据中心建设向大城市周边及中小城市转移态势显著(图3e)。① 亚洲城市特别是中国城市的带动作用进一步凸显。北京扩张放缓但仍处于首位,增长动力由北京单核引领向北京、上海、东京、广州等多中心带动转变。在算力需求带动下,中国城市在大型及超大型数据中心建设方面带动作用显著,北京、上海是本阶段大型及超大型数据中心的主要布局城市(图4)。② 大城市周边城市中小城市成为欧美数据中心建设的主要区位,中国仍以北上广深等大城市群核心城市为主。为降低建设和运营成本,满足大型数据中心设施布局,大城市周边地区成为数据中心新建的重要区域,这一现象在欧美及日本的城市尤为明显。中国新建数据中心也存在上述趋势,如北京周边的廊坊等,但大城市群的核心城市仍是数据中心布局的主要区位。
(3)2016—2020年参与数据中心建设的城市相比上一阶段有所下降,形成多个数据中心枢纽城市,城市内部集聚形成多个集群(图3f)。① 伴随着互联网迅猛发展和数字化转型不断深入,中国城市在全球数据中心建设中的地位逐渐攀升。新建数量前10位城市中有6个位于中国,且城市等级有所下降,路径创造特征凸显,廊坊、南通进入到全球数据中心新建数量前10城市。② 大型、超大型数据中心主要建设城市保持相对稳定,空间上呈现连续扩张态势(图4)。上海、北京、阿什本仍是全球大型及超大型数据中心的主要建设城市,同时,在政策指引下,中国一线城市和周边城市加快数据中心协同布局,超大型数据中心在中国的南通、杭州、河源、廊坊、张家口等大城市群内中小城市增长较快,在全球增长中发挥引领作用,大型及超大型数据中心向大城市周边中小城市、富能源地区及气候适宜地区转移现象显著。③ 聚集发展成为数据中心建设的主要态势。欧美形成阿什本、伦敦、斯劳、法兰克福等多个数据中心枢纽城市,新建数据中心主要围绕枢纽城市进行;中国数据中心枢纽城市初步发育并成长;非洲国家、印度等国城市数据中心加速建设,地域范围空间扩展幅度相对较大,但聚集规模相对较小或相对分散。
3.3 演化规律:受聚集力与分散力共同驱使,形成多种空间结构
图5
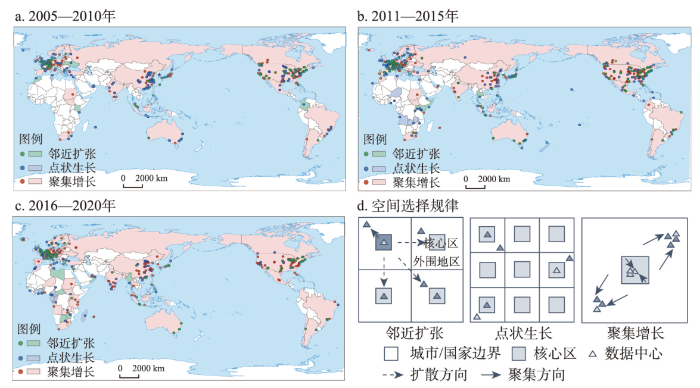
图5
2005—2020年全球数据中心空间扩张模式
注:基于自然资源部标准地图服务网站审图号为GS(2016)1665号的标准地图制作,底图边界无修改。
Fig. 5
Spatial expansion model of data centers, 2005-2020
(1)邻近扩张:是一种路径依赖与路径创造并存的空间选择方式,表现为数据中心企业受空间近邻效应的影响,选择邻近未出现数据中心建设的区域进行布局,带动数据中心建设的空间范围由近及远扩展。该空间扩张方式较为普遍,在全球尺度上表现为向邻近国家扩张,如由法国、俄罗斯向乌克兰扩张;城市尺度上表现为由某一城市向周边其他城市扩张,如达拉斯向邻近的理查森扩张,阿什本向邻近的斯特灵扩张。邻近扩张的动力主要来源于诸如原区域成本上升、竞争压力、政策限制等所产生的扩散力,以及扩张所指向区域低廉的成本、广阔的市场、优惠的政策等所产生的聚集力的单独作用或共同作用,扩散力中的扩散性循环累积效应与聚集力中的聚集性循环累积效应[59],促使数据中心企业采取邻近布局方式。
(2)点状生长:是一种路径创造式的空间选择方式,表现为在算力需求带动下数据中心跨区域的不连续扩张,带动数据中心建设在新的地理空间出现。该方式在全球尺度上以非洲国家的数据中心孤立增长为典型代表;城市尺度上表现为某一邻近地区无数据中心的城市出现数据中心布局。其中等级扩张是点状生长的一种特殊形式,表现为数据中心依据区域等级进行空间扩张。点状生长所在区域的广阔市场、低廉成本、优惠政策等所产生的聚集性循环累积因果链增强了区域聚集力,促使数据中心企业向该地布局[59]。与此同时,在国家内部中也表现出自上而下的他组织力量作用,如中国的数据中心政策指引数据中心企业向西部城市集中布局。
伴随着数据中心的全球扩张,在国家和城市尺度塑造出多种空间结构。全球尺度上形成以美国、中国、日本、英国、德国等系列国家为核心,印度、新加坡、澳大利亚、巴西等国家为边缘的“核心—边缘”结构。在城市尺度上,各国内部围绕大城市群、都会区形成多个“核心—边缘”结构或多核心结构,如在中国长三角形成以上海为核心枢纽,杭州、南通等城市为边缘的空间结构;在美国华盛顿都会区形成阿什本、斯特灵、马纳萨斯为主要枢纽城市的多核空间结构。然而在非洲等数据中心建设后发国家中,数据中心的城市分布仍以单核结构为主,即数据中心高度集中分布于少数城市。
4 全球数据中心扩张的影响因素
数据中心在全球多尺度的空间扩张反映了数据中心供应商区位选择的基本偏好,是理解数据中心多尺度空间区位选择的基础。基于此,结合全球数据中心区位选择导向,选择不同空间尺度数据中心区位选择的影响因子,并定量分析不同空间尺度下数据中心区位选择的影响因素差异。
4.1 国家选择的影响因素
数据中心扩张的国家选择主要受到市场规模、要素供给、运营环境共同影响,影响因素的作用方向和显著性水平表现出阶段性特征,随着时间的推移影响因素愈加多元(表2)。
表2 数据中心国家选择影响机制的负二项回归结果
Tab. 2
| 解释变量 | 回归系数 | ||
|---|---|---|---|
| 2005—2010 | 2011—2015 | 2016—2020 | |
| 市场规模 | 0.566*** (0.136) | 0.482*** (0.089) | 0.520*** (0.074) |
| 网络条件 | 0.311*** (0.108) | 0.194** (0.086) | 0.293*** (0.070) |
| 电力条件 | -0.003 (0.010) | -0.008 (0.005) | -0.025*** (0.006) |
| 人力条件 | 0.002 (0.003) | 0.010** (0.004) | 0.005* (0.003) |
| 交通条件 | 0.083* (0.045) | 0.082*** (0.028) | -0.049 (0.037) |
| 技术条件 | -0.068 (0.098) | 0.001 (0.055) | 0.212*** (0.045) |
| 气候条件 | -0.008 (0.014) | -0.007 (0.012) | -0.012 (0.010) |
| 安全水平 | 0.102 (0.264) | 0.098*** (0.026) | 0.713*** (0.164) |
| 样本量 | 52 | 67 | 71 |
| 伪对数似然值 | -150.9890 | -194.3495 | -159.1356 |
| 伪R2 | 0.1926 | 0.2312 | 0.3017 |
注:***:p < 0.01,**:p < 0.05,*:p < 0.1;括号内为z值。
市场规模方面,以互联网用户数衡量的市场规模对数据中心的国家选择始终表现出显著的正向作用,并且系数和显著性处于较高水平,表明数据中心具有强市场指向性,与其他服务业类似,数据中心运营商偏向于在具有广阔市场的国家(地区)布局数据中心[63],验证了H1假设。
要素供给方面,网络条件始终表现出显著的正向作用,其他各因素均表现出阶段性特征。其中电力条件仅在第三阶段表现为显著的负向影响,而在其他阶段不显著,交通条件在第三阶段表现为负向作用但未通过显著性检验,而在其他阶段表现为显著正向作用,表明数据中心的国家空间扩张过程中,受电力基础设施和交通基础设施的影响程度下降,可能的原因在于2016年以来全球数据中心在交通和电力基础设施相对较差的发展中国家中大幅扩张。随着数据中心的全球扩散,人力条件和技术条件逐渐显著,专业人才和先进技术对保障数据中心稳定运行的作用越来越重要[64]。部分验证了H2、H3假设。
运营环境方面,安全水平在第二、三阶段表现出显著的正向影响,表明出于对数据安全的考虑,数据中心更倾向于在政治稳定的国家(地区)进行布局,验证了H5假设。气候条件表现为负向影响,但未通过显著性检验,以平均气温表征的气候条件暂时不是影响数据中心国家选择的主要因素,与假设H4不符,可能的原因是,数据中心的国别选择大多需要综合市场规模为主的多种因素,与其他因素相比,以平均气温衡量的气候条件未能形成足够的吸引力。
4.2 城市选择的影响因素
数据中心城市选择受市场因素和生产要素因素影响显著,而受气候条件影响相对较弱(表3)。
表3 2016—2020年数据中心城市选择影响机制的负二项回归结果
Tab. 3
| 解释变量 | 回归系数 |
|---|---|
| 市场规模 | 0.088***(0.022) |
| 网络条件 | -0.006**(0.003) |
| 电力条件 | -2.332**(1.082) |
| 人力条件 | 0.006*(0.003) |
| 交通条件 | 0.001***(0.000) |
| 技术条件 | 0.064***(0.024) |
| 气候条件 | -0.011(0.011) |
| 安全水平 | 0.001*(0.005) |
| 样本量 | 322 |
| 伪对数似然值 | -533.4936 |
| 伪R2 | 0.1416 |
注:***:p < 0.01,**:p < 0.05,*:p < 0.1;括号内为z值。
市场规模对数据中心的城市选择具有显著正向促进效应,且系数与显著性水平最高,表明全球化水平高的城市对数据中心产生了强大的吸引力,数据中心更倾向布局于经济发展水平高、对外经济联系密切的城市,表现出明显的市场指向[65],验证了H1假设。
要素供给对数据中心的城市选择影响显著。人力条件、交通条件、技术条件对数据中心城市选择具有显著正向影响,表明数据中心运营商为了保障其高效运营,倾向于布局在人力和技术水平高、交通便捷的城市,验证了H2假设。以价格表征的网络条件和电力条件对数据中心城市选择表现出显著的负向作用,表明数据中心为降低运营成本,倾向于向网络和电力价格低的城市布局数据中心[66],验证了H3假设。尽管受数据限制原因土地条件未纳入到模型之中,但从电力价格和网络价格的影响方向来看,土地价格可能会对数据中心城市选择产生负向影响,即数据中心城市选择表现出明显的生产要素指向。
4.3 多尺度影响因素对比
通过对比2016—2020年数据中心国别及城市选择的影响因素,不同空间尺度上作用因素存在一定差别。在市场规模与人力条件、技术条件等要素供给以及运营环境方面,国家尺度和城市尺度因使用的指标具有相似性使得结果表现出较强的一致性,均表现为显著的正向作用。而由于指标选取所产生的测量方式差异,要素供给方面回归结果产生了一定的差别。① 网络条件方面表现出相反的结果,这是因为在国别尺度上使用国际带宽衡量网络条件,而在城市尺度上使用互联网宽带价格衡量。表明数据中心倾向于在网络基础设施条件良好,费用较低的地区布局,与假设H2与H3一致[41-42]。② 电力条件方面,国别尺度使用通电率衡量,回归结果显著为负,可能的原因是数据中心在全球后发国家中大规模布局。而在城市尺度使用工业电力平均价格衡量,结果显著为负,反映了数据中心倾向于选择电力成本较低的城市进行布局,与假设H3一致[42]。③ 交通条件方面,随着全球互联网的快速扩散及数字经济的迅猛发展,数据中心越来越多在后发国家布局;而具体到城市尺度,依旧是偏向集中布局于各国市场规模较大的城市,这些城市通常具有较为发达的交通系统,因此结果存在一定的差异[43]。
5 结论与讨论
5.1 结论
本文在梳理数据中心基本内涵与理论框架的基础上,基于全球数据中心数据,融合空间统计、空间分析和计量分析方法,探讨了数据中心在国家尺度和城市尺度空间扩张的演化特征,归纳了多尺度空间选择方式,定量分析了多尺度区位选择的影响因素。研究发现:
(1)全球尺度上,北美、西欧、东亚三大增长核心动力强劲,中国、美国、日本、英国等少数国家带动全球数据中心的增长,与此同时,伴随着全球数字经济的发展,印度、澳大利亚、巴西等国数据中心建设发展迅猛,成为区域增长的核心。经过多年的扩张演化,全球数据中心的空间分布由北美、西欧、东亚“三核心”格局成长为以东亚、北美、西欧为全球核心,印度、新加坡、澳大利亚、巴西等为区域中心的“三核心、多中心”空间格局,与全球互联网和数字经济发展水平的空间格局高度同配。
(2)城市尺度上,城市群、都市区是全球数据中心扩张的主要空间载体,围绕中国、美国、英国等国家的主要城市群与都会区,形成诸如北京、上海、多伦多、阿什本、伦敦等多个数据中心枢纽城市,与数字经济发展水平同样表现出高度的空间同配。随着数据中心在全球主要城市的布局建设,土地、电力等资源消耗问题逐渐受到重视,全球主要国家纷纷制定数据中心政策,数据中心出现向大城市周边城市扩张及向富能源低地租地区扩散的趋势。经过多年的扩张演化,数据中心的城市分布表现出明显的幂律分布特征,高度集中于上海、北京、阿什本等都市区、城市群核心城市及周边地区。
(3)全球数据中心在聚集力与分散力的共同作用下,在多尺度地域空间中的扩张遵循特定的演化规律,既表现路径依赖又存在路径创造,形成邻近扩张、点状生长和聚集增长等模式。不同空间扩张方式在多尺度空间上存在显著差异,全球尺度上,除非洲地区外的多数国家在2005年以来表现为聚集增长,而非洲地区因其互联网和数字经济发展水平相对较低,数据中心建设相对滞后,仍处于点状生长和接触扩张为主的阶段。城市尺度上,同样表现显著的路径依赖与路径创造。受市场、成本、政策等因素影响,数据中心在城市尺度上经历了由聚集到扩散的反复过程,即在发展阶段的初期在某些城市中聚集,随着市场饱和、成本上升、政策调整等,出现向周边邻近扩张或点状生长的空间选择方式,并形成循环反复过程。其中大城市周围中小城市更多表现为邻近扩张,而偏远的富能源低地租城市更多地表现为点状生长。
(4)全球数据中心空间扩张受市场规模、要素供给、运营环境等因素共同作用,并在多尺度空间中存在一定的差异。数据中心扩张国别选择影响因素的作用方向和显著性水平表现出阶段性特征,随着时间的推移,影响因素愈加多元。具体来看,市场规模、网络条件表现出显著的正向作用,人力条件、交通条件、技术条件和安全水平表现为阶段性的显著正向作用,气候条件因素表现不显著。城市尺度影响因素方面,市场规模、人力条件、交通条件、技术条件、安全水平表现出显著正向作用,以价格为表征的网络条件和电力条件表现显著的负向作用,气候条件因素表现同样不显著。综合国别与城市选择的影响因素,受测量方式差异影响,要素供给方面回归结果产生了一定的差别,但回归结果均表明,数据中心布局倾向于要素供给质量良好或要素成本相对低廉的区域。
5.2 讨论
本文对全球数据中心多尺度空间扩张演化规律进行了定量刻画,并检验了数据中心空间选择的影响因素。但受数据和篇幅所限,文章仍存在一定的不足:① 数据覆盖范围仍可扩展。本文数据使用多数据源整合而成,数据完整性有待进一步提升,可通过完善数据广度进而对全球数据中心进行更全面的刻画。② 空间扩张刻画仍需深入。文章仅从全球数据中心的整体扩张趋势进行探讨,对各国家、城市、企业的特殊性刻画仍可深入。③ 影响因素考虑尚不全面。受数据可靠性与可得性所限,在不同空间尺度上的测量方式存在差异,与此同时,未考虑区域政策、土地价格、市场竞争等因素及路径依赖等机制对数据中心空间扩张区位选择的影响。未来有待对不同规模和不同类型数据中心多空间尺度区位选择机制演化进行深入探讨。④ 值得注意的是,数据中心运营商在城市选择时,通常是在一国之内的城市间进行选择,可能会影响数据中心城市选择因素,未来需进行异质性分析。
致谢
感谢3位审稿专家针对本文理论框架、概念界定和方法论证等方面所提出的意见建议。
参考文献
ICT and global value chain embedding of manufacturing industry: Empirical test based on the quantity and quality of ICT development
信息通信技术与制造业全球价值链嵌入: 基于信息通信技术发展数量和质量的研究
Pandemic in the digital age: Analyzing WhatsApp communication behavior before, during, and after the COVID-19 lockdown
The strict restrictions introduced by the COVID-19 lockdowns, which started from March 2020, changed people’s daily lives and habits on many different levels. In this work, we investigate the impact of the lockdown on the communication behavior in the mobile instant messaging application WhatsApp. Our evaluations are based on a large dataset of 2577 private chat histories with 25,378,093 messages from 51,973 users. The analysis of the one-to-one and group conversations confirms that the lockdown severely altered the communication in WhatsApp chats compared to pre-pandemic time ranges. In particular, we observe short-term effects, which caused an increased message frequency in the first lockdown months and a shifted communication activity during the day in March and April 2020. Moreover, we also see long-term effects of the ongoing pandemic situation until February 2021, which indicate a change of communication behavior towards more regular messaging, as well as a persisting change in activity during the day. The results of our work show that even anonymized chat histories can tell us a lot about people’s behavior and especially behavioral changes during the COVID-19 pandemic and thus are of great relevance for behavioral researchers. Furthermore, looking at the pandemic from an Internet provider perspective, these insights can be used during the next pandemic, or if the current COVID-19 situation worsens, to adapt communication networks to the changed usage behavior early on and thus avoid network congestion.
The world's technological capacity to store, communicate, and compute information
DOI:10.1126/science.1200970
PMID:21310967
[本文引用: 1]

We estimated the world's technological capacity to store, communicate, and compute information, tracking 60 analog and digital technologies during the period from 1986 to 2007. In 2007, humankind was able to store 2.9 × 10(20) optimally compressed bytes, communicate almost 2 × 10(21) bytes, and carry out 6.4 × 10(18) instructions per second on general-purpose computers. General-purpose computing capacity grew at an annual rate of 58%. The world's capacity for bidirectional telecommunication grew at 28% per year, closely followed by the increase in globally stored information (23%). Humankind's capacity for unidirectional information diffusion through broadcasting channels has experienced comparatively modest annual growth (6%). Telecommunication has been dominated by digital technologies since 1990 (99.9% in digital format in 2007), and the majority of our technological memory has been in digital format since the early 2000s (94% digital in 2007).
The bandwidth bottleneck that is throttling the Internet
Basic framework and key technology for a new generation of data center in electric power corporation based on cloud computation
基于云计算的电力数据中心基础架构及其关键技术
Application and development of key technologies in data center infrastructure
数据中心基础设施关键技术应用及发展
Architecture of the data center network
DOI:10.3724/SP.J.1001.2013.04336 URL [本文引用: 1]
数据中心网络的体系结构
Formal models for safety and performance analysis of a data center system
Tracing the 'cloud': Emergent political geographies of global data centres
Cloud ruins: Ericsson's Vaudreuil-Dorion data centre and infrastructural abandonment
Building a digital bay area: Key issues and path construction for the construction of big data centers in the Guangdong-Hong Kong-Macao Greater Bay Area
打造数字湾区: 粤港澳大湾区大数据中心建设的关键问题与路径建构
Four reasons why data centers matter, five implications of their social spatial distribution, one graphic to visualize them
DOI:10.1177/0308518X211069139
URL
[本文引用: 1]
Data centers constitute a new kind of telecommunications infrastructure that demands attention for four reasons. Data centers are under-examined in the social sciences literature, urban studies, in particular. Data centers present an under explored geography of cyberworlds. Large digital corporations such as Amazon or Google are expanding their role in urban infrastructural development (such as data centers), and it is necessary to research and explain this phenomenon. Data centers present challenges of urban governance. The graphic provided here visualizes the social spatial distribution of data centers in the Washington Metropolitan Area. There are five implications of their social spatial distribution. Data centers are concentrated in metropolitan areas. Data centers have a high demand for energy and water, competing with local residents for these resources. The data center industry is a state-led niche economy. The uneven distribution of data centers can invoke inter-county competition for tax revenue, in addition to access to the water, power, and land resources that data centers require. The scale of the problem is unknown because the input needs of many data centers are not publicly available.
Geographies of infrastructure II: Concrete, cloud and layered (in)visibilities
DOI:10.1177/0309132520923098
URL
[本文引用: 1]
In this second progress report on infrastructure, I concentrate on the evolving infrastructures of our digital worlds, or ‘cloudfrastructures’. While there is an extensive literature in geography on the digital, less attention has been paid to its infrastructures. In this report I explore their relationships to other infrastructures, to nature, and to flow. I argue that paying attention to cloudfrastructures calls for new thinking on the axiom of (in)visibility in infrastructure studies, alerting us to (in)visibility as layered, multiple and orchestrated. Thinking of (in)visibility in this way also calls for an engagement with infrastructure beyond materiality.
The economic geography of the internet's infrastructure
An integrated approach to site selection for a big data center using PROMETHEE-MCGP methodology
Contentions of cyberspace resources in global geopolitical game
地缘博弈中的全球网络空间资源争夺
Discussion on the construction and operation mode of geospatial big data center in Shaanxi Province
陕西省地理空间大数据中心建设运行模式探讨
Disciplinary structure and development strategy of human geography in China
DOI:10.11821/dlxb202109003
[本文引用: 1]
Human geography is a discipline which studies the formation and evolution of the geographical distribution pattern of human activities. The main research objects of human geography focus on human activities and human-earth relationship. The scientific questions to be answered by human geography cover both natural science and social science, and thus it has distinctive interdisciplinary features. In China, the economic and social processes of human activities are playing an important role in explaining the law in human geography discipline as human society development is approaching or has entered the post-industrialization stage. The logics and methods of social science have become important tools through which the changes in processes and patterns of human geography can be reasonably discussed and properly understood. Research methodology of human geography shows integration characteristics between natural sciences and social sciences. The outcomes of human geography research reveal scientific laws in geographical distribution pattern and evolution of human activities. It becomes one of primary disciplines for both the national and local governments to manage and optimize the pattern of spatial development and protection. It has wide applications in spatial planning, regional strategy and policy making, and the modernization of spatial governance. The unique feature in integrating academic research and policy-making applications provides human geography discipline in China a superiority of leading the world in the discipline. Besides comprehensive human geography, human geography in China has five subdisciplines, namely, economic geography, urban geography, rural geography, social and cultural geography and political geography. Each subdiscipline has priority and key research fields, and coordinates with the rest of subdisciplines.
人文地理学学科体系与发展战略要点
DOI:10.11821/dlxb202109003
[本文引用: 1]
本文属于《中国学科及前沿领域发展战略研究(2021—2035)》地理科学学科规划的系列成果之一,写作组在对人文地理学学科发展进行系统梳理与分析判研的基础上,在本文中侧重介绍未来15年的中国人文地理学学科体系与发展战略要点。人文地理学是研究人类活动地理分布格局形成和演变规律的一门学科。随着人类发展临近和进入后工业化阶段,人类活动的经济社会过程对人文地理分布规律的影响越来越重要,社会科学研究思维和方法已成为探讨和理解变化的人文地理过程和格局的重要途径,人文地理学研究方法论也呈现出自然科学和社会科学综合集成的特色。人文地理学研究的成果产出,揭示了人类活动地理分布格局和演变的科学规律,成为调控和优化国土空间开发保护格局的科学基础,在国土空间规划、区域战略和区域政策制定、空间治理现代化等方面有着广泛的应用,人文地理学的科学研究与决策应用之间具有紧密的关系。根据学科发展现状、趋势及主要产出结果,中国人文地理学可按照5个分支学科群进行学科战略布局,包括综合人文地理学、经济地理学、城市地理学、乡村地理学、社会文化地理学和政治地理学。各分支学科在新时期地理科学学科体系下,具有其优先发展领域与重点方向,相互协调,不断创新。
Spatial evolution and determinants of transnational technology transfer network in China
DOI:10.11821/dlxb202202005
[本文引用: 2]
Patent transfer is an important channel for countries and regions to obtain technology from abroad, and it is also the most direct way to portray the relationship between supply and demand of technology flow. Based on the glocalisation perspective, this paper constructs a framework of technology transfer characterized by the transnational-domestic dual-channel theory. Combining social networks, GIS spatial analysis and spatial measurement models, it attempts to describe the spatial evolution and determining factors of transnational technological channels in Chinese cities. The research found that: (1) The spatial heterogeneity of China's transnational technology channel network is significant but gradually has weakened over time. (2) The transnational technology channel accelerates eastward movement, expanding from the technologically developed regions of North America and Western Europe (the New York Bay Area and Silicon Valley, the Caribbean offshore financial center, the London offshore financial center, etc.) to East Asia and Southeast Asia (Japan, South Korea and Singapore), China's technological dependence on the United States and Western Europe has been greatly reduced. (3) The Beijing-Tianjin-Hebei urban agglomeration, the Yangtze River Delta urban agglomeration, the Guangdong-Hong Kong-Macao Greater Bay Area and the northern Taiwan urban agglomeration with Beijing, Shanghai, Shenzhen-Guangzhou, Taipei-Hsinchu as the cores have become global technological innovation centres and hubs for transnational technology transfer flows. With the help of connections between headquarters and branch of multinational companies, offshore financial convenience and low tax advantages, Hong Kong mainly plays the role of technology intermediary and has become the city with the most technology transfer, while the core role of Taiwan Province is declining. (4) Intercity technology pipelines have a positive effect on transnational technology transfer pipelines. Enlarging the scale and flow of technology pipelines between cities and the distance between cities is conducive to expanding transnational technology introduction pipelines, while the intermediary of cities has no significant impact. In addition, the economic strength of a city has a positive influence on the promotion of transnational technology transfer pipelines, while technological strength and foreign economic relations have multiple effects.
中国跨国城际技术通道的空间演化及其影响因素
DOI:10.11821/dlxb202202005
[本文引用: 2]
专利转移是国家和地区获取外部技术的重要通道,也是刻画技术流供求关系最直接的方式。基于全球—地方视角,本文建构了技术转移的跨国—国内城际双通道理论框架,融合社会网络、GIS空间分析和空间计量模型,尝试刻画中国城市跨国城际技术通道的空间演化规律及其影响因素。研究发现:① 中国跨国城际技术通道网络的空间异质性显著但随时间逐渐减弱。② 跨国城际技术通道加速东移,从北美和西欧(以美国纽约湾区和硅谷地区技术创新中心、加勒比海离岸金融中心、伦敦全球金融中心等为核心)快速向东亚(以日本东京、韩国首尔科技创新中心为核心)和东南亚(以新加坡科技创新中心为核心)扩展,中国对美国和西欧的专利技术依赖性明显减弱。③ 以北京、上海、深圳—中国香港、台北—新竹为核心的京津冀、长三角、粤港澳大湾区和中国台湾北部四大创新集群成为中国跨国城际技术流的集散地和全球性技术创新枢纽。中国香港凭借跨国公司及分支机构云集及离岸金融低税收优势,技术中介作用不断增强并成为技术转移的首位城市,而中国台湾的核心作用不断减弱。④ 国内通道的规模、强度以及城际紧密度有利于跨国城际技术引进通道的扩展;此外,地方经济实力对跨国联系通道具有正向促进作用,其技术实力和对外经济联系程度则具有多方面的影响。
Spatio-temporal dynamics of international freshwater conflict events and relations from 1948 to 2018
DOI:10.11821/dlxb202107016
[本文引用: 1]
With global climate change and the rapid development of human society and economy, the contradiction between water supply and demand has become increasingly prominent in recent years, and the freshwater conflicts in international river basins have intensified, which has aroused widespread concern in academia. Here we analyzed the spatio-temporal dynamics of global freshwater conflicts (GFCs) over the last 70 years from the "event-relations" perspective, and establish a spatio-temporal database of GFCs from 1948 to 2018 based on data mining method and spatial analysis. The results show that: (1) The evolution of GFCs is a non-monotonic dynamic process with multi-dimensional characteristics of trend, mutation and volatility. The GFCs showed a general trend of fluctuating growth, with an obvious sudden change around 1987. (2) The GFCs are mainly composed of low-intensity conflicts, and the hydrological intervention and contention for resource ownership are the focus of conflicts. The number of conflicts caused by the construction of dams and other water conservancy projects increases significantly. South Asia, West Asia and East Africa are the leading forces driving the evolution of GFCs. (3) The pattern of GFCs has changed from single-center to multi-center, and there is a clear trend of spatial spread. However, the overall distribution pattern with more conflicts in the northern and eastern hemispheres and the pattern with less conflicts in the southern and western hemispheres is relatively stable. Along 30-degree north latitude, a dense zone of freshwater conflicts covering high water stress basins in South Asia, Central Asia, West Asia, and East Africa has formed. (4) International freshwater conflict has gradually become more ubiquitous, complicated and networked, and the basin communities of freshwater conflict network have increased significantly. But the "Matthew effect" of freshwater conflicts among countries are obvious, and its polarized distribution pattern is relatively stable. A "path-locking" effect has been formed among the major conflictive countries. There is a certain spatial mismatch between the quantity relationship and intensity relationship of GFCs.
1948—2018年国际河流跨境水冲突的时空演化规律
DOI:10.11821/dlxb202107016
[本文引用: 1]
随着全球气候变化和人类社会经济高速发展,水资源供需矛盾日益突出,国际河流流域跨境水冲突不断加剧,其时空演化规律成为当前跨学科研究的热点和难点。为此,从水冲突“事件—关系”视角,对1948—2018年间全球跨境水冲突的时空演化规律进行系统分析发现:① 1948—2018年全球跨境水冲突规模总体呈非单调波动增长态势,在1987年前后发生显著突变,表现出兼具趋势性、突变性和波动性等多维特征的非单调动力过程;② 全球跨境水冲突事件以围绕水文干预和资源权属争夺的低强度事件为主,大坝等水利工程建设引发的冲突显著增加,南亚、西亚和东非地区成为主导全球跨境水冲突趋势演化的“序参量”;③ 全球跨境水冲突呈现由单中心向多中心格局转变的空间扩散趋势,但“北多南少、东多西少、相对集中”的总体不均衡格局基本锁定,形成以30°N为中心、横跨南亚—中亚—西亚—东非高水资源压力区的水冲突密集带;④ 国家间跨境水冲突关系趋于普遍化、复杂化和网络化,发育多个流域性网络社团,但水冲突关系的“马太效应”和极化分布特征持续显著,产生“路径锁定”效应;水冲突“规模—强度”关系存在一定的空间错配。
China's changing population distribution and influencing factors: Insights from the 2020 census data
DOI:10.11821/dlxb202202008
[本文引用: 1]
Using data of the latest three decennial censuses, this paper systematically analyzes the overall spatial pattern, changing trends, and influence mechanisms of China's population distribution since 2000. The study reveals that the general population distribution pattern of "dense east and sparse west" in China has not changed, which is determined by the differences in natural geographic environments on the two sides of Hu Line. In the first decade of the century, population concentration was mainly found in the southeastern area, but it has been observed in all regions in the recent decade. Provincial capitals have become the winners of population competition and the advantages of population growth of provincial capitals have been further strengthened in the recent decade compared with 2000-2010. However, the administrative power-led effects of the increasing dominance of provincial capitals will gradually weaken with the development of their provinces. The regional differentiation of population changes is also apparent: coastal region gradually forms a dense belt of population and towns with solid population attraction based on the development of urban agglomerations; the northeast region almost turns to a complete population shrinking status; central provinces still compete fiercely for population based on their capitals; the population of Sichuan, Chongqing, and Guizhou has stopped the decline and returned to growth; and the northwest region faces the risk of population loss. In addition, this paper finds that the driving factors of regional population growth have gradually changed from economic factors to both economic and amenity factors, and the difference of amenities among regions may become an important factor for future changes in China's population geography.
2000—2020年中国人口分布格局演变及影响因素
DOI:10.11821/dlxb202202008
[本文引用: 1]
基于第五、六、七次全国人口普查数据,本文分析了2000—2020年中国人口分布的空间格局、集散态势和影响因素。结果表明,中国人口分布依然保持东密西疏的基本格局,胡焕庸线两侧的自然地理环境差异性决定了这一格局的长期稳定性;人口空间集中化趋势在21世纪初的10年内主要发生在东南半壁,但在2010—2020年间成为各区域的共同特征。省会城市的人口集聚能力持续增强,2010—2020年的优势更加凸显,但这种行政力量主导的首位度提升效应将随着全省发展阶段的演进而逐渐弱化。人口变动的区域分化明显:沿海城市群的空间连绵化逐渐形成了强吸引力、高承载力的沿海人口增长带,东北地区几乎转向全面的人口收缩,中部各省依托省会展开的人口竞争依然激烈,川渝黔地区普遍实现了人口的止降回增,西北地区则面临人口收缩风险。此外,区域人口增长的驱动因素逐渐从经济要素主导转为经济要素和舒适性要素并重,各地区舒适性的差异可能将成为影响未来人口空间格局变化的重要因素。
Evolution and influencing factors of China's foreign trade in rare earth metals
DOI:10.11821/dlxb202204014
[本文引用: 1]
Since the Sino-U.S. trade friction to the "cold war of science and technology", rare earth, the "lifeline of high technology", has increasingly become the key point of the international games. Under the circumstances, it is of great significance to clarify the trend of China's rare earth trade and its role in the international rare earth market, to generally optimize China's resource security pattern and maintain the independence of science and technology in the long term. This paper uses the data from 2008 to 2018, including China's rare earth import and export trade data, the relevant national social, economic and political indicators, and the UN voting data. Then it discusses the spatial pattern evolution, interdependence evolution and main influence mechanism of China's rare earth products foreign trade, with the help of interdependence index, geographical affinity, GIS space technology and negative binomial panel regression. The results show that: (1) China's rare earth trade fluctuates greatly, and the export volume is much larger than the import volume, showing an "up-down-up" trend as a whole. (2) China's import market is highly concentrated and the path-dependence effect is enhanced, while the export market is gradually diversified and the path dependence is weakened. China mainly exports middle stream and downstream products with high added value and imports upstream mineral products with low added value. (3) China has strengthened its dominant position in the global rare earth trade interdependence pattern. The interdependence relationship between China and its most friendly countries has been strengthened, while that between China and the United States, Canada, Australia and other differentiated countries has been weakened. (4) The characteristics of countries, subject attribute proximity between countries and China's trade policy and trade environment have an important impact on China's rare earth import and export trade.
中国稀土对外贸易格局演化及影响因素
DOI:10.11821/dlxb202204014
[本文引用: 1]
从中美贸易摩擦到“科技冷战”以来,被誉为“高科技命脉”的稀土,日益成为国际博弈的前沿领域。在此背景下,厘清中国稀土进出口贸易流动态势、把握中国在国际稀土市场中的地位变动,对中国资源安全格局的整体优化和科技自立自强的长久维持具有一定意义。本文基于2008—2018年中国稀土进出口贸易数据、相关国家社会经济政治指标及联合国投票数据,借助相互依存指数、地缘亲和度模型、GIS空间技术以及负二项面板回归等手段,探讨了中国稀土产品对外贸易格局的演化及影响因素。研究发现:① 中国稀土贸易存在较大波动,出口额远大于进口额,整体呈现“升—降—升”发展态势。② 中国稀土进口市场高度集中且路径依赖增强,出口市场逐步多元且路径依赖减弱。中国主要出口具有较高附加值的中、下游产品,进口具有较低附加值的上游矿物类产品。③ 中国在全球稀土贸易相互依存格局中的优势地位整体强化。中国与多数友好型国家间的相互依存关系呈现优化态势,但与美国、加拿大、澳大利亚等分歧型国家之间的相互依存关系呈现恶化态势。④ 国家主体属性、国家间邻近性以及中国的贸易政策、贸易环境等对中国稀土对外贸易产生重要影响。
Effect of MAUP in spatial autocorrelation
DOI:10.11821/xb201112002
[本文引用: 1]
This research investigated the role of modifiable area unit problem (MAUP) in the spatial autocorrelation on data of per capita GDP of China and grid simulated data. The global Moran's I coefficient was used to explore the MAUP effect of spatial autocorrelation statistics. The results showed that the degree of spatial autocorrelation of variables depends on the size of spatial particles and zone designing methods. However, there is no determined function relationship between the change of spatial units and the autocorrelation. So, how to choose the appropriate size of geographical unit particles and zone designing are very important in the research of spatial autocorrelation. Finally, the study presented an approach based on geostatistical interpolation to decrease MAUP effect in spatial autocorrelation analysis.
空间自相关的可塑性面积单元问题效应
On scale characteristics of geographic information
论地理信息的尺度特性
A comparison study on residential differentiation at multiple spatial and temporal scales in Nanjing and Hangzhou
DOI:10.11821/dlxb202110009
[本文引用: 2]
Residential differentiation is a timeless and classic research topic in the field of urban geography and urban sociology. Urban residential differentiation contains dual socio-spatial attributes of social group differentiation and residential differentiation. Existing studies rely largely on population statistics and social survey data, from the perspective of differentiated social groups to effectively reflect, verify and analyze data from a single city. This empirical analysis is unable to effectively reflect the increasing complexity, heterogenous and fragmented situation of residential differentiation in large cities. There have been fewer comparative studies between similar cities. This paper, in the perspective of residential space, uses housing price as an indicator, and adopts methods such as multi-group segregation index, multi-group spatial segregation index and geographic detector. In particular, Nanjing and Hangzhou from 2009-2018 are taken as cases and census track, block and grid as basic units to carry out a quantitative study on residential differentiation and comparison in Nanjing and Hangzhou at multiple spatial and temporal scales. Through analysis of the above data, the following is observed: (1) Urban residential differentiation, characterized by residential difference, is more time-sensitive and accurate, and spatial segregation index is a correction to the traditional non-spatial segregation index. (2) The high and low-priced housing spatial segregation index in Nanjing is significantly higher than that in Hangzhou, of which spatial structure is a significant factor. (3) The influencing factors and combined features of residential differentiation in Nanjing and Hangzhou show certain similarities, of which "central location" and "education package" have the strongest explanatory power. As an innovative exploration, this paper attempts to provide new perspectives, methods and ideas for studies on urban residential differentiation, hoping to enrich the research on Chinese urban social geography in the new era.
宁杭城市多时空尺度居住空间分异与比较
DOI:10.11821/dlxb202110009
[本文引用: 2]
城市居住分异具有社会群体与住宅空间的社会—空间双重属性,已有研究多关注社会经济属性,采用非空间分异指数开展单个城市和较大尺度的实证分析,较难有效反映中国当前城市内部日趋复杂多变、异质破碎的居住分异景观。基于住宅空间视角,采用多群体分异指数、空间分异曲线、指数分解模型与地理探测器等方法,以南京、杭州为案例城市,从街道、街区与网格3个尺度,分析宁杭2009—2018年居住空间分异及其影响因素。研究表明:空间分异指数因考虑到住宅空间位置和邻域环境,可作为对非空间分异指数的一种改进;南京不同住宅类型空间分异程度高于杭州,主要是由城市空间结构差异造成的;居住空间分异是城市社会空间资源非均衡配置的结果,其中“中心位势”和“教育配套”等因素对城市居住空间分异的影响最为显著;宁杭城市居住空间分异的共性与特性并存,揭示出城市比较研究的可行性与必要性。通过创新性探索,为中国城市居住分异研究提供新视角、新方法和新思维。
The changing geography of data centres in the UK
DOI:10.1080/00167487.2013.12094361 URL [本文引用: 1]
Big data center under the context of 'New Infrastructure': Significance, difficulties and approaches
基于“新基建”情境的大数据中心: 意义、困境和进路
The influence of COVID-19 epidemic on China's economic growth
新冠肺炎疫情对中国经济增长的影响
Impact factors of location choice and spatial pattern evolution of wholesale enterprises in Beijing
DOI:10.11821/dlxb201802002
[本文引用: 1]
Since the reform and opening up, Chinese cities have experienced a period of rapid transformation and reconstruction against the background of economic globalization. Industrial development is one of the main driving forces of urban spatial expansion; therefore, urban spatial reconstruction in China is first reflected in the reconstruction of industrial space during the transition period. Alongside rapid urbanization, urban industrial construction has gradually shifted from the secondary industry to the tertiary industry, which has an increasing impact on residents' production and living. Thus, paying attention to the spatial distribution of the service industry and its location selection factors has become an important way to explore urban spatial reconstruction. The wholesale industry is an important part of a city's service industry, which has an important influence on commercial production, circulation and consumption. Because wholesale enterprises involve a great number of employees, and its spatial distribution pattern caused traffic congestion, environmental pollution and a series of urban problems, the location of wholesale enterprises has become a hot topic amongst scholars. This paper uses Beijing as a typical example, takes wholesale enterprises as the research object, and analyzes the spatial pattern evolution and agglomeration characteristics of wholesale enterprises in Beijing using kernel density estimation and Ripley's K(d) function. It then explores the influencing factors of the wholesale enterprise location selection by means of Conditional Logit model. The results show that: (1) In the perspective of spatial distribution, wholesale enterprises are mainly concentrated within the Fifth Ring Road, and present obvious spatial agglomeration characteristics; the scale of agglomeration is mainly concentrated in a range of 0-28 km. (2) Seen from the spatial agglomeration strength, the agglomeration peak distance is constantly expanding, the concentration decreased within the Second Ring Road, and three core groupings are formed in a peripheral area. (3) Local economy, city economy, land price, labor cost, infrastructure and spatial distance have a significant influence on the location choice of wholesale enterprises, and land price and agglomeration is the most prominent of all. (4) According to different types of enterprises, foreign enterprises have a great demand for better traffic conditions and innovation environment, but the impact of commercial benchmark land price on the location choice is not significant.
北京批发企业空间格局演化与区位选择因素
DOI:10.11821/dlxb201802002
[本文引用: 1]
随着服务业对居民生产、生活影响程度逐渐增强,其企业区位选择已成为从微观视角解析城市空间结构的重要途径。以北京为典型案例地,将批发企业作为研究对象,运用核密度估计方法、Ripley's K(d)函数以及条件Logit模型,分析了北京批发企业空间格局演变规律与集聚特征,在此基础上探究了批发企业区位选择的影响因素。结果表明:① 从空间分布特征来看,批发企业主要集中在北京五环以内,且呈现明显的空间集聚特征,集聚规模主要集中在0~28 km范围内;② 从空间集聚强度看,集聚峰值出现的距离不断向外扩张,二环内集聚强度有所下降,并在外围形成了3个核心集聚区;③ 地方化经济、城市化经济、土地价格、集聚效益、劳动力成本等因素对批发企业区位选择具有显著影响,其中土地价格和集聚效益的影响最大,新企业在区位选择中都存在明显的集聚效益;④ 从不同类型批发企业来看,外资批发企业通过检验的影响因素较少,受已有该企业空间分布的影响显著且对交通区位条件、创新环境要求更高,但商业基准地价在外资企业区位选择中影响不显著。
Locations and their determinants of large-scale commercial sites in Changchun, China
DOI:10.11821/dlxb201506004
[本文引用: 1]
Retail formats refer to the forms and patterns of managing commercial enterprises that differ in their market orientations and locations. The outcomes of the location choices of different forms of business enterprises determine their specific commercial structures. In recent years, spatial distribution and location decisions relating to emerging formats such as chain supermarkets have emerged as a new research area in China. This study aims to reveal differences in the spatial distribution characteristics of different retail formats and the factors influencing their location choices in Changchun, China. Based on 2013 survey data for large-scale commercial sites in the central district of Changchun, the study focuses on six types of retail formats: specialty stores, exclusive shops, department stores, supermarkets, warehouses, and markets. Point pattern analysis and ordinal logistic regression analysis were performed to explore the locational features and determinants of large-scale commercial sites in Changchun. The findings of this study suggest that the spatial distribution of large-scale commercial sites in Changchun entails coexistence of concentration in the core area and diffusion in the peripheral area. This agglomeration feature was clearly apparent in the city center and business centers. Moreover, the spatial distribution of commercial activities and spatial agglomeration features varied considerably according to regional scalar differences. The primary determinants of the spatial distribution of commercial sites were: type of commercial activity, land price, transport accessibility, and agglomeration. Population density and business environment factors did influence the location choice of retail outlets to some extent, but this influence was not significant. Each of these determinants was found to have its own effects on the spatial distribution of different kinds of commercial sites. Thus, specialty and department stores were usually aggregated in small regions, demonstrating lower performance levels that were dependent on population density, transport accessibility, and the business environment. Exclusive shops and markets, affected by land prices and transportation accessibility, showed higher levels of agglomeration at a larger regional scale, especially markets. The weak dependence of supermarkets on these determinants and their characteristically discrete distribution indicate that their spatial layouts were the result of competition and the city’s market environment. Warehouses were only aggregated in small-scale areas at the border of the city because of land prices, industrial characteristics, and transport accessibility.
长春市大型商业网点的区位特征及其影响因素
DOI:10.11821/dlxb201506004
[本文引用: 1]
以长春市中心城区大型商业网点调研数据为基础,选取专业店、专卖店、大型商场、大型超市、家居建材商店、综合交易市场六种商业业态类型,运用点模式分析、有序多分类逻辑回归等研究方法,探讨长春市大型商业网点的区位特征,并解释其区位选择的影响因素。研究发现:长春市大型商业网点的空间分布总体呈中心集聚与外围分散并存的态势,但集聚现象更显著,并表现出沿城市综合性中心地、商业中心布局的特征;各业态类型网点空间分布差异性较大,且具有不同尺度的空间集聚表现,专业店、大型商场以小尺度范围的空间集聚为主,集聚程度较低;专卖店和综合交易市场的集聚程度相对较高,且后者区位选择的空间尺度范围较大;大型超市在空间上呈均匀离散分布,家居建材商店仅在小尺度范围内表现出集聚分布;业态类型、土地价格、交通通达性及集聚特征是影响商业网点分布最显著的因素,同类因素对不同业态商业网点分布的影响程度差异性较大。
Spatial distribution of digital economic growth dynamics and regional income
DOI:10.11821/dlxb202108005
[本文引用: 1]
To explore the dynamic digital economy growth, regional differences, and the spatial distribution of regional income, this study takes Zhejiang Province, China's digital economy innovation highland, as a research sample, constructs the index system of dynamic factors of digital economic growth, and proposes the concept of a Digital Economy Growth Driving Index (DEGDI). Using the Weaver-Thomas model, grey correlation analysis, and GIS hierarchical coloring method, the paper analyzes the dominant driving force of digital economic growth in Zhejiang at the city level and verifies its relevance with regional income. The research results show that: (1) The dynamic characteristics of digital economic growth in this province fluctuates in a small range. (2) From the spatial pattern, the digital economic growth presents a "double core" phenomenon, in which Hangzhou and Ningbo are the cores. The industry-supply leading type is mainly distributed in the southwest of Zhejiang; the market-demand-driven, information-application-driven, and innovation-driven types are mainly found in the northwest part of the province. (3) There is a strong correlation between the DEGDI and regional income. The higher the DEGI, the higher the regional income, and vice versa. The change of the leading dynamics structure of the digital economy is forming a complex and diverse regional economic growth behavior mode.
数字经济增长动力与区域收入的空间分布规律
DOI:10.11821/dlxb202108005
[本文引用: 1]
为探究数字经济增长的动力构成、地域差异以及与区域收入之间的空间分布规律,本文以中国数字经济创新高地浙江省为样本,构建了数字经济增长动力要素指标体系,并首先提出了数字经济“增长动力指数”构想。借助Weaver-Thomas模型、灰色关联分析以及GIS分层设色法,从地级市层面对浙江省数字经济增长的主导动力构成进行空间可视化分析,并验证了其与区域收入的关联性。结果表明:① 浙江省数字经济增长动力类型特征呈弱波动状态。② 从整体空间格局来看,数字经济增长呈现以杭州和宁波为核心的“双核心”空间格局现象,产业供给动力主导型主要分布在浙西南地区;市场需求动力主导型、信息应用动力主导型及创新驱动动力主导型主要分布在浙西北地区。③ 数字经济“增长动力指数”与区域收入之间存在较强的关联性,较高的数字经济增长动力指数对应的地区收入也处于较高水平,反之亦然。数字经济主导动力结构的变化正在形成一种复杂多样的区域经济增长行为模式。
Achievements in and strategies for the construction of Shanghai stock trading system: A perspective of building an international financial center
上海证券交易系统的建设进展及对策研究: 基于上海建设国际金融中心的战略视角
Leveraging renewable energy in cloud computing datacenters: State of the art and future research
DOI:10.3724/SP.J.1016.2013.00582 URL [本文引用: 2]
云计算数据中心的新能源应用: 研究现状与趋势
Data center growth in the United States: Decoupling the demand for services from electricity use
Multicriteria decision analysis for sustainable data centers location
DOI:10.1111/j.1475-3995.2012.00874.x URL [本文引用: 2]
Trends in data centre energy consumption under the European code of conduct for data centre energy efficiency
Sustainable location selection of data centers: Developing a multi-criteria set-covering decision-making methodology
Spatial impact of airport facilities' NIMBY effect on residential prices: A case study of Beijing Capital International Airport
DOI:10.11821/dlyj020210092
[本文引用: 1]
In the process of urban development, the contradiction between the construction and operation of large-scale public infrastructure and the optimization and improvement of residential space quality has become increasingly prominent. With the continuous urban renewal, it has become the top priority of urban planning and construction to realize the win-win goal of efficient and rational use of planned land and livable and harmonious life of the people. The Beijing Capital International Airport has negative effects on surrounding residents due to its electromagnetic radiation, noise and solid pollution. As a result, it has been subject to constant complaints from residents and long-term petitions for decision. Due to the obvious negative externalities of airport facilities, its NIMBY (Not In My Backyard) has an impact on the prices of surrounding houses. This research uses the Hedonic Price Model (HPM) to analyze the impact of "distance from NIMBY facilities "on the housing price of Beijing Capital International Airport, characterizes the measurement of the spatial effects of NIMBY facilities under the influence of different factors, and analyzes the range of influence on residential prices of Beijing Capital International Airport radius. The main research conclusions are as follows: (1) The capital airport facilities have a negative impact on the price of surrounding houses. Within a certain range, for every 1% decrease in the distance to airport facilities, the price of residential houses will decrease by 0.586% on average. The influence of different factors is also different. Among them, the noise level also has a greater influence on the price of housing, with an influence coefficient of 2.145. The distance between the residence and the subway station and bus station also has a greater impact on its own price. (2) The spatial impact of airport facilities on residential prices is 10 km, and its spatial effects show a weakening trend as the "distance from the airport risk source" increases. In addition, there are 149 communities within the affected area, 83.2% of which are located in Shunyi District, and the number of affected households is approximately 130,000. (3) The spatial influence of airport facilities on NIMBY effect has different directions. The areas located to the west and south of the airport have an overall greater impact on surrounding residential prices than the areas located to the north and east of the airport.
机场设施邻避效应对北京市住宅价格空间影响研究: 以北京首都国际机场为例
DOI:10.11821/dlyj020210092
[本文引用: 1]
城市发展过程中,大型公共基础设施的建设运营与居民居住空间品质的优化提升之间的矛盾日益突出。随着城市更新的不断深入,实现规划用地高效合理利用与人民生活宜居和谐的双赢目标成为城市规划建设的重中之重。由于机场设施存在较为明显的负向外部性,其邻避效应对周围住宅价格产生影响。本研究对首都国际机场运用特征价格模型分析“同邻避设施的距离”对住宅价格的影响,表征了在不同要素影响下邻避设施空间效应的量度,同时分析得出其对住宅价格的影响范围半径。主要研究结论如下:① 首都机场设施对周边住宅价格存在负面影响。在一定范围内,到机场设施的距离每减少1%,住宅价格平均降低0.586%。不同要素的影响力也存在差异。② 机场设施对住宅价格的空间影响范围为10 km,其空间效应随“同机场风险源距离”的增加而表现出减弱的趋势。此外,影响范围内的小区有149个,83.2%的小区分布在顺义区,受影响的户数约为13万。③ 机场设施的邻避效应空间影响存在方向异性,位于机场西部和南部的区域对周边住宅价格的影响范围整体大于位于机场北部和东部的区域。
The relationship between self-organization and hetero-organization and its enlightenment to management
自组织与他组织的关系及其对管理学的启示
Spatial and temporal patterns and factors influencing the spread of the COVID-19 pandemic in China
DOI:10.11821/dlxb202202012
[本文引用: 1]
It is essential to unravel the spatial and temporal patterns of the spread of the epidemic in China during the backdrop of the global coronavirus disease 2019 (COVID-19) outbreak in 2020, as the underlying drivers are crucial for scientific formulation of epidemy-preventing strategies. A discriminant model for the spatio-temporal pattern of epidemic spread was developed for 317 prefecture-level cities using accumulated data on confirmed cases. The model was introduced for the real-time evolution of the outbreak starting from the rapid spread of COVID-19 on January 24, 2020, until the control on March 18, 2020. The model was used to analyze the basic characteristics of the spatio-temporal patterns of the epidemic spread by combining parameters such as peak position, full width at half maximum, kurtosis, and skewness. A multivariate logistic regression model was developed to unravel the key drivers of the spatio-temporal patterns based on traffic accessibility, urban connectivity, and population flow. The results of the study are as follows. (1) The straight-line distance of 588 km from Wuhan was used as the effective boundary to identify the four spatial patterns of epidemic spread, and 13 types of spatio-temporal patterns were obtained by combining the time-course categories of the same spatial pattern. (2) The spread of the epidemic was relatively severe in the leapfrogging model. Besides the short-distance leapfrogging model, significant differences emerged in the spatial patterns of the time course of epidemic spread. The peaks of the new confirmed cases in various spatio-temporal patterns were mostly observed on February 3, 2020. The average full widths at the half maximum of all ordinary cities were approximately 14 days, thus, resonating with the incubation period of the COVID-19 virus. (3) The degree of the population correlation with Wuhan city has mainly influenced the spreading and the short-distance leapfrogging spatial patterns. The existence of direct flight from Wuhan city exhibited a positive effect on the long-distance leapfrogging spatial pattern. The number of population outflows has significantly affected the leapfrogging spatial pattern. The integrated spatial pattern was influenced by both primary and secondary epidemic outbreak sites. Thus, cities should pay great attention to traffic control during the epidemic as analysis has shown that the spatio-temporal patterns of epidemic spread in the respective cities can curb the spread of the epidemic from key links.
中国COVID-19疫情扩散的时空模式及影响因素
DOI:10.11821/dlxb202202012
[本文引用: 1]
在2020年全球暴发新型冠状病毒肺炎(COVID-19)疫情的背景下,揭示中国疫情扩散时空模式及影响因素对于科学制定防疫策略具有重要作用。针对2020年1月24日—3月18日期间中国COVID-19疫情从快速扩散到逐步控制的完整过程,基于累计确诊病例数据,以317个地级市为对象,建立疫情扩散时空模式判别模型,结合峰位置、半峰间距、峰度、偏度等参数,解析时空模式的基本特征;基于交通可达性、城市关联程度和人口流动构建多元Logistic回归模型,揭示时空模式的关键影响因素。结果显示:① 距武汉市直线距离588 km为判别疫情扩散4种空间模式的有效边界,综合同一空间模式下的时间过程类别,得到13类疫情扩散时空模式。② 蛙跳型的疫情扩散相对严重;除近距离蛙跳型以外,其余空间模式的疫情扩散时间过程差异明显;各种时空模式的新增确诊病例峰值大多为2020年2月3日;所有普通类城市的平均半峰间距约为14 d,与COVID-19病毒的潜伏期一致。③ 与武汉市的人口关联度主要影响蔓延型和近距离蛙跳型空间模式,与武汉市的通航状况对远距离蛙跳型空间模式具有正向影响,迁出人口数量对蛙跳型空间模式有显著作用,综合型空间模式受初级和次级疫情暴发地的双重影响。不同城市应根据自身的疫情扩散时空模式,在疫情期间高度重视交通管控,从关键环节遏制疫情扩散。
Structural heterogeneity and proximity mechanism of global scientific collaboration network based on co-authored papers
DOI:10.11821/dlxb201704014
[本文引用: 1]
Despite increasing importance of academic papers in global knowledge flows, the structural disparities and proximity mechanism related to international scientific collaboration network attracted little attention. To fill this gap, based on data mining from Thomson Reuters' Web of Science database in 2014, its heterogeneities in topology and space were portrayed using visualizing tools such as Pajek, Gephi, VOSviewer, and ArcGIS. Topologically, 211 countries and 9928 ties are involved in global scientific collaboration network, but the international network of co-authored relations is mono-centricand dominated by the United States. It exhibits some features of a "small-world" network with the smaller average path length of 1.56 and the extremely large cluster coefficient of 0.73 compared to its counterpart, as well as the better-fitting exponential distribution accumulative nodal degree. In addition, the entire network presents a core-periphery structure with hierarchies, which is composed of 13 core countries and the periphery of 198 countries. Spatially, densely-tied and high-output areas are mainly distributed in four regions: West Europe, North America, East Asia and Australia. Moreover, the spatial heterogeneity is also observed in the distributions of three centralities. Amongst these, the countries with greater strength centrality are mainly concentrated in North America (i.e. the US and Canada), Western Europe (i.e. the UK, France, Germany, Italy and Spain), and China, noticeably in the US, which forms the polarizing pattern with one superpower of the US and great powers such as China and the UK. Similarly, the big three regions consisting of West Europe, North America and Asian-Pacific region have the peak betweenness centrality as well. Slightly different from the two above, the distribution of nodal degree centrality is uneven in the world, although regional agglomeration of high-degree countries is still observed. Last but not least, the proximity factors of its structural inequalities were also verified by correlational analysis, negative binomial regression approach and gravity model of STATA. The findings further confirm that geographical distance has weakened cross-country scientific collaboration. Meanwhile, socio-economic proximity has a positive impact on cross-country scientific collaboration, while language proximity plays a negative role.
全球科研论文合作网络的结构异质性及其邻近性机理
DOI:10.11821/dlxb201704014
[本文引用: 1]
以科研论文为媒介的知识合作网络已成为知识溢出的重要通道,但目前学术界对全球科研合作网络结构的复杂性涌现机制缺乏深入的探讨。基于2014年Web of Science核心合集所收录的科研论文合著数据,借助大数据挖掘技术、复杂网络、空间统计和重力模型分析,刻画了全球科研论文合作网络的拓扑结构、空间格局及其邻近性机理。结果发现:① 拓扑结构上,形成了以美国为核心的层级网络,具有小世界性和等级层次性,发育出典型的等级“核心—边缘”结构。② 空间格局上,以美国、西欧、中国和澳大利亚为顶点的“四边形”成为全球科研论文合作网络的骨架;三大中心性指标值的空间分异明显,强度中心性形成以美国为极核,加拿大、澳大利亚、中国及西欧诸国为次中心的“一超多强”格局,与之类似的介数中心性呈现北美、西欧和东亚“三足鼎立”的形态,度中心性分布则相对均匀,表现出“大分散、小集中”的“多中心—边缘集散”格局。③ 重力回归分析发现,地理距离抑制了国际科研论文合作,不过其影响力较弱;社会与经济邻近性对全球科研论文合作具有明显的促进作用,语言差异不是国际科研合作交流的障碍。
Spatial-temporal evolution mode of urban innovation spatial structure: A case study of Shanghai and Beijing
DOI:10.11821/dlxb201512005
[本文引用: 1]
In today's world, the innovation of science and technology has become the key support for improving comprehensive national strength, also the strong lead for changing the mode of social production and lifestyle. Which country has world-class scientific and technological innovation cities maximizes the attraction to global innovation factors. Which country maximizes the attraction to global innovation factors wins strategic initiative in international competition. Based on urban ZIP code spatial database, the evaluation system of urban innovation was established in the perspective of innovation output, and the spatial evolutionary mode, which is concerning the structure of innovation space of Shanghai and Beijing from 1991 to 2014, was discussed. The results of the research indicated that ZIP districts provided a fresh perspective to study the growth of spatial structure of urban innovation. And the result, which is of the evaluation of spacial structure of urban innovation using urban ZIP code spatial database established by connecting random edge points and Voronoi, was relatively ideal. So the promotional value exists. During the 25 years, the growth of spatial structure of innovation of Shanghai and Beijing demonstrated a lot of common features: with the increase of urban space units participated in innovation year by year, although the overall gap of regional innovation output has narrowed, the trend of spatial agglomeration has strengthened. The growth of spatial structure of innovation of Shanghai and Beijing demonstrated the differences among common features during the 25 years as well: in the trend of the suburbanization of innovation resources, the spatial structure of innovation of Shanghai indicated that the driver has evolved from the single-core driver to the multi-core resonance evolution. Radiation effect using traffic arteries as spatial diffusion corridors was prominent. Accordingly, the spatial correlation effect of its innovation output also indicated the city center hollowness; the spatial structure of innovation of Beijing was single-core (the city center) oriented structure all the way. In the trend that innovation resources were agglomerated in the center, the spatial correlation effect of innovation output indicated the characteristics of the evolutionary feature where "rural area encircles cities". The spatial structure of innovation of Shanghai and Beijing has intrinsic consistency with the spatial structure of their respective regions (Yangtze River Delta urban agglomeration and Beijing-Tianjin-Hebei urban agglomeration), which suggested that the principle of proportional and disproportional distribution of city-scale pattern of technological and innovational activities is closely related to its regional innovation pattern.
上海和北京城市创新空间结构的时空演化模式
DOI:10.11821/dlxb201512005
[本文引用: 1]
基于城市邮编区划空间数据库,从创新产出的视角建构城市创新评价指标体系,对1991-2014年上海市和北京市的创新空间结构的空间演化模式进行了探讨。研究发现:① 邮政区划为研究城市创新空间结构的生长提供了全新的视角,基于随机边缘点连线以及泰森多边形法构建的城市邮编空间数据库评价城市创新空间结构的结果较为理想,因此具有推广价值;② 25年间,上海市和北京市的创新空间结构生长体现出了诸多的共性特征:随着参与创新的城市空间单元逐年增加,区域创新产出虽总体差距在缩小,但空间集聚趋势在加剧;③ 25年间,上海市和北京市的创新空间结构生长也体现出了共性上的差异性,其中上海市创新空间结构在创新资源郊区化转移的趋势下,呈现出由单核驱动向多核共振演进,以交通干道为空间扩散廊道的辐射效应凸显,相应的,其创新产出空间关联效应也显现出了市中心空心化现象;而北京市创新空间结构始终为市中心单核主导型,并在创新资源不断向中心集聚趋势下,其创新产出空间关联效应呈现出“农村包围城市”的演化特征;④ 上海市和北京市创新空间结构与其所在的区域创新空间结构(长三角城市群和京津冀城市群)具有内在的一致性,表明城内尺度科技创新活动空间分布的均衡与非均衡规律与其所处的区域创新格局密切相关。
Spatial accessibility of road network in Wuhan metropolitan area
武汉都市圈路网空间通达性分析
DOI:10.11821/xb200912009
[本文引用: 1]
以武汉都市圈为例,通过距离算法、拓扑算法和空间句法模型,构建系列通达性数理模型,定量分析武汉都市圈路网发育的空间结构性规律:武汉都市圈路网整体发育水平和通达性格局保持高度相关性和一致性,空间差异显著;通达性遵循距离衰减律,空间收敛整体效应明显,呈现三大等级圈层和“中心—外围”结构;高等级路网发育不均衡,引起时空距离通达性圈发生“摄动”变形,呈西北—东南向倾斜的“Y”字形结构;拓扑连接等通达性圈更是出现“破碎化”,交通轴线网络呈“轴—辐”式和“鱼骨刺”状空间伸展序;同时,路网发育的等级差异性也导致整个网络伺服效率和应对“拥堵”能力的低下,并形成沿长江东西向、沿京广南北向两条带状集成核,成为整个路网的第一等级交通轴线,控制整个都市圈网络连接性,强化交通轴线交汇处—武汉市的中心性优势;路网通达性这种等级空间格局与圈域城镇体系、交通设施和社会经济发展状况密切相关,尤其是与高速公路为代表的高等级路网发育水平,表现出复杂的共轭协调关系。
The evolution process and growth mechanism of global cross-border M&A network
DOI:10.11821/dlxb202110014
[本文引用: 1]
Cross-border M&A (mergers and acquisitions) is an important way for enterprises to carry out overseas strategic layout, which has a significant impact on the pattern evolution of world economic geography. Based on record data of global cross-border M&A transactions from 2001 to 2017, a national-based network for the global scales is established to explore the evolution process and growth mechanism of global cross-border M&A network via the complex network analysis, the GIS method, and the spatial gravity model. Several conclusions can be drawn as follows. (1) The scale, density, and scope of the global cross-border M&A network have increased slightly, while there exists a trend of decentralization. (2) There is a sign that the center of gravity has been shifting from Western Europe and North America to the Asia-Pacific region for global cross-border M&A network, which is mainly driven by China. However, Chinese import and export of cross-border M&A largely rely on Hong Kong, British Virgin Islands, Cayman Islands and so on. (3) There is a process of division and integration for condensing subgroup of global cross-border M&A network. Among them, the scope of condensing subgroup led by the UK and the US has been narrowed, while that led by China has been expanded, and the European condensing subgroup has been further integrated. (4) The evolution of global cross-border M&A network to varying degrees was influenced by the indicator attributes for each country (region), which was in turn related to the science and technology level, offshore financial center, as well as proximity indicators, which were related to geographical conditions, language and history. However, natural resource endowment and economic market size for cross-border M&A linkages only have one-way (receiving or output) effect, and economic proximity index is not significant in 2009 to 2017.
全球跨境并购网络的空间格局演化及形成机制
DOI:10.11821/dlxb202110014
[本文引用: 1]
跨境并购是企业实施全球化战略的重要途径,对世界经济地理格局演化具有重大影响。本文基于2001—2017年全球跨境并购交易记录数据建构网络,借助复杂网络分析、GIS空间技术以及引力模型等方法,对全球跨境并购网络的空间格局演化及其形成机制进行探讨。研究发现:① 全球跨境并购网络的规模、密度、范围均有小幅度增长,并存有去中心化趋势。② 全球跨境并购方和标的方的空间分布重心出现由西(欧美)向东(亚太)转移的迹象,其首要推动者为中国,但中国跨境并购联系的出入口依赖于中国香港、英属维京群岛、开曼群岛等地区。③ 全球跨境并购网络社团的空间组织范围总体与世界大区的范围保持吻合,其中全球最大的社团由英美主导但其凝聚范围出现收缩,中国主导的亚太社团凝聚范围得到扩大,德法主导的社团对欧洲进一步整合。④ 研究期内国家(地区)科技发展水平和离岸金融中心等属性要素,以及国家(地区)间地理、语言以及历史的邻近性要素始终是驱动网络形成的重要动力,而自然资源禀赋、经济市场规模指标在2009—2017年对跨境并购联系的形成只产生了单向(接收或发出)影响,经济邻近性作用失效。
Spatial-temporal complexity and growth mechanism of city innovation network in China
DOI:10.13249/j.cnki.sgs.2018.11.003
[本文引用: 1]
At present, China’s city innovation system is gradually taking shape. As the core component of innovation resources, innovative technology represented by patents has become the focus of competition among all cities. Its gathering and diffusion channels urgently need to build a compatible city technology transfer system. The construction of a national technology transfer system in line with the law of science and technology innovation, the law of technology transfer and the law of industrial development is an inevitable choice for serving the strategy of innovation development. Based on data mining from National Intellectual Property Office of China, the heterogeneities and its evolution characteristics of city innovation network depicted by patent transfer in topology and space from 2001 to 2015 were sketched using lots of visualizing tools such as Pajek, Gephi, VOSviewer, ArcGIS, and so on. Topologically, from 2001 to 2015, with the increasing number of cities involved in technology transfer, China city innovation network has emerged a significant small-world feature with the smaller average path length and the extremely large cluster coefficient compared to its counterpart. In addition, the entire network presents a core- periphery structure with hierarchies, which dominated by Beijing, Shanghai and Shenzhen. Spatially, the quadrilateral pattern of China city innovation network based on the triangular structure is gradually formed. Last but not least, the growth mechanism of city innovation network were also verified by correlational analysis, negative binomial regression approach and gravity model of STATA. The growth of city innovation network in China is significantly related to the technological innovation strength represented by the number of patent application. The findings further confirm that geographical distance has weakened cross-city patents transfer. Meanwhile, the similarity of economic development and industrial structure between cities are also important factors influencing the growth of city innovation network.
中国城市创新网络的时空复杂性及生长机制研究
DOI:10.13249/j.cnki.sgs.2018.11.003
[本文引用: 1]
以国家知识产权局专利转让记录为数据源,采用大数据挖掘与分析技术、空间分析技术、复杂网络模型和负二项回归模型,系统描绘了2001~2015年中国城市创新网络的拓扑结构、空间结构和生长机制。研究发现:① 中国城市创新网络规模迅速扩张,在两极分化下涌现出显著的小世界性和等级层次性,以北京、上海、深圳为核心的核心-边缘格局不断强化;② 以三角结构为基础的中国城市创新网络的四边形格局逐渐形成,京津、长三角、珠三角是中国城市专利转移的核心三角;③ 中国城市创新网络的生长与城市科技创新实力显著相关,且受到地理距离的阻抗作用,凸显出强烈的地理邻近性,另外城市经济发展水平相似度和产业结构相似度也是影响城市创新网络生长的重要因素。
Spatial evolution and factors of interurban technology transfer network in Northeast China from national to local perspectives
DOI:10.11821/dlxb201910010
[本文引用: 1]
Interurban technology transfer becomes an essential channel for regions or cities to obtain external knowledge. Based on patent transaction data among cities during 2005-2015, this study investigates the interurban technology transfer network of Northeast China, aiming to explore spatial evolution of technology transfer network in this region from national to local perspectives based on social network analysis (SNA). A negative binomial regression analysis further reveals the factors of interurban technology transfer network. The results of the study are as follows: (1) From the national perspective, the interurban technology transfer network of Northeast China presents a core-periphery structure. The spatial pattern of "divergence in the northeast region" and "convergence in the coastal areas" has been formed. (2) From the local perspective, the technology transfer network of Northeast China shows a centripetal contraction situation, and its four hubs, namely, Harbin, Changchun, Shenyang and Dalian, play the role of technology gatekeeper. The interurban technology transfer flows present the characteristic of strengthening nationalization and weakening localization, which are more likely to emerge between the Northeast-Southeast China rather than among the Northeast China. (3) Both path-dependence and path-creation exist in the spatial dynamics of intercity technology flows in Northeast China. From the national perspective, technology flows from Northeast China to the Beijing-Tianjin-Hebei, Yangtze River Delta and Pearl River Delta urban agglomerations with Beijing, Shanghai and Shenzhen as the core respectively, while the local intercity technology transfer in Northeast China presents a mixed diffusing mode including hierarchical, contagious and jump diffusions. In addition, the local network mainly focuses on intra-provincial technology flows which centered on Haibin, Changchun, Shenyang and Dalian. (4) Some drivers, such as geographical proximity, the similarity of industrial structure, economic differences, the similarity of innovation capability, technology absorptive capacity, foreign direct investment, are evidenced to play a significant or determining role in interurban technology transfer of Northeast China.
东北三省城际技术转移网络的空间演化及影响因素
DOI:10.11821/dlxb201910010
[本文引用: 1]
从全国—本地视角,以东北三省为研究区,基于2005-2015年的专利权转移数据,融合社会网络、GIS空间分析和计量方法,定量刻画东北三省技术转移网络的空间演化规律。结果显示:① 全国视角下东北三省城际技术转移网络呈现“核心—边缘”等级层次性结构,形成了专利技术由东北辐散向全国沿海辐合的空间格局。② 本地视角下东北三省技术转移网络呈现出向心收缩结网态势,“哈长沈大”四大核心城市在本地网络中扮演“技术守门者”角色。技术转移表现出“强全国化,弱本地化”特征。③ 东北三省城际技术流动既存在路径依赖,也不断涌现路径创造。全国视角下,技术转移以东北三省核心城市为流源,基本流向以北京、上海和深圳分别为枢纽的京津冀、长三角和珠三角城市群。本地城际技术转移以哈尔滨、长春、沈阳、大连为集散中心,集中于省内转移,呈现等级、接触和跳跃式混合扩散空间模式。④ 地理距离接近度、产业结构相似度、经济水平差异度、创新能力相似度、技术吸收能力、外商直接投资对东北三省城际技术转移存在一定影响。
Prospects of the world's economic center of gravity moving eastward
全球经济重心东移的前景
The impact of ICT development on the global digital divide
DOI:10.1016/j.elerap.2012.02.002 URL [本文引用: 1]
The research of centralization and diffusion laws to the economic central city
经济中心城市的集聚与扩散规律研究
The development of COVID-19 in China: Spatial diffusion and geographical pattern
DOI:10.11821/dlyj020200329
[本文引用: 1]
The study of the spatial diffusion and geographical mode of COVID-19 is of great significance for the rational allocation of health resources, the management and response of public health emergencies, and the improvement of public health system in the future. Based on multiple spatio-temporal scale, this paper studied the spatial spreading process of COVID-19 between cities and its evolution characteristics in China, and then explored its influencing factors. The results are shown in the following: the inter-city spreading process of COVID-19 in China mainly experienced six stages, namely, stage I: diffusion in Wuhan, stage II: rapid multi-point diffusion in space, stage III: rapid increase of confirmed cases, stage IV : gradual decrease of new confirmed cases, stage V: the epidemic under control, and stage VI: cases imported from overseas. In the context of globalization and open regional system, the social and economic development of regions are closely related to each other. With the development of fast and convenient high-speed railway network, the spatial characteristic of population migration shows a cross-regional and hierarchical pattern, and forms a certain spatial cascade structure along the transport corridor. Accordingly, the spatial spread of COVID-19 mainly showsthe characteristics of adjacent diffusion, relocation diffusion, hierarchical diffusion, and corridor diffusion. The study found that geographical proximity, population migration and population size, traffic network, epidemic prevention and control measures have significant influence on the spatial diffusion process of COVID-19. Among different modes of transportation, airplanes play agreater role than others in the early stage of the epidemic. In addition, the population flow during the Spring Festival had a certain impact on the spread of the epidemic. In conclusion, to some extent, the spatial spread process and pattern of COVID-19 epidemic reflects the spatial organization pattern of social and economic activities under the "space of flows" network, which is closely related to the geographical proximity, the social and economic linkages between regions, and the spatial an temporal patterns of human activities. From the perspective of geography, this paper analyzed the inter-city spread pattern of COVID-19 epidemic and provided some implications for prevention and control measures against the epidemic in other countries, and also offered some suggestions for China to deal with public health emergency risks in the future.
新冠肺炎疫情的空间扩散过程与模式研究
DOI:10.11821/dlyj020200329
[本文引用: 1]
研究新冠肺炎疫情的空间扩散过程与模式对于防疫抗疫资源的合理配置、突发公共卫生事件的管理与应对以及未来公共卫生体系的完善具有重要意义。本文综合时间和空间尺度,从地理学视角研究了新冠肺炎疫情的城际空间扩散过程,归纳总结扩散模式,并揭示了其影响因素。研究发现:新冠肺炎疫情在中国的发展主要经历了6个阶段,并在空间上表现出邻近扩散、迁移扩散、等级扩散和廊道扩散等地理模式;地理邻近性、人口流动、人口规模、交通网络、疫情防控管理等因素对疫情的空间扩散具有显著影响。新冠肺炎疫情的空间扩散过程和模式一定程度上是“流空间”网络下人类社会经济活动空间组织模式的一种反映,与地理邻近性、社会经济联系的跨区域性及人类活动的时空规律等密切相关。本研究以期为世界各国的疫情防控措施制定提供参考,也为中国未来应对公共卫生应急风险提供经验借鉴。
Identify of the multiple types of commercial center in Guangzhou and its spatial pattern
DOI:10.18306/dlkxjz.2016.08.005
[本文引用: 1]
The identification of different functional types of commercial center in a city is of great significance to understanding the spatial structure of business. Compared to the traditional methods, the analysis of big data produces more accurate result and is more convenient. Taking the 59125 POI (Point of Interest) data of Guangzhou City as the basic data, we identified the boundaries of the multi-functional commercial centers and explore their spatial structure and pattern by using the methods of kernel density analysis, statistical analysis, and nearest distance analysis. The result shows that: (1) The commercial area structure presents a clear dual-core distribution, with the Yuexiu District and the Tianhe District constituting the cores. (2) Different types of commercial centers show clear spatial variations. The urban services center and the public service center are located in the Yuexiu District and the business center and the financial center are located in the Tianhe District. Entertainment centers present the characteristics of dispersed clusters. (3) The spatial structure of business is a combination of zones and clusters. The urban services, public service, and business functions are concentrated in the inner zones and the entertainment functions can be found in all areas.
广州市多类型商业中心识别与空间模式
DOI:10.18306/dlkxjz.2016.08.005
[本文引用: 1]
不同职能类型商业中心识别对研究城市商业空间结构有重要意义。与传统识别方法相比,大数据的分析更为精确和便捷。本文以广州市核心区59125条城市热点(POI)数据为基础,利用核密度分析、统计分析、最邻近距离分析等方法识别广州市多类型商业中心的边界,探索其商业空间结构与模式。结果表明:①广州市商业结构呈现明显双核集聚式分布,传统的越秀分区与现代的天河分区构成当前广州市商业空间的双中心;②不同类型的商业中心在空间上呈现显著分异,其中城市生活与公共服务中心在越秀区,商务与金融中心在天河区,休闲娱乐中心呈现分散集聚式特征;③广州市商业结构的空间模式是“圈层+组团”式分布,其中,生活、公共服务、商务职能集中分布于内圈层,娱乐休闲职能呈组团状镶嵌于各圈层中。
International comparison between the location mode selections for productive service sector
生产性服务业区位模式选择的国际比较
How to stop data centres from gobbling up the world's electricity
DOI:10.1038/d41586-018-06610-y [本文引用: 1]
