

1 引言
植被蒸腾(Transpiration, Tc)是陆地蒸散发的主要水通量,占陆地蒸散量的80%~90%,蒸腾作用每年将(62000±8000) km3的水再循环到大气中[1⇓-3]。蒸腾作用的主要水源来自土壤水,土壤水分(Soil Moisture, SM)的不足会影响植被的气孔导度,限制生产力甚至威胁植被的生存[4⇓-6]。Tc的另一个主要驱动因子为饱和水汽压差(Vapor Pressure Deficit, VPD),一方面VPD是植物大气需水量的重要驱动因素[7-8],另一方面当VPD增加到一定阈值后,继续增加VPD会导致植被气孔导度降低直至关闭,进而减少Tc[9-10]。因此,VPD也是决定植被蒸腾作用的关键变量[8,11 -12]。在当前气候变暖背景下,全球VPD逐渐增加,而SM目前表现出逐渐减少的趋势[8,13],这可能会限制植被的蒸腾作用,为此厘清SM和VPD对蒸腾作用的影响有助于理解生态系统的水循环气候响应机制。
由于SM和VPD交互机制比较复杂,且时空异质性较高,对Tc相对作用仍存在一定争议[14-15]。当前有关SM和VPD对于蒸腾作用影响的研究主要集中在站点等小尺度上[16-17],比如Song等研究SM和VPD对于江西省亚热带针叶林蒸腾作用的独立影响,结果表明VPD对于植被蒸腾的限制大于SM限制。然而,SM和VPD对蒸腾作用的独立影响在区域和全球尺度探索较少,这阻碍了对生态系统水循环气候变化响应的深入认识[11,18]。近年来在区域和全球尺度上,已开展了大量有关光合作用对SM和VPD相对效应的研究[14-15],考虑到光合与蒸腾的耦合作用[1,19 -20],这对Tc研究具有一定参考价值。Liu等证明是SM控制着全球大多数植被地区生态系统生产,而不是VPD[14]。Lu等认为在全球更多通量站点和更大区域,VPD而非SM主导着生态系统生产效率[21]。Dang等认为在全球植被覆盖区,温度(Temperature, Ta)对生态系统生产力的贡献大于SM,在不同的植被类型中SM和Ta的重要性也不相同[22]。
近年来,中国南方亚热带地区经历了显著的气候变化,特别是SM下降、VPD增加,对区域Tc造成显著影响[13,23 -24],进而对区域生态环境与社会经济带来潜在威胁。然而,SM、VPD对于Tc的独立贡献尚不清楚,严重限制了区域水循环气候变化响应规律认知与应对策略制定。本文选取中国亚热带区域作为研究区,借助相关性分析法、“分箱解耦法”,探讨VPD和SM变化对Tc的各自影响,进一步研究不同植被类型Tc对VPD和SM变化的响应敏感性差异。本文假设,如果SM在Tc中起主导作用,那么Tc对VPD的变化不是很敏感,高SM会促进Tc;相反,如果VPD在Tc中起主导作用,那么Tc对SM的变化不是很敏感,VPD会促进Tc。
2 研究区概况与数据来源
2.1 研究区概况
图1
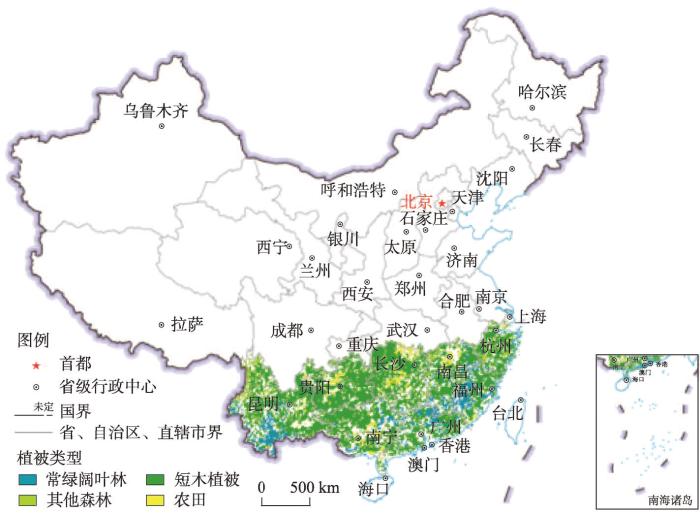
图1
研究区及主要植被空间分布
注:基于自然资源部标准地图服务网站GS(2019)1823号标准地图制作,底图边界无修改。
Fig. 1
Spatial distribution of the main vegetation types over the study area
2.2 数据来源
2.2.1 土壤湿度数据
土壤湿度数据选用国家青藏高原数据中心发布的“基于站点观测的中国1 km土壤湿度日尺度数据集”[26](
2.2.2 饱和水汽压差
式中:VPD是饱和水汽压差(hPa);
2.2.3 蒸腾数据
本文中使用的Tc数据来源于Global Land Evaporation Amsterdam Model(GLEAM)v3.5a产品(
2.2.4 植被类型数据
植被类型数据来自国际地圈—生物圈计划(IGBP)分类方案(
2.2.5 SIF数据
荧光是叶绿素在光合作用过程中重新发射的长波辐射,与光合作用密切相关,考虑到光合与蒸腾作用通过叶片气孔紧密耦合,因此荧光可以作为植被蒸腾的理想探针[36,41]。随着日光诱导叶绿素荧光(SIF)遥感的发展,基于地面和遥感SIF观测的实例分析表明,SIF与Tc有很强的相关性,如Maes等利用卫星SIF和能量通量土壤冠层观测(SCOPE)模型研究了SIF和Tc之间的经验联系[36],Lu等根据通量塔测量发现温带森林的SIF与潜热通量密切相关[41]。本文采用的SIF数据来源于GOSIF产品,由中分辨率成像光谱仪(MODIS)遥感数据和气象再分析数据生成[42],由于其具有更高的时空分辨率和全球连续覆盖率,目前已广泛用于SM和VPD对于光合作用的影响研究[15,22]。本文中的GOSIF数据时间跨度为2013—2018年,时间分辨率为月,空间分辨率为0.05°,为了便于研究将数据升尺度至0.1°。本文的GOSIF数据主要有两个作用,一方面利用SIF实现对GLAME Tc数据降尺度,另一方面直接利用SIF来指征Tc,辅助验证本文的结果。
3 研究方法
本文选取Spearman相关性分析,用于研究区内Tc、VPD、SM、SIF数据的相关性分析。Spearman相关分析方法既能描述线性关系,又能描述非线性关系,对数据无需正态假设要求,对异常值的敏感性低,具有广泛应用[43]。由于GLEAM Tc数据空间分辨率较粗,为准确分析中国亚热带区植被蒸腾驱动力,同时为保证数据空间分辨率的一致性,需要对其进行降尺度处理。本文利用GOSIF数据,逐像元建立SIF与GLEAM Tc数据的线性回归方程。基本过程为:首先将GOSIF数据升尺度至0.25°,并与GLEAM Tc数据建立统计关系,最终将回归方程应用于原始高分辨的SIF数据,实现对Tc数据的预测,达到降尺度处理目的。为了排除其他因素的干扰,首先将研究区内温度小于15 ℃,光合通量密度小于500 µmol m-2 s-1数据去除掉[14]。考虑到SM和VPD之间的强耦合性,这使得本文无法通过常规方法量化SM和VPD对于Tc的影响。为此,本文选用Liu等提出的“分箱解耦法”来分离SM与VPD之间的相关性[14],进而量化SM和VPD对于Tc的影响。首先将研究区内的SM和VPD数据,按照数值由小到大进行排列,将排列后的SM和VPD数据按照百分位各分成10个区间(即0~10%、10%~20%、……、90%~100%),对SM和VPD区间取交集,得到10×10个子区间,本文中称之为“箱”(图2)。在每个区间中SM和VPD基本上是解耦的,因此便于各自量化SM和VPD对于Tc的影响。如果箱中的数据个数小于10个,则删除该箱,使用箱中的平均值来量化SM和VPD对于Tc的影响。剥离SM-VPD的耦合性后,用Tc(VPD|SM)来量化VPD对Tc的影响,即△Tc(VPD|SM)表征的是在保持SM不变或变化较小的情况下,随着VPD从最低值到最高值的Tc变化量(mm month-1);同理,用Tc(SM|VPD)来量化SM对于Tc的影响,计算如下[14]:
式中:△Tc(VPD|SM)为每个SM区间中最高VPD箱和最低VPD箱的Tc之差;
图2
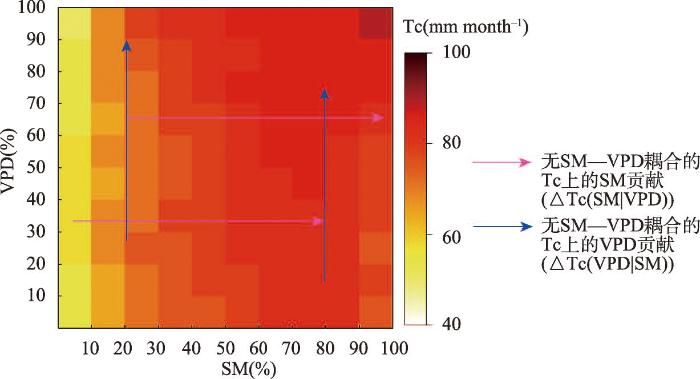
图2
“分箱解耦法”概念图
Fig. 2
Conceptual illustration of the decoupling approach by binning
4 结果与分析
4.1 Tc与驱动因子相关性分析
图3展示了各研究变量之间相关性的空间分布,VPD与Tc总体上呈正相关,相关性均值约为0.57,正相关的区域约占91%,负相关的区域约占9%,VPD与Tc相关性在云南地区较低,均值约为0.1(图3a)。SM与Tc总体上呈正相关,相关性均值约为0.3,78%区域表现为正相关,具体而言正相关的区域主要集中在云南、华南等地区,负相关的区域集中在江西、浙江等地(图3b)。SM与VPD总体上呈负相关,相关性均值约为 -0.2,负相关的区域约占79%,显著负相关(P < 0.05)区域约占70%,主要集中在云南、浙江等地(图3c)。总体而言,SM与VPD存在很强的耦合性,在高SM和高VPD地区,SM与Tc的相关性可能是VPD与Tc之间相关性的副产品,或VPD与Tc的相关性可能是SM与Tc之间相关性的副产品。因此,在评估SM和VPD对Tc影响时,SM和VPD之间的相关性常常被忽视。此外,为了验证SIF数据降尺度的可靠性,本文在0.25°尺度上对GOSIF和GLEAM Tc数据进行相关性分析,研究区SIF与Tc整体表现为较强的正相关(图3c),均值约为0.84,表明选用SIF数据进行降尺度是可行的。
图3
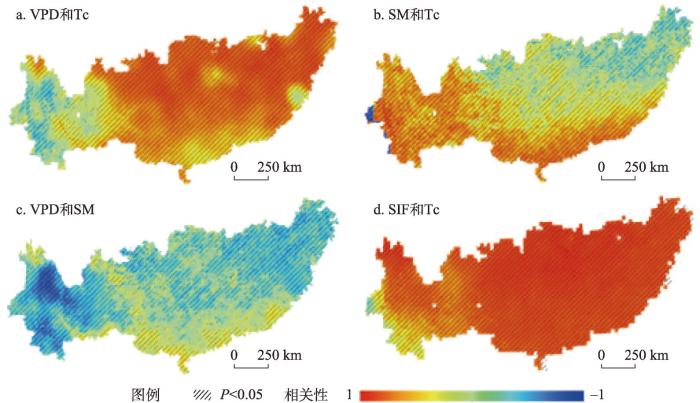
图3
2003—2018年中国亚热带地区各因子之间相关性空间分布
Fig. 3
Spatial distribution of correlations between the selected variables in subtropical China from 2003 to 2018
图4
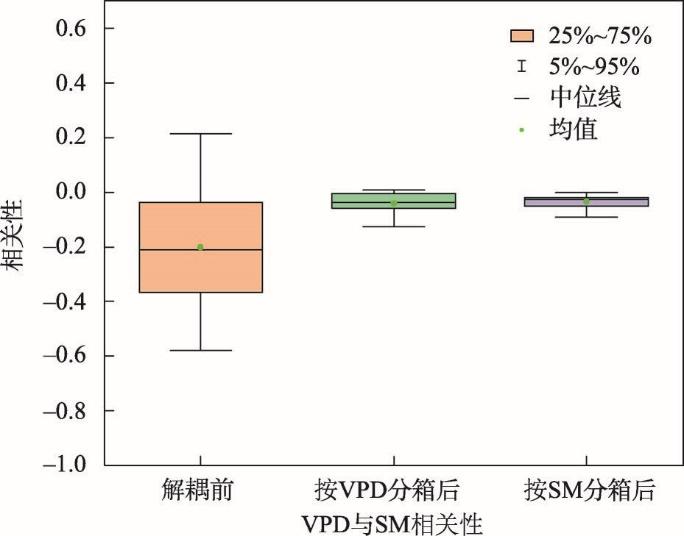
图4
2003—2018年中国亚热带区土壤湿度(SM)和饱和水汽压差(VPD)相关性统计
Fig. 4
Box-plots of the correlation coefficients between soil moisture (SM) and vapor pressure deficit (VPD) across the study area in subtropical China from 2003 to 2018
4.2 VPD与SM变化对Tc的相对贡献
图5展示了实现SM和VPD之间的解耦后,研究区Tc随SM和VPD梯度增加的变化,总体上Tc随SM的增加表现出先上升后保持稳定的趋势,在SM小于35%的梯度,Tc随着SM的增加而逐渐增加,当SM大于35%梯度,Tc变化较小(图5a)。然而研究区Tc整体上受VPD的影响较小,在SM小于10%的区间中,Tc随VPD的增加而下降,在SM大于10%的区间中,Tc随VPD的增加呈现出相对上升的趋势(图5b)。这表明,在没有SM-VPD耦合的情况下,研究区高SM促进了Tc,而高VPD对Tc的促进作用不是很显著,换句话说,Tc与VPD相关性主要是SM-VPD耦合的副产品。图6展示了解耦后研究区SM和VPD对Tc、SIF的相对贡献,研究区SM对Tc的月平均相对贡献为23.54 mm,并且SM对Tc的相对贡献都为正贡献,这表明在不同VPD梯度下,SM的增加都对Tc起促进作用,SM相对贡献的最大值为34.21 mm month-1,最小值为17.57 mm month-1(图6a)。研究区VPD对Tc的平均相对贡献为4.80 mm month-1,当SM位于0~10%区间,VPD对Tc的相对贡献最小,约为-3.84 mm month-1,SM在90%~100%区间,VPD对Tc相对贡献最大,约为10.49 mm month-1(图6a)。为了进一步验证结果的可信性,本文分析了研究区SM和VPD对SIF的相对贡献,研究区SM和VPD对SIF的相对贡献分别为0.13 W m-2 nm-2 sr-1、-0.02 W m-2 nm-2 sr-1,在VPD位于20%~30%的区间,SM对SIF的相对贡献值最小,约为0.09 W m-2 nm-2 sr-1,VPD对SIF的贡献随SM梯度增加而减小,当SM位于80%~90%区间,VPD对SIF的相对贡献值最小(图6b)。总体而言,研究区SM和VPD对Tc的独立影响与SIF较为一致。
图5
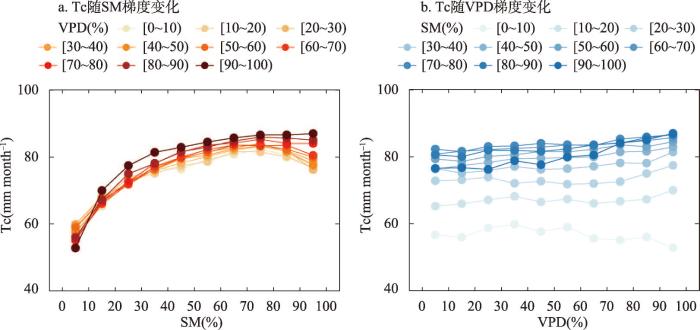
图5
SM-VPD解耦条件下Tc随SM、VPD梯度的变化
注:圆点表示每个SM-VPD箱中的Tc平均值,不同颜色表示不同的VPD或SM区间。
Fig. 5
Changes of Tc in the gradients of SM and VPD without SM-VPD coupling
图6
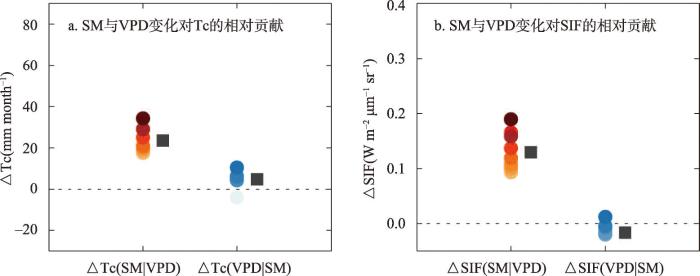
图6
VPD-SM解耦条件下SM与VPD变化对Tc的相对贡献
注:不同颜色表示不同的VPD或SM区间,圆点表示每个区间中的SM或VPD贡献,正方形表示相应的均值。
Fig. 6
Relative contributions of SM and VPD to Tc without SM-VPD coupling across the study area
4.3 不同植被类型Tc对SM和VPD敏感性差异
图7展示了不同植被类型Tc对SM和VPD的响应差异,整体而言4种植被类型的Tc对SM的敏感性大于VPD的敏感性,Tc随SM的增加都表现出上升的趋势,但不同植被类型的Tc对SM响应的阈值(即梯度响应曲线拐点)不同,其他森林的拐点最低约为35%,短木植被的拐点较高约为55%(图7c、7e)。4种植被Tc受VPD的影响都较小,在SM大于20%的区间内,其他森林Tc随VPD的增大而增大(图7d),但常绿阔叶林与农田的Tc随VPD的增加呈波动状态(图7b、7h)。图8展示了不同植被类型的SM和VPD对Tc、SIF的相对贡献,总体上4种植被类型的SM贡献均大于VPD的贡献,常绿阔叶林的SM、VPD对Tc的平均相对贡献分别为19.73 mm month-1、2.90 mm month-1,在SM位于0~40%区间中,VPD对Tc的相对贡献小于0 mm month-1(图8a)。其他森林的Tc随着SM所属区间的增加逐渐上升,SM、VPD对其他森林Tc的平均相对贡献分别为22.88 mm month-1、7.70 mm month-1(图8c)。农田的SM、VPD对Tc的平均相对贡献分别为16.17 mm month-1、5.07 mm month-1(图8g),在相同的SM或VPD条件下,高VPD和高SM会导致农田的Tc下降,当VPD在90%~100%区间中,SM对Tc的相对贡献最小,约为3.91 mm month-1。在不同的植被类型中,SM、VPD对Tc的相对贡献与SIF基本吻(图8b、8d、8f、8h)。不同植被类型Tc对SM和VPD的响应敏感性差异表明,在考虑SM和VPD的独立影响时,应注意区分不同的土地覆盖类型。
图7
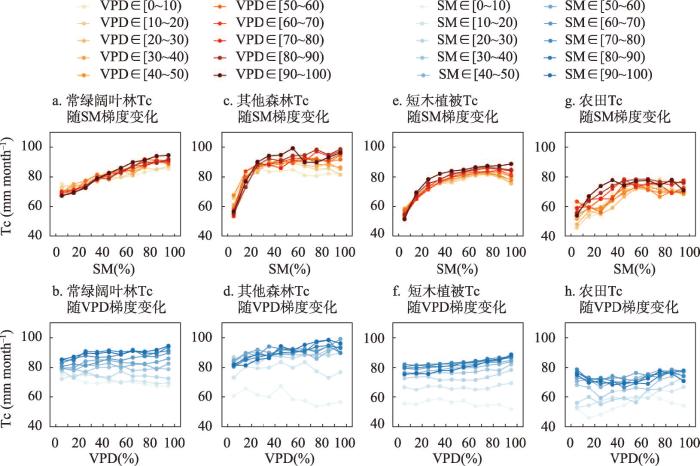
图7
SM-VPD解耦条件下不同植被类型Tc随SM、VPD梯度的变化
注:圆点表示每个SM-VPD箱中的Tc平均值,不同颜色表示不同的VPD或SM区间。
Fig. 7
Changes of Tc in the gradients of SM and VPD without SM-VPD coupling for the different vegetation types
图8
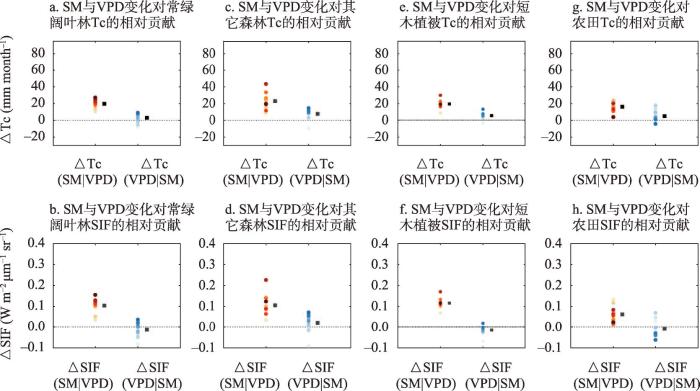
图8
VPD-SM解耦条件下不同植被类型SM与VPD变化对Tc的相对贡献
注:不同颜色表示不同的VPD或SM区间,圆点表示每个区间中的SM或VPD贡献,正方形表示相应的均值。
Fig. 8
Relative contributions of SM and VPD to Tc without SM-VPD coupling for the different vegetation types
5 结论与讨论
5.1 讨论
气候变暖背景下,有关VPD和SM对于植被蒸腾变化驱动作用的认识仍有待完善,主要原因在于SM和VPD通过陆地—大气相互作用强烈耦合,限制了SM、VPD对Tc独立影响的量化。“分箱解耦法”目前已被证实可以在全球和区域尺度上很好地将SM和VPD的强耦合性剥离[14-15,44],相比之下相关性分析和多元线性回归等传统方法,对SM与VPD之间的共线性解耦不充分[14],并且研究表明植物蒸腾作用对SM和VPD的响应可能是非线性的[45-46],该方法能够捕捉这种非线性[22,47]。使用该方法后本文的SM与VPD相关性呈现明显的下降(图4),为探究SM、VPD对Tc的独立影响提供了基础。本文分析了SM、VPD对中国亚热带地区植被Tc的独立影响,发现SM对Tc的独立影响大于VPD的独立影响,这支持了Liu、Yu等的结果,强调SM对Tc的重要性[14-15]。中国亚热带地区干旱频发[48],SM年际波动较大,植被蒸腾更容易受SM的影响。然而,最近有关中国亚热带地区SM和VPD对Tc的独立影响表明[17],VPD和SM对Tc的限制分别为90.8%、9.2%,造成这种差别的原因是研究时间尺度不同。因太阳辐射、VPD、温度都会对植被蒸腾造成影响[49-50],为了控制其他因素对研究的干扰,本文将研究区温度小于15 ℃、VPD小于5 hPa、光合通量密度小于500 µmol m-2 s-1像元数据进行了剔除[14],因此本文更多关注的是生长季内(主要是夏季)VPD和SM变化对Tc的相对作用。而Song考虑的范围为全年的VPD和SM季节变化对Tc的作用。考虑到中国亚热带地区VPD与Tc季节格局的相似性,在年内尺度上VPD与Tc的相关性更高,在一定程度上表现为VPD对Tc的主导作用。近年来已有研究表明陆地生态系统水分胁迫存在临界阈值[51-52]。本文结果显示研究区Tc对SM的响应在35%阈值下,其增加对Tc贡献很显著,但在35%阈值上,SM的变化对Tc的影响较小(图5a),这表明植被对SM的响应存在阈值效应。值得注意的是,虽然VPD的阈值响应不明显,但当SM大于10%阈值时,高VPD会促进Tc,相反当SM小于10%阈值,高VPD会抑制Tc的增加(图5b),表明Tc对VPD的响应受SM的调节[53-54]。在其他森林中高VPD并不总是限制Tc(图7d),这可能是由于森林根系发达,在大气干旱情况下依然可以利用深层土壤水[55-56],相比之下农田由于根系较浅,在水分胁迫下更倾向于气孔关闭来减少水分消耗[57](图7h)。在相同SM或VPD条件下,高VPD和高SM对森林等植被的Tc起促进作用,但农田却表现出相反的趋势(图8a、8g),这些差异可能与森林、短木植被和农田生态系统的环境条件、土壤性质和根系系统有关[57]。未来在生态系统水循环模拟的过程中,应适当考虑不同植被类型对SM和VPD的敏感性。此外,近年来已有大量研究表明SIF与Tc密切相关,可以用SIF来指征Tc的变化[37⇓-39],图3d和图8展示了用SIF来验证本文分析的可行性与结果的合理性。
尽管本文量化了中国亚热带地区VPD和SM对Tc的相对影响,但仍存在一定的局限性。首先,当前已有研究表明SM和VPD是影响Tc的最主要因素[14-15,17],然而温度、辐射、风速等也会对Tc产生影响,因此本文尝试设置控制条件,比如本文将研究区温度小于15 ℃、VPD小于5 hPa、光合通量密度小于500 µmol m-2 s-1像元数据进行了剔除,尽可能减少其他因素对结果的干扰,但风速、植被生长结构等因素因缺乏数据未做考虑,未来需要对这些因素进行定量的分析。其次,尽管存在季节动态和年际动态等影响因素差异,本文重点关注了植被的平均状态,来表征常规年份植物响应特性,未来本文会关注年际变化和极端事件对Tc驱动力的影响。再次,研究区主要处在亚热带季风气候区,气候类型相对单一,这会造成研究结果的代表性不足,未来应探讨不同气候、以及不同干湿条件下植被Tc对SM、VPD的敏感性。本文为理解湿润地区SM和VPD对Tc的相对作用提供一定的借鉴,未来在气候变化的背景下,SM对该地区Tc的影响可能会进一步增加。
5.2 结论
本文基于多源遥感数据与气候再分析资料,利用“分箱解耦法”探究了VPD和SM对中国亚热带地区Tc变化的独立驱动作用,并进一步结合不同植被类型数据分析了Tc对SM和VPD响应的敏感性差异。结果表明,研究区SM对植被Tc的影响大于VPD对植被Tc的影响,总体而言SM对Tc的相对贡献约为VPD的5倍;不同植被类型对SM、VPD的敏感性不同,4种植被类型对SM的敏感性均大于VPD的敏感性,不同植被类型Tc对SM响应的阈值不同,其中森林(常绿阔叶林除外)的阈值最低。此外,本文基于光合和蒸腾作用的强耦合性,利用SIF遥感数据重复上述分析过程,得到与Tc一致的结果,证明了本文结论的可信性。以上结果表明,未来在考虑区域水循环气候变化响应规律认知与应对策略制定时,应适当考虑SM的作用,并关注不同土地覆盖类型的响应差异。
关联数据信息:本文关联实体数据集已被国家地球系统科学数据中心收录,获取地址:
参考文献
Terrestrial water fluxes dominated by transpiration
DOI:10.1038/nature11983 [本文引用: 2]
Hydrologic connectivity constrains partitioning of global terrestrial water fluxes
DOI:10.1126/science.aaa5931
URL
[本文引用: 1]

\n Mobile surface waters and soil waters are relatively disconnected on a global scale. Water on land is eventually lost by surface runoff into the oceans or is ultimately sent back to the atmosphere through evapotranspiration processes. Good\n et al.\n determined that 65% of continental water evaporation is from soils, which includes water taken up and transpired by plants (see the Perspective by Brooks). Although just a small fraction of global surface waters pass through soils, individual stream ecosystems may be affected by water quality changes in nearby soils.\n
Impacts of vegetation changes on global evapotranspiration in the period 2003-2017
DOI:10.11821/dlxb202103007
[本文引用: 1]
Evapotranspiration is a key variable and key process in global water cycle, and it is crucial for understanding how anthropogenic and climate changes have impacts on terrestrial water cycle. In the last decade, global vegetation changes are dramatic, reflected by land use and land cover changes and increase in leaf area index. It remains unclear how these changes influence terrestrial evapotranspiration processes. This study uses a coupled evapotranspiration and gross primary product model (PML-V2) that is run at 500 m and 8-day resolutions across the globe to investigate the impacts of vegetation changes on spatial pattern and dynamics of evapotranspiration in the period of 2003-2017. We found that evapotranspiration across the globe has increased noticeably because of vegetation changes, which is characterized by clear regional and non-regional patterns. Transpiration has strongly increased in the central and northern parts of North America, Europe, eastern China, southern Africa, and eastern and northern Australia. Under different land cover types, shrubs and cropland have been influenced strongly, and their impact is stronger in the post-2012 period than that in the pre-2012 period. The recent total increase from these two land cover types amounts to about 0.41 ×10³ km3 a-1, which is about 8 times of natural annual runoff from the Yellow River Basin. The results from this study can help improve the understanding of how vegetation changes caused by recent land use and land cover changes influence terrestrial water cycle and the potential local and regional climate change.
2003—2017年植被变化对全球陆面蒸散发的影响
DOI:10.11821/dlxb202103007
[本文引用: 1]
蒸散发是陆面水循环的关键环节和过程,是研究水循环对人类活动和气候变化响应的关键要素。过去十几年,全球下垫面的植被变化剧烈,但如何影响全球陆面蒸散发仍未得到清晰的揭示。本文采用500 m分辨率MODIS数据驱动PML-V2模型,定量解析了2003—2017年植被变化对全球陆面蒸散发的影响。结果显示:在全球尺度上,植被变绿使得全球蒸散发呈现显著的增加趋势,使陆地水循环加快;区域尺度上,植被变化对蒸散发的影响则存在明显的地带性和非地带性特征,如在北美洲中北部、欧洲、中国东部、非洲南部和澳大利亚东北部等地区,蒸散发总量的增加主要是由植被蒸腾增加而引起的。分析不同植被功能类型区的贡献显示,下垫面变化对灌木和耕地影响尤为明显,并在2012年以后呈现增强趋势;这2个植被类型区的全球年总蒸散发累积增加量为0.41×10<sup>3</sup> km<sup>3</sup> a<sup>-1</sup>,约为黄河流域多年平均径流量的8倍。该研究结果有助于进一步加强关于下垫面变化对陆地水循环的影响及其可能带来的局部气候变化的认识。
Drought sensitivity of the Amazon rainforest
DOI:10.1126/science.1164033
PMID:19265020
[本文引用: 1]
Amazon forests are a key but poorly understood component of the global carbon cycle. If, as anticipated, they dry this century, they might accelerate climate change through carbon losses and changed surface energy balances. We used records from multiple long-term monitoring plots across Amazonia to assess forest responses to the intense 2005 drought, a possible analog of future events. Affected forest lost biomass, reversing a large long-term carbon sink, with the greatest impacts observed where the dry season was unusually intense. Relative to pre-2005 conditions, forest subjected to a 100-millimeter increase in water deficit lost 5.3 megagrams of aboveground biomass of carbon per hectare. The drought had a total biomass carbon impact of 1.2 to 1.6 petagrams (1.2 x 10(15) to 1.6 x 10(15) grams). Amazon forests therefore appear vulnerable to increasing moisture stress, with the potential for large carbon losses to exert feedback on climate change.
A drought-induced pervasive increase in tree mortality across Canada's boreal forests
DOI:10.1038/nclimate1293 [本文引用: 1]
Darcy's law predicts widespread forest mortality under climate warming
DOI:10.1038/nclimate2641 [本文引用: 1]
The effect of atmospheric humidity on photosynthesis, transpiration and water use efficiency of leaves of several plant species
DOI:10.1007/BF00390086
PMID:24419571
[本文引用: 1]
The effect of humidity on the gas exchange of leaves of the dicotyledons soybean (Glycine max (L.) Merrill), sunflower (Helianthus annuus L.), jojoba (Simmondsia chinensis (L.) Schneider), and saltbush (Atriplex halimus L.) and the monocotyledons wheat (Triticum aestivum L.), barley (Hordeum vulgare L.) sorghum (Sorghum bicolor (L.) Moench) and barnyard grass (Echinochloa crus-galli (L.) Beauv.) was examined under conditions of adequate soil moisture in a controlled environment. Photosynthesis and stomatal and internal diffusion resistances of whole, attached, single leaves were not affected by changes in humidity as the vapour pressure deficit between the leaf and atmosphere ranged from 8 to 27 mb. Transpiration increased linearly with increasing vapour pressure deficit. Whole plants of barley exhibited a different response. As humidity was increased, photosynthesis increased, transpiration expressed per unit of vapour pressure difference increased, and diffusion resistances became smaller. Reasons for the different behaviour of single leaves and whole plants are suggested. An index for water use efficiency, expressed per millibar of vapour pressure deficit, was calculated for single leaves of each species used in the experiments. This showed that water use efficiency was highest in the C4 xerophytes and lowest in the C3 mesophytes. The effect of environment on water use efficiency is examined using data from the literature.
Increased atmospheric vapor pressure deficit reduces global vegetation growth
Global vegetation greening trend stalled after the late 1990s due to increased atmospheric water demand.
Survey and synthesis of intra‐ and interspecific variation in stomatal sensitivity to vapour pressure deficit
Global variations in ecosystem-scale isohydricity
DOI:10.1111/gcb.13389
PMID:27334054
[本文引用: 1]
Droughts are expected to become more frequent and more intense under climate change. Plant mortality rates and biomass declines in response to drought depend on stomatal and xylem flow regulation. Plants operate on a continuum of xylem and stomatal regulation strategies from very isohydric (strict regulation) to very anisohydric. Coexisting species may display a variety of isohydricity behaviors. As such, it can be difficult to predict how to model the degree of isohydricity at the ecosystem scale by aggregating studies of individual species. This is nonetheless essential for accurate prediction of ecosystem drought resilience. In this study, we define a metric for the degree of isohydricity at the ecosystem scale in analogy with a recent metric introduced at the species level. Using data from the AMSR-E satellite, this metric is evaluated globally based on diurnal variations in microwave vegetation optical depth (VOD), which is directly related to leaf water potential. Areas with low annual mean radiation are found to be more anisohydric. Except for evergreen broadleaf forests in the tropics, which are very isohydric, and croplands, which are very anisohydric, land cover type is a poor predictor of ecosystem isohydricity, in accordance with previous species-scale observations. It is therefore also a poor basis for parameterizing water stress response in land-surface models. For taller ecosystems, canopy height is correlated with higher isohydricity (so that rainforests are mostly isohydric). Highly anisohydric areas show either high or low underlying water use efficiency. In seasonally dry locations, most ecosystems display a more isohydric response (increased stomatal regulation) during the dry season. In several seasonally dry tropical forests, this trend is reversed, as dry-season leaf-out appears to coincide with a shift toward more anisohydric strategies. The metric developed in this study allows for detailed investigations of spatial and temporal variations in plant water behavior.© 2016 John Wiley & Sons Ltd.
The increasing importance of atmospheric demand for ecosystem water and carbon fluxes
DOI:10.1038/nclimate3114 [本文引用: 2]
Plant responses to rising vapor pressure deficit
DOI:10.1111/nph.16485
PMID:32064613
[本文引用: 1]
Recent decades have been characterized by increasing temperatures worldwide, resulting in an exponential climb in vapor pressure deficit (VPD). VPD has been identified as an increasingly important driver of plant functioning in terrestrial biomes and has been established as a major contributor in recent drought-induced plant mortality independent of other drivers associated with climate change. Despite this, few studies have isolated the physiological response of plant functioning to high VPD, thus limiting our understanding and ability to predict future impacts on terrestrial ecosystems. An abundance of evidence suggests that stomatal conductance declines under high VPD and transpiration increases in most species up until a given VPD threshold, leading to a cascade of subsequent impacts including reduced photosynthesis and growth, and higher risks of carbon starvation and hydraulic failure. Incorporation of photosynthetic and hydraulic traits in 'next-generation' land-surface models has the greatest potential for improved prediction of VPD responses at the plant- and global-scale, and will yield more mechanistic simulations of plant responses to a changing climate. By providing a fully integrated framework and evaluation of the impacts of high VPD on plant function, improvements in forecasting and long-term projections of climate impacts can be made.© 2020 The Authors. New Phytologist © 2020 New Phytologist Trust.
Variation trend of global soil moisture and its cause analysis
Soil moisture dominates dryness stress on ecosystem production globally
PMID:32994398
[本文引用: 15]
Dryness stress can limit vegetation growth and is often characterized by low soil moisture (SM) and high atmospheric water demand (vapor pressure deficit, VPD). However, the relative role of SM and VPD in limiting ecosystem production remains debated and is difficult to disentangle, as SM and VPD are coupled through land-atmosphere interactions, hindering the ability to predict ecosystem responses to dryness. Here, we combine satellite observations of solar-induced fluorescence with estimates of SM and VPD and show that SM is the dominant driver of dryness stress on ecosystem production across more than 70% of vegetated land areas with valid data. Moreover, after accounting for SM-VPD coupling, VPD effects on ecosystem production are much smaller across large areas. We also find that SM stress is strongest in semi-arid ecosystems. Our results clarify a longstanding question and open new avenues for improving models to allow a better management of drought risk.
Disentangling the relative effects of soil moisture and vapor pressure deficit on photosynthesis in dryland Central Asia
The effect of vapor pressure deficit on maize transpiration response to a drying soil
DOI:10.1023/A:1014947422468 URL [本文引用: 1]
Limitation of soil moisture on the response of transpiration to vapor pressure deficit in a subtropical coniferous plantation subjected to seasonal drought
Investigating soil moisture-climate interactions in a changing climate: A review
DOI:10.1016/j.earscirev.2010.02.004 URL [本文引用: 2]
Mean annual GPP of Europe derived from its water balance
Coupled estimation of 500 m and 8-day resolution global evapotranspiration and gross primary production in 2002-2017
DOI:10.1016/j.rse.2018.12.031 URL [本文引用: 1]
Large influence of atmospheric vapor pressure deficit on ecosystem production efficiency
Assessment of the importance of increasing temperature and decreasing soil moisture on global ecosystem productivity using solar-induced chlorophyll fluorescence
DOI:10.1111/gcb.v28.6 URL [本文引用: 4]
Widespread shift from ecosystem energy to water limitation with climate change
DOI:10.1038/s41558-022-01403-8
[本文引用: 1]
Terrestrial ecosystems are essential for food and water security and CO2 uptake. Ecosystem function is dependent on the availability of soil moisture, yet it is unclear how climate change will alter soil moisture limitation on vegetation. Here we use an ecosystem index that distinguishes energy and water limitations in Earth system model simulations to show a widespread regime shift from energy to water limitation between 1980 and 2100. This shift is found in both space and time. While this is mainly related to a reduction in energy-limited regions associated with increasing incoming shortwave radiation, the largest shift towards water limitation is found in regions where incoming shortwave radiation increases are accompanied by soil moisture decreases. We therefore demonstrate a widespread regime shift in ecosystem function that is stronger than implied by individual trends in incoming shortwave radiation, soil moisture and terrestrial evaporation, with important implications for future ecosystem services.
Amplification effect of urbanization on atmospheric aridity over China under past global warming
Below-ground determinants and ecological implications of shrub species' degree of isohydry in subtropical pine plantations
DOI:10.1111/nph.16502
PMID:32096212
[本文引用: 1]
The degree of plant iso/anisohydry is a popular framework for characterising species-specific drought responses. However, we know little about associations between below-ground and above-ground hydraulic traits as well as the broader ecological implications of this framework. For 24 understory shrub species in seasonally dry subtropical coniferous plantations, we investigated contributions of the degree of isohydry to species' resource economy strategies, abundance, and importance value, and quantified the hydraulic conductance (K ) of above-ground and below-ground organs, magnitude of deep water acquisition (WA ), shallow absorptive root traits (diameter, specific root length, tissue density), and resource-use efficiencies (A, maximum photosynthesis rate; PNUE, photosynthetic nitrogen-use efficiency). The extreme isohydric understory species had lower wood density (a proxy for higher growth rates) because their higher WA and whole-plant K allowed higher A and PNUE, and thus did not necessarily show lower abundance and importance values. Although species' K was coordinated with their water foraging capacity in shallow soil, the more acquisitive deep roots were more crucial than shallow roots in shaping species' extreme isohydric behaviour. Our results provide new insights into the mechanisms through which below-ground hydraulic traits, especially those of deep roots, determine species' degree of isohydry and economic strategies.© 2020 The Authors. New Phytologist © 2020 New Phytologist Trust.
A 1 km daily soil moisture dataset over China using in situ measurement and machine learning
DOI:10.5194/essd-14-5267-2022
URL
[本文引用: 2]
. High-quality gridded soil moisture products are essential for many Earth system science applications, while the recent reanalysis and\nremote sensing soil moisture data are often available at coarse resolution\nand remote sensing data are only for the surface soil. Here, we present a 1 km resolution long-term dataset of soil moisture derived through machine\nlearning trained by the in situ measurements of 1789 stations over China, named SMCI1.0 (Soil Moisture of China by in situ data, version 1.0). Random forest is used as a robust machine learning approach to predict soil moisture using ERA5-Land time series, leaf area index, land\ncover type, topography and soil properties as predictors. SMCI1.0 provides\n10-layer soil moisture with 10 cm intervals up to 100 cm deep at daily\nresolution over the period 2000–2020. Using in situ soil moisture as the benchmark, two independent experiments were conducted to evaluate the estimation\naccuracy of SMCI1.0: year-to-year (ubRMSE ranges from 0.041 to 0.052 and R ranges from 0.883 to 0.919) and station-to-station experiments (ubRMSE ranges from 0.045 to 0.051 and R ranges from 0.866 to 0.893). SMCI1.0 generally has advantages over other gridded soil moisture products, including ERA5-Land, SMAP-L4, and SoMo.ml. However, the high errors of soil moisture are often located in the North China Monsoon Region. Overall, the highly accurate estimations of both the\nyear-to-year and station-to-station experiments ensure the applicability of\nSMCI1.0 to study the spatial–temporal patterns. As SMCI1.0 is based on in situ data, it can be a useful complement to existing model-based and satellite-based soil moisture datasets for various hydrological,\nmeteorological, and ecological analyses and models. The DOI link for the dataset is http://dx.doi.org/10.11888/Terre.tpdc.272415 (Shangguan et al., 2022).\n
Spatial-temporal variabilities of the contrasting hydrometeorological extremes and the impacts on vegetation growth over the Yangtze River basin
长江流域极端水文气象事件时空变化特征及其对植被的影响
Improving land surface temperature modeling for dry land of China
Magnitude and variability of land evaporation and its components at the global scale
DOI:10.5194/hess-15-967-2011
URL
[本文引用: 1]
. A process-based methodology is applied to estimate land-surface evaporation from multi-satellite information. GLEAM (Global Land-surface Evaporation: the Amsterdam Methodology) combines a wide range of remotely-sensed observations to derive daily actual evaporation and its different components. Soil water stress conditions are defined from a root-zone profile of soil moisture and used to estimate transpiration based on a Priestley and Taylor equation. The methodology also derives evaporationfrom bare soil and snow sublimation. Tall vegetation rainfall interception is independently estimated by means of the Gash analytical model. Here, GLEAM is applied daily, at global scale and a quarter degree resolution. Triple collocation is used to calculate the error structure of the evaporation estimates and test the relative merits of two different precipitation inputs. The spatial distribution of evaporation – and its different components – is analysed to understand the relative importance of each component over different ecosystems. Annual land evaporation is estimated as 67.9 × 10³ km3, 80% corresponding to transpiration, 11% to interception loss, 7% to bare soil evaporation and 2% snow sublimation. Results show that rainfall interception plays an important role in the partition of precipitation into evaporation and water available for runoff at a continental scale. This study gives insights into the relative importance of precipitation and net radiation in driving evaporation, and how the seasonal influence of these controls varies over different regions. Precipitation is recognised as an important factor driving evaporation, not only in areas that have limited soil water availability, but also in areas of high rainfall interception and low available energy.\n
El Niño-La Niña cycle and recent trends in continental evaporation
DOI:10.1038/nclimate2068 [本文引用: 1]
GLEAM v3: Satellite-based land evaporation and root-zone soil moisture
DOI:10.5194/gmd-10-1903-2017
URL
[本文引用: 2]
. The Global Land Evaporation Amsterdam Model (GLEAM) is a set of algorithms dedicated to the estimation of terrestrial evaporation and root-zone soil moisture from satellite data. Ever since its development in 2011, the model has been regularly revised, aiming at the optimal incorporation of new satellite-observed geophysical variables, and improving the representation of physical processes. In this study, the next version of this model (v3) is presented. Key changes relative to the previous version include (1) a revised formulation of the evaporative stress, (2) an optimized drainage algorithm, and (3) a new soil moisture data assimilation system. GLEAM v3 is used to produce three new data sets of terrestrial evaporation and root-zone soil moisture, including a 36-year data set spanning 1980–2015, referred to as v3a (based on satellite-observed soil moisture, vegetation optical depth and snow-water equivalent, reanalysis air temperature and radiation, and a multi-source precipitation product), and two satellite-based data sets. The latter share most of their forcing, except for the vegetation optical depth and soil moisture, which are based on observations from different passive and active C- and L-band microwave sensors (European Space Agency Climate Change Initiative, ESA CCI) for the v3b data set (spanning 2003–2015) and observations from the Soil Moisture and Ocean Salinity (SMOS) satellite in the v3c data set (spanning 2011–2015). Here, these three data sets are described in detail, compared against analogous data sets generated using the previous version of GLEAM (v2), and validated against measurements from 91 eddy-covariance towers and 2325 soil moisture sensors across a broad range of ecosystems. Results indicate that the quality of the v3 soil moisture is consistently better than the one from v2: average correlations against in situ surface soil moisture measurements increase from 0.61 to 0.64 in the case of the v3a data set and the representation of soil moisture in the second layer improves as well, with correlations increasing from 0.47 to 0.53. Similar improvements are observed for the v3b and c data sets. Despite regional differences, the quality of the evaporation fluxes remains overall similar to the one obtained using the previous version of GLEAM, with average correlations against eddy-covariance measurements ranging between 0.78 and 0.81 for the different data sets. These global data sets of terrestrial evaporation and root-zone soil moisture are now openly available at www.GLEAM.eu and may be used for large-scale hydrological applications, climate studies, or research on land–atmosphere feedbacks.\n
A three-source satellite algorithm for retrieving all-sky evapotranspiration rate using combined optical and microwave vegetation index at twenty AsiaFlux sites
Partitioning of evapotranspiration in remote sensing-based models
The WACMOS-ET project (Part 2): Evaluation of global terrestrial evaporation data sets
DOI:10.5194/hess-20-823-2016
URL
[本文引用: 1]
. The WAter Cycle Multi-mission Observation Strategy – EvapoTranspiration (WACMOS-ET) project aims to advance the development of land evaporation estimates on global and regional scales. Its main objective is the derivation, validation, and intercomparison of a group of existing evaporation retrieval algorithms driven by a common forcing data set. Three commonly used process-based evaporation methodologies are evaluated: the Penman–Monteith algorithm behind the official Moderate Resolution Imaging Spectroradiometer (MODIS) evaporation product (PM-MOD), the Global Land Evaporation Amsterdam Model (GLEAM), and the Priestley–Taylor Jet Propulsion Laboratory model (PT-JPL). The resulting global spatiotemporal variability of evaporation, the closure of regional water budgets, and the discrete estimation of land evaporation components or sources (i.e. transpiration, interception loss, and direct soil evaporation) are investigated using river discharge data, independent global evaporation data sets and results from previous studies. In a companion article (Part 1), Michel et al. (2016) inspect the performance of these three models at local scales using measurements from eddy-covariance towers and include in the assessment the Surface Energy Balance System (SEBS) model. In agreement with Part 1, our results indicate that the Priestley and Taylor products (PT-JPL and GLEAM) perform best overall for most ecosystems and climate regimes. While all three evaporation products adequately represent the expected average geographical patterns and seasonality, there is a tendency in PM-MOD to underestimate the flux in the tropics and subtropics. Overall, results from GLEAM and PT-JPL appear more realistic when compared to surface water balances from 837 globally distributed catchments and to separate evaporation estimates from ERA-Interim and the model tree ensemble (MTE). Nonetheless, all products show large dissimilarities during conditions of water stress and drought and deficiencies in the way evaporation is partitioned into its different components. This observed inter-product variability, even when common forcing is used, suggests that caution is necessary in applying a single data set for large-scale studies in isolation. A general finding that different models perform better under different conditions highlights the potential for considering biome- or climate-specific composites of models. Nevertheless, the generation of a multi-product ensemble, with weighting based on validation analyses and uncertainty assessments, is proposed as the best way forward in our long-term goal to develop a robust observational benchmark data set of continental evaporation.\n
Remote sensing of solar-induced chlorophyll fluorescence (SIF) in vegetation: 50 years of progress
Sun-induced fluorescence closely linked to ecosystem transpiration as evidenced by satellite data and radiative transfer models
Modeling transpiration with sun-induced chlorophyll fluorescence observations via carbon-water coupling methods
Successfully applied in the carbon research area, sun-induced chlorophyll fluorescence (SIF) has raised the interest of researchers from the water research domain. However, current works focused on the empirical relationship between SIF and plant transpiration (T), while the mechanistic linkage between them has not been fully explored. Two mechanism methods were developed to estimate T via SIF, namely the water-use efficiency (WUE) method and conductance method based on the carbon–water coupling framework. The T estimated by these two methods was compared with T partitioned from eddy covariance instrument measured evapotranspiration at four different sites. Both methods showed good performance at the hourly (R2 = 0.57 for the WUE method and 0.67 for the conductance method) and daily scales (R2 = 0.67 for the WUE method and 0.78 for the conductance method). The developed mechanism methods provide theoretical support and have a great potential basis for deriving ecosystem T by satellite SIF observations.
A model for estimating transpiration from remotely sensed solar-induced chlorophyll fluorescence
Exploring the potential of satellite solar-induced fluorescence to constrain global transpiration estimates
The opening and closing of plant stomata regulates the global water, carbon and energy cycles. Biophysical feedbacks on climate are highly dependent on transpiration, which is mediated by vegetation phenology and plant responses to stress conditions. Here, we explore the potential of satellite observations of solar-induced chlorophyll fluorescence (SIF)—normalized by photosynthetically-active radiation (PAR)—to diagnose the ratio of transpiration to potential evaporation (‘transpiration efficiency’, τ). This potential is validated at 25 eddy-covariance sites from seven biomes worldwide. The skill of the state-of-the-art land surface models (LSMs) from the eartH2Observe project to estimate τ is also contrasted against eddy-covariance data. Despite its relatively coarse (0.5°) resolution, SIF/PAR estimates, based on data from the Global Ozone Monitoring Experiment 2 (GOME-2) and the Clouds and Earth’s Radiant Energy System (CERES), correlate to the in situ τ significantly (average inter-site correlation of 0.59), with higher correlations during growing seasons (0.64) compared to decaying periods (0.53). In addition, the skill to diagnose the variability of in situ τ demonstrated by all LSMs is on average lower, indicating the potential of SIF data to constrain the formulations of transpiration in global models via, e.g., data assimilation. Overall, SIF/PAR estimates successfully capture the effect of phenological changes and environmental stress on natural ecosystem transpiration, adequately reflecting the timing of this variability without complex parameterizations.
CO2 fertilization of terrestrial photosynthesis inferred from site to global scales
Potential of solar-induced chlorophyll fluorescence to estimate transpiration in a temperate forest
DOI:10.1016/j.agrformet.2018.01.017 URL [本文引用: 2]
A global 0.05-degree product of solar-induced chlorophyll fluorescence derived from OCO-2, MODIS, and reanalysis data
Solar-induced chlorophyll fluorescence (SIF) brings major advancements in measuring terrestrial photosynthesis. Several recent studies have evaluated the potential of SIF retrievals from the Orbiting Carbon Observatory-2 (OCO-2) in estimating gross primary productivity (GPP) based on GPP data from eddy covariance (EC) flux towers. However, the spatially and temporally sparse nature of OCO-2 data makes it challenging to use these data for many applications from the ecosystem to the global scale. Here, we developed a new global ‘OCO-2’ SIF data set (GOSIF) with high spatial and temporal resolutions (i.e., 0.05°, 8-day) over the period 2000–2017 based on a data-driven approach. The predictive SIF model was developed based on discrete OCO-2 SIF soundings, remote sensing data from the Moderate Resolution Imaging Spectroradiometer (MODIS), and meteorological reanalysis data. Our model performed well in estimating SIF (R2 = 0.79, root mean squared error (RMSE) = 0.07 W m−2 μm−1 sr−1). The model was then used to estimate SIF for each 0.05° × 0.05° grid cell and each 8-day interval for the study period. The resulting GOSIF product has reasonable seasonal cycles, and captures the similar seasonality as both the coarse-resolution OCO-2 SIF (1°), directly aggregated from the discrete OCO-2 soundings, and tower-based GPP. Our SIF estimates are highly correlated with GPP from 91 EC flux sites (R2 = 0.73, p < 0.001). They capture the expected spatial and temporal patterns and also have remarkable ability to highlight the crop areas with the highest daily productivity across the globe. Our product also allows us to examine the long-term trends in SIF globally. Compared with the coarse-resolution SIF that was directly aggregated from OCO-2 soundings, GOSIF has finer spatial resolution, globally continuous coverage, and a much longer record. Our GOSIF product is valuable for assessing terrestrial photosynthesis and ecosystem function, and benchmarking terrestrial biosphere and Earth system models.
Concurrent and lagged effects of spring greening on seasonal carbon gain and water loss across the Northern Hemisphere
DOI:10.1007/s00484-020-01913-0
PMID:32303899
[本文引用: 1]
Spring greening has been widely observed across the Northern Hemisphere (NH) using a remotely sensed vegetation index (e.g., the normalized difference vegetation index, NDVI). However, there is still a debate on the ecological effects of spring greening on seasonal carbon and water budgets. This study jointly investigated the concurrent and lagged effects of spring greening on carbon gain (gross primary productivity, GPP) and water loss (evapotranspiration, ET) in the summer-active ecosystems at mid and high latitudes of NH using remote sensing and multimodel ensemble data during 1982-2013. The results showed that the collective promotion of spring greening to concurrent GPP and ET is widespread despite variations in magnitude and significance. Both beneficial and adverse lagged effects of spring greening on summer GPP commonly appear with an obvious spatial heterogeneity and difference among climate-plant types. However, the expected significant suppression of spring greening to summer GPP was rarely observed even in the areas where spring ET was significantly promoted by spring greening. Nevertheless, when drought was taken into account, the response patterns of spring water use to spring greening varied to some extent, and the adverse lagged effect of spring greening to summer GPP appeared or strengthened in some regions, especially during the years with dry summer. Given the predicted warming of the climate and more frequent climatic extremes, the adverse effect of spring greening should be given more attention.
A shift in the dominant role of atmospheric vapor pressure deficit and soil moisture on vegetation greening in China
Large influence of soil moisture on long-term terrestrial carbon uptake
DOI:10.1038/s41586-018-0848-x [本文引用: 1]
The temperature response of C3 and C4 photosynthesis
Atmospheric dryness reduces photosynthesis along a large range of soil water deficits
Both low soil water content (SWC) and high atmospheric dryness (vapor pressure deficit, VPD) can negatively affect terrestrial gross primary production (GPP). The sensitivity of GPP to soil versus atmospheric dryness is difficult to disentangle, however, because of their covariation. Using global eddy-covariance observations, here we show that a decrease in SWC is not universally associated with GPP reduction. GPP increases in response to decreasing SWC when SWC is high and decreases only when SWC is below a threshold. By contrast, the sensitivity of GPP to an increase of VPD is always negative across the full SWC range. We further find canopy conductance decreases with increasing VPD (irrespective of SWC), and with decreasing SWC on drier soils. Maximum photosynthetic assimilation rate has negative sensitivity to VPD, and a positive sensitivity to decreasing SWC when SWC is high. Earth System Models underestimate the negative effect of VPD and the positive effect of SWC on GPP such that they should underestimate the GPP reduction due to increasing VPD in future climates.© 2022. The Author(s).
Severe summer heatwave and drought strongly reduced carbon uptake in Southern China
Increasing heatwave and drought events can potentially alter the carbon cycle. Few studies have investigated the impacts of hundred-year return heatwaves and droughts, as those events are rare. In the summer of 2013, southern China experienced its strongest drought and heatwave on record for the past 113 years. We show that the record-breaking heatwave and drought lasted two months (from July to August), significantly reduced the satellite-based vegetation index and gross primary production, substantially altered the regional carbon cycle and produced the largest negative crop yield anomaly since 1960. The event resulted in a net reduction of 101.54 Tg C in carbon sequestration in the region during these two months, which was 39–53% of the annual net carbon sink of China’s terrestrial ecosystems (190–260 Tg C yr−1). Moreover, model experiments showed that heatwaves and droughts consistently decreased ecosystem vegetation primary production but had opposite impacts on ecosystem respiration (TER), with increased TER by 6.78 ± 2.15% and decreased TER by 15.34 ± 3.57% assuming only changed temperature and precipitation, respectively. In light of increasing frequency and severity of future heatwaves and droughts, our study highlights the importance of accounting for the impacts of heatwaves and droughts in assessing the carbon sequestration in terrestrial ecosystems.
A generic model of forest canopy conductance dependent on climate, soil water availability and leaf area index
DOI:10.1051/forest:2000158 URL [本文引用: 1]
Hysteresis loops between canopy conductance of grapevines and meteorological variables in an oasis ecosystem
Uncovering the critical soil moisture thresholds of plant water stress for European ecosystems
DOI:10.1111/gcb.v28.6 URL [本文引用: 1]
Critical soil moisture thresholds of plant water stress in terrestrial ecosystems
\n Plant water stress occurs at the point when soil moisture (SM) limits transpiration, defining a critical SM threshold (θ\n crit\n ). Knowledge of the spatial distribution of θ\n crit\n is crucial for future projections of climate and water resources. Here, we use global eddy covariance observations to quantify θ\n crit\n and evaporative fraction (EF) regimes. Three canonical variables describe how EF is controlled by SM: the maximum EF (EF\n max\n ), θ\n crit\n, and slope (S) between EF and SM. We find systematic differences of these three variables across biomes. Variation in θ\n crit\n, S, and EF\n max\n is mostly explained by soil texture, vapor pressure deficit, and precipitation, respectively, as well as vegetation structure. Dryland ecosystems tend to operate at low θ\n crit\n and show adaptation to water deficits. The negative relationship between θ\n crit\n and S indicates that dryland ecosystems minimize θ\n crit\n through mechanisms of sustained SM extraction and transport by xylem. Our results further suggest an optimal adaptation of local EF-SM response that maximizes growing-season evapotranspiration and photosynthesis.\n
Sustainable irrigation based on co-regulation of soil water supply and atmospheric evaporative demand
Irrigation is an important adaptation to reduce crop yield loss due to water stress from both soil water deficit (low soil moisture) and atmospheric aridity (high vapor pressure deficit, VPD). Traditionally, irrigation has primarily focused on soil water deficit. Observational evidence demonstrates that stomatal conductance is co-regulated by soil moisture and VPD from water supply and demand aspects. Here we use a validated hydraulically-driven ecosystem model to reproduce the co-regulation pattern. Specifically, we propose a plant-centric irrigation scheme considering water supply-demand dynamics (SDD), and compare it with soil-moisture-based irrigation scheme (management allowable depletion, MAD) for continuous maize cropping systems in Nebraska, United States. We find that, under current climate conditions, the plant-centric SDD irrigation scheme combining soil moisture and VPD, could significantly reduce irrigation water use (-24.0%) while maintaining crop yields, and increase economic profits (+11.2%) and irrigation water productivity (+25.2%) compared with MAD, thus SDD could significantly improve water sustainability.© 2021. The Author(s).
Transpiration drivers of high-elevation five-needle pines (Pinus longaeva and Pinus flexilis) in sky-island ecosystems of the North American Great Basin
Mechanisms of plant survival and mortality during drought: Why do some plants survive while others succumb to drought
DOI:10.1111/j.1469-8137.2008.02436.x
PMID:18422905
[本文引用: 1]
Severe droughts have been associated with regional-scale forest mortality worldwide. Climate change is expected to exacerbate regional mortality events; however, prediction remains difficult because the physiological mechanisms underlying drought survival and mortality are poorly understood. We developed a hydraulically based theory considering carbon balance and insect resistance that allowed development and examination of hypotheses regarding survival and mortality. Multiple mechanisms may cause mortality during drought. A common mechanism for plants with isohydric regulation of water status results from avoidance of drought-induced hydraulic failure via stomatal closure, resulting in carbon starvation and a cascade of downstream effects such as reduced resistance to biotic agents. Mortality by hydraulic failure per se may occur for isohydric seedlings or trees near their maximum height. Although anisohydric plants are relatively drought-tolerant, they are predisposed to hydraulic failure because they operate with narrower hydraulic safety margins during drought. Elevated temperatures should exacerbate carbon starvation and hydraulic failure. Biotic agents may amplify and be amplified by drought-induced plant stress. Wet multidecadal climate oscillations may increase plant susceptibility to drought-induced mortality by stimulating shifts in hydraulic architecture, effectively predisposing plants to water stress. Climate warming and increased frequency of extreme events will probably cause increased regional mortality episodes. Isohydric and anisohydric water potential regulation may partition species between survival and mortality, and, as such, incorporating this hydraulic framework may be effective for modeling plant survival and mortality under future climate conditions.
Large and projected strengthening moisture limitation on end-of-season photosynthesis
DOI:10.1073/pnas.1914436117
PMID:32284402
[本文引用: 1]
Terrestrial photosynthesis is regulated by plant phenology and environmental conditions, both of which experienced substantial changes in recent decades. Unlike early-season photosynthesis, which is mostly driven by temperature or wet-season onset, late-season photosynthesis can be limited by several factors and the underlying mechanisms are less understood. Here, we analyze the temperature and water limitations on the ending date of photosynthesis (EOP), using data from both remote-sensing and flux tower-based measurements. We find a contrasting spatial pattern of temperature and water limitations on EOP. The threshold separating these is determined by the balance between energy availability and soil water supply. This coordinated temperature and moisture regulation can be explained by "law of minimum," i.e., as temperature limitation diminishes, higher soil water is needed to support increased vegetation activity, especially during the late growing season. Models project future warming and drying, especially during late season, both of which should further expand the water-limited regions, causing large variations and potential decreases in photosynthesis.
Divergent impacts of atmospheric water demand on gross primary productivity in three typical ecosystems in China
