

1 引言
植被是陆地生态系统的主要组成部分,对全球碳平衡调节、降低温室气体浓度、维护全球气候稳定有着不可替代的作用[1]。植被对水资源的可利用性严重影响着陆地生态系统的水循环、碳交换和能量流动[2]。在全球气温持续升高的背景下,水分蒸发、植物蒸腾、水汽输送等水循环过程发生了变化[3],导致饱和蒸气压亏缺(Vapor Pressure Deficit, VPD)的提升和土壤含水量减少,植被生长受到了更多的水分限制,生态系统稳定性产生了严重的影响[4⇓-6],全球植被持续变绿并且植被生产力提高也会增加植被的需水量[7],并且在未来的植被水分限制可能会进一步加剧。越来越频繁发生的极端干旱-热浪复合事件和更强的地表辐射也可能会影响地区的地表植被覆盖和植物生长[8],这也是陆地生态系统净初级生力变化的主要推动力之一[9],从而导致“碳—气候”正反馈调节的改变进一步加速全球气候变暖趋势[10⇓-12],进一步加剧水资源压力[13]。因此,在多时间尺度和较大的空间尺度上量化评估植被的水分约束变化具有很大的挑战性,但这对于深入理解气候持续变暖背景下的水资源限制对区域植被的影响具有重要意义。
研究表明,干旱是由物理过程驱动的陆—气相互作用耦合的事件,温度升高往往会导致水资源限制的加剧[14]。从已有研究中发现,水分的减少主要分为正向影响和负面影响[15],一方面在热带雨林或温度为植被生产力变化主要限制因素的高纬度地区一定程度上的降水减少会有利于温度的提升从而促进该区域植被的光合作用,提升植被生产力[16-17];另一方面全球大多数地区干旱对植被存在不同程度的负面影响[18]。干旱对植被的负面影响可能表现为光合作用减弱、生物量减少以及死亡率增加等方面[10]。干旱对植被的影响是受多种植被生理和环境因素共同作用的复杂过程[19]。植被生长的需水量和缺水适应能力决定了植被的抗旱性[13]。因为植被生长期内不同的生长阶段对水分的需求程度都不相同[20],植被对干湿变化响应也就存在很大差异。因此,量化干湿变化对植被生产力的影响对于理解陆地生态系统碳汇能力至关重要。
已有研究记录了植被生产力对缺水的响应[19]。饱和蒸气压亏缺的急剧增加抵消了CO2对植被的施肥效应,对全球植被的生长起到了负面影响[21]。同时研究指出植被生长的水资源限制有增加趋势,尤其在许多半干旱和干旱地区植被对土壤水分的敏感性明显增加[22]。中国大部分地区处于季风区,气温和降水量呈现出显著的季节性差异,加之中国复杂地形的影响,导致中国干旱的发生愈加复杂,成为中国最常见的自然灾害之一[23-24]。2010年的极端干旱对中国西南地区植被碳汇产生了极大的限制[25]。此外,研究也指出近期陆地生态系统碳汇可能正在发生转变,从上升转为下降的趋势[26],这可能与水分对植被生长的限制有着密不可分的联系[27⇓-29]。水分的变化对陆地生态系统碳汇发挥着举足轻重的作用,中国以6.5%的全球植被覆盖区贡献了全球的10%~31%陆地碳汇[30],中国在全球陆地生态系统碳汇中发挥了重要作用,且研究表明未来碳汇潜力将有更大提升[31-32]。尽管之前学者已经对植被生长中水分亏缺的各种影响进行了较为详细的研究,但随着全球持续变暖,水资源的时空分配发生改变[3],但干湿变化对中国植被生长的影响长期变化趋势及其存在的空间差异尚不明朗,需要对植被水分胁迫的动态变化进行综合研究。因此,在全球持续变暖情况下,量化植被生产力的水分约束变化趋势对于理解生态系统稳定性,并对开发陆地表面模型具有重要意义,同时可以促进对未来陆地碳汇和全球气候的更精准预测。
因此,本文使用标准化降水蒸散指数(Standardized Precipitation Evapotranspiration Index, SPEI)量化干湿程度,使用植被总初级生产力(Gross Primary Production, GPP)作为植被生产力的量化植被指数,定量评估了1982—2018年中国植被生产力对干湿变化响应的长期变化趋势,揭示了干湿变化对植被生产力影响强度、植被响应时间尺度及其响应时间阈值的变化趋势,以为评估未来气候对陆地生态系统碳汇变化趋势和制定应对气候变化方案提供中国智慧和数据支撑。
2 研究方法与数据来源
2.1 数据来源与预处理
图1
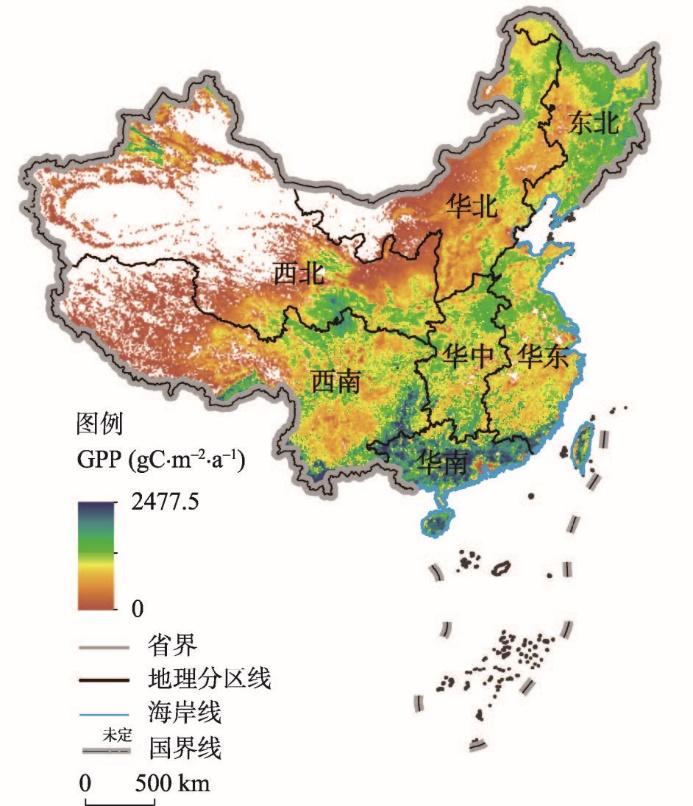
图1
1982—2018年中国植被总初级生产力均值空间分布
注:基于自然资源部标准地图服务网站GS(2020)4619号标准地图制作,底图边界无修改。
Fig. 1
Spatial distribution of gross primary production of vegetation in China from 1982 to 2018
(1)植被总初级生产力
植被的光合作用在陆地生态系统水—碳耦合关系中发挥了极为关键的作用。本文GPP数据集源自国家青藏高原数据中心的全球生态系统GPP数据集(
式中:
(2)气象数据
气温和降水量均来自国家青藏高原数据中心(
(3)地表覆盖分布
2.2 研究方法
(1)相关性计算
采用公式(2)对1982—2018年的月GPP与多时间尺度SPEI进行像元尺度的相关分析,判断GPP与多时间尺度SPEI之间相关性强弱。计算公式如下:
式中:
(2)SPEI指数
标准化降水蒸散指数(SPEI)[38]是一种被广泛应用于衡量水平衡的量化指标,SPEI指数值越大表示越湿润,相反SPEI指数值越小表示越干旱。SPEI指数是较为优秀的衡量干湿状况的一种量化指标,不仅具备帕尔默干旱指数(Palmer Drought Severity Index, PDSI)[39]对温度响应灵敏性的优势,也具有标准化降水指数(Standardized Precipitation Index, SPI)[40]多时间尺度的优点,适用于在全球变暖的背景下干湿状况量化评估,并且SPEI指数在全球很多地区对干湿状况有着非常良好的评估效果[41⇓-43]。因此本文选择SPEI指数用于量化中国干湿状况。
SPEI指数采用Thornthwaite方法计算得到潜在蒸散发,进一步通过log-logistic概率分布对数值序列(降水量与潜在蒸散发的差值)进行拟合。将概率分布函数进行标准化正态分布计算,从而得到SPEI指数。1982—2018年多尺度SPEI(1~24个月时间尺度)计算结果为月数据集,空间分辨率为0.1°×0.1°。详细计算过程参考文献[38]。
(3)植被生产力对干湿变化响应时间尺度及阈值判别
式中:
同时,本文为了揭示植被生长对干湿变化响应时间的阈值,将GPP异常与多时间尺度SPEI(1~24个月)呈显著正相关的最小SPEI时间尺度表示为植被生产力对干旱化响应最小响应时间;将GPP异常与多时间尺度SPEI(1~24个月)呈显著负相关的最大SPEI时间尺度定义为植被对水分过剩响应最长响应时间[15]。以此得出植被生产力抵抗干湿变化的时间尺度阈值。
植被对水减少显著影响最大区域为GPP异常与多时间尺度SPEI(1~24个月)之间有显著正相关(p < 0.05)的复合区域,即:当在多时间尺度SPEI至少有一个时间尺度SPEI与GPP呈显著正相关时,则表示为该区域存在受干旱化而显著制约的可能;同样,植被的最大水过剩区域为GPP异常与多时间尺度SPEI之间有显著负相关(p < 0.05)的复合区域,即:当在多时间尺度SPEI至少有一个时间尺度SPEI与GPP呈显著负相关时,则表示为该区域植被存在受水分过剩而显著制约的可能[15]。
本文分别量化了干湿变化抑制植被生产力的时间尺度阈值,即干旱化抑制植被生产力的最小响应时间尺度和水分过剩抑制植被生产力的最大时间尺度,并且在5 a的滑动窗口的基础上,揭示干湿变化抑制植被生产力时间尺度阈值的变化趋势。
(4)Theil-Sen Median趋势诊断法
通过Sen斜率估计方法判断GPP和SPEI相关系数及时间尺度变化趋势。这是一种稳健的非参数统计的趋势计算方法,计算效率较高,并且对于异常值和缺测的噪音值不敏感,因此常被用于长时间序列数据的趋势分析。
式中:
(5)Mann-Kendall趋势显著性检验
本文采用Mann-Kendall法对变化趋势进行显著性检验(M-K趋势检验)。M-K趋势检验是一种分参数的时间序列趋势检验方法,其优势为不需要检测值服从正态分布,同时其检测结果具有较强的稳定性。M-K法计算过程如下:
式中:
3 结果与讨论
3.1 植被生产力对干湿变化的响应关系
本文量化评估了植被生产力与SPEI之间的关系。① 当GPP与SPEI之间的呈显著正相关时(p < 0.05)意味着越湿润而植被生产力越高,越干旱而植被生产力越低,表明水分减少可能会显著抑制植被生产力的提升,这种情况的区域称为水分亏缺显著抑制区; ② 当GPP与SPEI之间呈显著负相关时(p < 0.05)意味着越湿润而植被生产力越低,而在一定程度的较干旱的条件下植被生产力反而有一定的提升,表明在这种情况下植被生产力会由于水分过多而抑制植被的光合作用而形成水涝,亦或者在湿润的条件下出现温度较低和太阳辐射减少的情况下而抑制了植被生产力的提升,本文中将出现这种情况下的区域称为水分过剩显著抑制区;③ 当GPP与SPEI之间呈非显著关系时(p > 0.05)表明植被生产力不受干湿变化的约束。
1982—2018年的月GPP异常与SPEI-3之间相关系数为-0.34~0.43,平均相关系数为0.06(图2a),相关系数较低是由于植被生产力一部分受水分减少制约(GPP与SPEI正相关),一部分受水分过剩制约(GPP与SPEI负相关),从而导致平均相关系数较低。GPP与SPEI-3之间呈正相关的区域占比为72.07%,其中达到显著正相关的区域占比为31.13%,主要分布在中国北方大部分地区(内蒙古、陕西、山西、河北、北京和天津等大部分区域)和中国的西南地区(云南大部分地区和贵州部分地区);GPP与SPEI-3之间呈负相关的区域占比为27.93%,其中达到显著负相关的区域占比为5.32%,主要分布在大兴安岭地区和青藏高原地区。
图2
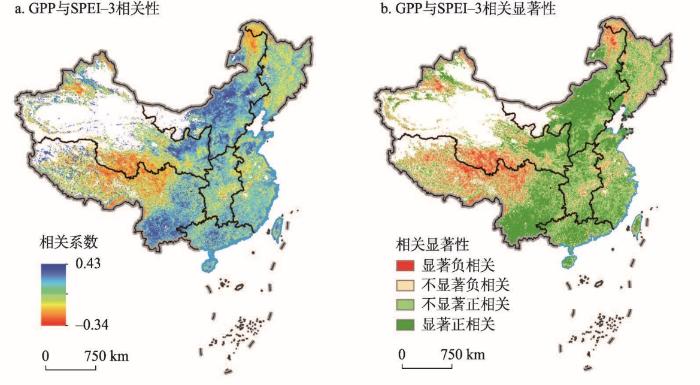
图2
1982—2018年的月GPP异常与SPEI-3相关系数及相关显著性的空间分布
注:基于自然资源部标准地图服务网站GS(2020)4619号标准地图制作,底图边界无修改。
Fig. 2
Spatial distribution of correlation coefficients and significance between GPP anomaly and SPEI-3 in China from 1982 to 2018
从不同地理分区对比得出(图3),华北地区干湿变化对植被影响最为显著,GPP与SPEI-3平均相关系数为0.12,显著正相关区域占比为54.10%;其次为华南、华中、西南、西北地区;而东北地区干湿变化对植被生产力影响最弱,显著正相关区域占比仅为4.22%。
图3
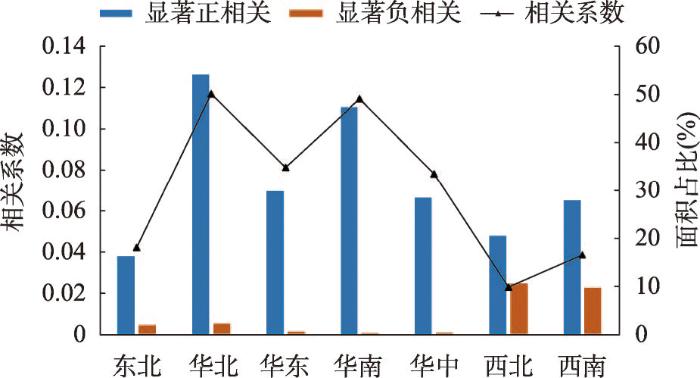
图3
1982—2018年不同地理分区月GPP异常与SPEI-3相关系数和相关显著性占比
Fig. 3
Correlation coefficients and correlation significance percentages of monthly GPP anomalies with SPEI-3 in different geographical regions of China from1982-2018
以上表明,干旱化抑制植被生产力的区域占比达70%以上,其中显著抑制区将近 1/3,而水分过剩抑制植被生产力的面积占比较小,意味着中国大部分区域植被生产力会受到水分减少的影响。
3.2 植被生产力对干湿变化的响应程度变化特征
1982—2018年水分对中国植被生产力有明显的抑制作用(图2)。但随着全球气温持续升高,已有研究表明干旱程度可能将更加严重[4,8]。本文揭示1982—2018年干湿变化对植被生产的影响程度的变化趋势,即GPP与SPEI-3相关系数绝对值增大(slope|r(GPP, SPEI-3)| > 0)表明干湿变化对植被生产力影响程度有增强的趋势;反之表明干湿变化对植被生产力影响程度为减弱趋势。|r(GPP, SPEI-3)|变化范围是-0.24~0.19 /10a,其中slope|r(GPP, SPEI-3)| > 0的区域面积占比为45.79%,主要分布在东北、华北的西部和华中的北部地区(图4)。这可能与温度升高导致植被蒸腾增加和大气饱和蒸气压亏缺增大(VPD),导致植被生长受到水分制约增强[54-55]。而slope|r(GPP, SPEI-3)| < 0的区域面积占比为54.21%,主要分布在华北平原和长江下游平原的大部分地区。这可能与这些区域农作物水利设施建设有关,丰富的水利设施减弱了水分对植被生长的限制。
图4
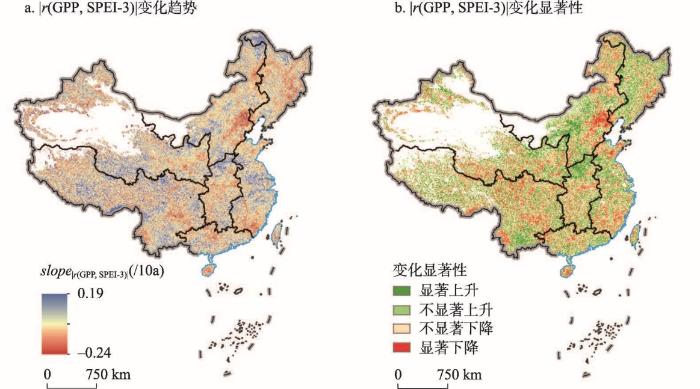
图4
1982—2018年GPP与SPEI-3相关系数绝对值变化趋势
注:基于自然资源部标准地图服务网站GS(2020)4619号标准地图制作,底图边界无修改。
Fig. 4
Trends in absolute values of GPP and SPEI-3 correlation coefficients in China from 1982 to 2018
3.3 植被生产力对干湿变化响应时间
由于植被对水分的需求或对缺水抵抗力存在差异,因此我们进一步分析了GPP对干湿变化的响应时间尺度。植被生产力对干旱化的响应时间越短表明植被生产力对干旱化的响应越快。由此可以得到中国植被生产力对干湿变化响应的抵抗力,有助于充分了解植被生产力对干湿变化响应的驱动机理。
1982—2018年中国植被生产力对干湿变化响应的时间平均为7.86个月(图5)。在中国七大地理分区对比可知,东北地区植被生产力对干湿变化整体响应时间最长为10.12个月,其次为西南、华南、西北、华中、华北和华东地区。
图5
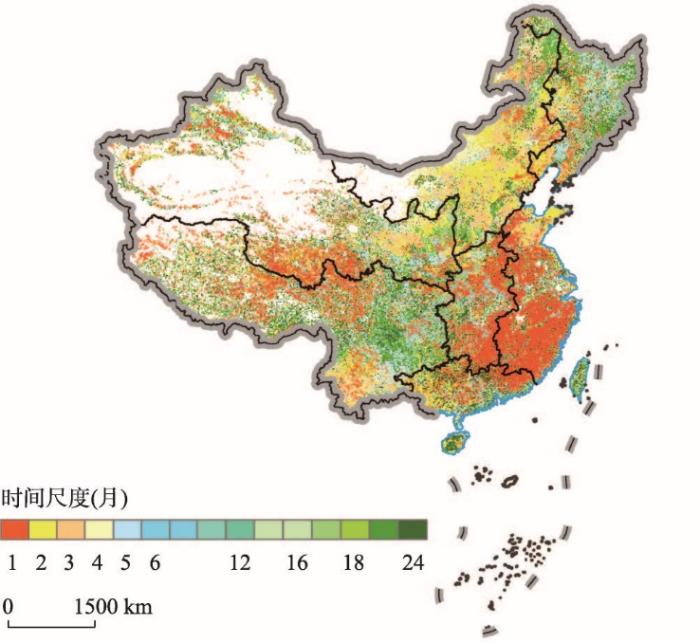
图5
1982—2018年植被生产力对干湿变化响应的时间尺度
注:基于自然资源部标准地图服务网站GS(2020)4619号标准地图制作,底图边界无修改。
Fig. 5
Time-scale of vegetation productivity response to wet and dry changes in China from 1982 to 2018
响应时间为1~3个月时间尺度的区域占比为48.59%,主要分布在华北、西南、华南和青藏高原东部地区。这可能与这可能与华东和华南地区植被覆盖度较高对水分需求较大,植被生长对水分变化响应较快,而华北大部分地区植被主要为草地或灌溉农田,植被根系欠发达,因此对干湿变化响应较快。植被对干湿变化响应时间为16~24个月的区域主要集中在东北的大兴安岭、小兴安岭、长白山地区和云贵高原中部地区,区域面积占比为20.01%,这些区域大部分区域主要是多年生林地,而在东北部分地区为针叶林和针阔混交林,植被高大、储存养分能力较强,而且在水分不足时,树木、灌丛等根系会向土壤深层延伸汲取水分[56],因此该区植被能够抵抗长时间尺度干湿变化,响应时间较长。
3.4 水分亏缺和水分过剩对植被生产力的影响
3.4.1 水分亏缺和水分过剩对植被生产力发生显著影响的最大区域
1982—2018年61.18%的中国植被覆盖区的GPP至少与某1个或多个时间尺度的SPEI(1~24个月时间尺度范围内)呈显著正相关(p < 0.05)(图6a),表明在过去37年中,有61.18%的地区至少有1个月或多个月的时间尺度的水分亏缺显著抑制了该区域的植被光合作用;有28.89%的中国植被覆盖区GPP与某1个或多个时间尺度的SPEI呈显著负相关(p < 0.05),表明28.89%的地区至少有1个月或多个月时间尺度的水分过剩显著抑制了植被的光合作用。
图6
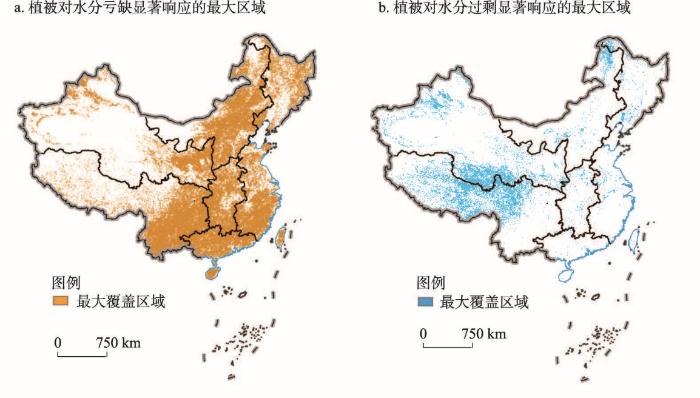
图6
1982—2018年水分亏缺和水分过剩对植被生产力存在显著影响的最大区域空间分布
注:基于自然资源部标准地图服务网站GS(2020)4619号标准地图制作,底图边界无修改;a图为GPP与SPEI呈显著正相关的最大复合面积,b图为GPP与SPEI呈显著负相关的最大复合面积。
Fig. 6
Spatial distribution of the largest areas of vegetation deficit and water surplus zones of China from 1982 to 2018
3.4.2 水分亏缺和水分过剩显著影响植被生产力的时间尺度阈值及其变化趋势
水资源的可利用性对植被生长有累积影响,同时在一定程度上植被生长会对干湿变化产生滞后性,揭示水分亏缺和水分过剩变化对植被生产力产生抑制效果的时间阈值,这对降低陆地生态系统管理成本和双碳目标实现具有重要意义。本文分别量化了1982—2018年植被生产力对水分亏缺和水分过剩响应时间差异,将水分减少与首次监测到水分减少对植被生产力产生显著影响的时间尺度称为植被生产力对水分胁迫的最小的响应时间;而将水分增多与监测到干湿变化对植被生产力产生显著影响的最大时间尺度称为水分过剩最大周期,表明水分增多对植被生产力产生抑制效果的最大响应时间。
由图7a可知,1982—2018年GPP与SPEI显著正相关地区的最小时间尺度平均为3.42个月。其中主要为1~2个月时间尺度,其空间区域占研究区的比例为44.56%。植被响应的最小时间尺度为1个月区域主要分布内蒙古东部、华北部地区和南方大部分地区。中国南方和北方植被对水分减少的相应存在差异,北方地区植被长期生长在水分不足的环境中,如果发生水分减少等干旱事件北方地区植被响应时间尺度略高于东南部地区。尽管北方大部分地区植被对干湿变化响应敏感性更高(图2)但由于北方大部分地区植被在长期处于水分不足的自然条件下,此地区植被形成了适应干旱的特征,因此对干湿变化响应周期略长[57-58]。而在南方大部分地区一旦发生水分减少等干旱事件,植被迅速做出反应。此地区植被覆盖度和温度更高,导致植被蒸腾更高从而水分需求量更大[59],触发植被响应的阈值也较高,植被对水分亏缺的抵抗力较低,植被生产力损失风险更高,因此对水分减少响应较快[58,60 -61]。而在东北地区植被对水分减少响应的最小时间尺度阈值在8个月以上,东北北部地区主要为林地,植被根系发达,因此对水分减少的响应时间更长[62]。
图7
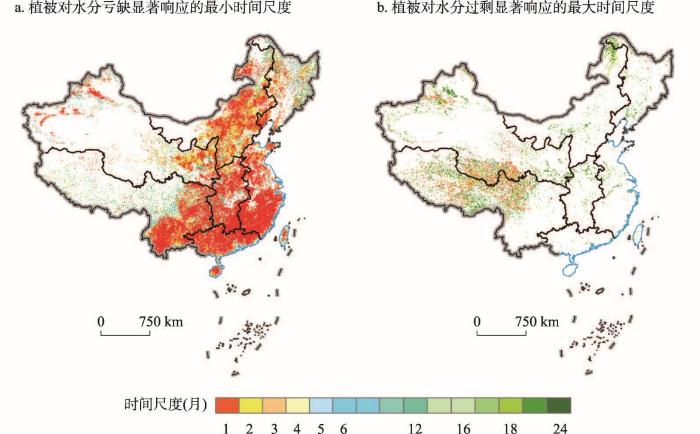
图7
1982—2018年植被生产力分别对水分亏缺和水分过剩显著响应的时间阈值
注:基于自然资源部标准地图服务网站GS(2020)4619号标准地图制作,底图边界无修改。
Fig. 7
Time-scale thresholds of significant response of vegetation productivity to water deficit and water surplus in China from 1982 to 2018
图8
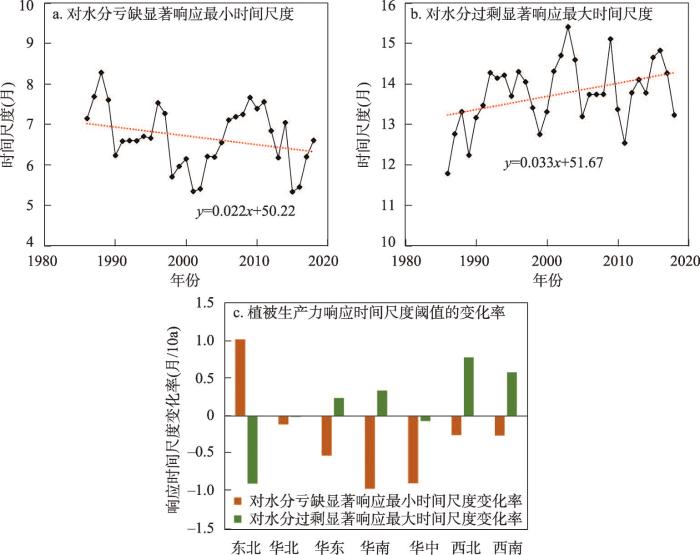
图8
1982—2018年植被生产力分别对水分亏缺和水分过剩显著响应的时间尺度阈值(5 a滑动窗口)
Fig. 8
Characteristics of changes in time-scale thresholds of significant response of vegetation productivity to water deficit and water surplus in different regions of China from 1982 to 2018
但植被生产力对水分亏缺和水分过剩变化响应时间尺度阈值的空间差异性很大(图8c),只有东北地区植被生产力对干旱化显著响应的最小时间尺度延长,表明一旦发生水分减少对植被影响越来越困难;而其他六大区域均为缩短趋势,表明干旱化影响越来越容易,植被抗旱能力减弱。东北地区水分过剩显著抑制植被生产力的最长时间尺度缩短,表明一旦发生降水增多对植被生产力的抑制越来越容易,同时华东地区也存在同样的变化趋势;其他五大区域均为水分过剩显著抑制植被生产力的最长时间尺度延长,表明湿润化抑制植被生产力越来越困难。
4 结论与展望
4.1 结论
本文评估了1982—2018年中国植被生产力对干湿变化响应的长期变化趋势及触发植被响应的时间尺度阈值。主要结论为:① 1982—2018年GPP异常与SPEI-3之间呈正相关的区域占比为72.07%,呈负相关的区域占比为27.93%,中国大部分区域植被生产力受到水分制约。有45.79%的区域GPP与SPEI-3相关系数为增大趋势(slope|r(GPP, SPEI-3)| > 0),水分显著约束强度增强。② 研究区内植被生产力对干湿变化响应的时间尺度为7.86个月,其中1~3个月时间尺度区域占比最高为48.59%,主要分布在华北和华南大部分地区。③ 在多时间尺度下,有61.18%的地区至少有1个月或多个月的水分亏缺显著抑制了该区域的植被光合作用;28.89%的地区至少有1个月或多个月的水分过剩抑制了该区域的植被光合作用。④ 对多时间尺度干湿变化显著响应的区域中,GPP与SPEI显著正相关的最小时间尺度平均为3.42个月并且以每10 a缩短0.22个月的速率变化;GPP与SPEI显著负相关的地区最大时间尺度平均为12.27个月并且以每10 a延长0.33个月的速率变化。因此,1982—2018年中国植被生产力的水分约束正在增加。
4.2 展望
植被的光合作用在陆地生态系统能量流动和碳循环中发挥了极为关键的作用,评估植被生产力对气候响应是制定气候变化应对方案和精准预估未来气候变化影响的重要步骤和科学揭示陆地生态系统服务能力的重要前提[64]。随着全球持续变暖导致陆面蒸发和植物蒸腾过程等水分过程发生改变[3],在此基础上本文揭示了水资源可用性对植被影响的长期变化趋势,这将对量化评估陆地生态系统水碳耦合关系及其变化趋势具有重要意义。本文从不同角度提供了多条论据揭示了过去37年中国植被生产力的水资源限制增加。同时中国植被绿化率持续提升会增加植被的需水量,加之未来可能继续升温,未来可能受到水资源可用性限制的区域会进一步扩张而且水资源限制程度可能进一步增强,导致植被固碳潜力下降的风险提高[3,24]。已有研究指出制备的水分胁迫可能潜藏在植被整体持续变绿之下,这可能导致植被的水分胁迫成为陆地生态系统碳汇增长的重要阻碍因素[2,65],在一定程度上抵消CO2上升和氮沉降对植被的促进作用[15,66],从而导致碳汇潜力增长乏力,这些影响因素的影响需要在今后研究中系统量化评估。
参考文献
Drylands contribute disproportionately to observed global productivity increases
Co-evolution of climate-vegetation-hydrology and its mechanisms in the source region of Yellow River
DOI:10.11821/dlxb202207011
[本文引用: 2]

Vegetation recovery under global change and its consequent evolution of eco-hydrological processes have modulated the water resources conservative capacity in the source region of the Yellow River (YRSR). Based on climatological data, remotely sensed vegetation index and geographical information, the integrated simulations of water and carbon cycles in the YRSR are presented, with the vegetation interface processes (VIP) distributed eco-hydrological dynamic model. Then the co-evolving mechanisms of hydrological and vegetation dynamics are investigated. Results show that warming and wetting climate in the YRSR has improved the vegetation growing condition and extended the growing period for more than 10 days in recent decades. Averaged NDVI from 2010 to 2020 increased by 4.5% relative to that from 2000 to 2009. Vegetation gross primary productivity (GPP) shows a significant uptrend with a rate of 4.57 gC m-2 a-1, 77% of which is contributed by climate change and elevated atmosphere CO2 fertilization, and the rest 23% is by vegetation greening. Evapotranspiration (ET) is increasing at a rate of 2.54 mm a-1 and vegetation water use efficiency (WUE, expressed as GPP/ET) is also improving at a relative rate of 5.1% a-1. Generally, annual ET, GPP and WUE and their trends are decreasing along the elevation below 4200 m. At basin scale, there are significant positive correlations between the vegetation greenness and the runoff coefficient with precipitation in the current and previous years, demonstrating a legacy effect of precipitation for vegetation recovery on water conservation capacity. The increased ET might be a benefit to the water recycle between land surface and atmosphere, which will alleviate the reduced potential of water yield owing to ecological restoration and establish trades-off and synergies among precipitation, vegetation and water yield. Conclusively, exploring the mechanisms of hydrological responses to climate change and vegetation recovery and its feedback will provide scientific support to the assessment of ecological engineering programs in the source regions.
黄河源区气候—植被—水文协同演变及成因辨析
DOI:10.11821/dlxb202207011
[本文引用: 2]
全球变化下黄河源区水文过程的演变影响流域生态系统的水源涵养功能,流域植被改变也影响水循环。本文基于气候、植被信息和VIP分布式生态水文模型,开展黄河源区水碳循环要素变化的集成模拟,分析了气候—植被—水文要素的协同演变机制。结果表明,2000年以来黄河源区气候呈暖湿化趋势;植被绿度明显提高,2010—2019年比2000—2009年平均增加了4.5%;生长季延长了至少10 d;植被生产力(GPP)显著上升,倾向率为4.57 gC m<sup>-2</sup> a<sup>-1</sup>;植被恢复措施对GPP变化的贡献约为23%,气候变化和大气CO<sub>2</sub>升高的施肥效应的贡献为77%。源区植被蒸散量(ET)呈增加趋势,倾向率为2.54 mm a<sup>-1</sup>,水分利用效率(WUE)亦提高,平均相对上升率为5.1% a<sup>-1</sup>。GPP、ET和WUE年总量及其变化率在海拔4200 m以下随高度上升而减小,之后变化趋缓。源区植被绿度和径流系数与当年和前一年降水呈显著正相关,反映降水蓄存于植物根层土壤的遗留效应。蒸散增强在一定程度上有利于源区地表—大气之间的水分再循环,帮助缓解生态恢复引起的产水能力下降,促进降水—植被—径流之间的良性互馈关系的形成。揭示水文对气候变化和植被恢复的响应和互馈机制,可为生态恢复措施对源区水源涵养功能的影响及效应的定量评估提供科学依据。
Impacts of vegetation changes on global evapotranspiration in the period 2003-2017
DOI:10.11821/dlxb202103007
[本文引用: 4]
Evapotranspiration is a key variable and key process in global water cycle, and it is crucial for understanding how anthropogenic and climate changes have impacts on terrestrial water cycle. In the last decade, global vegetation changes are dramatic, reflected by land use and land cover changes and increase in leaf area index. It remains unclear how these changes influence terrestrial evapotranspiration processes. This study uses a coupled evapotranspiration and gross primary product model (PML-V2) that is run at 500 m and 8-day resolutions across the globe to investigate the impacts of vegetation changes on spatial pattern and dynamics of evapotranspiration in the period of 2003-2017. We found that evapotranspiration across the globe has increased noticeably because of vegetation changes, which is characterized by clear regional and non-regional patterns. Transpiration has strongly increased in the central and northern parts of North America, Europe, eastern China, southern Africa, and eastern and northern Australia. Under different land cover types, shrubs and cropland have been influenced strongly, and their impact is stronger in the post-2012 period than that in the pre-2012 period. The recent total increase from these two land cover types amounts to about 0.41 ×10³ km3 a-1, which is about 8 times of natural annual runoff from the Yellow River Basin. The results from this study can help improve the understanding of how vegetation changes caused by recent land use and land cover changes influence terrestrial water cycle and the potential local and regional climate change.
2003—2017年植被变化对全球陆面蒸散发的影响
DOI:10.11821/dlxb202103007
[本文引用: 4]
蒸散发是陆面水循环的关键环节和过程,是研究水循环对人类活动和气候变化响应的关键要素。过去十几年,全球下垫面的植被变化剧烈,但如何影响全球陆面蒸散发仍未得到清晰的揭示。本文采用500 m分辨率MODIS数据驱动PML-V2模型,定量解析了2003—2017年植被变化对全球陆面蒸散发的影响。结果显示:在全球尺度上,植被变绿使得全球蒸散发呈现显著的增加趋势,使陆地水循环加快;区域尺度上,植被变化对蒸散发的影响则存在明显的地带性和非地带性特征,如在北美洲中北部、欧洲、中国东部、非洲南部和澳大利亚东北部等地区,蒸散发总量的增加主要是由植被蒸腾增加而引起的。分析不同植被功能类型区的贡献显示,下垫面变化对灌木和耕地影响尤为明显,并在2012年以后呈现增强趋势;这2个植被类型区的全球年总蒸散发累积增加量为0.41×10<sup>3</sup> km<sup>3</sup> a<sup>-1</sup>,约为黄河流域多年平均径流量的8倍。该研究结果有助于进一步加强关于下垫面变化对陆地水循环的影响及其可能带来的局部气候变化的认识。
Increasing drought under global warming in observations and models
DOI:10.1038/nclimate1633 [本文引用: 2]
Response of vegetation to water balance conditions at different time scales across the karst area of southwestern China: A remote sensing approach
DOI:10.1016/j.scitotenv.2018.07.148 URL [本文引用: 1]
Revegetation affects the response of land surface phenology to climate in Loess Plateau, China
China and India lead in greening of the world through land-use management
DOI:10.1038/s41893-019-0220-7
PMID:30778399
[本文引用: 1]
Satellite data show increasing leaf area of vegetation due to direct (human land-use management) and indirect factors (climate change, CO fertilization, nitrogen deposition, recovery from natural disturbances, etc.). Among these, climate change and CO fertilization effect seem to be the dominant drivers. However, recent satellite data (2000-2017) reveal a greening pattern that is strikingly prominent in China and India, and overlapping with croplands world-wide. China alone accounts for 25% of the global net increase in leaf area with only 6.6% of global vegetated area. The greening in China is from forests (42%) and croplands (32%), but in India is mostly from croplands (82%) with minor contribution from forests (4.4%). China is engineering ambitious programs to conserve and expand forests with the goal of mitigating land degradation, air pollution and climate change. Food production in China and India has increased by over 35% since 2000 mostly due to increasing harvested area through multiple cropping facilitated by fertilizer use and surface/ground-water irrigation. Our results indicate that the direct factor is a key driver of the "Greening Earth", accounting for over a third, and likely more, of the observed net increase in green leaf area. They highlight the need for realistic representation of human land-use practices in Earth system models.
High sensitivity of compound drought and heatwave events to global warming in the future
Drought-induced reduction in global terrestrial net primary production from 2000 through 2009
DOI:10.1126/science.1192666
PMID:20724633
[本文引用: 1]
Terrestrial net primary production (NPP) quantifies the amount of atmospheric carbon fixed by plants and accumulated as biomass. Previous studies have shown that climate constraints were relaxing with increasing temperature and solar radiation, allowing an upward trend in NPP from 1982 through 1999. The past decade (2000 to 2009) has been the warmest since instrumental measurements began, which could imply continued increases in NPP; however, our estimates suggest a reduction in the global NPP of 0.55 petagrams of carbon. Large-scale droughts have reduced regional NPP, and a drying trend in the Southern Hemisphere has decreased NPP in that area, counteracting the increased NPP over the Northern Hemisphere. A continued decline in NPP would not only weaken the terrestrial carbon sink, but it would also intensify future competition between food demand and proposed biofuel production.
Response of vegetation to different time-scales drought across China: Spatiotemporal patterns, causes and implications
Drought footprint on European ecosystems between 1999 and 2010 assessed by remotely sensed vegetation phenology and productivity
Drought affects more people than any other natural disaster but there is little understanding of how ecosystems react to droughts. This study jointly analyzed spatio-temporal changes of drought patterns with vegetation phenology and productivity changes between 1999 and 2010 in major European bioclimatic zones. The Standardized Precipitation and Evapotranspiration Index (SPEI) was used as drought indicator whereas changes in growing season length and vegetation productivity were assessed using remote sensing time-series of Normalized Difference Vegetation Index (NDVI). Drought spatio-temporal variability was analyzed using a Principal Component Analysis, leading to the identification of four major drought events between 1999 and 2010 in Europe. Correspondence Analysis showed that at the continental scale the productivity and phenology reacted differently to the identified drought events depending on ecosystem and land cover. Northern and Mediterranean ecosystems proved to be more resilient to droughts in terms of vegetation phenology and productivity developments. Western Atlantic regions and Eastern Europe showed strong agglomerations of decreased productivity and shorter vegetation growing season length, indicating that these ecosystems did not buffer the effects of drought well. In a climate change perspective, increase in drought frequency or intensity may result in larger impacts over these ecosystems, thus management and adaptation strategies should be strengthened in these areas of concerns.
Regional drought-induced reduction in the biomass carbon sink of Canada's boreal forests
DOI:10.1073/pnas.1111576109
PMID:22308340
[本文引用: 1]
The boreal forests, identified as a critical "tipping element" of the Earth's climate system, play a critical role in the global carbon budget. Recent findings have suggested that terrestrial carbon sinks in northern high-latitude regions are weakening, but there has been little observational evidence to support the idea of a reduction of carbon sinks in northern terrestrial ecosystems. Here, we estimated changes in the biomass carbon sink of natural stands throughout Canada's boreal forests using data from long-term forest permanent sampling plots. We found that in recent decades, the rate of biomass change decreased significantly in western Canada (Alberta, Saskatchewan, and Manitoba), but there was no significant trend for eastern Canada (Ontario and Quebec). Our results revealed that recent climate change, and especially drought-induced water stress, is the dominant cause of the observed reduction in the biomass carbon sink, suggesting that western Canada's boreal forests may become net carbon sources if the climate change-induced droughts continue to intensify.
Response of vegetation to drought time-scales across global land biomes
DOI:10.1073/pnas.1207068110
PMID:23248309
[本文引用: 3]
We evaluated the response of the Earth land biomes to drought by correlating a drought index with three global indicators of vegetation activity and growth: vegetation indices from satellite imagery, tree-ring growth series, and Aboveground Net Primary Production (ANPP) records. Arid and humid biomes are both affected by drought, and we suggest that the persistence of the water deficit (i.e., the drought time-scale) could be playing a key role in determining the sensitivity of land biomes to drought. We found that arid biomes respond to drought at short time-scales; that is, there is a rapid vegetation reaction as soon as water deficits below normal conditions occur. This may be due to the fact that plant species of arid regions have mechanisms allowing them to rapidly adapt to changing water availability. Humid biomes also respond to drought at short time-scales, but in this case the physiological mechanisms likely differ from those operating in arid biomes, as plants usually have a poor adaptability to water shortage. On the contrary, semiarid and subhumid biomes respond to drought at long time-scales, probably because plants are able to withstand water deficits, but they lack the rapid response of arid biomes to drought. These results are consistent among three vegetation parameters analyzed and across different land biomes, showing that the response of vegetation to drought depends on characteristic drought time-scales for each biome. Understanding the dominant time-scales at which drought most influences vegetation might help assessing the resistance and resilience of vegetation and improving our knowledge of vegetation vulnerability to climate change.
Soil moisture-atmosphere feedbacks mitigate declining water availability in drylands
DOI:10.1038/s41558-020-00945-z [本文引用: 1]
Observed increasing water constraint on vegetation growth over the last three decades
Despite the growing interest in predicting global and regional trends in vegetation productivity in response to a changing climate, changes in water constraint on vegetation productivity (i.e., water limitations on vegetation growth) remain poorly understood. Here we conduct a comprehensive evaluation of changes in water constraint on vegetation growth in the extratropical Northern Hemisphere between 1982 and 2015. We document a significant increase in vegetation water constraint over this period. Remarkably divergent trends were found with vegetation water deficit areas significantly expanding, and water surplus areas significantly shrinking. The increase in water constraints associated with water deficit was also consistent with a decreasing response time to water scarcity, suggesting a stronger susceptibility of vegetation to drought. We also observed shortened water surplus period for water surplus areas, suggesting a shortened exposure to water surplus associated with humid conditions. These observed changes were found to be attributable to trends in temperature, solar radiation, precipitation, and atmospheric CO. Our findings highlight the need for a more explicit consideration of the influence of water constraints on regional and global vegetation under a warming climate.
Amazon forests green-up during
DOI:10.1126/science.1146663
PMID:17885095
[本文引用: 1]
Coupled climate-carbon cycle models suggest that Amazon forests are vulnerable to both long- and short-term droughts, but satellite observations showed a large-scale photosynthetic green-up in intact evergreen forests of the Amazon in response to a short, intense drought in 2005. These findings suggest that Amazon forests, although threatened by human-caused deforestation and fire and possibly by more severe long-term droughts, may be more resilient to climate changes than ecosystem models assume.
Molecular and physiological responses of trees to waterlogging stress
Widespread seasonal compensation effects of spring warming on northern plant productivity
DOI:10.1038/s41586-018-0555-7 [本文引用: 1]
A global analysis of the impact of drought on net primary productivity
DOI:10.5194/hess-17-3885-2013
URL
[本文引用: 2]
. We investigated the impact of drought on interannual variability of net primary productivity (NPP) from 1997 to 2009, using the standardized precipitation evapotranspiration index (SPEI) drought index and satellite-derived vegetation greenness converted to NPP. SPEI is positive for wet conditions and negative for dry conditions. We found that SPEI and NPP were coupled and showed in-phase behaviour on a global scale. We then used the Köppen climate classification to study the SPEI–NPP relations regionally and found that while NPP and SPEI were positively related (high SPEI, high NPP) in arid and in seasonal dry regions, the opposite occurs in most boreal regions (high SPEI, low NPP). High intensity drought events, such as the 2003 drought in Europe were picked up by our analysis. Our findings suggest that the strong positive relation between global average moisture availability and NPP consists of a composite of the positive relation across dry regions and the coherent NPP decline during and after intensive drought events in humid regions. Importantly, we also found that there are many areas on the globe that show no strong correlation between drought and NPP.\n
Assessing vegetation response to multi-time-scale drought across inner Mongolia plateau
DOI:10.1016/j.jclepro.2018.01.113 URL [本文引用: 1]
Increased atmospheric vapor pressure deficit reduces global vegetation growth
Global vegetation greening trend stalled after the late 1990s due to increased atmospheric water demand.
Widespread increasing vegetation sensitivity to soil moisture
Global vegetation and associated ecosystem services critically depend on soil moisture availability which has decreased in many regions during the last three decades. While spatial patterns of vegetation sensitivity to global soil water have been recently investigated, long-term changes in vegetation sensitivity to soil water availability are still unclear. Here we assess global vegetation sensitivity to soil moisture during 1982-2017 by applying explainable machine learning with observation-based leaf area index (LAI) and hydro-climate anomaly data. We show that LAI sensitivity to soil moisture significantly increases in many semi-arid and arid regions. LAI sensitivity trends are associated with multiple hydro-climate and ecological variables, and strongest increasing trends occur in the most water-sensitive regions which additionally experience declining precipitation. State-of-the-art land surface models do not reproduce this increasing sensitivity as they misrepresent water-sensitive regions and sensitivity strength. Our sensitivity results imply an increasing ecosystem vulnerability to water availability which can lead to exacerbated reductions in vegetation carbon uptake under future intensified drought, consequently amplifying climate change.© 2022. The Author(s).
Enlargement of the semi-arid region in China from 1961 to 2010
DOI:10.1007/s00382-018-4139-x [本文引用: 2]
Drought characteristics and risk hazard in China based on multidimensional Copula model
基于多维Copula的中国干旱特征及危险性分析
The resilience of vegetation to the 2009/2010 extreme drought in southwest China
The 2009/2010 extreme drought in southwest China (SWC) was a “once-in-a-century” drought event, which caused unprecedented damage to the regional ecology and socioeconomic development. The event provided a chance to explore the resilience of vegetation growth and productivity to the extreme drought. Here, we used the self-calibrating Palmer drought severity index (scPDSI) to describe the characteristics of the extreme drought. Vegetation growth and productivity indices, including the normalized difference vegetation index (NDVI), leaf area index (LAI), and gross primary productivity (GPP), were applied to analyze the resilience of different vegetation types to the extreme drought. Our results showed that the extreme drought event occurred mainly in Yunnan Province, Guizhou Province, central and northern Guangxi Zhuang Autonomous Region, and northwestern Sichuan Province. The spatial heterogeneity of the extreme drought was related to the temperature increase and water deficit. During the extreme drought, the vegetation growth and productivity of evergreen broadleaf forest were the least suppressed, whereas cropland was greatly suppressed. The recovery of cropland was higher than that of evergreen broadleaf forest. NDVI and LAI were recovered in more than 80% of the drought-affected area within 5 months, whereas GPP required a longer time to recover. Moreover, the results of multiple linear regression showed that an increase in surface soil moisture was able to significantly improve the resistance of vegetation NDVI and LAI in evergreen broadleaf forest, evergreen needleleaf forest, evergreen broadleaf shrubland, deciduous broadleaf shrubland, and grassland. Our study highlights the differences in the resilience of different vegetation types to extreme drought and indicates that surface soil moisture is an important factor affecting vegetation resistance in SWC.
Shifting from a fertilization-dominated to a warming-dominated period
Multi-scale response characteristics and mechanism of vegetation to meteorological drought on the Loess Plateau
黄土高原植被变化对气象干旱多尺度响应特征与机制
Land-atmosphere feedbacks exacerbate concurrent soil drought and atmospheric aridity
DOI:10.1073/pnas.1904955116
PMID:31481606
[本文引用: 1]
Compound extremes such as cooccurring soil drought (low soil moisture) and atmospheric aridity (high vapor pressure deficit) can be disastrous for natural and societal systems. Soil drought and atmospheric aridity are 2 main physiological stressors driving widespread vegetation mortality and reduced terrestrial carbon uptake. Here, we empirically demonstrate that strong negative coupling between soil moisture and vapor pressure deficit occurs globally, indicating high probability of cooccurring soil drought and atmospheric aridity. Using the Global Land Atmosphere Coupling Experiment (GLACE)-CMIP5 experiment, we further show that concurrent soil drought and atmospheric aridity are greatly exacerbated by land-atmosphere feedbacks. The feedback of soil drought on the atmosphere is largely responsible for enabling atmospheric aridity extremes. In addition, the soil moisture-precipitation feedback acts to amplify precipitation and soil moisture deficits in most regions. CMIP5 models further show that the frequency of concurrent soil drought and atmospheric aridity enhanced by land-atmosphere feedbacks is projected to increase in the 21st century. Importantly, land-atmosphere feedbacks will greatly increase the intensity of both soil drought and atmospheric aridity beyond that expected from changes in mean climate alone.
Dryland productivity under a changing climate
DOI:10.1038/s41558-022-01499-y [本文引用: 1]
Estimation of China's terrestrial ecosystem carbon sink: Methods, progress and prospects
DOI:10.1007/s11430-021-9892-6 [本文引用: 1]
Terrestrial carbon sinks in China and around the world and their contribution to carbon neutrality
中国及全球陆地生态系统碳源汇特征及其对碳中和的贡献
Advances in the carbon sink potential of terrestrial ecosystems in China
中国陆地生态系统增汇潜力研究展望
Tracking the seasonal and inter-annual variations of global gross primary production during last four decades using satellite near-infrared reflectance data
Development of a global 30 m impervious surface map using multisource and multitemporal remote sensing datasets with the Google Earth Engine platform
DOI:10.5194/essd-12-1625-2020
URL
[本文引用: 1]
. The amount of impervious surface is an important\nindicator in the monitoring of the intensity of human activity and\nenvironmental change. The use of remote sensing techniques is the only means\nof accurately carrying out global mapping of impervious surfaces covering\nlarge areas. Optical imagery can capture surface reflectance\ncharacteristics, while synthetic-aperture radar (SAR) images can be used to\nprovide information on the structure and dielectric properties of surface\nmaterials. In addition, nighttime light (NTL) imagery can detect the\nintensity of human activity and thus provide important a priori\nprobabilities of the occurrence of impervious surfaces. In this study, we\naimed to generate an accurate global impervious surface map at a resolution\nof 30 m for 2015 by combining Landsat 8 Operational Land Image (OLI) optical images, Sentinel-1 SAR\nimages and Visible Infrared Imaging Radiometer Suite (VIIRS) NTL images based on\nthe Google Earth Engine (GEE) platform. First, the global impervious and\nnonimpervious training samples were automatically derived by combining the\nGlobeLand30 land-cover product with VIIRS NTL and MODIS enhanced vegetation\nindex (EVI) imagery. Then, the local adaptive random forest classifiers,\nallowing for a regional adjustment of the classification parameters to take into\naccount the regional characteristics, were trained and used to generate\nregional impervious surface maps for each 5∘×5∘ geographical grid using local training samples and multisource\nand multitemporal imagery. Finally, a global impervious surface map,\nproduced by mosaicking numerous 5∘×5∘\nregional maps, was validated by interpretation samples and then compared\nwith five existing impervious products (GlobeLand30, FROM-GLC, NUACI, HBASE and GHSL). The results indicated that the global\nimpervious surface map produced using the proposed multisource,\nmultitemporal random forest classification (MSMT_RF) method\nwas the most accurate of the maps, having an overall accuracy of 95.1 %\nand kappa coefficient (one of the most commonly used statistics to test\ninterrater reliability; Olofsson et al., 2014) of 0.898 as\nagainst 85.6 % and 0.695 for NUACI, 89.6 % and 0.780 for\nFROM-GLC, 90.3 % and 0.794 for GHSL, 88.4 % and 0.753 for\nGlobeLand30, and 88.0 % and 0.745 for HBASE using all 15 regional\nvalidation data. Therefore, it is concluded that a global 30 m impervious\nsurface map can accurately and efficiently be generated by the proposed\nMSMT_RF method based on the GEE platform. The global\nimpervious surface map generated in this paper is available at https://doi.org/10.5281/zenodo.3505079 (Zhang and Liu, 2019).\n
GLC_FCS30: Global land-cover product with fine classification system at 30 m using time-series Landsat imagery
DOI:10.5194/essd-13-2753-2021
URL
[本文引用: 1]
. Over past decades, a lot of global land-cover products have been released; however, these still lack a global land-cover map with a fine classification system and spatial resolution simultaneously. In this study, a novel global 30 m land-cover classification with a fine classification system for the year 2015 (GLC_FCS30-2015) was produced by combining time series of Landsat imagery and high-quality training data from the GSPECLib (Global Spatial Temporal Spectra Library) on the Google Earth Engine computing platform. First, the global training data from the GSPECLib were developed by applying a series of rigorous filters to the CCI_LC (Climate Change Initiative Global Land Cover) land-cover and MCD43A4 NBAR products (MODIS Nadir Bidirectional Reflectance Distribution Function-Adjusted Reflectance). Secondly, a local adaptive random forest model was built for each 5∘×5∘ geographical tile by using the multi-temporal Landsat spectral and texture features and the corresponding training data, and the GLC_FCS30-2015 land-cover product containing 30 land-cover types was generated for each tile. Lastly, the GLC_FCS30-2015 was validated using three different validation systems (containing different land-cover details) using 44 043 validation samples. The validation results indicated that the GLC_FCS30-2015 achieved an overall accuracy of 82.5 % and a kappa coefficient of 0.784 for the level-0 validation system (9 basic land-cover types), an overall accuracy of 71.4 % and kappa coefficient of 0.686 for the UN-LCCS (United Nations Land Cover Classification System) level-1 system (16 LCCS land-cover types), and an overall accuracy of 68.7 % and kappa coefficient of 0.662 for the UN-LCCS level-2 system (24 fine land-cover types). The comparisons against other land-cover products (CCI_LC, MCD12Q1, FROM_GLC, and GlobeLand30) indicated that GLC_FCS30-2015 provides more spatial details than CCI_LC-2015 and MCD12Q1-2015 and a greater diversity of land-cover types than FROM_GLC-2015 and GlobeLand30-2010. They also showed that GLC_FCS30-2015 achieved the best overall accuracy of 82.5 % against FROM_GLC-2015 of 59.1 % and GlobeLand30-2010 of 75.9 %. Therefore, it is concluded that the GLC_FCS30-2015 product is the first global land-cover dataset that provides a fine classification system (containing 16 global LCCS land-cover types as well as 14 detailed and regional land-cover types) with high classification accuracy at 30 m. The GLC_FCS30-2015 global land-cover products produced in this paper are free access at https://doi.org/10.5281/zenodo.3986872 (Liu et al., 2020).\n
Finer-resolution mapping of global land cover: Recent developments, consistency analysis, and prospects
A multiscalar drought index sensitive to global warming: The standardized precipitation evapotranspiration index
DOI:10.1175/2009JCLI2909.1
URL
[本文引用: 2]
The authors propose a new climatic drought index: the standardized precipitation evapotranspiration index (SPEI). The SPEI is based on precipitation and temperature data, and it has the advantage of combining multiscalar character with the capacity to include the effects of temperature variability on drought assessment. The procedure to calculate the index is detailed and involves a climatic water balance, the accumulation of deficit/surplus at different time scales, and adjustment to a log-logistic probability distribution. Mathematically, the SPEI is similar to the standardized precipitation index (SPI), but it includes the role of temperature. Because the SPEI is based on a water balance, it can be compared to the self-calibrated Palmer drought severity index (sc-PDSI). Time series of the three indices were compared for a set of observatories with different climate characteristics, located in different parts of the world. Under global warming conditions, only the sc-PDSI and SPEI identified an increase in drought severity associated with higher water demand as a result of evapotranspiration. Relative to the sc-PDSI, the SPEI has the advantage of being multiscalar, which is crucial for drought analysis and monitoring.
Keeping track of crop moisture conditions, nationwide: The new crop moisture index
DOI:10.1080/00431672.1968.9932814 URL [本文引用: 1]
The relationship of drought frequency and duration of time scales. The 8th Conference on Apllied Climatology, American Meteorological Society
Analysis of long term drought severity characteristics and trends across semiarid Botswana using two drought indices
DOI:10.1016/j.atmosres.2018.07.002 URL [本文引用: 1]
Spatiotemporal drought variability on the Mongolian Plateau from 1980-2014 based on the SPEI-PM, intensity analysis and Hurst exponent
DOI:10.1016/j.scitotenv.2017.09.121 URL [本文引用: 1]
Climate change in the Qinling Mountains in spring during 1959-2018
1959—2018年秦岭南北春季气候时空变化特征
A new multi-sensor integrated index for drought monitoring
DOI:10.1016/j.agrformet.2019.01.008
[本文引用: 1]
Drought is one of the most expensive but least understood natural disasters. Remote sensing based integrated drought indices have the potential to describe drought conditions comprehensively, and multi-criteria combination analysis is increasingly used to support drought assessment. However, conventional multi-criteria combination methods and most existing integrated drought indices fail to adequately represent spatial variability. An index that can be widely used for drought monitoring across all climate regions would be of great value for ecosystem management. To this end, we proposed a framework for generating a new integrated drought index applicable across diverse climate regions. In this new framework, a local ordered weighted averaging (OWA) model was used to combine the Temperature Condition Index (TCI) from the Moderate-resolution Imaging Spectroradiometer (MODIS), the Vegetation Condition Index (VCI) developed using the Vegetation Index based on Universal Pattern Decomposition method (VIUPD), the Soil Moisture Condition Index (SMCI) derived from the Advanced Microwave Scanning Radiometer-Earth Observation System (AMSR-E), and the Precipitation Condition Index (PCI) derived from the Tropical Rainfall Measuring Mission (TRMM). This new index, which we call the "Geographically Independent Integrated Drought Index (GIIDI)," was validated in diverse climate divisions across the continental United States. Results showed that GIIDI was better correlated with in-situ PDSI, Z-index, SP1-1, SPI-3 and SPEI-6 (overall r-value = 0.701, 0.794, 0.811, 0.733, 0.628; RMSE = 1.979, 0.810, 0.729, 1.049 and 1.071, respectively) when compared to the Microwave Integrated Drought Index (MIDI), Optimized Meteorological Drought Index (OMDI), Scaled Drought Condition Index (SDCI), PCI, TCI, SMCI, and VCI. GIIDI also performed well in most climate divisions for both short-term and long-term drought monitoring. Because of the superior performance of GIIDI across diverse temporal and spatial scales, GIIDI has considerable potential for improving our ability to monitor drought across a range of biomes and climates.
A new global 0.5 gridded dataset (1901-2006) of a multiscalar drought index: Comparison with current drought index datasets based on the Palmer Drought Severity Index
DOI:10.1175/2010JHM1224.1
URL
[本文引用: 1]
A monthly global dataset of a multiscalar drought index is presented and compared in terms of spatial and temporal variability with the existing continental and global drought datasets based on the Palmer drought severity index (PDSI). The presented dataset is based on the standardized precipitation evapotranspiration index (SPEI). The index was obtained using the Climatic Research Unit (CRU) TS3.0 dataset at a spatial resolution of 0.5°. The advantages of the new dataset are that (i) it improves the spatial resolution of the unique global drought dataset at a global scale; (ii) it is spatially and temporally comparable to other datasets, given the probabilistic nature of the SPEI; and, in particular, (iii) it enables the identification of various drought types, given the multiscalar character of the SPEI. The dataset is freely available on the Web page of the Spanish National Research Council (CSIC) in three different formats [network Common Data Form (netCDF), binary raster, and plain text].
The Standardized Precipitation-Evapotranspiration Index (SPEI): A multiscalar drought index
Cumulative effects of climatic factors on terrestrial vegetation growth
DOI:10.1029/2018JG004751
[本文引用: 1]
Extensive studies have focused on instantaneous and time-lag impacts of climatic factors on vegetation growth; however, the chronical and accumulative indirect impacts of antecedent climatic factors carrying over for a period of time on vegetation growth, defined as cumulative effects, are less investigated. Here we aimed to disentangle the cumulative effects of climatic factors on vegetation growth by using vegetation indexes and accumulated meteorological data. First, we investigated the explanation and fit of climate changes on vegetation variations by applying stepwise multiple linear regression with Akaike information criterion. Then, we obtained the correlation coefficients and lagged time of climatic factors on vegetation growth whereby partial correlation and time-lag effect analyses. Results showed that (i) consideration of cumulative climate effects increased the explanation and fit of climate changes on vegetation dynamics for more than 77% of vegetated surface with an average global explanation of 68.33%, which was approximately 3.35% higher than the scenario when only time-lag effects were considered; (ii) big differences exhibited in the correlation coefficients and lagged times under the scenarios with cumulative climate effects considered or not; and (iii) positive accumulated temperature (accumulated solar radiation) effects with zero (three-month) time lag dominates most mid-high latitude ecosystems, and negative accumulated temperature effects with three-month delay dominates the temperate arid and semiarid regions and tropical dry ecosystems. By comparison, accumulated precipitation had relatively complex cumulative effects on vegetation growth. We concluded that climatic factors had significant cumulative effects on vegetation growth; consideration of the cumulative effects helps us better understand the climate-vegetation interactions.
Time lag and negative responses of forest greenness and tree growth to warming over circumboreal forests
DOI:10.1111/gcb.14135
PMID:29569800
[本文引用: 1]
The terrestrial forest ecosystems in the northern high latitude region have been experiencing significant warming rates over several decades. These forests are considered crucial to the climate system and global carbon cycle and are particularly vulnerable to climate change. To obtain an improved estimate of the response of vegetation activity, e.g., forest greenness and tree growth, to climate change, we investigated spatiotemporal variations in two independent data sets containing the dendroecological information for this region over the past 30 years. These indices are the normalized difference vegetation index (NDVI3g) and the tree-ring width index (RWI), both of which showed significant spatial variability in past trends and responses to climate changes. These trends and responses to climate change differed significantly in the ecosystems of the circumarctic (latitude higher than 67°N) and the circumboreal forests (latitude higher and lower than 50°N and 67°N, respectively), but the way in which they differed was relatively similar in the NDVI3g and the RWI. In the circumarctic ecosystem, the climate variables of the current summer were the main climatic drivers for the positive response to the increase in temperatures showed by both the NDVI3g and the RWI indices. On the other hand, in the circumboreal forest ecosystem, the climate variables of the previous year (from summer to winter) were also important climatic drivers for both the NDVI3g and the RWI. Importantly, both indices showed that the temperatures in the previous year negatively affected the ecosystem. Although such negative responses to warming did not necessarily lead to a past negative linear trend in the NDVI3g and the RWI over the past 30 years, future climate warming could potentially cause severe reduction in forest greenness and tree growth in the circumboreal forest ecosystem.© 2018 John Wiley & Sons Ltd.
Optimality principles explaining divergent responses of alpine vegetation to environmental change
DOI:10.1111/gcb.v29.1 URL [本文引用: 1]
Increasing climatic sensitivity of global grassland vegetation biomass and species diversity correlates with water availability
DOI:10.1111/nph.17269
PMID:33577084
[本文引用: 1]
Grasslands are key repositories of biodiversity and carbon storage and are heavily impacted by effects of global warming and changes in precipitation regimes. Patterns of grassland dynamics associated with variability in future climate conditions across spatiotemporal scales are yet to be adequately quantified. Here, we performed a global meta-analysis of year and growing season sensitivities of vegetation aboveground biomass (AGB), aboveground net primary productivity (ANPP), and species richness (SR) and diversity (Shannon index, H) to experimental climate warming and precipitation shifts. All four variables were sensitive to climate change. Their sensitivities to shifts in precipitation were correlated with local background water availability, such as mean annual precipitation (MAP) and aridity, and AGB and ANPP sensitivities were greater in dry habitats than in nonwater-limited habitats. There was no effect of duration of experiment (short vs long term) on sensitivities. Temporal trends in ANPP and SR sensitivity depended on local water availability; ANPP sensitivity to warming increased over time and SR sensitivity to irrigation decreased over time. Our results provide a global overview of the sensitivities of grassland function and diversity to climate change that will improve the understanding of ecological responses across spatiotemporal scales and inform policies for conservation in dry climates.© 2021 The Authors New Phytologist © 2021 New Phytologist Foundation.
The 20-year spatiotemporal trends of remotely sensed soil moisture and vegetation and their response to climate change over the Third Pole
Greening of the land surface in the world's cold regions consistent with recent warming
DOI:10.1038/s41558-018-0258-y
[本文引用: 1]
Global ecosystem function is highly dependent on climate and atmospheric composition, yet ecosystem responses to environmental changes remain uncertain. Cold, high-latitude ecosystems in particular have experienced rapid warming(1), with poorly understood consequences(2-4). Here, we use a satellite-observed proxy for vegetation cover-the fraction of absorbed photosynthetically active radiation(5)-to identify a decline in the temperature limitation of vegetation in global ecosystems between 1982 and 2012. We quantify the spatial functional response of maximum annual vegetation cover to temperature and show that the observed temporal decline in temperature limitation is consistent with expectations based on observed recent warming. An ensemble of Earth system models from the Coupled Model Intercomparison Project Phase 5 (CMIP5) mischaracterized the functional response to temperature, leading to a large overestimation of vegetation cover in cold regions. We identify a 16.4% decline in the area of vegetated land that is limited by temperature over the past three decades, and suggest an expected large decline in temperature limitation under future warming scenarios. This rapid observed and expected decline in temperature limitation highlights the need for an improved understanding of other limitations to vegetation growth in cold regions(3,4,6), such as soil characteristics, species migration, recruitment, establishment, competition and community dynamics.
Climate-driven increases in global terrestrial net primary production from 1982 to 1999
Recent climatic changes have enhanced plant growth in northern mid-latitudes and high latitudes. However, a comprehensive analysis of the impact of global climatic changes on vegetation productivity has not before been expressed in the context of variable limiting factors to plant growth. We present a global investigation of vegetation responses to climatic changes by analyzing 18 years (1982 to 1999) of both climatic data and satellite observations of vegetation activity. Our results indicate that global changes in climate have eased several critical climatic constraints to plant growth, such that net primary production increased 6% (3.4 petagrams of carbon over 18 years) globally. The largest increase was in tropical ecosystems. Amazon rain forests accounted for 42% of the global increase in net primary production, owing mainly to decreased cloud cover and the resulting increase in solar radiation.
Increased atmospheric vapor pressure deficit reduces global vegetation growth
Global vegetation greening trend stalled after the late 1990s due to increased atmospheric water demand.
Large influence of atmospheric vapor pressure deficit on ecosystem production efficiency
Effects of soil water content on soil respiration in forests and cattle pastures of eastern Amazonia
DOI:10.1023/A:1006204113917 URL [本文引用: 1]
Plant traits and soil fertility mediate productivity losses under extreme drought in C3 grasslands
Global assessment of lagged and cumulative effects of drought on grassland gross primary production
Severe summer heatwave and drought strongly reduced carbon uptake in southern China
Increasing heatwave and drought events can potentially alter the carbon cycle. Few studies have investigated the impacts of hundred-year return heatwaves and droughts, as those events are rare. In the summer of 2013, southern China experienced its strongest drought and heatwave on record for the past 113 years. We show that the record-breaking heatwave and drought lasted two months (from July to August), significantly reduced the satellite-based vegetation index and gross primary production, substantially altered the regional carbon cycle and produced the largest negative crop yield anomaly since 1960. The event resulted in a net reduction of 101.54 Tg C in carbon sequestration in the region during these two months, which was 39–53% of the annual net carbon sink of China’s terrestrial ecosystems (190–260 Tg C yr−1). Moreover, model experiments showed that heatwaves and droughts consistently decreased ecosystem vegetation primary production but had opposite impacts on ecosystem respiration (TER), with increased TER by 6.78 ± 2.15% and decreased TER by 15.34 ± 3.57% assuming only changed temperature and precipitation, respectively. In light of increasing frequency and severity of future heatwaves and droughts, our study highlights the importance of accounting for the impacts of heatwaves and droughts in assessing the carbon sequestration in terrestrial ecosystems.
Spatiotemporal differentiation of the terrestrial gross primary production response to climate constraints in a dryland mountain ecosystem of northwestern China
Contrasting responses of water use efficiency to drought across global terrestrial ecosystems
Drought is an intermittent disturbance of the water cycle that profoundly affects the terrestrial carbon cycle. However, the response of the coupled water and carbon cycles to drought and the underlying mechanisms remain unclear. Here we provide the first global synthesis of the drought effect on ecosystem water use efficiency (WUE = gross primary production (GPP)/evapotranspiration (ET)). Using two observational WUE datasets (i.e., eddy-covariance measurements at 95 sites (526 site-years) and global gridded diagnostic modelling based on existing observation and a data-adaptive machine learning approach), we find a contrasting response of WUE to drought between arid (WUE increases with drought) and semi-arid/sub-humid ecosystems (WUE decreases with drought), which is attributed to different sensitivities of ecosystem processes to changes in hydro-climatic conditions. WUE variability in arid ecosystems is primarily controlled by physical processes (i.e., evaporation), whereas WUE variability in semi-arid/sub-humid regions is mostly regulated by biological processes (i.e., assimilation). We also find that shifts in hydro-climatic conditions over years would intensify the drought effect on WUE. Our findings suggest that future drought events, when coupled with an increase in climate variability, will bring further threats to semi-arid/sub-humid ecosystems and potentially result in biome reorganization, starting with low-productivity and high water-sensitivity grassland.
Drought trigger thresholds for different levels of vegetation loss in China and their dynamics
Age-related patterns and climatic driving factors of drought-induced forest mortality in Northeast China
Sensitivity and areal differentiation of vegetation responses to hydrothermal dynamics on the northern and southern slopes of the Qinling Mountains in Shaanxi province
DOI:10.11821/dlxb202101004
[本文引用: 1]
The Qinling Mountains, located at the junction of warm temperate and subtropical zones, serves as the boundary between North and South China. Exploring the sensitivity of vegetation response to hydrothermal dynamics can be conducive to understanding the pattern and dynamics of main vegetation types and the mechanism of their response to changes in temperature and moisture. Importance should be attached to the laws of vegetation change in different climate zones. To reveal the sensitivity and areal differentiation of vegetation responses to hydrothermal dynamics, the spatial and temporal variation characteristics of NDVI and SPEI on the southern and northern slopes of the Qinling Mountains from 2000 to 2018 are explored using the meteorological data from 32 meteorological stations and the MODIS NDVI datasets. The results show that: (1) The overall vegetation coverage of the Qinling Mountains improved significantly from 2000 to 2018. The NDVI rise rate and area ratio on the southern slope were higher than those on the northern slope, and the vegetation on the southern slope exhibited better improvement than that on the northern slope. The Qinling Mountains showed an insignificant humidification trend. The humidification rate and humidification area of the northern slope were greater than those on the southern slope. (2) Vegetation on the northern slope of the Qinling Mountains was more sensitive to hydrothermal dynamics than that on the southern slope. Vegetation was most sensitive to hydrothermal dynamics from March to June on the northern slope, and from March to May (spring) on the southern slope. The vegetation on the northern and southern slopes was mainly affected by hydrothermal dynamics on a scale of 3-7 months, and it responds weakly to hydrothermal dynamics on a scale of 11-12 months. (3) 90.34% of NDVI and SPEI were positively correlated in the Qinling Mountains. Spring humidification in most parts of the study area could promote the growth of vegetation all the year round. The sensitivity of vegetation responses to hydrothermal dynamics with increasing altitude increased first and then decreased. The altitude of 800 to 1200 m was the most sensitive altitude for vegetation response to hydrothermal dynamics. The sensitivity of vegetation response at the elevation of 1200-3000 m decreased with the increasing altitude. The grass was the most sensitive vegetation type to hydrothermal dynamics on the northern and southern slopes of the Qinling Mountains, but most of other vegetation types on the northern slope were more sensitive to hydrothermal dynamics than those on the southern slope.
秦岭陕西段南北坡植被对干湿变化响应敏感性及空间差异
DOI:10.11821/dlxb202101004
[本文引用: 1]
秦岭位于暖温带与亚热带交界处,也是中国南北地理分界线,秦岭南北坡植被对干湿变化响应敏感性,可以折射出暖温带、亚热带地区主要植被类型对干湿变化的响应规律和机制特征,对深入理解不同气候带植被变化规律具有重要意义。本文利用秦岭山地32个气象站点的气象数据和MODIS NDVI时间序列数据集,探讨了2000—2018年秦岭南北坡NDVI和SPEI时空变化特征,揭示了南北坡植被对干湿变化响应敏感性及其空间差异。结果表明:① 2000—2018年秦岭植被覆盖情况整体显著改善,但秦岭南坡NDVI上升幅度和面积占比均高于北坡,南坡植被比北坡改善情况好。秦岭湿润化趋势不显著,但秦岭北坡湿润化速率和面积占比均大于南坡。② 秦岭北坡植被比南坡植被更易受干湿变化影响,秦岭北坡植被对3—6月总体干湿变化最为敏感,南坡植被对3—5月(春季)干湿变化最为敏感。秦岭南北坡植被主要受3~7个月尺度干湿变化影响,对11~12个月尺度的干湿变化响应较弱。③ 秦岭有90.34%的区域NDVI与SPEI呈正相关,大部分地区春季湿润化能促进全年植被生长;随海拔上升,植被对干湿变化响应敏感性先上升再下降,海拔800~1200 m是植被响应最敏感的海拔段,海拔1200~3000 m随海拔上升植被响应敏感性下降;南北坡草丛均是对干湿变化响应最为敏感的植被类型,但秦岭北坡多数植被类型对干湿变化响应比南坡敏感。
Divergent seasonal responses of carbon fluxes to extreme droughts over China
Projected increases in intensity, frequency, and terrestrial carbon costs of compound drought and aridity events
Compound drought and aridity events will be more extreme and frequent, exerting an increasingly negative impact on carbon uptake.
Contribution of climatic change and human activities to vegetation NDVI change over China during 1982-2015
DOI:10.11821/dlxb202005006
[本文引用: 1]
Based on the observed daily temperature and precipitation of the land surface of 603 meteorological stations in China, the Global Inventory Modeling and Mapping Studies (GIMMS) Normalized Difference Vegetation Index (NDVI) 3rd generation dataset, the changing patterns of NDVI in China during 1982-2015 were investigated and the corresponding contributions of the main driving forces, climatic change and human activities, to these changes were distinguished using the methods of trend analysis and multiple regression residuals analysis. The results showed that vegetation recovered in whole China in research period significantly. Shanghai was the single case with a decrease in growing season NDVI in the selected 32 provincial-level administrative regions, while the growing season NDVI in Shanxi, Shaanxi, and Chongqing increased much faster compared with other regions. The climatic change and human activities drove the NDVI change jointly as main forces in China and induced both a rapid increasing trend on the whole and a huge spatial difference. The impacts of climatic change on NDVI change in the growing-season ranged from -0.01×10 -3 a -1 to 1.05×10 -3 a -1, while the impacts of human activities changed from -0.32×10 -3 a -1 to 1.77×10 -3 a -1. The contributions of climatic change and human activities accounted for 40% and 60%, respectively, to the increase of NDVI in China in the past 34 years. The regions where the contribution rates of human activities were more than 80% were mainly distributed in the central part of the Loess Plateau, the North China Plain, and the northeast and the southwest of China. There were 22 provincial-level regions where the contributions of human activities were more than 50%, and the shares of contribution induced by human activities in Shanghai, Heilongjiang, and Yunnan were much greater than those of any other regions. The results suggest that we should focus more on the role of human activities in vegetation restoration in the whole country.
1982—2015年中国气候变化和人类活动对植被NDVI变化的影响
DOI:10.11821/dlxb202005006
[本文引用: 1]
基于中国603个气象站的地表气温和降水观测资料以及GIMMS NDVI3g数据,采用变化趋势分析和多元回归残差分析等方法研究了1982—2015年中国植被NDVI变化特征及其主要驱动因素(即气候变化和人类活动)的相应贡献。结果表明:① 1982—2015年中国植被恢复明显,在选择的32个省级行政区中,山西、陕西和重庆的生长季NDVI增加最快,仅上海生长季NDVI呈减小趋势。② 气候变化和人类活动的共同作用是中国植被NDVI呈现整体快速增加和巨大空间差异的主要原因,其中气候变化对各省生长季NDVI变化的影响在-0.01×10 <sup>-3</sup>~1.05×10 <sup>-3</sup> a <sup>-1</sup>之间,而人类活动的影响在-0.32×10 <sup>-3</sup>~1.77×10 <sup>-3</sup> a <sup>-1</sup>之间。③ 气候变化和人类活动分别对中国近34年来植被NDVI的增加贡献了40%和60%;人类活动贡献率超过80%的区域主要集中在黄土高原中部、华北平原以及中国东北和西南等地;人类活动贡献率大于50%的省份有22个,其中贡献率最大的3个地区为上海、黑龙江和云南。研究结果建议应更加重视人类活动在植被恢复中的作用。
