

1 引言
地下水变化常用的监测方法主要包括监测井观测、模型模拟和重力卫星观测。监测井的选点受地形等客观条件约束,其数量和空间分布往往代表性有限,难以获得区域连续的地下水动态变化信息。受模型结构和参数化方案等因素的影响,使用水文模型模拟区域水储量具有很大的挑战性[4],水文模型对地下水储量的模拟存在很高的不确定性。2002年重力场恢复与气候实验(Gravity Recovery and Climate Experiment, GRACE)卫星的发射为研究地球系统质量变化、全球水循环和气候变化创造了新机遇[5⇓-7],同时也为地下水储量的大尺度监测提供了新手段[8]。通过扣除水文模型模拟的地表水组分,可以从GRACE观测的陆地水储量(Terrestrial Water Storage, TWS)变化数据中分离出地下水储量(Groundwater Storage, GWS)变化。例如,Scanlon等[9]联合GRACE和GLDAS(Global Land Data Assimilation System)模型的输出结果,评估了美国高平原和中央山谷地区的地下水枯竭状况。Feng等[10]从GRACE观测的陆地水储量变化中移除土壤水储量变化,获得了华北地区的地下水储量变化。Chen等[11]基于GRACE和GLDAS数据,计算了印度西北部2003—2012年的地下水下降速率。联合GRACE卫星与陆地水储量组分方程已成为目前估算大尺度地下水储量变化的主流方法。
天山北坡位于中国新疆,地处亚欧桥国门。过去几十年,天山北坡社会经济快速发展,给水资源管理带来了较大压力[12],气候变化也对天山北坡的水循环过程造成了深刻影响[13]。受气候变化和人类活动的共同影响,天山北坡面临严峻的水资源危机,是中国陆地水储量下降速率最明显的3个地区之一[14]。天山北坡的绿洲经济和灌溉农业对地下水资源的依赖程度高,但地下水资源状况不容乐观,例如昌吉市自2010—2019年地下水位从2 m下降到6 m[13]。相比于华北平原和青藏高原等热点区域,针对天山北坡水储量变化的研究比较匮乏,主要集中在点尺度上的地下水位动态分析,面尺度研究较少。在面尺度上,一般以新疆[15]、中国西北地区[16]乃至中亚地区[17]作为研究区,虽然在空间上涵盖了天山北坡,但仍存在以下三点不足:其一,空间分辨率过于粗糙。GRACE观测数据的足迹约为200000 km2,无法直接应用于小尺度水文研究[18-19]。已有研究采用的GRACE TWSA数据的表观分辨率多为1º×1º。在此分辨率下,天山北坡仅有大约30个像元,如此有限的空间样本量不利于准确识别水储量的时空分异特征。其二,研究时段较短,均不超过20 a。由于GRACE卫星发射较晚,且GRACE和GRACE-FO之间存在空窗期,已有研究的时间序列较短,无法得知重力卫星观测时代以前的水储量变化,难以开展长期变化趋势检测。其三,绝大多数研究的地下水储量估算结果都受到冰川质量变化的干扰。已有研究多忽视了冰川覆盖的影响,直接从陆地水储量中扣除土壤水储量和雪水当量来获得地下水储量,其计算结果杂糅了冰川质量变化信号,无法真实反映区域地下水储量的变化。
受上述局限性的影响,迄今对天山北坡地下水储量的长期演变规律及其时空分异特征尚无清晰全面的认识。本文基于重建的长序列陆地水储量数据、ERA5-Land再分析数据和土壤质地、海拔高程、植被指数和冰川分布等辅助数据,考虑冰川覆盖的影响,联合随机森林回归降尺度模型与陆地水储量组分方程,估算获得天山北坡非冰川覆盖区1990—2020年的较高分辨率(8 km)长序列地下水储量数据集。基于该数据集,揭示过去30 a天山北坡地下水储量的时空演变规律及其驱动力,并初步量化冰川覆盖对地下水储量估算结果的影响。本文可为天山北坡水资源管理和地下水可持续利用提供参考。
2 研究区概况与数据来源
2.1 研究区概况
天山北坡位于中国新疆(79.33ºE~96.51ºE, 42.06ºN~47.63ºN)。其面积为225462 km2,占新疆面积的13.54%,人口数量和GDP分别占新疆的33.96%和62.2%[12]。天山北坡的海拔范围为188~5138 m,从南到北海拔逐渐降低(图1),自然景观呈现出“山地—平原绿洲—荒漠绿洲—荒漠”的过渡变化特征。天山北坡最主要的土地覆盖类型是草地、裸地和耕地,三者占比合计97.46%,其中草地占比最高(42.30%)(图2)。从水资源角度来看,天山北坡属于中国一级水资源分区中的西北诸河区,主要包含额敏河、艾比湖水系、中段诸河、东段诸河、古尔班通古特荒漠区和巴伊盆地6个三级水资源分区(三级水资源分区出处:
图1
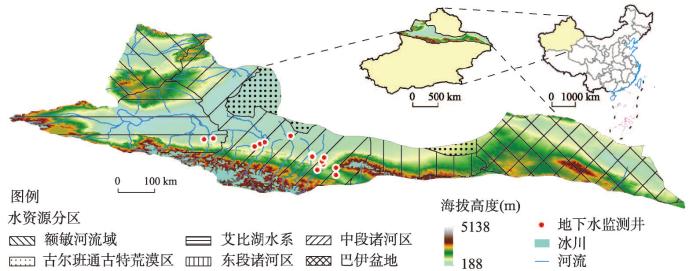
图1
研究区概况
注:基于自然资源部标准地图服务网站GS(2020)4642号的标准地图制作,底图边界无修改。
Fig. 1
Location of the northern slope of the Tianshan Mountains
图2
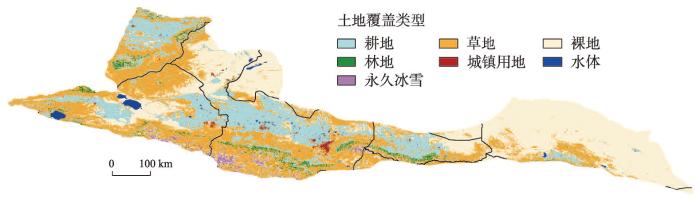
图2
2020年天山北坡土地覆盖
Fig. 2
Land cover on the northern slope of the Tianshan Mountains in 2020
2.2 数据来源
2.2.1 重建的长序列陆地水储量变化数据
Li等[20-21]基于德克萨斯大学空间研究中心(Center for Space Research, CSR)发布的RL06 GRACE/GRACE-FO mascon产品,以气温、降水、海面温度、土壤湿度、蒸散发和地表/地下径流等气候水文变量为驱动数据,结合统计分解、时间序列分解和机器学习方法,重建了1979—2020年的全球逐月陆地水储量变化数据,空间分辨率为0.5º×0.5º。Li等[21]使用卫星激光测距(Satellite Laser Ranging, SLR)数据和全球海平面变化验证发现,该数据集相比于Humphrey等[22]基于经典统计方法重建的陆地水储量变化数据集表现出更高的可靠性。
2.2.2 陆地水储量组分数据
陆地水储量组分数据来源于ERA5-Land。ERA5-Land是欧洲中期天气预报中心(European Centre for Medium-Range Weather Forecasts, ECMWF)第五代再分析产品(The fifth generation of European ReAnalysis, ERA5)中的最新陆地分量数据集[23]。本文使用ERA5-Land提供的土壤水分、雪水当量、地表径流和冠层水储量数据,选取的时间跨度为1990—2020年,时间分辨率为月,空间分辨率为0.1º×0.1º。ERA5-Land将土壤剖面分为4层,即0~7 cm、7~28 cm、28~100 cm和100~289 cm。将每层的土壤体积含水量乘以土层厚度得到各层土壤水储量,并对4层土壤的水储量进行累加得到整个剖面的土壤水储量。为了与陆地水储量数据的单位相匹配,各组分数据都统一使用等效水柱高(cm)为单位。由于GRACE卫星解算得到的并非陆地水储量的绝对数值,而是相对于基准期(2004—2009年)平均陆地水储量的异常值,因此其他水储量组分相应扣除各自2004—2009年的平均值得到异常值,便于进行水储量之间的加减运算。
2.2.3 降尺度辅助数据
除了2.2.2章节提及的水储量组分数据外,在开展陆地水储量数据降尺度时,还用到其他辅助数据。在气候方面,使用ERA5-Land提供的气温、地表温度、土壤温度、降水量和实际蒸散发数据。在植被方面,使用ERA5-Land提供的叶面积指数和GIMMS/MODIS提供的归一化植被指数数据。在地形方面,使用美国奋进号航天飞机的雷达地形测绘任务(Shuttle Radar Topography Mission, SRTM)提供的海拔高度数据,并在此基础上利用ArcGIS的栅格表面分析工具提取坡度数据。在土壤方面,使用世界土壤数据库(Harmonized World Soil Database, HWSD)提供的土壤砂粒、粉粒和粘粒含量数据。另外,使用ERA5-Land提供的地下径流数据来表征地下水的影响。由于长序列高分辨率的农业管理数据集比较匮乏,本文使用的辅助数据均为自然变量,在降尺度过程中将通过残差校正来间接考虑人类活动的影响。
2.2.4 实测地下水位数据
用于验证GWSA估算结果的实测数据来源于中国地质环境监测院编写的《中国地质环境监测地下水位年鉴》。对年鉴数据进行质量检查,观测时间跨度不足3年的监测井不予考虑,个别地下水埋深为负值的监测井也直接剔除,共筛选出天山北坡范围内14个监测井用于验证本文的估算结果(图1)。14个监测井的海拔高程范围为400~1300 m,分布在7个水文地质单元内,其中5个用于监测承压水,9个用于监测潜水。需要注意的是,年鉴提供的监测数据是地下水埋深,需结合地面高程将其转换为水位。严格来说,应该将实测水位变化乘上给水度转换为实测水储量变化之后再对估算结果进行验证。但由于给水度具有强烈的空间变异性,准确获取区域给水度的空间分布极具挑战性。因此,本文参考Yin等[24]和Chen等[25]的处理方法,通过计算实测水位序列与估算的地下水储量变化序列的皮尔逊相关系数,从时间变化过程角度来验证估算结果的准确性。
2.2.5 其他数据
使用Randolph Glacier Inventory(RGI)发布的6.0版本全球冰川数据勾绘研究区内的冰川空间分布(图1)。使用哥白尼气候变化服务局(Copernicus Climate Change Service, C3S)提供的2020年全球土地覆盖类型图,用于分析地下水储量变化在不同覆盖类型的差异。土地覆盖数据的空间分辨率为300 m,包含22种覆盖类型(其中永久冰雪数据来自RGI),本文将其聚合为耕地、林地、草地、裸地、城镇用地、水体和永久冰雪(图2),并升尺度至8 km,与GWSA估算结果的空间分辨率相匹配。为了解释地下水储量的年内变化特征与年际变化趋势,还用到以下数据。降水量、融雪量和地表径流量数据来自ERA5-Land。乌鲁木齐河源1号冰川的累积物质平衡数据来自文献[26]。月尺度灌溉量数据来自Zhang等[27]基于多源卫星遥感产品估算的2011—2018年全球灌溉农田灌溉用水量数据集。天山北坡的用水总量、第一产业用水量和农作物播种面积数据来源于《新疆统计年鉴》,天山北坡的空间范围用乌鲁木齐市、克拉玛依市、石河子市、哈密市、昌吉回族自治州、塔城地区和博尔塔拉蒙古自治州表示。受统计资料本身的限制,用水量数据的时间跨度为2004—2019年。
3 研究方法
3.1 地下水储量变化的估算方法
式中:
需要特别指出的是,在非冰川覆盖区,GlacierWSA为0,式(1)适用。而在冰川覆盖区,由于高分辨率、长序列的冰川质量变化数据难以获取,GlacierWSA未知,故式(1)无法用于估算冰川覆盖区的GWSA。为此,本文结合SRTM DEM和RGI冰川分布数据,将冰川从研究区中剔除,仅对天山北坡非冰川覆盖区的地下水储量变化进行估算分析。由于冰川占研究区的面积比例仅约占12%(图1),且天山北坡的地下水开发利用主要集中于平原区和盆地,因此非冰川覆盖区的分析结果可在很大程度上代表天山北坡的地下水储量变化情况。若无特别说明,下文有关地下水储量的分析中所提及的天山北坡都是指天山北坡非冰川覆盖区。
3.2 基于随机森林回归与残差校正的降尺度方法
本文使用随机森林回归算法将TWSA数据从原始分辨率(0.5º)降尺度至目标分辨率(8 km)。由于8 km分辨率辅助数据较少,而0.1º分辨率辅助数据十分常见。因此本文首先将TWSA数据降尺度至0.1º分辨率,再将其重采样至8 km分辨率。按照图3所示流程估算获得降尺度的高分辨率TWSA与GWSA数据:
图3
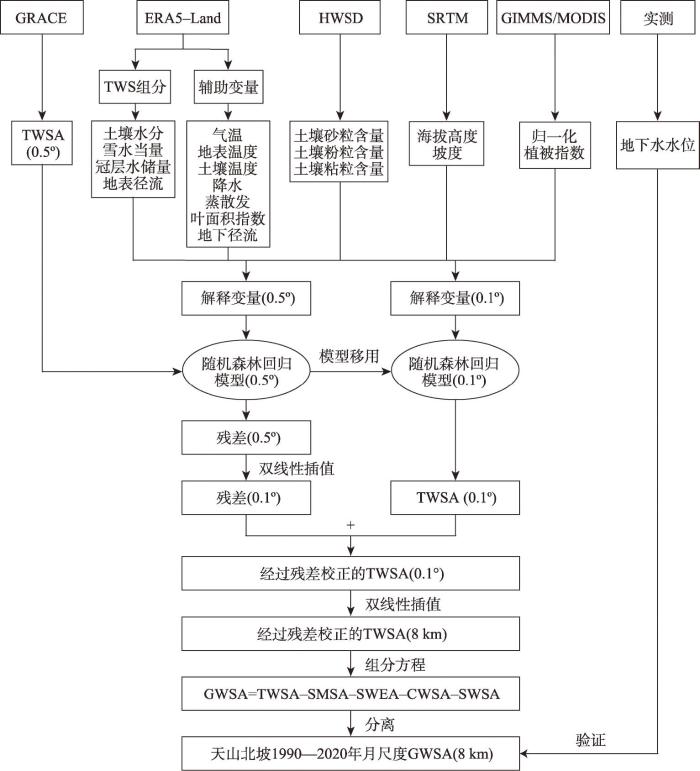
(1)模型参数优化与低分辨率情景建模。对每1个月,以全部像元的低分辨率(0.5º)TWSA和辅助数据作为样本,按照80%∶20%的比例划分训练集和验证集。随机森林模型有两个重要参数需要优化,即决策树数量(ntree)和每个节点输入的变量数量(mtry)。对于ntree,以50为步长,将决策树数量从50改变至1000。对于mtry,以1为步长,将变量数量从1改变至18(最大值为自变量总数)。其他参数使用缺省值。通过对ntree和mtry遍历360次,选择预测误差最小的参数组合,实现模型参数的优化。基于最优参数组合,建立每个月的低分辨率情景下的随机森林回归模型。
(2)高分辨率情景预测。假设变量之间的联系不会随着空间分辨率的改变而变化,低分辨率条件下建立的统计回归模型同样适用于高分辨率情景,将高分辨率(0.1º)自变量输入随机森林回归模型,初步获得0.1º的TWSA。
(3)残差校正。将0.5º的自变量重新输入模型,得到TWSA的预测值。TWSA的实际值和预测值之差即为残差,代表模型无法解释的部分(主要是人类活动的影响)。使用双线性插值方法,将0.5º的残差重采样得到0.1º的残差。将步骤(2)获得的0.1º的TWSA与0.1º的残差相加,得到经过残差校正的0.1º的TWSA。
(4)进一步提高空间分辨率。使用双线性插值方法,将经过残差校正的0.1º的TWSA和0.1º的水储量组分(SMSA等)重采样至8 km,达到本文的目标分辨率。
(5)组分分离。从TWSA中扣除其他组分,得到8 km分辨率的GWSA,并使用实测水位数据对GWSA估算结果的准确性进行验证。
3.3 地下水储量变化趋势的检测方法
采用Theil-Sen median趋势估计方法[30]计算GWSA的年际变化趋势。Theil-Sen median方法是一种非参数统计的趋势计算方法,其计算结果稳健,不易受异常值的影响。变化趋势β通过式(2)计算:
式中:
GWSA的时间变化可以看作不同频率组分变化(低频的长期变化、季节性周期变化和更高频的亚季节变化)的综合体现。使用STL(Seasonal and Trend decomposition using Loess)方法[32]将GWSA原始序列分解为不同频率的组分:
4 结果分析
4.1 基于随机森林回归与残差校正的降尺度效果评价
图4
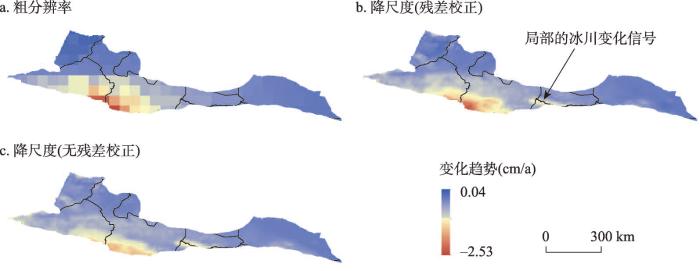
图4
降尺度前后TWSA的年际变化趋势
Fig. 4
Interannual trends in TWSA before and after downscaling
4.2 基于实测水位数据的GWSA估算结果评价
通过计算14个监测井的实测水位数据与对应像元内的8 km分辨率GWSA数据的相关系数,对估算结果进行评价。结果表明,有9个监测井呈现显著正相关,有4个监测井呈不显著负相关,有1个监测井呈现显著负相关(表1)。其中,有6个监测井的相关系数超过0.5,相关系数最大值达到0.68。总体来看,GWSA估算结果的精度可以接受。
表1 监测井实测水位数据与GWSA估算结果的相关性
Tab. 1
| 序号 | 海拔(m) | 监测深度(m) | 地下水类型 | 水文地质单元 | 相关系数 |
|---|---|---|---|---|---|
| 1 | 559.2 | 44.00~103.22 | 承压水 | 头屯河冲积平原 | 0.65** |
| 2 | 596 | 58.40~83.00 | 承压水 | 头屯河冲积平原 | 0.20* |
| 3 | 967.46 | 1.08~30.28 | 潜水 | 乌鲁木齐市河谷 | -0.02 |
| 4 | 836.94 | 25.35~49.76 | 潜水 | 乌鲁木齐市河谷 | -0.13 |
| 5 | 731.92 | 30.44~66.18 | 潜水 | 乌鲁木齐市河谷 | 0.28** |
| 6 | 1210.95 | 71.68~98.60 | 承压水 | 柴窝堡盆地 | -0.06 |
| 7 | 1136.9 | 25.44~77.18 | 潜水 | 柴窝堡盆地 | -0.03 |
| 8 | 579.22 | 50.00~80.00 | 潜水 | 乌鲁木齐河北部平原 | 0.68** |
| 9 | 459 | 27 | 承压水 | 奎屯河冲积平原 | 0.50** |
| 10 | 528.99 | 95 | 潜水 | 奎屯河冲积平原 | 0.28** |
| 11 | 470.93 | 41.00~110.21 | 潜水 | 玛纳斯河冲积平原 | 0.60** |
| 12 | 447.18 | 59.29~150.64 | 承压水 | 玛纳斯河冲积平原 | 0.55** |
| 13 | 935.46 | 185.78~224.72 | 潜水 | 奎屯河冲积平原 | -0.24** |
| 14 | 414.27 | 0.00~50.00 | 潜水 | 呼图壁河流域 | 0.61** |
注:*和**分别表示在0.05和0.01水平上显著。
值得留意的是,验证精度不佳的5个监测井恰好是海拔最高的5个监测井(井3、井4、井6、井7和井13)(表1)。对14个监测井的相关系数和海拔高度进行相关性分析发现,二者的相关系数为-0.839(p < 0.01)。可以初步认为,海拔越高,则估算结果与实测数据的一致性越差。但依靠如此有限的观测数据尚且不能得到确切结论,高海拔地区验证精度较差的具体原因还有待商榷。另外,这5个监测井中有4个用于监测潜水。说明导致验证精度较低的另一个原因可能是实测数据反映的潜水水位变化与基于GRACE估算得到的地下水总储量变化在垂直范围上存在较大差异,二者的变化不完全同步。
4.3 天山北坡地下水储量的年内变化特征
图5
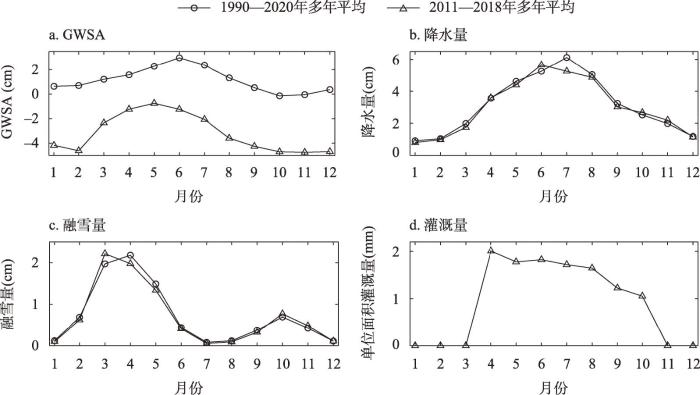
图5
天山北坡GWSA、降水量、融雪量和灌溉量的季节变化
Fig. 5
Seasonal variation of GWSA, precipitation, snowmelt and irrigation on the northern slope of the Tianshan Mountains
地下水储量的年内变化特征是自然补给和人为耗散共同作用的结果。从补给角度来看,天山北坡地下水储量的季节变化受大气降水和冰雪融水共同调节。大气降水主要发生在山区,山区降水形成径流之后向河道输送,可以沿途补给地下水。由于径流过程需要一定的时间,降水对地下水的补给存在滞后。然而,地下水储量的峰值出现于6月,早于降水峰值的出现时间(7月,图5b),说明大气降水对天山北坡地下水储量的调节作用比较有限。受春季气温回升的影响,天山北坡的融雪量在4月达到峰值(图5c),此后地下水储量在6月达到峰值。若从补给滞后性的角度来看,冰雪融水可能是天山北坡地下水储量的主要补给来源。陈亚宁等[36]研究指出,冰雪融水对西北干旱区径流年内分布的贡献比例在4—7月较高,在6月达到最高值。上述研究中冰雪融水占比的峰值与本文地下水储量的峰值都出现在6月,反映了冰雪融水对天山北坡地下水储量年内变化的重要调节作用。
由于灌溉量数据的时间跨度为2011—2018年,因此图5另外补充了各个变量在2011—2018年的年内变化。两种时段得到的年内变化特征存在一定差异,但大体上十分相似。2011—2018年,天山北坡地下水储量在5月达到峰值,在11月达到最低值,其峰值的出现时间同样早于降水量(6月)而滞后于融雪量(3月)。地下水储量的季节变化同样受大气降水、冰雪融水和农业活动的共同影响。
4.4 天山北坡地下水储量的年际变化趋势
图6
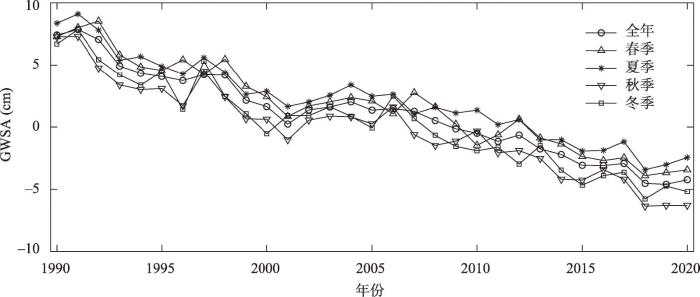
图6
天山北坡GWSA的年际变化
Fig. 6
Interannual variation of GWSA on the northern slope of the Tianshan Mountains
图7
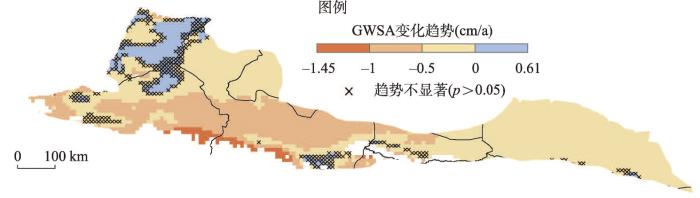
图8
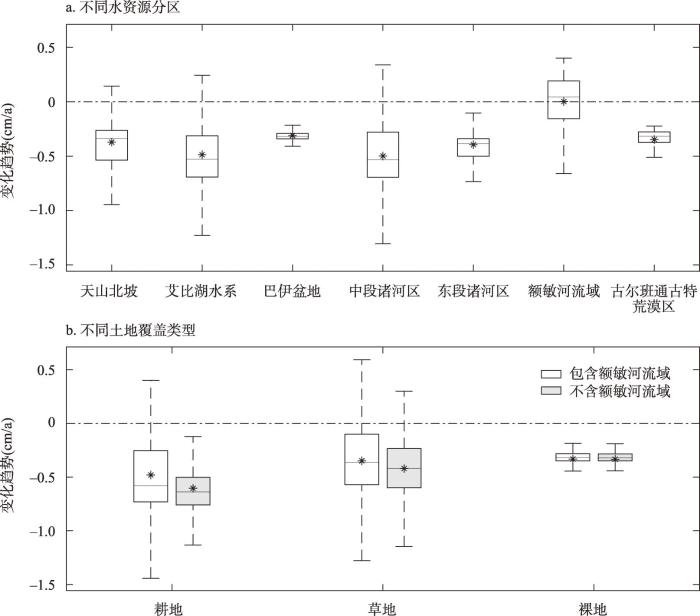
图8
不同水资源分区和土地覆盖类型的GWSA变化趋势
Fig. 8
Interannual trends in GWSA in different subregions and land cover types
对天山北坡最主要的3种土地覆盖类型(耕地、草地和裸地)的地下水储量变化速率统计发现,耕地的变化速率最大,为-0.48 cm/a(p < 0.01);草地次之,为-0.36 cm/a(p < 0.01);裸地的变化速率最小,为-0.33 cm/a(p < 0.01)(图8b)。耕地地下水储量的急剧下降主要受农业抽水灌溉的影响。由于额敏河流域地下水储量无显著变化趋势,因此,本文另外统计了不含额敏河流域的天山北坡地区不同土地覆盖类型的地下水储量变化速率,得到耕地、草地和裸地的变化速率分别为-0.60 cm/a、-0.45 cm/a和-0.34 cm/a(p < 0.01)(图8b)。耕地和草地内部地下水储量变化速率的离散程度较大,裸地内部相对均一(图8)。
天山北坡的水循环过程独特,水资源形成区和耗散区明显分离。山区的大气降水和冰雪融水是水资源的主要来源,最终耗散于平原区的绿洲和荒漠[37]。1990—2020年天山北坡地下水储量的显著下降反映了水资源形成区的自然补给和水资源耗散区的人为耗水之间的严重失衡。1990—2020年天山北坡的水资源自然补给量总体呈现增加态势。以乌鲁木齐河源1号冰川为例,1990—2020年天山山脉冰川发生了剧烈消融(图9a),冰川融水量显著增加。在相同时期,天山北坡的降水量呈现不显著的微弱下降趋势(图9b)。从人为耗水的角度来看,农业是天山北坡最主要的用水部门,2004—2019年第一产业用水量占用水总量的比例高达87.44%。1990—2020年天山北坡的用水总量(图9c)、第一产业用水量(图9d)和农作物播种面积(图9e)均显著增加,给水资源管理带来了巨大压力。天山北坡绿洲农业发达,建成了玛纳斯河灌区、三屯河灌区、奎屯河灌区、头屯河灌区和呼图壁河灌区等全国知名大中型灌区。灌区的灌溉水源可以大致分为3种类型。其一,通过渠系引用河流水库的地表水灌溉;其二,在灌区修建机井抽取地下水灌溉;其三,在山前向斜凹地开发利用地下水库并向灌区输送灌溉[38]。无论是引用地表水灌溉抑或抽取地下水灌溉,都会影响区域地下水位的动态变化。在中国西北干旱区,地表水与地下水同出一源,二者存在错综复杂的动态联系并不断进行频繁的转换[37]。据统计,新疆内陆河流域平原区大约有80%~85%的地下水来源于地表水的转换补给[39-40]。大量引用地表水灌溉将导致自然河道对地下水的补给减少,1990—2020年天山北坡的地表径流亦呈现显著下降趋势(图9f),与地下水储量的变化一致。相比于地表水灌溉,抽取地下水灌溉对地下水储量的影响则更为直接。例如,三工河流域由于长期开发山前地下水库,导致潜水溢出带疏干转变为农田,地下水库水位平均每年下降0.4 m[41]。1990—2020年昌吉州、哈密盆地、乌苏市和沙湾县等地区的机井数量迅速增加,地下水开采量与日俱增,导致地下水位持续下降[42⇓⇓-45]。例如,昌吉州的机井数量从1990年的4252眼增加至2010年的10476眼[42],沙湾县的机井数量从2008年的895眼增加至2017年的6448眼[45]。综上所述,1990—2020年虽然天山北坡地下水资源的自然补给量有所增加,但由于农业耗水量亦快速增加且居高不下,农业耗水对区域地下水储量变化的负向影响大大超过了自然补给的正向影响,导致地下水储量持续下降。因此,节水灌溉与高效灌溉是解决天山北坡地下水储量枯竭困境的突破口和必由之路。
图9
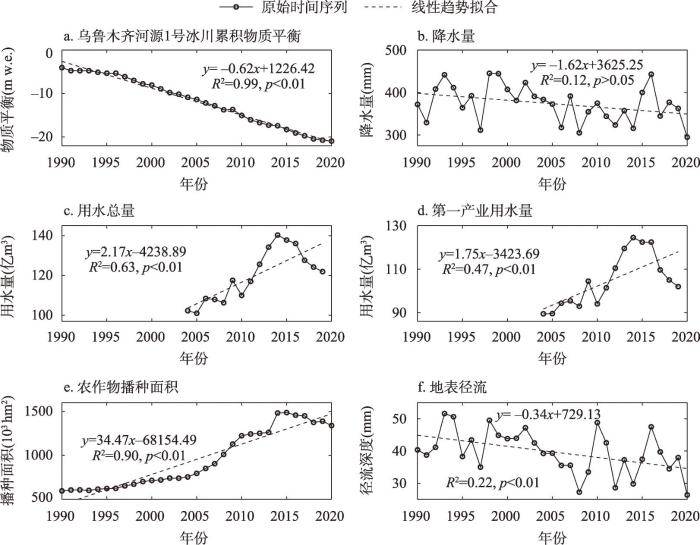
图9
天山北坡冰川物质平衡、降水量、用水量、农作物播种面积和地表径流的年际变化
Fig. 9
Interannual variations of glacier mass balance, precipitation, water consumption, sown areas of farm crops and surface runoff in NSTM
4.5 天山北坡地下水储量时间变化的主导模式
将每个像元的GWSA时间序列分解为长期趋势项、季节变化项和残差项,三者信号方差占总信号方差之比的取值范围分别为28.13%~97.96%、0.39%~53.37%和0.49%~40.74%。长期趋势项的方差占比最高,季节变化项次之,残差项最低,绝大部分地区地下水储量的时间变化以长期变化为主(图10)。在像元尺度上地下水储量变化速率与长期趋势项、季节变化项和残差项的方差占比的相关系数分别为0.43(p < 0.01)、-0.36(p < 0.01)和-0.35(p < 0.01)。说明地下水储量的变化幅度越大,则长期趋势项的主导地位越明显,其余两项越不重要。
图10
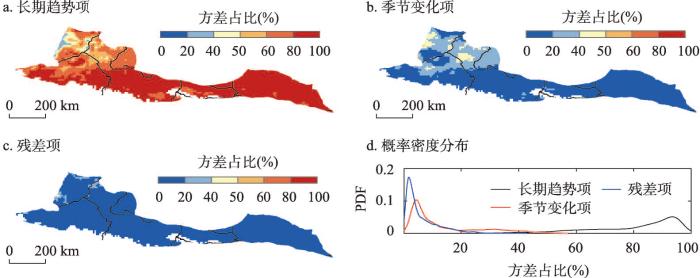
图10
长期趋势项、季节变化项和残差项的方差占比与概率密度分布
Fig. 10
Variance ratio and probability density distribution of long-term, seasonal and subseasonal components
表2 不同地区长期趋势项、季节变化项和残差项的方差占比(%)
Tab. 2
| 地区 | 长期趋势项 | 季节变化项 | 残差项 |
|---|---|---|---|
| 天山北坡 | 91.04 | 7.31 | 1.65 |
| 艾比湖水系 | 86.33 | 10.94 | 2.72 |
| 巴伊盆地 | 94.23 | 4.73 | 1.04 |
| 中段诸河区 | 93.31 | 5.49 | 1.20 |
| 东段诸河区 | 90.46 | 7.53 | 2.00 |
| 额敏河流域 | 43.55 | 36.39 | 20.05 |
| 古尔班通古特荒漠区 | 81.93 | 17.22 | 0.85 |
5 讨论
5.1 与其他研究的结果对比
1990—2020年天山北坡有85.55%的地区地下水储量发生了显著下降,其中艾比湖水系和中段诸河区的下降速率最大,额敏河流域的下降速率最小,额敏河流域和艾比湖水系的部分地区地下水储量呈上升趋势。本节将从地下水动态变化监测的3种常用手段(监测井观测、模型模拟和重力卫星监测)入手,多角度对比本文和其他研究,以验证上文分析结果的合理性。
其次,从模型模拟的角度来看,Li等[48]使用Noah-MP陆面模型模拟了中国的地下水位变化。2000—2018年除了额敏河流域北部地下水位微弱上升外,天山北坡的地下水位主要呈现下降趋势,与本文研究结果相符。
最后,从重力卫星监测角度来看,本文的研究结果也与前人研究基本一致。例如,Yi等[49]联合GRACE和GLDAS分析发现,2003—2014年北疆地区地下水储量呈下降趋势,且艾比湖水系的下降速率最大。Yin等[16]估算了中国西北地区2002—2020年的地下水储量变化,除了玛纳斯河流域最北部呈现微弱的上升趋势外,天山北坡地下水储量主要表现为下降趋势,其中艾比湖水系和中段诸河区的下降速率最大。Lv等[50]基于GRACE和GLDAS估算了中国2002—2017年的地下水储量变化,其结果表明天山北坡几乎全域都呈下降趋势,艾比湖水系和中段诸河区下降速率最大,额敏河流域下降速率最小且存在少量呈上升趋势的像元。Yin等[51]联合GRACE、WGHM(WaterGAP Global Hydrological Model)水文模型、PCR-GLOBWB(PCRsater GLOBal Water Balance)水文模型和GLDAS反演了中国不同流域2002—2016年的地下水储量变化,3种方法都展示了天山北坡地下水储量的全域性下降趋势,且额敏河流域下降速率最小,艾比湖水系下降速率最大。
5.2 冰川覆盖对地下水储量变化估算的影响
在有冰川覆盖的地区,以往使用水储量组分方程估算GWSA的大部分研究都直接忽视了冰川的存在,导致其提取的地下水储量变化信号叠加了冰川变化信号。为了探讨冰川覆盖对GWSA估算结果的影响,我们另外将式(1)中的冰川水储量变化
表3 剔除冰川前后不同地区GWSA的变化趋势(cm/a)
Tab. 3
| 地区 | 未剔除冰川 | 剔除冰川 |
|---|---|---|
| 天山北坡 | -0.48** | -0.38** |
| 艾比湖水系 | -0.60** | -0.49** |
| 巴伊盆地 | -0.31** | -0.31** |
| 中段诸河区 | -0.67** | -0.49** |
| 东段诸河区 | -0.45** | -0.38** |
| 额敏河流域 | -0.008 | -0.006 |
| 古尔班通古特荒漠区 | -0.34** | -0.34** |
注:*和**分别表示在0.05和0.01水平上显著。
从空间分布来看,若不剔除冰川,在冰川覆盖区使用式(1)分离得到的GWSA信号(图11b)基本完全代表了总的TWSA信号(图11a),二者的数值大小和空间分异特征几乎完全一致。Farinotti等[52]研究表明,1961—2012年天山山脉的冰川质量发生了急剧亏损(-5.4±2.8 Gt/yr)。Chen等[53]和Deng等[54]研究指出,冰川消融是导致天山山脉陆地水储量下降的主要原因。因此,若忽视冰川覆盖的影响,将会严重高估地下水储量的下降幅度,进而得到完全错误的结论,即天山山脉陆地水储量下降主要由地下水枯竭造成。可见,在缺乏合适的冰川水储量数据产品的情况下,有必要重视冰川对地下水储量变化估算的影响。若研究区内的冰川面积占比不高,可以尝试剔除冰川,以获取研究区相对准确和合理的地下水储量变化估算结果。
图11
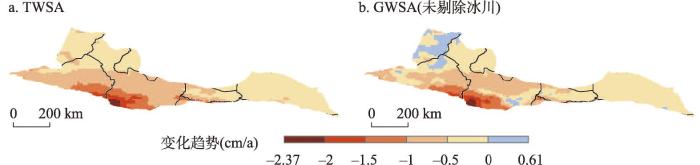
图11
TWSA和未剔除冰川情况下GWSA变化趋势的空间分布
Fig. 11
Spatial distribution of interannual trends in TWSA and GWSA without removal of glaciers
5.3 研究展望
与土壤水储量、雪水当量等组分相比,冰川水储量数据的获取难度极大,高分辨率长序列的冰川物质平衡数据十分稀缺。目前国际上主流的陆面模拟系统(如GLDAS)和再分析资料(如ERA5-Land)由于缺乏冰川模块,都无法提供冰川水储量变化信息,这导致在有冰川发育的地区联合重力卫星与陆地水储量组分方程开展地下水储量变化估算工作面临着巨大的挑战。为避免由于冰川变化信号干扰而导致高估和错估,本文将占比较少的冰川覆盖区从研究区中剔除,仅对天山北坡非冰川覆盖区开展地下水储量变化估算和分析,分析结果基本合理反映了天山北坡的地下水储量演变规律。
作为陆地水储量的关键组分之一,冰川水储量变化信息对于全面揭示区域水储量分异特征和定量评估气候变化对区域水储量的影响具有重要意义。但由于高山区环境恶劣,大范围实地测量冰川物质平衡十分困难。目前常用于计算大尺度冰川质量变化的方法可以归纳为两种:基于冰川形态的方法和基于消融过程的方法。基于冰川形态的方法是指使用光学图像或卫星测高数据计算冰川表面高程的变化速率,进而得到冰川厚度变化速率与冰川物质平衡。例如,Hugonnet等[55]利用海量的ASTER光学卫星立体图像计算DEM并生成了全球2000—2019年的冰川质量变化数据集,Zou等[56]基于该数据集评估了冰川消融对青藏高原地下水储量的影响。龙笛等[35]使用ICESat-2(Ice, Cloud and Land Elevation Satellite-2)卫星测高数据估算了2000—2020年藏东南地区的冰川质量平衡。基于消融过程的方法包括复杂的能量平衡模型和简单的度日模型,其中度日模型应用最广泛。度日模型(又称温度指数模型)是通过建立气温与冰川消融量之间的经验关系来推算冰川物质平衡[57],将其耦合至分布式水文模型(如VIC模型)还能获得分布式的冰川质量变化[58]。在下一阶段,研究将联合使用上述两类方法估算天山北坡1990—2020年冰川水储量变化,在此基础上更全面、准确地量化和揭示冰川质量变化对区域水储量变化的影响。
6 结论
本文基于重建的陆地水储量数据、ERA5-Land再分析资料和海拔高程、土壤质地、植被指数和冰川分布等辅助数据,建立了随机森林回归降尺度模型,估算获得了天山北坡非冰川覆盖区1990—2020年8 km分辨率长时间序列的地下水储量数据,并基于此分析了天山北坡过去30年地下水储量的时空演变规律。
基于随机森林回归建立的TWSA降尺度模型具有较高的可靠性,经过残差校正的降尺度结果基本重现了TWSA的空间分布格局和时间变化模式,且降尺度结果可以更精细地刻画TWSA变化的局部特征。地下水储量变化估算结果与实测水位数据在时间变化上总体比较一致,二者的相关系数最高可达0.68,但估算结果与实测数据在高海拔地区的一致性较差。
受冰雪融水、大气降水和农业灌溉的综合影响,天山北坡的地下水储量呈现夏季和春季较高,秋季和冬季较低的年内变化特征。1990—2020年平均来看,天山北坡的地下水储量自1月开始不断上升,在6月达到峰值,此后持续下降并在10月达到最低值,10月之后地下水储量逐渐缓慢回升。
1990—2020年天山北坡非冰川覆盖区有85.55%地区的地下水储量发生了显著下降。全区平均来看,天山北坡地下水储量的变化趋势为-0.38 cm/a。其中,艾比湖水系和中段诸河区地下水储量下降最剧烈,额敏河流域的下降速率最小,地下水储量几乎不发生变化。在天山北坡最主要的3种土地覆盖类型中,耕地的地下水储量下降速率最大,草地次之,裸地下降速率最小。日益增强的农业耗水活动是1990—2020年天山北坡地下水储量持续下降的主要驱动因素。从不同频率来看,长期变化是天山北坡地下水储量时间变化的主导模式,季节变化和亚季节变化的贡献率较低。对于额敏河流域,地下水储量变化由三者共同主导。
联合重力卫星观测与陆地水储量组分方程已经成为估算区域地下水储量变化的主流方法。当研究区有冰川存在时,使用该方法估算地下水储量变化面临的难题之一是缺少长序列、高分辨率的冰川水储量数据。以往研究大多直接忽视了冰川覆盖的影响。本文研究表明,忽视冰川的影响将会导致天山北坡的平均地下水储量变化速率至少高估27.56%,值得引起重视。
参考文献
Relative contribution of monsoon precipitation and pumping to changes in groundwater storage in India
DOI:10.1038/ngeo2869 [本文引用: 1]
Emerging trends in global freshwater availability
DOI:10.1038/s41586-018-0123-1 [本文引用: 1]
Environmental flow limits to global groundwater pumping
DOI:10.1038/s41586-019-1594-4 [本文引用: 1]
Global models underestimate large decadal declining and rising water storage trends relative to GRACE satellite data
GRACE measurements of mass variability in the Earth system
DOI:10.1126/science.1099192
PMID:15273390
[本文引用: 1]

Monthly gravity field estimates made by the twin Gravity Recovery and Climate Experiment (GRACE) satellites have a geoid height accuracy of 2 to 3 millimeters at a spatial resolution as small as 400 kilometers. The annual cycle in the geoid variations, up to 10 millimeters in some regions, peaked predominantly in the spring and fall seasons. Geoid variations observed over South America that can be largely attributed to surface water and groundwater changes show a clear separation between the large Amazon watershed and the smaller watersheds to the north. Such observations will help hydrologists to connect processes at traditional length scales (tens of kilometers or less) to those at regional and global scales.
The gravity recovery and climate experiment: Mission overview and early results
Contributions of GRACE to understanding climate change
DOI:10.1038/s41558-019-0456-2 [本文引用: 1]
Satellite-based estimates of groundwater depletion in India
DOI:10.1038/nature08238 [本文引用: 1]
Groundwater depletion and sustainability of irrigation in the US High Plains and Central Valley
Evaluation of groundwater depletion in North China using the Gravity Recovery and Climate Experiment (GRACE) data and ground-based measurements
DOI:10.1002/wrcr.20192 URL [本文引用: 1]
Long-term groundwater variations in Northwest India from satellite gravity measurements
DOI:10.1016/j.gloplacha.2014.02.007 URL [本文引用: 1]
Spatiotemporal characteristics of the expansion of an urban agglomeration and its effect on the eco-environment: Case study on the northern slope of the Tianshan Mountains
DOI:10.1007/s11430-018-9369-x [本文引用: 2]
Climate change and water security in the northern slope of the Tianshan Mountains
DOI:10.1016/j.geosus.2022.08.004 URL [本文引用: 2]
Assessment and attribution of China's droughts using an integrated drought index derived from GRACE and GRACE-FO data
Groundwater depletion estimated from GRACE: A challenge of sustainable development in an arid region of Central Asia
Under climate change and increasing water demands, groundwater depletion has become regional and global threats for water security, which is an indispensable target to achieving sustainable developments of human society and ecosystems, especially in arid and semiarid regions where groundwater is a major water source. In this study, groundwater depletion of 2003–2016 over Xinjiang in China, a typical arid region of Central Asia, is assessed using the gravity recovery and climate experiment (GRACE) satellite and the global land data assimilation system (GLDAS) datasets. In the transition of a warm-dry to a warm-wet climate in Xinjiang, increases in precipitation, soil moisture and snow water equivalent are detected, while GRACE-based groundwater storage anomalies (GWSA) exhibit significant decreasing trends with rates between-3.61 ± 0.85 mm/a of CSR-GWSA and −3.10 ± 0.91 mm/a of JPL-GWSA. Groundwater depletion is more severe in autumn and winter. The decreases in GRACE-based GWSA are in a good agreement with the groundwater statistics collected from local authorities. However, at the same time, groundwater abstraction in Xinjiang doubled, and the water supplies get more dependent on groundwater. The magnitude of groundwater depletion is about that of annual groundwater abstraction, suggesting that scientific exploitation of groundwater is the key to ensure the sustainability of freshwater withdrawals and supplies. Furthermore, GWSA changes can be well estimated by the partial least square regression (PLSR) method based on inputs of climate data. Therefore, GRACE observations provide a feasible approach for local policy makers to monitor and forecast groundwater changes to control groundwater depletion.
Regional Characteristics and impact factors of change in terrestrial water storage in northwestern China from 2002 to 2020
DOI:10.1109/JSTARS.2022.3224864 URL [本文引用: 2]
Temporal and spatial variations in the terrestrial water storage across Central Asia based on multiple satellite datasets and global hydrological models
Global analysis of approaches for deriving total water storage changes from GRACE satellites
DOI:10.1002/wrcr.v51.4 URL [本文引用: 1]
Remote sensing of groundwater: Current capabilities and future directions
Comparison of data-driven techniques to reconstruct (1992-2002) and predict (2017-2018) grace-like gridded total water storage changes using climate inputs
Long-term (1979-present) total water storage anomalies over the global land derived by reconstructing GRACE data
GRACE-REC: A reconstruction of climate-driven water storage changes over the last century
DOI:10.5194/essd-11-1153-2019
[本文引用: 1]
The amount of water stored on continents is an important constraint for water mass and energy exchanges in the Earth system and exhibits large inter-annual variability at both local and continental scales. From 2002 to 2017, the satellites of the Gravity Recovery and Climate Experiment (GRACE) mission have observed changes in terrestrial water storage (TWS) with an unprecedented level of accuracy. In this paper, we use a statistical model trained with GRACE observations to reconstruct past climate-driven changes in TWS from historical and near-real-time meteorological datasets at daily and monthly scales. Unlike most hydrological models which represent water reservoirs individually (e.g., snow, soil moisture) and usually provide a single model run, the presented approach directly reconstructs total TWS changes and includes hundreds of ensemble members which can be used to quantify predictive uncertainty. We compare these data-driven TWS estimates with other independent evaluation datasets such as the sea level budget, large-scale water balance from atmospheric reanalysis, and in situ streamflow measurements. We find that the presented approach performs overall as well or better than a set of state-of-the-art global hydrological models (Water Resources Reanalysis version 2). We provide reconstructed TWS anomalies at a spatial resolution of 0.5 degrees, at both daily and monthly scales over the period 1901 to present, based on two different GRACE products and three different meteorological forcing datasets, resulting in six reconstructed TWS datasets of 100 ensemble members each. Possible user groups and applications include hydrological modeling and model benchmarking, sea level budget studies, assessments of long-term changes in the frequency of droughts, the analysis of climate signals in geodetic time series, and the interpretation of the data gap between the GRACE and GRACE Follow-On missions. The presented dataset is published at https://doi.org/10.6084/m9.figshare.7670849 (Humphrey and Gudmundsson, 2019) and updates will be published regularly.
ERA5-Land: A state-of-the-art global reanalysis dataset for land applications
DOI:10.5194/essd-13-4349-2021
URL
[本文引用: 1]
. Framed within the Copernicus Climate Change Service (C3S) of the European Commission, the European Centre for Medium-Range Weather Forecasts (ECMWF) is producing an enhanced global dataset for the land component of the fifth generation of European ReAnalysis (ERA5), hereafter referred to as ERA5-Land. Once completed, the period covered will span from 1950 to the present, with continuous updates to support land monitoring applications. ERA5-Land describes the evolution of the water and energy cycles over land in a consistent manner over the production period, which, among others, could be used to analyse trends and anomalies. This is achieved through global high-resolution numerical integrations of the ECMWF land surface model driven by the downscaled meteorological forcing from the ERA5 climate reanalysis, including an elevation correction for the thermodynamic near-surface state. ERA5-Land shares with ERA5 most of the parameterizations that guarantees the use of the state-of-the-art land surface modelling applied to numerical weather prediction (NWP) models. A main advantage of ERA5-Land compared to ERA5 and the older ERA-Interim is the horizontal resolution, which is enhanced globally to 9 km compared to 31 km (ERA5) or 80 km (ERA-Interim), whereas the temporal resolution is hourly as in ERA5. Evaluation against independent in situ observations and global model or satellite-based reference datasets shows the added value of ERA5-Land in the description of the hydrological cycle, in particular with enhanced soil moisture and lake description, and an overall better agreement of river discharge estimations with available observations. However, ERA5-Land snow depth fields present a mixed performance when compared to those of ERA5, depending on geographical location and altitude. The description of the energy cycle shows comparable results with ERA5. Nevertheless, ERA5-Land reduces the global averaged root mean square error of the skin temperature, taking as reference MODIS data, mainly due to the contribution of coastal points where spatial resolution is important. Since January 2020, the ERA5-Land period available has extended from January 1981 to the near present, with a 2- to 3-month delay with respect to real time. The segment prior to 1981 is in production, aiming for a release of the whole dataset in summer/autumn 2021. The high spatial and temporal resolution of ERA5-Land, its extended period, and the consistency of the fields produced makes it a valuable dataset to support hydrological studies, to initialize NWP and climate models, and to support diverse applications dealing with water resource, land, and environmental management. The full ERA5-Land hourly (Muñoz-Sabater, 2019a) and monthly (Muñoz-Sabater, 2019b) averaged datasets presented in this paper are available through the C3S Climate Data Store at https://doi.org/10.24381/cds.e2161bac and https://doi.org/10.24381/cds.68d2bb30, respectively.
Statistical downscaling of grace-derived groundwater storage using ET data in the North China Plain
DOI:10.1029/2017JD027468 URL [本文引用: 1]
Downscaling of GRACE-derived groundwater storage based on the random forest model
Groundwater is an important part of water storage and one of the important sources of agricultural irrigation, urban living, and industrial water use. The recent launch of Gravity Recovery and Climate Experiment (GRACE) Satellite has provided a new way for studying large-scale water storage. The application of GRACE in local water resources has been greatly limited because of the coarse spatial resolution, and low temporal resolution. Therefore, it is of great significance to improve the spatial resolution of groundwater storage for regional water management. Based on the method of random forest (RF), this study combined six hydrological variables, including precipitation, evapotranspiration, runoff, soil moisture, snow water equivalent, and canopy water to conduct downscaling study, aiming at downscaling the resolution of the total water storage and groundwater storage from 1° (110 km) and to 0.25° (approximately 25 km). The results showed that, from the perspective of long time series, the prediction results of the RF model are ideal in the whole research area and the observations wells area. From the perspective of space, the detailed changes of water storage could be captured in greater detail after downscaling. The verification results show that, on the monthly scale and annual scale, the correlation between the downscaling results and the observation wells is 0.78 and 0.94, respectively, and they both reach the confidence level of 0.01. Therefore, the RF downscaling model has great potential for predicting groundwater storage.
Glacier changes on the north slope of Tianshan Mountains in recent 60 years
近60 a天山北坡冰川变化研究
Estimation of global irrigation water use by the integration of multiple satellite observations
Global biomass variation and its geodynamic effects: 1982-1998
Estimating groundwater storage changes in the Mississippi River Basin (USA) using GRACE
DOI:10.1007/s10040-006-0103-7 URL [本文引用: 1]
Eestimates of regression coefficient based on Kendall's tau
DOI:10.1080/01621459.1968.10480934 URL [本文引用: 1]
Nonparametric tests against trend
DOI:10.2307/1907187 URL [本文引用: 1]
STL: A seasonal-trend decomposition procedure based on loess
Assessing global water storage variability from GRACE: Trends, seasonal cycle, subseasonal anomalies and extremes
DOI:10.1007/s10712-016-9367-1 URL [本文引用: 1]
Climate change threatens terrestrial water storage over the Tibetan Plateau
DOI:10.1038/s41558-022-01443-0 [本文引用: 1]
Remote sensing retrieval of water storage changes and underlying climatic mechanisms over the Tibetan Plateau during 2000-2020
遥感反演2000—2020年青藏高原水储量变化及其驱动机制
Research progress on the impact of climate change on water resources in the arid region of Northwest China
DOI:10.11821/dlxb201409005
[本文引用: 3]
The arid region of Northwest China is a special natural unit, which responds sensitively to the global climate change. Studies on the impact of climate change on water resources in the arid region of Northwest China have a significant effect on the adaptability of future climate change. Based on the latest research results, this paper analyzes the impacts of climate change on the formation and transformation of water resources and water cycle in the arid region of Northwest China. The results can be shown as follows: (1) The air temperature and precipitation in the arid region of Northwest China had a significant increasing trend in the past 50 years, however, the sharp increasing trend has retarded since the 21st century. (2) The temperature change in winter could be the most important factor for the unusually sharp rise in annual air temperature in this region. Moreover, the Siberian High and carbon dioxide emissions could be the most important reasons for the higher rate of the winter temperature rise. (3) Pan evaporation in the region exhibited an obvious decreasing trend until the early 1990s (1993), however, the downward trend reversed to go upward since 1993. The negative effects of warming and increasing evaporation on ecology have been highlighted in the arid region of Northwest China. (4) The glacier change has exerted great impact on water resources and its annual distribution in the arid region of Northwest China, and many rivers have passed the "Glacier inflexion". In the Tarim River Basin, the proportion of glacier melt water to runoff is high (e.g., as much as 50%) and it is supposed that the runoff may show a great fluctuation in the near future. Global warming not only increases the frequency and intensity of hydrological extremes, but also intensifies the fluctuation and uncertainty of inland rivers.
西北干旱区气候变化对水文水资源影响研究进展
DOI:10.11821/dlxb201409005
[本文引用: 3]
西北干旱区是对全球变化响应最敏感地区之一,研究分析全球变暖背景下的西北干旱区水资源问题,对应对和适应未来气候变化带来的影响具有重要意义。本文通过对西北干旱区气候变暖影响下的水资源形成、转化与水循环等关键问题最新研究成果的总结分析,得出如下结论:(1) 西北干旱区温度、降水在过去的50年出现过“突变型”升高,但进入21世纪,温度和降水均处于高位震荡,升高趋势减弱;(2) 西北干旱区冬季温度的大幅升高是拉动年均温度抬升的重要原因,而西伯利亚高压活动和二氧化碳排放是引起冬季升温的重要影响因素;(3) 西北干旱区蒸发潜力在1993年出现了一个明显的转折变化,由显著下降逆转为显著上升的趋势。气候变暖、蒸发水平增大对西北干旱区生态效应的负作用已经凸显;(4) 西北干旱区冰川变化对水资源量及年内分配产生了重要影响,部分河流已经出现冰川消融拐点。在塔里木河流域,冰川融水份额较大 (50%),可能在未来一段时期,河川径流还将处在高位状态波动。全球气候变暖在加大极端气候水文事件发生频率和强度的同时,加剧了西北干旱区内陆河流域的水文波动和水资源的不确定性。
Ponder on the issues of water resources in the arid region of northwest China
西北干旱区水资源问题研究思考
Investigation of key technologies for underground water storage structures and groundwater reservoirs in Xinjiang
新疆地下储水构造及地下水库关键技术研究
Practice and prospects for study of hydrology problems on arid inland river basin
干旱地区内陆河流域水文问题的研究实践与展望
Mechanism of water cycle changes and implications on water resources regulation in Xinjiang Uygur Autonomous Region
新疆水循环变化机理与水资源调蓄
Preliminary recognition of the development and utilization of the groundwater reservoir in the piedmont areas of the Sangonghe river watershed
对三工河流域山前地下水库开发利用的初步认识
Analysis of multi-year dynamic changes of groundwater in the plain area of Changji prefecture
昌吉州平原区地下水多年动态变化分析
Groundwater change tendency in Hami Basin in the past 20 years
近20a来哈密盆地地下水埋深变化趋势
The evolution trend of groundwater level in Usu city under the influence of human activities
人类活动影响下乌苏市地下水埋深演化趋势
Dynamic trend and driving factors of groundwater in Shawan irrigated district under changing environment
According to the relationship between the groundwater system and the external environment in Shawan county,combined with thedata of the average buried depth of the groundwater level in the irrigation area from 1998 to 2017,three correlation rank test methods,including Pearson,Kendall and Spearman,were adopted to analyze the environment changing trend of the irrigation area in the nearly 20years and its influence on the groundwater dynamics. The principal component regression analysis was used to determine the main drivingfactors affecting the change of groundwater depth in irrigation areas. The results showed that in the past 20 years,the average annualtemperature in the irrigation area presented an insignificant increase trend,while the precipitation presented an insignificant decrease trend.In the past 10 years ( 2008-2017),the surface water irrigation amount presented a significant decrease trend at the level of a = 0.01,and theirrigation area,water-saving irrigation area and groundwater exploitation all presented a significant increase trend. The driving factors ofgroundwater dynamic change are groundwater mining,surface water irrigation,water-saving irrigation,irrigation area,air temperature andprecipitation,and the influence degree decreases successively. Human activities play a leading role in groundwater dynamics,among whichthe increase of water-saving irrigation area with groundwater as the main water source is the main reason for the decrease of groundwaterlevel. The sustainable utilization of groundwater resources in the study area should be realized by adjusting agricultural structure,improvingagricultural irrigation efficiency,and combining water - saving irrigation with surface and underground water while converting farmland toforests and filling wells.
变化环境下新疆沙湾县灌区地下水动态趋势及驱动因素
Dynamic response of groundwater depth to land use and temporal-spatial evolution of drought in the eastern plains of Changji prefecture from 2000 to 2020
2000—2020年昌吉州东部平原区地下水位埋深对土地利用及干旱时空演变的动态响应
Analysis and countermeasures of groundwater overexploitation in Shihezi city, Xinjiang province
新疆石河子市地下水超采现状分析及对策
The decline in the groundwater table depth over the past four decades in China simulated by the Noah-MP land model
Basin mass dynamic changes in China from GRACE based on a multibasin inversion method
DOI:10.1002/jgrb.v121.5 URL [本文引用: 1]
Attributing terrestrial water storage variations across China to changes in groundwater and human water use
DOI:10.1175/JHM-D-20-0095.1
URL
[本文引用: 1]
This study investigated the attribution of terrestrial water storage (TWS) variations across China to changes in groundwater and human water use. As one vital storage component, the groundwater storage (GWS) derived from the Jet Propulsion Laboratory’s GRACE (Gravity Recovery and Climate Experiment) mass concentration solution compared reasonably well with the in situ groundwater table depth, with the correlation coefficients ranging from −0.83 to −0.18, all of which were statistically significant at the 95% confidence level. About 71% of the trends in derived GWS had the same sign as those of observations, without systematic deviation, across China. The GWS variation contributed a large portion of the TWS trend in most regions of China, and the majority of contribution values reached 50%–150% in the Hai River basin, the Loess Plateau, and the middle portion of the Yangtze River basin. The dominant role of GWS is closely related to the detected long-term “memories” in both TWS and GWS. The increase of irrigation consumption accelerated the TWS depletion trend by 13.4% in the Huai River basin, while the decrease of consumptive agricultural water use alleviated the TWS decline rate by 4.1% in the Hai River basin. Importantly, the correlation coefficients reached 0.74–0.95 between the TWS change and the residual of precipitation, evapotranspiration, flow into the sea, and irrigation consumption in the four river basins of particular interest. The findings of this study are helpful for understanding regional water cycles in China.
Variations of groundwater storage in different basins of China over recent decades
Substantial glacier mass loss in the Tien Shan over the past 50 years
DOI:10.1038/NGEO2513
[本文引用: 1]
Farinotti, Daniel; Duethmann, Doris; Vorogushyn, Sergiy; Guentner, Andreas GFZ German Res Ctr Geosci, D-14473 Potsdam, Germany. Farinotti, Daniel Swiss Fed Inst Forest Snow & Landscape Res WSL, CH-8903 Birmensdorf, Switzerland. Longuevergne, Laurent Univ Rennes, CNRS, UMR Geosci 6118, Natl Ctr Sci Res, FR-35042 Rennes, France. Moholdt, Geir Norwegian Polar Res Inst, Fram Ctr, NO-9296 Tromso, Norway. Moelg, Thomas Friedrich Alexander Univ Erlangen Nurnberg FAU, Inst Geog, Climate Syst Res Grp, D-91058 Erlangen, Germany. Bolch, Tobias Univ Zurich, Dept Geog, CH-8057 Zurich, Switzerland. Bolch, Tobias Tech Univ Dresden, Inst Cartog, D-01062 Dresden, Germany.
Changes in central Asia's water tower: Past, present and future
The Tienshan Mountains, with its status as "water tower", is the main water source and ecological barrier in Central Asia. The rapid warming affected precipitation amounts and fraction as well as the original glacier/snowmelt water processes, thereby affecting the runoff and water storage. The ratio of snowfall to precipitation (S/P) experienced a downward trend, along with a shift from snow to rain. Spatially, the snow cover area in Middle Tienshan Mountains decreased significantly, while that in West Tienshan Mountains increased slightly. Approximately 97.52% of glaciers in the Tienshan Mountains showed a retreating trend, which was especially obvious in the North and East Tienshan Mountains. River runoff responds in a complex way to changes in climate and cryosphere. It appears that catchments with a higher fraction of glacierized area showed mainly increasing runoff trends, while river basins with less or no glacierization exhibited large variations in the observed runoff changes. The total water storage in the Tienshan Mountains also experienced a significant decreasing trend in Middle and East Tienshan Mountains, but a slight decreasing trend in West Tienshan Mountains, totally at an average rate of -3.72 mm/a. In future, water storage levels are expected to show deficits for the next half-century.
Influences of recent climate change and human activities on water storage variations in Central Asia
DOI:10.1016/j.jhydrol.2016.11.006 URL [本文引用: 1]
Accelerated global glacier mass loss in the early twenty-first century
DOI:10.1038/s41586-021-03436-z [本文引用: 1]
Solid water melt dominates the increase of total groundwater storage in the Tibetan Plateau
Temperature index melt modelling in mountain areas
DOI:10.1016/S0022-1694(03)00257-9 URL [本文引用: 1]
Changes in terrestrial water storage during 2003-2014 and possible causes in Tibetan Plateau
DOI:10.1029/2018JD029552 URL [本文引用: 1]
