

1 引言
近年来高精度遥感数据的涌现弥补了观测数据空间不连续的限制,且利用遥感数据直接率定水文模型的方法也得到了一定程度的应用。该方法最大的优点是不受制于实测径流测时间序列的长度和地区,不仅在水文测站稀缺地区具有应用潜力,在强人类扰动的流域也能较好地模拟预测“天然”径流。如Patricia等[11]采用GLEAM实际蒸散发等遥感数据直接约束水文模型,表明单独使用遥感数据约束水文模型在一定程度上合理模拟径流过程;Zhang等[12]采用了基于改进Penman-Monteith-Leuning模型的全球遥感实际蒸散发产品(PML-AET)率定水文模型方法,应用于澳大利亚222个流域,结果表明该方法在湿润地区的月、年尺度径流预测能力较好。研究进一步表明,采用经水量平衡校正后的遥感蒸散发数据约束水文模型,可以获得更高的径流预测精度。如Huang等[13]基于Zhang等的研究,进一步提出了改进型的基于遥感数据率定水文模型方法,通过对遥感数据进行偏差校正的方法获取精度更高的研究区实际蒸散发数据、在0.05°格网上分别率定水文模型,充分发挥了遥感数据空间连续性的优势。近年来,业界对水量平衡闭合订正方面的研究方法已经取得很多进展[14⇓-16],其中,Budyko水热平衡耦合的假设框架是典型的方法之一,稳健性好[17]。基于Budyko理论的水量平衡订正的蒸散发数据,可以进一步提升基于遥感手段预测天然径流的潜力[13]。中国幅员辽阔,很多流域位于山地和高海拔区域,布设水文测站成本高,遥感数据在这些流域体现出了很大的优势。因此,亟需要探求基于遥感数据率定水文模型的方法在中国不同区域的适用性。
本文研究基于遥感蒸散发率定水文模型的方法在中国若干流域的空间分异特点,进一步挖掘该方法的应用潜力,回答的具体科学问题包括:① 基于遥感手段的天然径流预测潜力在中国不同区域的空间分异特点;② 不同遥感数据率定水文模型方案(格网率定与集总式率定,单一蒸散发数据与多种遥感数据)预测日径流潜力的差异;③ 采用多个水文模型对基于遥感手段的天然径流预测有效性的提升。
2 数据与方法
2.1 研究数据
表1 研究数据概况
Tab. 1
| 数据名称 | 全称 | 空间分辨率 | 时间分辨率 | 时间范围 | 数据链接 |
|---|---|---|---|---|---|
| MSWEP | MSWEP(V2.8) 多源加权融合 降水产品 | 0.1° | d | 1979— | |
| MSWX | 多源气象数据 | 0.1° | d | 1979— | |
| PML-V2(China) | 中国区域PML-V2 陆地蒸散发与总初级生产力数据集 | 500 m | d | 2000—2021 | |
| GRACE | 重力卫星数据 | 1° | 月 | 2002—2017 | |
| SMC | 中国土壤水数据 | 0.05° | 月 | 2002—2018 | |
| 日径流 | 中国84个水文站日资料 | - | d | 2000—2016 (各站点不同) | 水文年鉴、雅砻江水电开发有限公司 |
本文气象驱动数据为MSWX,时空分辨率为0.1°、3 h,时间跨度为1979年至今,为水文模型提供了可靠的输入[18]。本文降水驱动来自于MSWEP(V2.8)[19],融合了全球范围内多种站点资料、遥感及卫星资料以及再分析资料,同时结合径流及潜在蒸散发资料进行订正,是MSWX降水的升级版,与MSWX具有相同的时空分辨率和时间跨度,且广泛应用于中国地区降水评估及水文模拟,在中国大陆地区具有较高精度[23⇓⇓-26]。PML-V2(China)为中国区域陆地蒸散发和总初级生产力数据集[20],采用PML-V2诊断模型估算了中国区域2000年2月26日—2020年12月31日500 m的日蒸散发数据。该数据包括5个要素:总初级生产(GPP)、植被蒸腾(Ec)、土壤蒸发量(Es)、截留降雨蒸发(Ei)和水体、冰雪蒸发(ET_water)。与PML-V2全球数据[27]相比,PML-V2(China)产品的蒸散发时间分辨率及模拟精度有了一定的提高。本文采用的水储量数据来自重力反演和气候实验数据(Gravity Recovery and Climate Experiment, GRACE)[21],时间和空间分辨率较粗糙(月尺度、1°×1°、2002年4月—2017年2月)。GRACE数据集分别来自3个机构:喷气推进实验室(Jet Propulsion Laborator, JPL)、德克萨斯大学空间研究中心(University of Texas Center for Space Research, UTCSR)和波茨坦地质勘探局(Geo Forschungs Zentrum Potsdam, GFZ)。本文使用的GRACE数据的水储量数据LWE是3个数据集的平均值。本文采用的土壤水分数据为2002—2018年中国高分辨率土壤水分数据集(A Fine-resolution Soil Moisture Dataset for China, SMC)(0.05°、月尺度)[22]。该数据克服了光学数据源与微波数据源之间的多源数据时间匹配问题,消除了不同传感器观测误差之间的差异。本文采用的径流数据来自中国水文年鉴,根据全球流域属性数据[28],筛选了径流数据所在时段中84个水库影响小于5%的流域,避免由于人类调水造成模型率定结果不能代表真实产流过程,进而无法验证径流预测能力的问题。
需要指出,不同驱动/遥感数据的时空分辨率不一致(表1)。由于本文将两种月尺度数据(LWE和SMC)作为模型土壤水约束变量,仅需要通过模型输出的土壤水日序列获取月序列,并计算月尺度动态,即可与月尺度遥感土壤水动态数据匹配,无需预处理月遥感数据至日尺度。在空间分辨率的统一上,本文分别将以上数据统一重新分配到0.25°格网和流域集总两种研究尺度。其中,在格网尺度,高分辨率的数据面积加权平均,低分辨率数据(如LWE)以0.25°格网直接提取;在流域集总尺度,这些遥感数据通过面积加权平均的方式平均到流域尺度上。以上数据经过时空尺度的处理后,可以进一步应用于不同方案(见2.3研究方法)、不同模型的输入数据或约束变量。
2.2 研究区概况
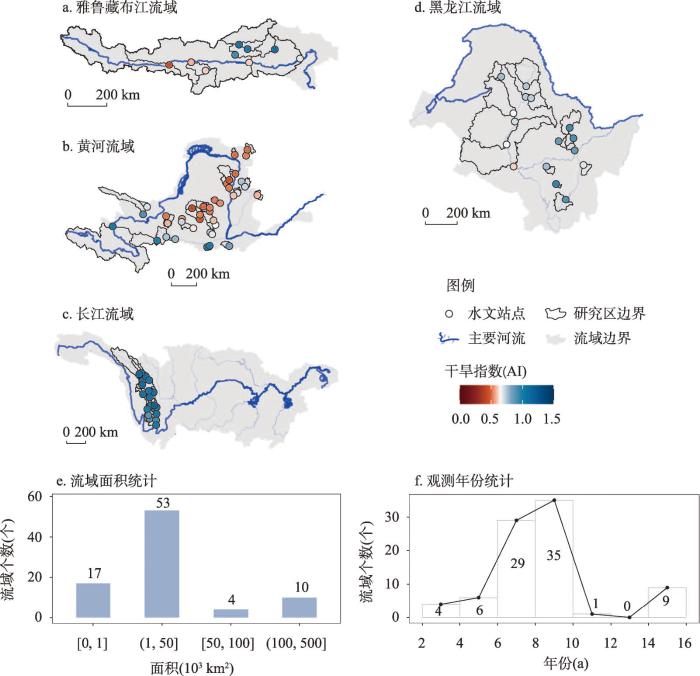
本文研究区为中国受人类活动影响小、且满足2000年以来日径流观测数据超过两年的84个流域,研究时段内流域内水库调蓄程度小于5%,水库调蓄程度通过水库库容与多年平均径流量之比来衡量[28]。本文选择的84个流域自北向南覆盖了中国区域的黑龙江流域子流域、黄河流域中上游、长江流域上游及雅鲁藏布江流域(中国境内名称)。研究区大部分为上述四大流域的3级小流域(图1a~1d),流域面积覆盖范围广:其中小于1000 km2的流域有17个,介于1000~50000 km2之间的流域有53个,大于5万km2的流域有14个(图1e)。本文进一步将这些流域划分为1850个0.25°的格网。自2000年以来,流域日径流数据大多为6~10 a(图1f);干旱指数(多年平均降水与多年平均蒸散发的比值)范围0.44~1.18,其中干旱指数大于0.65为湿润区,小于0.65为干旱区。本文干旱指数采用多年平均MSWEP降水与MSWX计算得出的多年平均潜在蒸散发比值计算,其空间分布与已有研究的中国干旱指数分布图吻合[29]。
图1
2.3 研究方法
式中:
图2
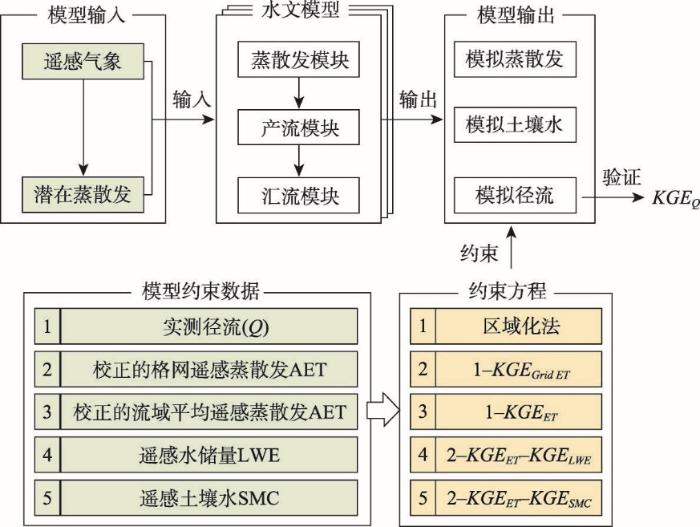
图2
研究技术路线
注:约束方程1表示基准方案:参数区域化法,约束方程中2~5代表遥感手段率定水文模型方案。
Fig. 2
Framework of the study
图2中,遥感蒸散发AET的校正方法见2.3.1,水文模型见2.3.2,约束方案描述见2.3.3。
2.3.1 蒸散发数据校正方法
式中:
本文获取邻近流域的参数α作为目标流域参数α。区别于传统水文模型参数区域化法需要邻近流域大量实测数据的特点,本文采用的参数仅由邻近流域多年平均尺度降水、径流及潜在蒸散发推导,降低了区域化法对邻近流域水文数据的长度及时间分辨率要求。本文在0.25°格网上校正PML-V2(China)蒸散发产品(后简称为PML-V2),校正步骤如下:
第一步:选取某个目标格网的邻近格网(假设目标格网为无资料地区),获取其多年平均降水
第二步:以
第三步:以目标格网
第四步:依据目标格网多年平均蒸散发
第五步:将校正因子SC应用于PML-V2的日数据,可以得到PML-V2的校正后数据。
PML-V2蒸散发的校正在尽可能少采用实测径流时间序列的情况下,完成了格网尺度的校正,通过面积加权平均即可获得流域尺度的校正结果。这对遥感蒸散发率定水文模型方法在径流数据稀缺地区的应用具有重大意义。
2.3.2 水文模型
2.3.3 参数率定
为探讨基于遥感数据率定水文模型方法(即实验组)是否具有优势,首先应当设定相对于遥感数据率定水文模型方法的对照组。由于本文中假定研究区为径流数据稀缺地区,故设置对照组为目前径流数据稀缺地区水文模拟的最常用方法——区域化法(基准方案)。本文中采用了区域化法中最邻近法的结果,其参数为各流域最邻近有观测径流数据流域采用径流Q率定水文模型时的该流域参数,区域化法径流预测能力是其他方案的评价基准。模型方案2~5为实验组,主要探索遥感数据率定水文模型方法在中国的空间分异,以及同一类型的要素采用不同数据在该方法表现的空间分异结果。方案2为采用校正的遥感蒸散发约束水文模型方法在0.25°的格网上约束水文模型,并采用面积加权平均法汇总格网径流至流域出口;方案3为采用校正的面平均遥感蒸散发约束水文模型;方案4在方案3的基础上加入GRACE水储量动态数据(LWE)同时约束模型蒸散发和模型土壤水;方案5同方案4,仅在土壤水数据方面不同,采用了中国土壤水数据(SMC)。
理论上,遥感数据率定水文模型方法的率定期时段不受径流数据限制,可以为任意遥感数据覆盖的时段。本文为了保持5种参数率定方案的统一性,其率定时段均采用了流域径流数据覆盖时段。每个流域率定期前两年为模型预热期。
3 结果与分析
3.1 遥感数据率定水文模型方法在中国不同区域的表现
如图3为遥感数据率定水文模型方法的不同约束方案(方案2~5)相对基准方案(方案1)在日尺度径流预测能力KGEQ的散点图。总体上,方案2~5在日尺度与方案1预测径流能力还有一定差距。这种差距在各流域、各约束方案以及各水文模型之间不尽相同。
图3
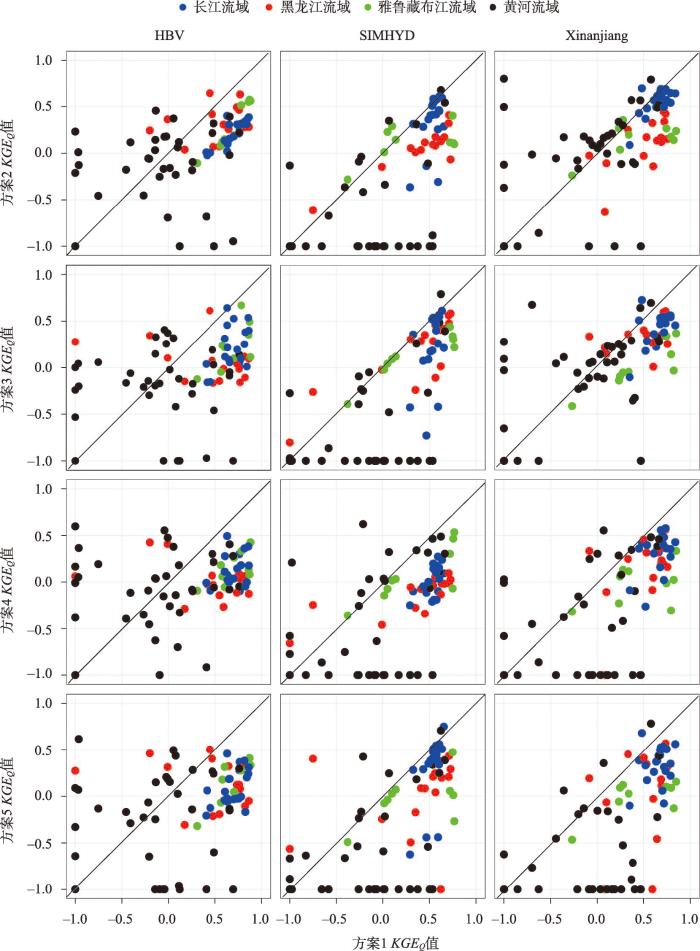
图3
不同约束方案相对基准方案在日尺度径流评价指标径流预测能力散点图
注:图中<-1的值显示为-1;横坐标为84个流域方案1的径流预测评价结果,第1~4行分别为方案2~5径流预测评价结果;第1~3列分别表示应用HBV、SIMHYD、Xinanjiang 3种水文模型结果。
Fig. 3
Scatters of runoff prediction ability of different schemes against those of baseline scheme
从流域上来看,各方案均在长江流域日径流预测能力最优,黑龙江流域和雅鲁藏布江流域次之,黄河流域最差。在湿润区(如长江流域的雅砻江),在网格上率定XAJ模型(方案2)可以取得和传统区域化法(方案1)接近的模型表现。在干旱区(如黄河流域),网格上率定XAJ模型(方案2)在多数流域可以优于传统区域化法(方案1)的模型表现。在寒冷流域(如黑龙江流域),网格上率定HBV模型(方案2)可以取得和传统区域化法(方案1)接近的模型表现。在高海拔流域(如雅鲁藏布江流域的部分流域),在网格上率定SIMHYD模型(方案2)可以取得和传统区域化法(方案1)接近的模型表现。
图4
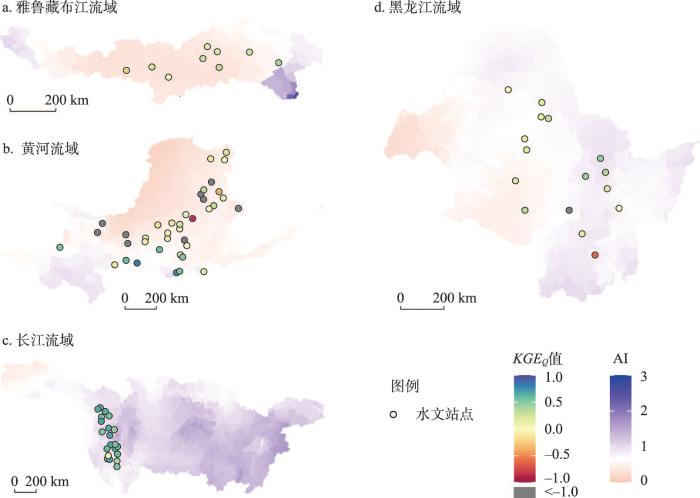
图4
方案2采用Xinanjiang模型的KGEQ空间分布
Fig. 4
The KGEQ of scheme 2 using Xinanjiang hydrological model
3.2 不同遥感数据率定水文模型方案预测径流能力对比
表2汇总了不同遥感数据率定水文模型方案(方案2~5)的日径流预测能力,其中值来自不同模型、不同流域的集合。从方案之间对比来看,格网ET约束(方案2:0.13±2.01)水文模型提升了流域面平均ET约束(方案3:0.07±2.46)的径流预测能力;总体来看,加入土壤水数据(方案4:-0.01±4.48和方案5:-0.03±3.37)并未进一步提升方案3的径流预测能力。
表2 不同方案日径流预测能力(KGEQ)汇总
Tab. 2
| 方案2 | 方案3 | 方案4 | 方案5 | |
|---|---|---|---|---|
| 最大值 | 0.80 | 0.79 | 0.62 | 0.78 |
| 中值 | 0.13±2.01 | 0.07±2.46 | -0.01±4.48 | -0.03±3.37 |
注:中值数据为中位数±标准差。
表3 不同方案在不同流域应用不同水文模型的日径流预测能力(KGEQ)汇总
Tab. 3
| 流域 | 方案 | HBV | SIMHYD | Xinanjiang |
|---|---|---|---|---|
| 黑龙江流域 | 方案2 | 0.29±0.52 | 0.09±0.53 | 0.14±0.61 |
| 方案3 | 0.06±0.21 | 0.29±0.38 | 0.34±0.55 | |
| 方案4 | -0.03±0.2 | -0.05±0.22 | 0.21±0.9 | |
| 方案5 | 0.12±0.26 | 0.14±0.41 | 0.19±1.11 | |
| 雅鲁藏布江流域 | 方案2 | 0.19±0.26 | 0.12±0.19 | 0.2±0.17 |
| 方案3 | 0.22±0.25 | 0.12±0.24 | -0.05±0.24 | |
| 方案4 | 0.13±0.17 | 0.02±0.3 | 0.02±0.22 | |
| 方案5 | 0.28±0.24 | 0.01±0.26 | 0.09±0.19 | |
| 长江流域 | 方案2 | 0.22±0.13 | 0.42±0.28 | 0.58±0.14 |
| 方案3 | 0.12±0.23 | 0.4±0.37 | 0.48±0.18 | |
| 方案4 | 0.08±0.16 | 0±0.16 | 0.36±0.21 | |
| 方案5 | 0.05±0.19 | 0.4±0.36 | 0.37±0.2 | |
| 黄河流域 | 方案2 | -0.11±1.29 | -1.69±3.95 | -0.01±1.11 |
| 方案3 | -0.17±2.02 | -2.04±4.66 | 0.05±1.7 | |
| 方案4 | -0.05±1.16 | -0.82±6.15 | -0.72±8.95 | |
| 方案5 | -0.16±2.15 | -1.7±3.84 | -1.17±6.41 |
注:表中数据为中位数±标准差。
图5
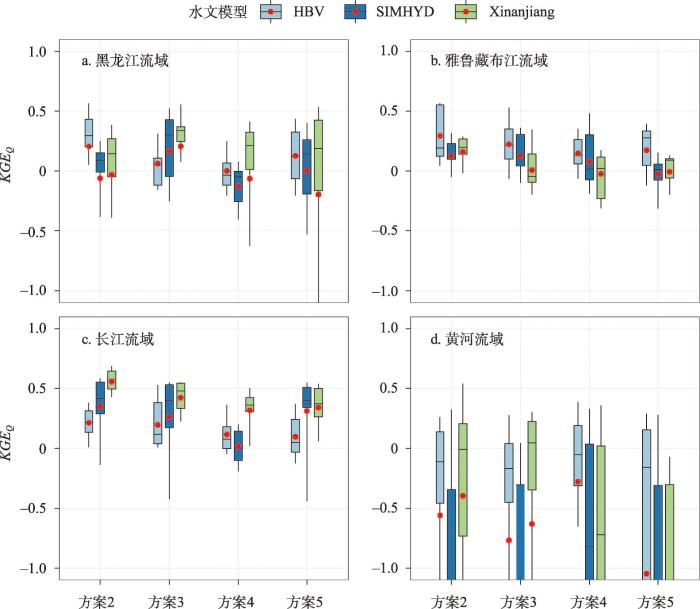
图5
遥感数据约束水文模型方法在不同区域的模型表现
注:红点代表均值,箱体自上而下3条横线分别为75%、50%和25%分位数,竖线两端分别为90%和10%分位数。
Fig. 5
Model performance of remote sensing data based hydrological model calibration at different basins
由表3和图5知,在格网上约束水文模型(方案2)相比集总式约束(方案3)取得更高的径流预测精度。在黑龙江流域,在采用HBV时方案2优于方案3,且方案5在方案3的基础上得到提升,方案4降低了方案3的预测能力;在采用SIMHYD和Xinanjiang模型时方案2、方案4、方案5并未提高方案3的径流预测能力。在雅鲁藏布江流域,采用Xinanjiang模型时,方案2相比方案3径流预测能力得到提高,采用HBV模型时,方案5优于方案3,而采用其他模型、方案,均未进一步提升集总式ET约束水文模型方法的能力。在长江流域,方案2在各水文模型均优于方案3,而方案4、5在方案3的基础上降低了径流预测能力。在黄河流域,虽然方案2采用HBV和SIMHYD时优于方案3,其KGE仍然较低;而方案2采用Xinanjiang时在部分流域相比方案3径流预测能力得到大幅提升,即KGEQ最大值得到提高。同样地,加入土壤水动态数据对方案3径流预测能力提升不大。同样地,结合散点图(图3)来看,在方案3的基础上加入土壤水数据LWE(方案4)或SMC(方案5)约束时,HBV和SIMHYD的径流预测能力在在部分流域相比方案3更优于方案1(例:部分黄河流域方案4与方案5的KGEQ大于0.5,而对应流域方案3的KGEQ小于0.5。这些流域在黄河流域属于个例,因此在表3与图5无法体现),且在结合SMC时具有更高的精度;Xinanjiang在加入LWE和SMC后,大部分流域径流预测能力并未得到明显改进。
综上,方案2在湿润地区(如长江流域、其他流域的部分子流域)预测日径流能力较强,HBV在黑龙江流域和雅鲁藏布江流域加入土壤水动态数据后(方案5)相比方案3进一步提升了径流预测能力。在干旱地区(如黄河流域、雅鲁藏布江的部分流域),方案2即使总体KGEQ不高,仍大幅优于方案3,体现了该方法在干旱区的巨大潜力。
3.3 多水文模型对遥感数据率定方法有效性的提升
Xinanjiang水文模型在湿润区(如长江流域上游)应用方案2时,可以取得较高径流预测精度,其精度和传统区域化法(方案1)接近。且在干旱区(如黄河流域的多数流域)可以优于传统区域化法(方案1)的模型表现。HBV水文模型在高海拔流域(如雅鲁藏布江流域)应用方案2优于其他两种水文模型,在寒冷流域(如黑龙江流域)采用方案2可以取得和传统区域化法(方案1)接近的模型表现。SIMHYD水文模型在高海拔流域(如雅鲁藏布江流域的部分流域)应用方案2~5时,可以取得和方案1相似或更优的径流预测结果。
需要说明的是本文采用的HBV水文模型具有融雪模块,而SIMHYD和Xinanjiang水文模型未嵌入融雪模块,因此在黑龙江流域融积雪较多的地区,在格网上约束后两者时,其径流预测能力相比集总式约束并无显著提升。而在黑龙江流域采用移除融积雪模块后的HBV模型应用方案2后(图6),格网(方案2)结果比集总式(方案3)差,与其他模型一致。因此,在实际应用中,应采用多个水文模型提升该方法在不同流域的应用潜力。
图6
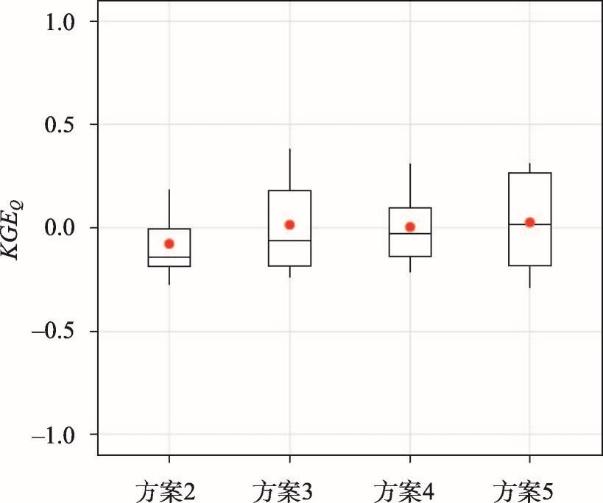
图6
采用移除融积雪模块的HBV模型在黑龙江流域的径流预测评价
注:红点代表均值,箱体自上而下3条横线分别为75%、50%和25%分位数,竖线两端分别为90%和10%分位数。
Fig. 6
The performances of daily runoff using snow-removed HBV model in Amur River
4 结论与展望
本文探索了采用遥感数据直接率定水文模型的方法在中国不同区域预测径流的适用性和潜力。从区域上看,直接采用遥感数据率定水文模型方法在湿润区相比干旱区具有更高的精度,然而该方法在干旱区更有潜力,有可能超越传统的基于实测径流观测序列的最邻近参数移植方法。从模型来看,模型在不同流域的优势各异,应采用多个水文模型提升该方法在不同流域的应用潜力。从约束数据来看,格网蒸散发约束水文模型相比区域蒸散发约束水文模型具有更大优势;采用空间精度更高的土壤水分动态数据(SMC)约束土壤水动态相比采用GRACE水储量动态数据(LWE,空间分辨率较SMC粗糙)提高了部分流域的模型表现;而采用ET结合SMC的方案在黑龙江流域和雅鲁藏布江流域优于仅采用流域平均ET约束的方法。
毋庸置疑,本文还存在一定的不确定性。从数据上来看,即使选择精度较高的输入数据,降雨、径流数据均不可避免地存在一定的偏差,可能对遥感蒸散发的订正带来一定误差;同时,本文采用概念水文模型,水体季节性变化对面平均遥感数据带来的小幅度影响也在本文中没有考虑。在未来研究中,这些可能的误差需要结合实际情况,从多源遥感数据约束的角度进一步分析,如在寒冷地区,可以采用可靠的融积雪遥感数据进一步订正径流过程。从模型上来看,不同的水文模型在不同类型的流域具有一定差异,在实际应用中需要结合多模型进行径流预测,即可在一定程度上提升基于遥感手段的天然径流预测潜力。
尽管存在诸多不确定性,方案2在黄河流域部分流域表现出很大应用潜力,在其他流域,该方案随着空间精度的提升,遥感数据率定水文模型方法也表现出了一定潜力。例如,Patricia等[11]以MSWEP为10 km分布式水文模型输入,以GLEAM实际蒸散发为约束条件在摩洛哥流域率定该水文模型时,取得较高的径流预测能力,优于基于流域属性的区域化法推断的参数预测的日径流。另外,已有研究表明,采用遥感数据约束集总式水文模型在转向半分布式、分布式时,可以取得更高径流预测精度。例如Huang等在雅砻江30个流域上,将该方法应用于格网分布式水文模型时,日径流预测结果优于半分布式和集总式的结果,尤其是优于最邻近法的结果[13]。这一发现表明了采用遥感数据率定水文模型方法的巨大潜力,即当水文模型提高空间分辨率时,遥感数据的空间信息可以得到更有效的利用,获得更精确的径流预测结果。另外,从时间序列的潜力上来看,遥感数据约束水文模型的方法在资料稀缺地区率定水文模型时不会受径流长度的限制,可以为模型率定提供更丰富的信息。
参考文献
A decade of predictions in ungauged basins (PUB): A review
DOI:10.1080/02626667.2013.803183 URL [本文引用: 1]
"Panta Rhei: Everything Flows": Change in hydrology and society: The IAHS scientific decade 2013-2022
DOI:10.1080/02626667.2013.809088 URL [本文引用: 1]
IAHS decade on predictions in ungauged basins (PUB), 2003-2012: Shaping an exciting future for the hydrological sciences
DOI:10.1623/hysj.48.6.857.51421 URL [本文引用: 1]
Study on prediction of ungauged basins: A case study on the Tibetan Plateau
稀缺资料流域水文计算若干研究: 以青藏高原为例
Towards the methodology for predictions in ungauged basins
DOI:10.11820/dlkxjz.2010.11.014
[本文引用: 1]

Based on the research results in the field of predictions in ungauged basins (PUB) available from the literatures and our own research experiences in PUB, the methodology of PUB is generalized to include "borrowing", "replacing" and "creating" methods, according to the logic of a Chinese saying: "even a clever housewife can not cook a meal without rice". Borrowing method is defined as the method to get the data by transplanting the data from a similar region or doing interpolation among the data from the neiboughood area. Replacing method is defined as the method to mine the target data from the related information either from the same research area by simulation, assimilation and interdisciplinary studying or from other areas by upscaling and paired-catchment analysis, all with similar geographic characteristics. Creating method is defined as the method to get the data via field or indoor observation. By combining the above research methods available so far, some clues for breaking through the barriers of PUB research to find the right solutions are proposed.
无测站流域水文预测(PUB)的研究方法
DOI:10.11820/dlkxjz.2010.11.014
[本文引用: 1]
根据国内外研究成果,结合自身的科研体会,借用“巧妇面临无米之炊”时可能用到的“借、替和种米”的应对逻辑,将无测站流域水文预测(Predictions in Ungauged Basins, PUB)的研究方法归纳为移植法、替代法和生成法。将移植法归类为两种,一是当研究地区没有测站资料(简称无资料)而周边某个地区有测站资料(简称有资料)时,如果有资料区的自然地理环境与研究地区相似,直接移用该有资料地区的资料到无资料区,即直接移植法;二是倘若周边不只一个区域有资料,那么就借用所有这些点的信息,采用插值法得到无资料区的资料,即间接移植法。定义替代法为如果本研究区域或者相似区域没有资料,但有可能“求出”资料的辅助信息,则挖掘这些信息的方法。将替代法分为两类,一是根据本研究区域其他信息,通过模型模拟、同化、融合、从本学科和多学科领域挖掘信息等技术,得到本研究区所需资料。二是根据其它研究区域其他信息得到本研究区所需资料,包括就地外延和对比流域法。定义生成法为通过获取第一手资料开展水文预测的方法,包括野外实验和室内实验。通过梳理PUB的这些研究途径,探索了PUB方法发展的可能突破口,旨为推动PUB的研究提供思路。
Review of regionalization methods on streamflow prediction in ungauged basins
无测站流域径流预测区域化方法研究进展
Regionalization of hydrological modeling for predicting streamflow in ungauged catchments: A comprehensive review
Review of hydrological model parameter regionalization for ungauged catchments
缺资料流域水文模型参数区域化研究进展
Spatial proximity, physical similarity, regression and ungauged catchments: A comparison of regionalization approaches based on 913 French catchments
Regionalising rainfall-runoff modelling for predicting daily runoff: Comparing gridded spatial proximity and gridded integrated similarity approaches against their lumped counterparts
DOI:10.1016/j.jhydrol.2017.05.015 URL [本文引用: 2]
Calibration of a large-scale hydrological model using satellite-based soil moisture and evapotranspiration products
DOI:10.5194/hess-21-3125-2017
URL
[本文引用: 2]
. A considerable number of river basins around the world lack sufficient ground observations of hydro-meteorological data for effective water resources assessment and management. Several approaches can be developed to increase the quality and availability of data in these poorly gauged or ungauged river basins; among them, the use of Earth observations products has recently become promising. Earth observations of various environmental variables can be used potentially to increase knowledge about the hydrological processes in the basin and to improve streamflow model estimates, via assimilation or calibration. The present study aims to calibrate the large-scale hydrological model PCRaster GLOBal Water Balance (PCR-GLOBWB) using satellite-based products of evapotranspiration and soil moisture for the Moroccan Oum er Rbia River basin. Daily simulations at a spatial resolution of 5 × 5 arcmin are performed with varying parameters values for the 32-year period 1979–2010. Five different calibration scenarios are inter-compared: (i) reference scenario using the hydrological model with the standard parameterization, (ii) calibration using in situ-observed discharge time series, (iii) calibration using the Global Land Evaporation Amsterdam Model (GLEAM) actual evapotranspiration time series, (iv) calibration using ESA Climate Change Initiative (CCI) surface soil moisture time series and (v) step-wise calibration using GLEAM actual evapotranspiration and ESA CCI surface soil moisture time series. The impact on discharge estimates of precipitation in comparison with model parameters calibration is investigated using three global precipitation products, including ERA-Interim (EI), WATCH Forcing methodology applied to ERA-Interim reanalysis data (WFDEI) and Multi-Source Weighted-Ensemble Precipitation data by merging gauge, satellite and reanalysis data (MSWEP). Results show that GLEAM evapotranspiration and ESA CCI soil moisture may be used for model calibration resulting in reasonable discharge estimates (NSE values from 0.5 to 0.75), although better model performance is achieved when the model is calibrated with in situ streamflow observations. Independent calibration based on only evapotranspiration or soil moisture observations improves model predictions to a lesser extent. Precipitation input affects discharge estimates more than calibrating model parameters. The use of WFDEI precipitation leads to the lowest model performances. Apart from the in situ discharge calibration scenario, the highest discharge improvement is obtained when EI and MSWEP precipitation products are used in combination with a step-wise calibration approach based on evapotranspiration and soil moisture observations. This study opens up the possibility of using globally available Earth observations and reanalysis products of precipitation, evapotranspiration and soil moisture in large-scale hydrological models to estimate discharge at a river basin scale.\n
Can remotely sensed actual evapotranspiration facilitate hydrological prediction in ungauged regions without runoff calibration
Using remote sensing data-based hydrological model calibrations for predicting runoff in ungauged or poorly gauged catchments
A simple and efficient method for correction of basin-scale evapotranspiration on the Tibetan Plateau
Evapotranspiration (ET) is one of the important components of the global hydrologic cycle, energy exchange, and carbon cycle. However, basin scale actual ET (hereafter ETa) is difficult to estimate accurately. We present an evaluation of four actual ET products (hereafter ETp) in seven sub-basins in the Tibetan Plateau. The actual ET calculated by the water balance method (hereafter ETref) was used as the reference for correction of the different ETp. The ETref and ETp show obvious seasonal cycles, but the ETp overestimated or underestimated the ET of the sub-basins in the Tibetan Plateau. A simple and effective method was proposed to correct the basin-scale ETp. The method was referred to as ratio bias correction, and it can effectively remove nearly all biases of the ETp. The proposed method is simpler and more effective in correcting the four ETp compared with the gamma distribution bias correction method. The reliability of the ETp is significantly increased after the ratio bias correction. The ratio bias correction method was used to correct the ETp in the seven sub-basins in the Tibetan Plateau, and regional ET was significantly improved. The results may help improve estimation of the ET of the Tibetan Plateau and thereby contribute to a better understanding of the hydrologic cycle of the plateau.
Water balance-based actual evapotranspiration reconstruction from ground and satellite observations over the conterminous United States
DOI:10.1002/2015WR017311 URL [本文引用: 1]
A worldwide evaluation of basin-scale evapotranspiration estimates against the water balance method
DOI:10.1016/j.jhydrol.2016.04.006 URL [本文引用: 1]
MSWX: Global 3-hourly 0.1° bias-corrected meteorological data including near-real-time updates and forecast ensembles
DOI:10.1175/BAMS-D-21-0145.1
URL
[本文引用: 2]
We present Multi-Source Weather (MSWX), a seamless global gridded near-surface meteorological product featuring a high 3-hourly 0.1° resolution, near-real-time updates (∼3-h latency), and bias-corrected medium-range (up to 10 days) and long-range (up to 7 months) forecast ensembles. The product includes 10 meteorological variables: precipitation, air temperature, daily minimum and maximum air temperature, surface pressure, relative and specific humidity, wind speed, and downward shortwave and longwave radiation. The historical part of the record starts 1 January 1979 and is based on ERA5 data bias corrected and downscaled using high-resolution reference climatologies. The data extension to within ∼3 h of real time is based on analysis data from GDAS. The 30-member medium-range forecast ensemble is based on GEFS and updated daily. Finally, the 51-member long-range forecast ensemble is based on SEAS5 and updated monthly. The near-real-time and forecast data are statistically harmonized using running-mean and cumulative distribution function-matching approaches to obtain a seamless record covering 1 January 1979 to 7 months from now. MSWX presents new and unique opportunities for hydrological modeling, climate analysis, impact studies, and monitoring and forecasting of droughts, floods, and heatwaves (within the bounds of the caveats and limitations discussed herein). The product is available at www.gloh2o.org/mswx.
MSWEP V2 Global 3-hourly 0.1° precipitation: Methodology and quantitative assessment
DOI:10.1175/BAMS-D-17-0138.1
URL
[本文引用: 2]
We present Multi-Source Weighted-Ensemble Precipitation, version 2 (MSWEP V2), a gridded precipitation P dataset spanning 1979–2017. MSWEP V2 is unique in several aspects: i) full global coverage (all land and oceans); ii) high spatial (0.1°) and temporal (3 hourly) resolution; iii) optimal merging of P estimates based on gauges [WorldClim, Global Historical Climatology Network-Daily (GHCN-D), Global Summary of the Day (GSOD), Global Precipitation Climatology Centre (GPCC), and others], satellites [Climate Prediction Center morphing technique (CMORPH), Gridded Satellite (GridSat), Global Satellite Mapping of Precipitation (GSMaP), and Tropical Rainfall Measuring Mission (TRMM) Multisatellite Precipitation Analysis (TMPA) 3B42RT)], and reanalyses [European Centre for Medium-Range Weather Forecasts (ECMWF) interim reanalysis (ERA-Interim) and Japanese 55-year Reanalysis (JRA-55)]; iv) distributional bias corrections, mainly to improve the P frequency; v) correction of systematic terrestrial P biases using river discharge Q observations from 13,762 stations across the globe; vi) incorporation of daily observations from 76,747 gauges worldwide; and vii) correction for regional differences in gauge reporting times. MSWEP V2 compares substantially better with Stage IV gauge–radar P data than other state-of-the-art P datasets for the United States, demonstrating the effectiveness of the MSWEP V2 methodology. Global comparisons suggest that MSWEP V2 exhibits more realistic spatial patterns in mean, magnitude, and frequency. Long-term mean P estimates for the global, land, and ocean domains based on MSWEP V2 are 955, 781, and 1,025 mm yr−1, respectively. Other P datasets consistently underestimate P amounts in mountainous regions. Using MSWEP V2, P was estimated to occur 15.5%, 12.3%, and 16.9% of the time on average for the global, land, and ocean domains, respectively. MSWEP V2 provides unique opportunities to explore spatiotemporal variations in P, improve our understanding of hydrological processes and their parameterization, and enhance hydrological model performance.
A daily and 500 m coupled evapotranspiration and gross primary production product across China during 2000-2020
DOI:10.5194/essd-14-5463-2022
URL
[本文引用: 2]
. Accurate high-resolution actual evapotranspiration (ET)\nand gross primary production (GPP) information is essential for\nunderstanding the large-scale water and carbon dynamics. However,\nsubstantial uncertainties exist in the current ET and GPP datasets in China\nbecause of insufficient local ground measurements used for model constraint. This study utilizes a water–carbon coupled model, Penman–Monteith–Leuning Version 2 (PML-V2), to estimate 500 m ET and GPP at a daily scale. The parameters of PML-V2(China) were well calibrated against observations of 26 eddy covariance flux towers across nine plant functional types in China,\nindicated by a Nash–Sutcliffe efficiency (NSE) of 0.75 and a root mean square error (RMSE) of 0.69 mm d−1 for daily ET, respectively, and a NSE of 0.82 and a RMSE of 1.71 g C m−2 d−1 for daily GPP. The model estimates get a small Bias of 6.28 % and a high NSE of 0.82 against water-balance annual ET estimates\nacross 10 major river basins in China. Further evaluations suggest that the\nnewly developed product is better than other typical products (MOD16A2,\nSEBAL, GLEAM, MOD17A2H, VPM, and EC-LUE) in estimating both ET and GPP. Moreover, PML-V2(China) accurately monitors the intra-annual variations in ET and GPP in the croplands with a dual-cropping system. The new data showed\nthat, during 2001–2018, the annual GPP and water use efficiency experienced a significant (p<0.001) increase (8.99 g C m−2 yr−2 and\n0.02 g C mm−1 H2O yr−1, respectively), but annual ET showed a\nnon-significant (p>0.05) increase (0.43 mm yr−2). This\nindicates that vegetation in China exhibits a huge potential for carbon\nsequestration with little cost in water resources. The PML-V2(China) product\nprovides a great opportunity for academic communities and various agencies\nfor scientific studies and applications, freely available at\nhttps://doi.org/10.11888/Terre.tpdc.272389 (Zhang and He, 2022).\n
GRACE measurements of mass variability in the Earth system
DOI:10.1126/science.1099192
PMID:15273390
[本文引用: 2]
Monthly gravity field estimates made by the twin Gravity Recovery and Climate Experiment (GRACE) satellites have a geoid height accuracy of 2 to 3 millimeters at a spatial resolution as small as 400 kilometers. The annual cycle in the geoid variations, up to 10 millimeters in some regions, peaked predominantly in the spring and fall seasons. Geoid variations observed over South America that can be largely attributed to surface water and groundwater changes show a clear separation between the large Amazon watershed and the smaller watersheds to the north. Such observations will help hydrologists to connect processes at traditional length scales (tens of kilometers or less) to those at regional and global scales.
A fine-resolution soil moisture dataset for China in 2002-2018
DOI:10.5194/essd-13-3239-2021
URL
[本文引用: 2]
. Soil moisture is an important parameter required for agricultural drought monitoring and climate change models. Passive microwave remote sensing\ntechnology has become an important means to quickly obtain soil moisture across large areas, but the coarse spatial resolution of microwave data\nimposes great limitations on the application of these data. We provide a unique soil moisture dataset (0.05∘, monthly) for China from\n2002 to 2018 based on reconstruction model-based downscaling techniques using soil moisture data from different passive microwave products – including\nAMSR-E and AMSR2 (Advanced Microwave Scanning Radiometer for Earth Observing System) JAXA (Japan Aerospace Exploration Agency) Level 3 products and SMOS-IC (Soil Moisture and Ocean Salinity designed by the Institut National de la Recherche Agronomique, INRA, and Centre d’Etudes Spatiales de la BIOsphère, CESBIO) products – calibrated with a consistent model in combination with ground observation\ndata. This new fine-resolution soil moisture dataset with a high spatial resolution overcomes the multisource data time matching problem between\noptical and microwave data sources and eliminates the difference between the different sensor observation errors. The validation analysis indicates\nthat the accuracy of the new dataset is satisfactory (bias: −0.057, −0.063 and −0.027 m3 m−3; unbiased root mean square error\n(ubRMSE): 0.056, 0.036 and 0.048; correlation coefficient (R): 0.84, 0.85 and 0.89 on monthly, seasonal and annual scales,\nrespectively). The new dataset was used to analyze the spatiotemporal patterns of soil water content across China from 2002 to 2018. In the past\n17 years, China's soil moisture has shown cyclical fluctuations and a slight downward trend and can be summarized as wet in the south and dry in\nthe north, with increases in the west and decreases in the east. The reconstructed dataset can be widely used to significantly improve hydrologic\nand drought monitoring and can serve as an important input for ecological and other geophysical models. The data are published in Zenodo at\nhttps://doi.org/10.5281/zenodo.4738556 (Meng et al., 2021a).\n
Applicability evaluation of MSWEP precipitation product for meteorological drought monitoring in the Yellow River Basin
MSWEP降水产品在黄河流域气象干旱监测中的适用性评价
Accuracy assessment of MSWEP over mainland of China
MSWEP降水产品在中国大陆区域的精度评估
Analysis of spatial distribution characteristics of precipitation in Qilian Mountains based on MSWEP
基于MSWEP的祁连山地区降水空间分布特性解析
Coupled estimation of 500 m and 8-day resolution global evapotranspiration and gross primary production in 2002-2017
DOI:10.1016/j.rse.2018.12.031 URL [本文引用: 1]
Global hydro-environmental sub-basin and river reach characteristics at high spatial resolution
The HydroATLAS database provides a standardized compendium of descriptive hydro-environmental information for all watersheds and rivers of the world at high spatial resolution. Version 1.0 of HydroATLAS offers data for 56 variables, partitioned into 281 individual attributes and organized in six categories: hydrology; physiography; climate; land cover & use; soils & geology; and anthropogenic influences. HydroATLAS derives the hydro-environmental characteristics by aggregating and reformatting original data from well-established global digital maps, and by accumulating them along the drainage network from headwaters to ocean outlets. The attributes are linked to hierarchically nested sub-basins at multiple scales, as well as to individual river reaches, both extracted from the global HydroSHEDS database at 15 arc-second (~500 m) resolution. The sub-basin and river reach information is offered in two companion datasets: BasinATLAS and RiverATLAS. The standardized format of HydroATLAS ensures easy applicability while the inherent topological information supports basic network functionality such as identifying up- and downstream connections. HydroATLAS is fully compatible with other products of the overarching HydroSHEDS project enabling versatile hydro-ecological assessments for a broad user community.
Version 3 of the global aridity index and potential evapotranspiration database
The "Global Aridity Index and Potential Evapotranspiration Database - Version 3" (Global-AI_PET_v3) provides high-resolution (30 arc-seconds) global hydro-climatic data averaged (1970-2000) monthly and yearly, based upon the FAO Penman-Monteith Reference Evapotranspiration (ET) equation. An overview of the methods used to implement the Penman-Monteith equation geospatially and a technical evaluation of the results is provided. Results were compared for technical validation with weather station data from the FAO "CLIMWAT 2.0 for CROPWAT" (ET: r = 0.85; AI: r = 0.90) and the U.K. "Climate Research Unit: Time Series v 4.04" (ET: r = 0.89; AI: r = 0.83), while showing significant differences to an earlier version of the database. The current version of the Global-AI_PET_v3 supersedes previous versions, showing a higher correlation to real world weather station data. Developed using the generally agreed upon standard methodology for estimation of reference ET, this database and notably, the accompanying source code, provide a robust tool for a variety of scientific applications in an era of rapidly changing climatic conditions.© 2022. The Author(s).
Decomposition of the mean squared error and NSE performance criteria: Implications for improving hydrological modelling
DOI:10.1016/j.jhydrol.2009.08.003 URL [本文引用: 1]
On the calculation of the evaporation from land surface
论陆面蒸发的计算
A rational function approach for estimating mean annual evapotranspiration
The HBV model//Singh V P. Computer Models of Watershed Hydrology
Development and test of the distributed HBV-96 hydrological model
DOI:10.1016/S0022-1694(97)00041-3 URL [本文引用: 1]
The Xinanjiang model//Singh V P. Computer Models of Watershed Hydrology
The Xinanjiang model applied in China
DOI:10.1016/0022-1694(92)90096-E URL [本文引用: 1]
Application and testing of the simple rainfall-runoff model SIMHYD//Singh V P. Computer Models of Watershed Hydrology
Estimating vegetation greening influences on runoff signatures using a Log-Based Weighted Ensemble Method
Genetic algorithms
DOI:10.1038/scientificamerican0792-66 URL [本文引用: 2]
Multi-objective optimization using genetic algorithms: A tutorial
DOI:10.1016/j.ress.2005.11.018 URL [本文引用: 1]
Quantitative evaluations of human- and climate-induced impacts on hydrological processes of China
DOI:10.11821/dlxb201611001
[本文引用: 1]
Based on monthly streamflow data from 372 stations covering the period 1960-2000 and the monthly streamflow data from 41 stations covering the period 2001-2014 across China, human- and climate-induced impacts on hydrological processes were quantified for 10 river basins in China based on development of Budyko-based coupled water-energy balance model. Penman-Monteith potential evapotranspiration model was used to analyze evapotranspiration processes. Besides, elasticity coefficient was also quantified for the impacts of meteorological variables on streamflow changes. The results indicated that: (1) Compared to southern China, streamflow changes are more sensitive to climate changes and human activities in northern China. Generally, relative humidity changes have positive impacts on streamflow changes. However, the maximum temperature, minimum temperature, solar radiation, wind speed and LUCC changes tend to go against streamflow changes. The elasticity coefficients of streamflow changes for meteorological variables are: precipitation > LUCC > relative humidity > solar radiation > maximum temperature > wind speed > minimum temperature; (2) Climate changes during 1980-2000 generally help to increase annual streamflow, and the increase of streamflow by precipitation changes is most evident, and the increase of streamflow depth reaches 12.1 mm. However, impacts of meteorological variables on streamflow changes are shifting from one river basin to another, e.g. the maximum temperature and relative humidity help to increase streamflow in northern China but decrease streamflow magnitude in southern China; (3) In general, human activities tend to decrease streamflow. Changes of streamflow in the Yangtze, Songhua, Northwest, and Southeast river basins are 78.7%, 76.9%, 65.7%, and 84.2%, respectively, which can be attributed to climate changes. However, human activities play a dominant role in modifications of streamflow changes, such as Pearl River basin, Huaihe River basin, Haihe River basin, Yellow River basin, Liaohe River basin and southwest river basins, with fractional contribution being 59.4%, 77.3%, 66.2%, 69.7%, 75.3%, and 70.4%, respectively. Generally, the fraction of human activities and climate changes to streamflow changes in the river basins across China can reach 71.0% and 29.0% respectively in river basins, where climate changes play a dominant role in streamflow changes. The results of this study can be helpful to human mitigation to climate changes in terms of water resources management.
气候变化和人类活动对中国地表水文过程影响定量研究
DOI:10.11821/dlxb201611001
[本文引用: 1]
利用中国372个水文站月径流数据(1960-2000年)及41个水文站年径流数据(2001-2014年),采用基于Budyko假设的水热耦合平衡方程,构建气候变化和人类活动对径流变化影响定量评估模型,在Penman-Monteith潜在蒸发分析基础上,进一步分析气象因子对径流变化的弹性系数,量化气候变化和人类活动对径流变化的影响。结果表明:① 中国北方地区流域径流变化对各气象因子弹性系数明显大于中国南方地区。就全国而言,径流变化对各因子的弹性系数为:降水>土地利用/土地覆盖变化(LUCC)>相对湿度>太阳辐射>最高气温>风速>最低气温;② 1980-2000年,气候变化总体上有利于增加中国年径流量,而降水对年径流量增加的贡献最为显著;③ 1980-2000年,中国南方流域中,气候变化对年径流变化的影响以增加作用为主,而北方流域,以减少年径流作用为主。对中国大多数流域径流变化而言,人类活动的影响主要以减少年径流量为主。2001-2014年,气候变化以减少径流量为主,人类活动对径流变化的影响程度明显增强,气候变化与人类活动对径流变化的贡献率分别为53.5%、46.5%。该研究对气候变化与人类活动影响下,中国水资源规划管理、防灾减灾及保障水资源安全具有重要理论与现实意义。
Application of a distributed hydrological model to the Yellow River Basin
DOI:10.11821/xb200401018
[本文引用: 1]
For implementing water resources management in the Yellow River Basin, water resources assessment is very necessary and important. The accuracy of water resources assessment relies on predictability of the hydrological cycle. Different land uses, topographical features, geological and soil conditions, and artificial water uses (mainly agricultural irrigation) determine the complexity of hydrological characteristics in this basin. With the limited observation of the river discharge, it is difficult to develop a lumped model for simulating hydrology in different sub-basins based on parameter calibration. The physically-based hydrological model can be helpful in this case. The present research attempts to incorporate all available spatial information into the hydrological modeling by a distributed approach. A physical model is developed using the physical governing equations for description of the hydrological processes. It carries out a 10-year (1980-1989) simulation of the natural hydrological cycle. Based on the hydrological simulation, the paper discusses the spatial-temporal hydrological characteristics and the status of water resources in the Yellow River Basin.
分布式水文模型在黄河流域的应用
