

1 引言
绿水的重要性已得到国内外学界的关注与重视,学者们利用水文模型、水足迹核算等方法对全球绿水资源量[4]、消耗量[5]、功能[6]等进行了系统研究。从水循环角度,绿水通过绿水流进入大气、随大气输送、以降水形式返回陆地的过程,实现了绿水的流动和转化以及陆地内循环(Terrestrial Moisture Recycling)。由于绿水易受以人为土地利用变化为代表的人类活动的影响[7],对绿水的扰动将通过陆地内循环实现远距离传播并对下风区(Downwind Region)降水、径流、水资源乃至人类活动产生重要影响。在全球经济社会高速发展背景下,大规模人类活动引起的绿水变化随陆地内循环的传播已被广泛证实。例如,亚马逊雨林砍伐活动的持续进行使得该地区的陆地内循环减弱、降水显著减少[8],削弱了雨林对干旱的恢复力[9];可持续的森林恢复措施增加的绿水通过陆地内循环使得欧洲夏季降水增加了(7.6±6.7)%[10],并能够通过大型流域的陆地内循环缓解蒸发增强引起的径流削减,从而增加流域水资源总量[11-12]。中国重要生态地理区域大规模人类活动引发的绿水变化也对国内外水循环产生了重要影响:塔里木盆地灌溉增强使得绿水流和大气水增加、净辐射减少,并通过陆地内循环增加了夏季降雪,一定程度上缓解了气候变暖对昆仑山、帕米尔高原和西藏北部冰川的消融作用[13-14];华北和华南地区大规模植树造林通过植被—降水正反馈抵消了绿水流增强引起的土壤水分损失[15];黄土高原退耕还林还草重大工程的成功施行使得区域绿水流增强,并通过陆地内循环增加了区域雨季降水[16];青藏高原土地覆盖的变化及绿水流的增强,通过陆地内循环进一步提升了高原对其下风区如四川、甘肃等地区降水的支撑作用[17]。
上述研究表明,大规模人类活动引起的绿水变化通过陆地内循环可以实现跨流域尺度传播。然而,水文学研究多聚焦于以流域为基本单元的水文过程[18],王光谦等指出流域尺度的水沙变化分析存在反映要素不够全面的问题[19],对绿水以及陆地内循环的忽略将可能低估人类活动对水循环扰动的影响范围与程度。目前,学界已逐渐认识到跨流域视野对全球变化背景下水资源治理工作的重要性。Rockström团队提出的行星边界框架(Planetary Boundary Framework)为水资源利用、土地利用变化等9个地球关键生物物理过程定义了人类的安全影响边界[20-21],Gleeson等[22]和Zipper等[23]据此提出了水行星边界的概念,指出水资源治理需将跨流域尺度的水循环纳入考虑,如依托陆地内循环形成的跨流域尺度水文联系将水资源治理与土地和气候变化治理相结合,整合蓝水(留存于河流、湖泊和含水层中的水)、绿水和冰冻水资源,实现水资源治理向行星边界尺度的拓展,以期为气候变化和人类活动加剧背景下水资源治理的全球协作提供基本框架。
对中国而言,中国共产党十八大以来习近平总书记提出“节水优先、空间均衡、系统治理、两手发力”的治水思路(以下简称“十六字”治水思路)[24],黄河流域生态保护和高质量发展、长江大保护、河湖长制等战略和制度的先后提出和顺利实施,以及流域治理管理“四个统一”(统一规划、统一治理、统一调度、统一管理)的不断深化[25],推动着中国流域水资源保护与治理水平的不断提升。此外,绿水的资源化问题亦逐步得到国内学界的关注[3],基于流域蓝绿水优化配置、绿水补偿等方法的绿水管理机制的提出[26],为中国绿水的资源化利用做出了有效探索。对于中国绿水的陆地内循环(以下简称为中国绿水循环),相关研究揭示了中国绿水循环中重要地理区域的基本循环特征、变化规律及其可能影响[16-17,27]以及中国绿水循环的基本特征[28-29],但中国绿水循环的输送和交换格局尚不明确,从而限制了对绿水在中国水循环中的功能以及人类活动引发的绿水变化在中国的传播特征的深入研究。目前,以青藏高原为代表的重要地理区域的土地覆被情势已发生深刻变化[30⇓-32],对中国绿水循环格局的有限认知将低估国内外自然和人类生态系统变化对中国水循环和水资源的影响。
从国家水利战略视角,深入研究中国绿水循环,可为中国治水事业提供新的着力点。山水林田湖草沙等自然和人类生态系统的绿水流,通过绿水的陆地内循环与下风区的水循环过程形成联动,因而山水林田湖草沙等要素的变化将对下风区水循环和水资源空间格局产生重要影响。“十六字”治水思路中的“空间均衡、系统治理”,要求我们把握好水资源与人口、经济等方面的空间匹配和空间均衡,从山水林田湖草沙生命共同体出发统筹“治水和治山、治水和治林、治水和治田、治山和治林等”[24]。中国绿水循环作为山水林田湖草沙与中国水循环和水资源的关键纽带,与“十六字”治水思路对空间均衡和系统治理的要求高度契合。因此,本文围绕中国绿水循环展开研究,旨在明确中国绿水循环的输送和交换格局、揭示不同自然和人类生态系统对中国绿水循环的作用,以进一步提升我们对“人—水—生态”这一复杂系统的科学认知,并为贯彻落实“十六字”治水思路提供新的着力点、为治水新模式的探索提供新视角、为中国水问题的解决提供新方案。
2 绿水陆地内循环:图景与方法
2.1 绿水陆地内循环基本图景
图1
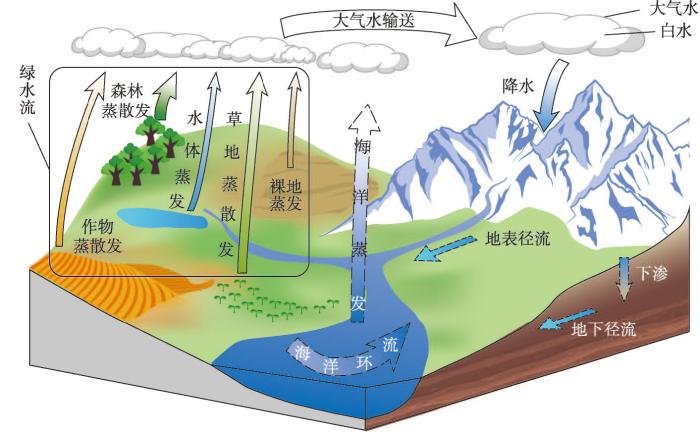
图1
绿水的陆地内循环示意图
注:实线箭头表示绿水陆地内循环主要涉及的水循环过程;为保证完整性,以虚线箭头标明水循环的其他主要过程。
Fig. 1
Schematic diagram of terrestrial green water recycling
绿水陆地内循环具有如下特点:
(1)水的转化形式复杂。绿水进入大气后转化为大气水,而具备降水潜力的大气水转化为白水,其他则为背景水汽,白水在符合降水条件时转化为降水落地,绿水陆地内循环过程形成了绿水—大气水—白水—降水的转化链条。
(3)跨流域循环显著。绿水的流动由陆地蒸散发和大气水输送实现,不同于地表水流动受分水岭的限制,绿水流动无明显的边界限制,跨流域尺度的陆地内循环十分显著。例如,欧洲各流域74%的降水来自流域外绿水的支持[38]。
(4)人类活动影响显著。以人为土地利用变化、规模性灌溉为代表的人类活动引起的绿水变化,将通过跨流域尺度的陆地内循环,改变下风区降水、径流等过程,进而对下游水资源情势乃至生产生活方式产生影响。此外,人类活动引起的大气水平衡和大尺度环流的变化[39]也将直接影响大气水输送过程,从而引发陆地内循环的变化。
因此,绿水陆地内循环在跨流域尺度上将陆地、大气、生态系统以及人类活动串联起来,对绿水陆地内循环展开系统研究,明确绿水通过陆地内循环的输送和转化路径,不仅是构建水循环完整图景的关键一环,更是全球经济社会持续发展背景下,深刻理解全球水循环和水资源对人类活动的响应机制所必须开展的重要研究任务。
2.2 绿水陆地内循环描述方法
在绿水陆地内循环过程中,绿水从陆面进入大气,在大气中以降水形式落回陆面实现循环。然而,由于大气与陆面通过降水和蒸发进行的水量交换十分频繁,绿水在进入大气后将经历十分复杂的水量收支(转化)过程。以一个通过绿水流进入大气的绿水标记物(该标记物携带的全部水量为标记的绿水量)为例,其在输送过程中途经其他陆地或海洋蒸发地时,与该地由绿水流或海洋蒸发进入大气的水混合,标记物水量增加,在途经满足降水条件的地区时,其携带的部分水发生凝结以降水形式离开标记物,标记物剩余水量继续被输送,经历多次蒸发和降水过程,直至标记物的初始绿水量被消耗殆尽并被在中途由绿水流或海洋蒸发进入大气的水完全替代,初始的被标记绿水至此实现了在陆地—大气(陆地内循环)以及海洋—大气间的循环。可见,绿水陆地内循环的复杂转化过程主要发生在大气中,宜从大气视角对其进行描述。
绿水进入大气后,主要以水汽形式参与大气水输送,从水汽质量守恒方程的角度,中途蒸发和降水分别为水汽源(Moisture Source)和水汽汇(Moisture Sink),可用欧拉或拉格朗日方法对绿水在大气中的复杂交换进行刻画。对一个通过绿水流进入大气的绿水标记物而言,其欧拉观点下的水汽质量守恒方程为:
式中:g表示绿水标记物;Sg为该标记物携带的水汽量;u、v、w为标记物所在位置的三维风速场;Eg为该标记物由蒸发“捕获”的水汽量;Pg为由降水造成的标记物水汽损失量;通过求解该标记物的水汽质量守恒方程即可对标记物在大气中的交换过程进行定量描述。拉格朗日观点下,包含绿水标记物的空气团的水汽质量守恒方程为:
式中:m为标记物所在空气团的总质量;q为空气团的比湿;e为在时间段dt内进入空气团的水汽量;p为dt内空气团通过降水损失的水汽量。
目前,学者们从水汽质量守恒方程出发,研发了多种大气水追踪模型(Atmospheric Moisture Tracking Model)[40],用于研究大气水的全球循环特征。鉴于大气水交换过程的复杂性,大气水追踪研究将重点集中于大气水交换的结果,即位于何处的水汽源的蒸发能够为位于何处的水汽汇的降水提供多少水量支持,由此形成了水汽源—汇关系(Moisture Source-sink Relationship)。Zhang等对全球范围内的水汽源—汇关系展开系统研究,指出全球水汽源与汇之间能够形成区域尺度的空间结构,据此解构了全球大气水的复杂迁移转化过程[41]。类似地,可利用水汽源—汇关系对绿水陆地内循环的空间结构进行研究。具体而言,研究绿水陆地内循环需首先确定目标区域,给定陆地区域Ω,以Ω范围内的绿水陆地内循环为例,对Ω内的绿水流EΩ进行大气水追踪(EΩ即为水汽源),能够明确EΩ的所有水汽汇的空间位置和强度,即EΩ能够为何地的降水提供多少水量支持。EΩ能够为Ω内降水提供的水量EΩ→Ω即为EΩ在Ω的内循环量,EΩ的内循环率ε可表示为:
绿水内循环量和内循环率能够刻画给定区域的绿水陆地内循环的基本特征,而将给定陆地区域进行分区,例如,将Ω划分为n个分区ω1、ω2、…、ωn,对各分区的绿水流进行追踪并得到水汽源—汇关系,则可对各分区绿水的内循环量以及各分区之间的绿水交换量进行计算即
式中:
本文以中国范围内的陆地为目标区域(为匹配大气水追踪模型的分辨率,不包括南海诸岛),以中国生态地理分区[42]为基础,将其归并为图2所示的16个分区,包括准噶尔盆地(JUB)、塔里木盆地(TAB)、阿拉善高原(AP)、柴达木盆地(QAB)、青海湖周边(QLA)、青藏高原西部(WTP)、青藏高原东部(ETP)、内蒙古高原(IMP)、东北平原(NEP)、黄土高原(LP)、华北平原(NCP)、四川盆地(SCB)、长江中下游平原(LYP)、云贵高原(YGP)、东南丘陵(SEH)和热带地区(TA),对不同层级的中国绿水循环开展系统研究。本文使用应用广泛的拉格朗日大气水追踪模型UTrack[43](模型空间分辨率为1°×1°),对2000—2018年各分区的绿水循环以及分区间的绿水交换情况进行研究,以揭示中国绿水循环的输送和交换格局。此外,为量化不同生态系统对中国绿水循环的作用,本文利用中国500 m分辨率陆地蒸散发与总初级生产力数据集[44]和中国逐年30 m分辨率土地覆被数据集[45]得到1°×1°绿水流在中国主要覆被类型(森林、草地、耕地、水体、裸地等)的分配比例,以量化各覆被类型相应的绿水内循环量和交换量,明确不同自然和人类生态系统对中国绿水循环的贡献,并据此对中国绿水循环的战略意义展开论述。
图2
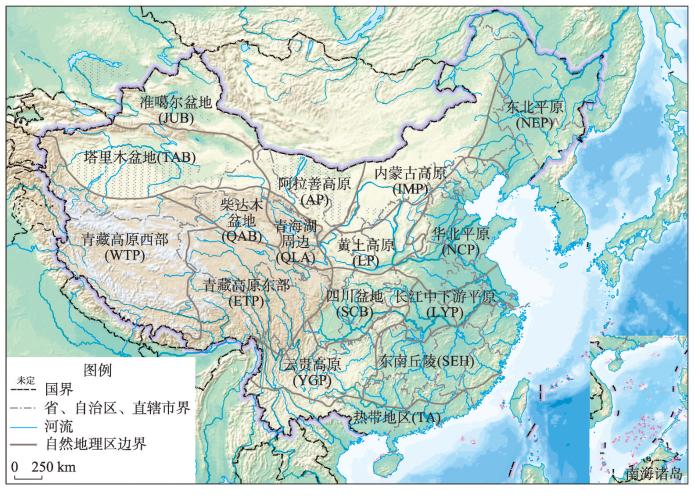
图2
中国绿水循环分区
注:基于自然资源部标准地图服务网站GS(2016)1609号的标准地图制作,底图边界无修改。
Fig. 2
Subregions of green water recycling in China
3 中国绿水循环的基本格局
3.1 中国绿水循环基本特征
基于UTrack模型得到的空间分辨率为1°×1°的中国陆地水汽源—汇关系,可以量化中国绿水循环在整体、区域以及网格尺度的基本特征,研究结果表明:
(1)中国绿水内循环率高,对降水具有重要支撑作用。2000—2018年中国平均绿水总量为54517亿m3/a,通过中国绿水循环为中国提供的降水量为27486亿m3/a,内循环率达到50.4%。各网格绿水流对中国的内循环率呈现西高东低的态势(图3a),内循环率较高的网格(> 50%)主要集中在青藏高原、塔里木盆地、柴达木盆地、四川盆地、云贵高原等西部地区,这些区域的绿水流在中国境内大量驻留并最终转化为降水,对当地及周边地区的降水提供重要支撑。内循环率较低的网格(< 50%)则主要位于东南丘陵、长江中下游平原、华北平原、内蒙古高原及东北平原等东部地区,这些地区超过一半的绿水被输送至外部陆地和海洋,可对水资源的跨国传输和海陆交互产生重要影响。
图3

图3
2000—2018年网格尺度和区域尺度中国绿水内循环率分布
注:基于自然资源部标准地图服务网站GS(2020)4630号的标准地图制作,底图边界无修改。
Fig. 3
Distribution of green water recycling ratio in China at grid scale and regional scale from 2000 to 2018
(2)2000—2018年各区域绿水流对自身的内循环率呈现三级阶梯分布,青藏高原的内循环尤为显著。图3b显示了各区域对自身的绿水内循环率的多年平均及年际波动情况。区域层级上,中国绿水循环呈现出与网格尺度一致的自西向东的递减趋势,表现为三级阶梯分布。第一级阶梯(
3.2 绿水交换特征
通过进一步量化区域间绿水的交换量和交换率,本文研究了中国绿水循环区域间交换的基本特征,明确了中国绿水循环中的3类关键功能区和绿水输送的整体格局:
(1)最关键区域——青藏高原。2000—2018年青藏高原东、西部分区为中国绿水循环提供了最多的水量,分别约为4122亿m3/a和4008亿m3/a(图4a),同时高原大量降水也来源于国内绿水流动(总计7164亿m3/a),其中高达86.3%的降水(6182亿m3/a)来自于高原内部。此外,青藏高原也是支撑西部地区绿水循环最为重要的区域,每年为青海湖周边、四川盆地、云贵高原、黄土高原、柴达木盆地的降水分别提供了394亿m3(占其年降水量32.1%)、369亿m3(7.6%)、252亿m3(2.9%)、240亿m3(11.4%)、208亿m3(29.7%)绿水(图4b)。作为中国绿水循环的关键源汇区和西部重要供水源区,青藏高原是中国绿水循环中最为关键的区域。
图4
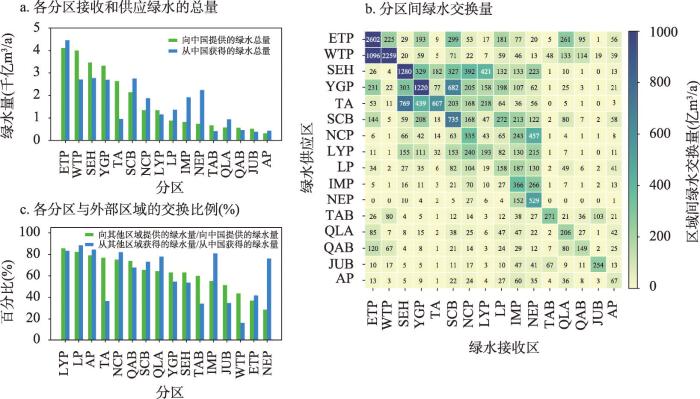
(2)关键供应区域——东南丘陵、云贵高原、热带地区。除青藏高原外,2000—2018年中国南部地区也是中国绿水的重要供应区,包括东南丘陵(3473亿m3/a)、云贵高原(3314亿m3/a)、热带地区(2633亿m3/a)(图4a)。此外,上述区域的绿水不仅对南方地区起到支撑作用,还能够远距离输送到华北以及东北地区。东南丘陵每年分别为长江中下游平原、华北平原、云贵高原、四川盆地和东北平原贡献了421亿m3(占其年降水量10.5%)、392亿m3(8.9%)、329亿m3(3.7%)、327亿m3(6.7%)和223亿m3(4.2%)绿水(图4b);云贵高原每年分别为四川盆地、东南丘陵、青藏高原东部、华北平原、黄土高原提供了682亿m3(14.0%)、303亿m3(2.2%)、231亿m3(2.1%)、205亿m3(4.7%)和198亿m3(9.4%)绿水;热带地区每年分别为东南丘陵、云贵高原、长江中下游平原、四川盆地及华北平原供应了769亿m3(5.5%)、439亿m3(5.0%)、218亿m3(5.5%)、203亿m3(4.2%)和168亿m3(3.8%)绿水。因此,中国南部三区是华南、华北以及东北地区的重要绿水源,是绿水流强度较高、控制空间范围最广的区域,其绿水流的广泛辐射是中国降水的重要保障。
(3)交换枢纽——长江中下游平原、黄土高原。从2000—2018年各分区与其他分区的多年平均绿水交换率来看,长江中下游平原从中国获得的绿水中有83.3%来自以东南丘陵、热带地区、云贵高原为主的外部地区(图4c),并且向中国供应的85.6%的绿水最终转化为外部地区降水,其分别为华北平原、东北平原、东南丘陵、四川盆地和内蒙古高原提供了240亿m3/a、215亿m3/a、155亿m3/a、153亿m3/a和130亿m3/a的降水。绿水流入和流出的高外部交换率表明长江中下游平原是南部地区绿水输送到北方的桥梁,充当了沟通南—北地区绿水交换的关键枢纽。与长江中下游平原相似,黄土高原从中国获得的88.3%的降水来自四川盆地、青藏高原东部及云贵高原等分区,而向中国供应的绿水中82.2%流向了北方地区,包括内蒙古高原(187亿m3/a)、东北平原(130亿m3/a)、华北平原(104亿m3/a)等,因此黄土高原是云贵川等西南地区和华北、东北地区之间绿水交换的桥梁,充当了绿水由西南地区向北方和东北地区输送的枢纽。
(4)中国绿水循环的“三线”输送格局——“东线”由南向北、“中线”由西南向东北、“西线”内循环显著。从2000—2018年区域绿水交换净值来看,热带地区(多年平均净流出量为1674亿m3/a)、东南丘陵(712亿m3/a)、云贵高原(623亿m3/a)和长江中下游平原(184亿m3/a)等南方地区,以及青藏高原西部(1305亿m3/a)、塔里木盆地(261亿m3/a)、准噶尔盆地(131亿m3/a)、柴达木盆地(104亿m3/a)等西部地区是中国绿水供应的源区;而其他分区则表现为绿水净流入,包括东北平原(多年平均净流入量为1490亿m3/a)、内蒙古高原(1090亿m3/a)、四川盆地(602亿m3/a)、华北平原(530亿m3/a)、黄土高原(478亿m3/a)、青海湖周边(354亿m3/a)、青藏高原东部(338亿m3/a)及阿拉善高原(112亿m3/a)(图5)。绿水净流出和净流入分区的地理分布对应着中国绿水循环的“三线”输送格局。“东线”为由南向北的绿水输送,即热带地区和东南丘陵供应的绿水不断向北传输,经由长江中下游平原最终流入华北和东北地区。由南向北的跨区域绿水输送主要包括热带地区至东南丘陵(多年平均净流动量为587亿m3/a),热带地区和东南丘陵至长江中下游平原(453亿m3/a)、华北平原(480亿m3/a)和东北平原(267亿m3/a),长江中下游平原至华北平原(197亿m3/a)和东北平原(210亿m3/a),华北平原至东北平原(430亿m3/a)和内蒙古高原(172亿m3/a)等。“中线”为由西南向东北的绿水输送,即绿水由以云贵高原为代表的西南地区向黄土高原和内蒙古高原输送。主要的跨区域输送包括热带地区至云贵高原(362亿m3/a),热带地区和云贵高原至四川盆地(659亿m3/a),热带地区、云贵高原和四川盆地至黄土高原(412亿m3/a),四川盆地和黄土高原至内蒙古高原(352亿m3/a)等。“西线”为西部地区的内循环。由于青藏高原、塔里木盆地、柴达木盆地、准噶尔盆地、青海湖周边等分区的内循环十分显著,高达8844亿m3/a的绿水流在西部地区转化为了降水,其中78.6%(6952亿m3/a)来自青藏高原。总体而言,中国绿水循环“三线”输送的整体格局,是中国水资源、气候、生态等系统之间的复杂作用的典型体现,也显示了广大南方地区对中国水循环的重要支撑作用。
图5
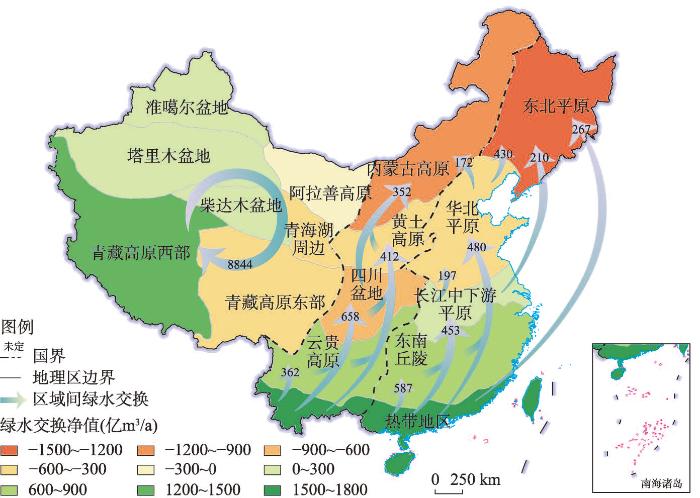
图5
中国绿水循环的“三线”输送格局
注:基于自然资源部标准地图服务网站GS(2020)4630号的标准地图制作,底图边界无修改;净交换值为正表示该区域绿水流为净流出状态。
Fig. 5
Three major transport routes of green water in China
3.3 不同自然和人类生态系统对中国绿水循环的贡献
基于1°×1°网格尺度上蒸散发对不同覆被类型的分配比例,本文量化了各覆被类型贡献的绿水流及其控制的绿水交换,明确了不同自然和人类生态系统对中国绿水循环的贡献。
(1)中国绿水主要来源于森林、草地、耕地等生态系统。2000—2018年森林(面积占比26.7%)、草地(28.8%)、耕地(20.3%)、水和积雪(3.2%)及裸地(20.9%)每年分别为中国贡献了9683亿m3、7769亿m3、5922亿m3、1120亿m3和2973亿m3绿水量,以森林、草地和耕地为主要土地覆被类型的地区供给了中国高达85.1%的绿水,而以裸地为主的区域供给的绿水量相对较少(10.8%)。森林是东南丘陵、云贵高原、热带地区、四川盆地的主要绿水来源(> 50%),分别为上述分区贡献了2548亿m3/a(占绿水流总量的73.3%)、2189亿m3/a(66.1%)、1810亿m3/a(68.8%)、1115亿m3/a(52.1%)的绿水量(图6a);而青藏高原东部、青藏高原西部、内蒙古高原、青海湖周边及黄土高原的绿水由草地主导,为各分区贡献的绿水量分别为2915亿m3/a(70.8%)、2406亿m3/a(60.2%)、508亿m3/a(61.9%)、464亿m3/a(80.0%)、448亿m3/a(50.6%);耕地主导了东北平原、长江中下游平原和华北平原的绿水供应,在各个分区贡献的绿水量分别为871亿m3/a(64.6%)、886亿m3/a(66.0%)、387亿m3/a(52.3%),此外四川盆地、云贵高原、东南丘陵及热带地区也有一定的耕地覆盖,分别产生了895亿m3/a、879亿m3/a、790亿m3/a和697亿m3/a的绿水量;塔里木盆地、柴达木盆地和阿拉善高原的绿水主要来自裸地,依次为478亿m3/a(70.1%)、396亿m3/a(70.2%)和254亿m3/a(79.5%),此外裸地也在青藏高原西部贡献了1081亿m3/a的绿水量。
(2)绿水源区生态系统的保护对维持区域间绿水流动具有重要意义。森林、草地和耕地生态系统控制了16个中国绿水循环的主要分区间绿水交换(图6b),其中9个主要由森林贡献、4个主要由草地贡献、3个主要由耕地贡献。由森林主要控制的绿水交换为热带地区至东南丘陵(多年平均绿水量为529亿m3/a)和云贵高原(302亿m3/a),云贵高原至四川盆地(450亿m3/a)和东南丘陵(200亿m3/a),东南丘陵至长江中下游平原(309亿m3/a)、华北平原(288亿m3/a)、云贵高原(241亿m3/a)和四川盆地(240亿m3/a)等,体现了中国南部东南丘陵和云贵川地区森林生态系统对本地及华北地区降水的重要支撑作用。草地主导的绿水交换主要出现在青藏高原西部至东部(657亿m3/a)以及青藏高原东部至四川盆地(211亿m3/a)和青海湖周边(185亿m3/a),因此青藏高原草地生态系统的保护和恢复是发挥高原“水塔”作用的重要保障,并将有效增强中国自西向东的绿水输送。此外,耕地主导的绿水流为华北平原至东北平原(295亿m3/a)和内蒙古高原(157亿m3/a),长江中下游平原至华北平原(159亿m3/a)等,因此华北平原和长江中下游平原这两个主要粮食产区的耕地,也在一定程度上影响着中国绿水循环的格局。
图6
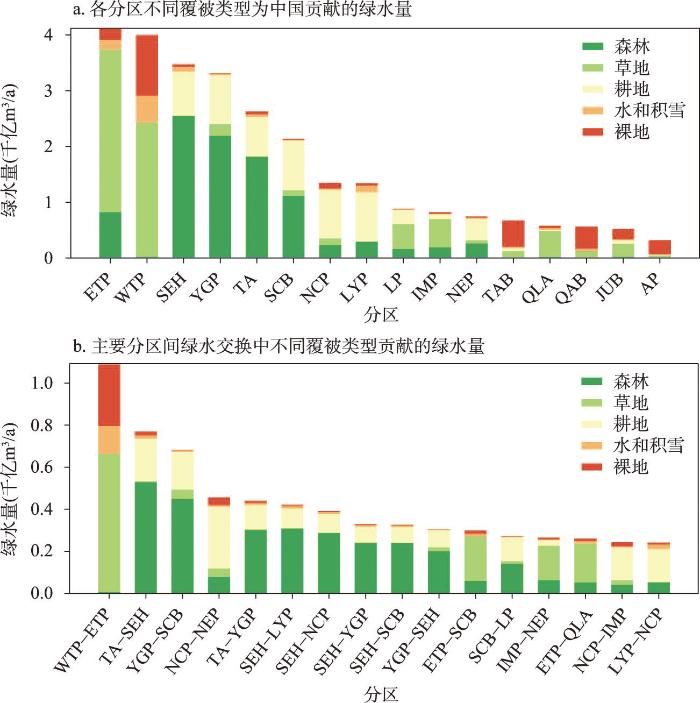
图6
不同覆被类型对中国绿水循环的贡献
Fig. 6
Contributions of different land cover types to green water recycling in China
4 中国绿水循环的战略意义
4.1 把握绿水“国内大循环”格局,树立“全国一盘棋”的全局意识
习近平总书记在《把握新发展阶段,贯彻新发展理念,构建新发展格局》重要讲话中指出,在加快构建“以国内大循环为主体、国内国际双循环相互促进”新发展格局的实践中,要注意防范“各自为政、画地为牢,不关心建设全国统一的大市场、畅通全国大循环,只考虑建设本地区本区域小市场、搞自己的小循环”的认识误区[46]。本文揭示的中国绿水循环格局表明,中国绿水也具有跨流域尺度的“国内大循环”。中国治水理论与实践也要深刻领会和贯彻新发展理念,要在不断提升流域治理水平的基础上,进一步把握绿水“国内大循环”格局,树立全国一盘棋思想,并紧密结合国家水、资源、生态、环境领域战略规划,系统把握重点区域变化对中国绿水循环的可能影响。
以《全国重要生态系统保护和修复重大工程总体规划(2021—2035年)》[47](以下简称《规划》)为例,其设置了青藏高原生态屏障区、黄河重点生态区(含黄土高原生态屏障)、长江重点生态区(含川滇生态屏障)、南方丘陵山地带等7大重点区域,并据此规划了全国重要生态系统保护和修复重大工程的总体布局。《中华人民共和国国民经济和社会发展第十四个五年规划和2035年远景目标纲要》进一步提出了7大重点区域的重要生态系统保护和修复工程远景目标,其中包括青藏高原生态屏障区新增退化草原治理320万hm2、黄河重点生态区(含黄土高原生态屏障)保护修复林草植被80万hm2、长江重点生态区(含川滇生态屏障)完成营造林110万hm2、南方丘陵山地带营造防护林9万hm2 [48]。本文研究表明,青藏高原生态屏障区、黄河重点生态区(含黄土高原生态屏障)、长江重点生态区(含川滇生态屏障)、南方丘陵山地带是中国绿水循环的关键功能区:青藏高原生态屏障区(与本文WTP和ETP分区相符)绿水流由草地主导,是绿水内循环量最大(8131亿m3/a)、内循环率最高(84.9%)的区域,而其较高的对本区域的绿水内循环率(64.6%)表明本地绿水流对高原降水具有重要贡献(36.1%),从而为高原“水塔”作用的发挥提供重要支撑;长江重点生态区(与本文SCB、YGP、LYP分区相符)绿水流由森林主导,是华北和东北地区(与本文NCP、IMP、NEP分区相符)降水的重要支撑(11.1%),也是南—北绿水交换的枢纽(本文LYP分区),因此是中国绿水由南向北输送格局的主要控制区;黄河重点生态区中的黄土高原绿水流由草地主导,是西南—东北向绿水输送的枢纽,沟通了云贵川与华北和东北地区之间的绿水交换;南方丘陵山地带(与本文SEH分区相符)绿水流由森林主导,其绿水内循环量仅次于青藏高原,能够辐射到西南(SCB、YGP分区)、长江中下游(LYP分区)、华北(LP、IMP、NCP分区)和东北地区(NEP分区),是绿水流控制空间范围最广的区域。
由此可见,中国绿水循环的重点功能区及相应的重点覆被类型与7大重点区域的重要生态系统保护和修复工程的远景目标高度契合,《规划》的顺利实施,将进一步提升中国绿水循环重点功能区对中国水循环的控制作用。因此,在“十六字”治水思路的总指引下,在讲好流域“治水故事”的基础上,中国治水理论与实践应对中国绿水循环给予充分重视,依托绿水“国内大循环”进一步树立和牢固全局意识,充分认识中国水循环“牵一发而动全身”的潜在可能。
4.2 统筹水土资源治理,克服“水土分治”,践行“山水林田湖草沙”系统治理
本文表明,以森林、草地、耕地等为代表的土地资源,将通过中国绿水循环在中国水循环与水资源方面发挥举足轻重的作用,因而从新视角揭示了水资源与土地资源的紧密联系。就水资源和土地资源治理理论与实践而言,绿水概念的提出者Falkenmark曾指出,水资源和土地资源治理的分离将阻碍从水资源视角开展生态系统治理[49],鉴于此,国外学界提出了水资源和土地资源综合治理方法[50],以考虑水资源与土地资源间的互馈作用以及蓝绿水的转化和分配。水行星边界框架中亦涵盖影响碳吸收与净初级生产过程的土壤水子边界[22],而近期提出的绿水行星边界进一步突显出将绿水纳入水资源管理、统筹考虑水资源和土地资源的必要性[2]。而绿水陆地内循环作为水资源与土地资源在跨流域尺度上的重要纽带,目前在全球范围内对其的讨论仍然集中在学术研究领域,尚无具体实践[6]。
对中国而言,习近平总书记早在2013年起就在一系列重要讲话中指出了水土统筹治理的重要性:“如果种树的只管种树、治水的只管治水、护田的单纯护田,很容易顾此失彼,最终造成生态的系统性破坏”[24],“治水也要统筹自然生态的各要素,不能就水论水。要用系统论的思想方法看问题,生态系统是一个有机生命躯体,应该统筹治水和治山、治水和治林、治水和治田、治山和治林等”[24]。以黄土高原为例,退耕还林还草重大工程的成功施行显著提升了高原植被覆盖度,土壤侵蚀和水土流失问题得到明显缓解、入黄泥沙显著减少[51],高原绿水流得到增强[16],但同时也使得流域产水能力下降[52],由此体现出水、土、生态之间的复杂关联以及科学统筹、系统治理的重要性。习近平总书记将系统治理思想写入“十六字”治水思路,并凝练和升华为“山水林田湖草沙生命共同体”指导思想以及“山水林田湖草沙一体化保护和系统治理”治理理念[53]。绿水以及绿水陆地内循环作为沟通水资源与山水林田湖草沙的重要桥梁,是山水林田湖草沙生命共同体以及一体化保护和系统治理大框架范围内,实现以水土资源为代表的自然资源综合治理的重要抓手。
从水土综合治理的可行性角度,本文表明,由于中国不同地区在自然生态、土地覆被等方面的巨大差异,不同于一对一互馈型、一对多供给型、级联型等简单的绿水陆地内循环类型[54],中国绿水循环是显著的复杂交换型绿水陆地内循环。当不同国家构成复杂交换型陆地内循环时,由于各国水土资源在开发、治理、保护等方面的需求和战略上具有强烈的异质性,依靠拟定国际公约、规范等实现多边水土资源综合治理,在国际形势发生深刻变化背景下,拟约的实际效力以及各拟约方的执行意愿和能力将成为重要问题。而对中国而言,国家于2018年设立自然资源部的重大决策,为中国土地、矿产、森林、草原、湿地、水、海洋等资源的一体化管理提供了坚实支撑。由于蓝绿水资源的划分和优化配置在实践过程中的可操作性仍存在问题,中国绿水的资源化利用仍任重而道远,但可以充分发挥中国在自然资源管理上的制度优势,围绕中国绿水循环拓展治水理论与实践,探索水土资源联合治理新路径,在“四水四定”[55]中“以水定地”的基础上,因地治水、水土相容,进一步践行“山水林田湖草沙”生命共同体思想及系统治理的治理思路。
4.3 全面考虑跨流域水转移过程,为水资源“空间均衡”提供新方案
中国的基本水情是人多水少、水资源时空分布不均,与经济要素之间不适配[56],“十六字”治水思路中的“空间均衡”,是破解中国水资源空间分布与区域经济发展格局不协调的关键。要在全国尺度上缓解乃至解决水资源与经济发展的不均衡问题,要求我们从跨流域的全局尺度全面考虑所有“看得见”和“看不见”的水的转移过程。目前,除本文主要论述的中国绿水循环,中国主要的跨流域尺度水转移过程还包括:
(2)虚拟水/水足迹转移。虚拟水是产品和服务的生产过程中所需的水资源量(水足迹将生产过程扩展至产品供应链全过程),产品贸易即产生了虚拟水/水足迹转移。中国省际间显著的虚拟水/水足迹转移形成了“看不见”的水的跨流域转移。在中国虚拟水/水足迹转移的产业构成中,农业占绝对主导地位[58],而绿水足迹在农作物水足迹中的占比超过80%[59],因此虚拟水/水足迹转移中被转移的主要是绿水。合理的虚拟水/水足迹转移能够缓解水资源与经济的不均衡,但目前中国的虚拟水/水足迹转移呈现出由北向南、自西北向东南的整体格局[58,60],新疆和黑龙江的虚拟水/水足迹年净流出量均达百亿m3级别[58,60⇓ -62],“看不见”的水的跨流域转移格局,在一定程度上为北方地区带来了额外的水压力。
中国绿水循环与跨流域调水和虚拟水/水足迹转移,构成了中国跨流域水转移的基本骨架。由于跨流域调水工程通常规模较大、投入较高,其得到了更广泛的关注。然而,以绿水为主的另外二者的水转移规模均超过跨流域调水。此外,二者从生态与经济角度,刻画了中国常规水资源之外水的转移过程,只有将二者纳入考虑范围,才能实现中国水转移过程的全景刻画。目前,以南水北调工程为核心的跨流域调水以及绿水由南向北的跨流域转移格局体现了南方流域和生态系统对北方水循环和水资源的重要支撑,但虚拟水/水足迹转移在一定程度上引起水由北向南的“回流”,形成潜在闭环,我们需要考虑这种潜在闭环对南北水资源和经济发展平衡的潜在影响。
因此,我们需要全面考虑跨流域水转移过程,将中国绿水循环和虚拟水/水足迹转移纳入治水视野,推动跨流域调水、中国绿水循环和虚拟水/水足迹转移的科学统筹,实现治水与生态文明建设和区域协调发展战略的深度融合,为水资源“空间均衡”打开新局面,为人、水、自然和谐共生提供新思路。
5 结论
绿水对于支持和调节陆地生物圈物质能量循环以及支撑人类农业生产具有举足轻重的作用,绿水通过蒸散发—大气水输送—陆地降水的迁移过程以及伴随的绿水—大气水—白水—降水转化过程,实现了在陆地范围内的循环,成为链接水圈、大气圈、生物圈、人类圈等地球圈层结构的重要环节。大规模人类活动引发的绿水变化将通过绿水的陆地内循环在各圈层远距离广泛传播。因此,对绿水的陆地内循环开展系统研究,对于人类世背景下全球和区域水、资源、生态、环境等的系统治理具有重要意义。本文对中国绿水循环的格局以及自然和人类生态系统在其中的作用展开研究,并结合习近平总书记在水资源和生态文明等方面的重要论述,总结得到中国绿水循环的战略意义。主要结论为:
(1)中国绿水循环具有内循环量大、内循环率高的总体特点,存在由南向北、由西南向东北、西部地区以内循环为主的“三线”输送格局。2000—2018年中国平均绿水流动总量为5.45万亿m3/a,其中50.4%(2.75万亿m3/a)通过中国绿水循环驻留于境内并转化为降水;华南和西南地区绿水向北流动,为华北和东北地区降水提供重要支撑;以青藏高原、云贵川、塔里木盆地为代表的西部地区,具有显著的内循环特征(对自身的绿水内循环率超过20%)。
(2)青藏高原、东南丘陵、云贵川地区、长江中下游平原、黄土高原等是中国绿水循环的关键功能区。青藏高原为中国提供的绿水量超过8000亿m3/a,是中国绿水循环中内循环量最大、内循环率最高的区域;东南丘陵和云贵川地区是中国绿水循环中控制范围最广的绿水供应区,能够将超过2000亿m3/a的绿水输送至长江中下游、华北以及东北地区;长江中下游平原和黄土高原分别是沟通绿水由南向北、由西南向北方和东北地区输送的关键枢纽。
(3)以森林、草地、耕地为代表的自然和人类生态系统对中国绿水循环具有重要支撑作用。森林作为中国西南及东南地区的主要生态系统,为中国绿水循环贡献了超过9000亿m3/a的绿水量;草地作为青藏高原、黄土高原等地区的主要生态系统,为中国贡献的绿水量超过了7000亿m3/a;耕地作为东北平原、长江中下游平原、华北平原等中国粮食主产区的主要生态系统,为中国提供了近6000亿m3/a的绿水量。
(4)中国绿水循环的格局与特点为中国水、资源、生态和环境治理提供了新的着力点。绿水循环是中国水循环的“国内大循环”,是树立治水“全国一盘棋”全局意识的关键;中国绿水循环是水循环与“山水林田湖草沙”的紧密纽带,是统筹“治水、治山、治林、治田”、践行“山水林田湖草沙”一体化保护和系统治理的重要抓手;中国绿水循环与跨流域调水、虚拟水/水足迹转移,从生态、水资源、经济视角共同构成了中国跨流域水转移的全景,推动三者的科学统筹与协调配合,可为实现水资源与经济发展的“空间均衡”提供新方案。
参考文献
Balancing Water for Humans and Nature: The New Approach in Ecohydrology. London: Sterling
A planetary boundary for green water
A discussion on some issues of hydro-geographical research
DOI:10.11821/dlxb202201001
[本文引用: 3]

Water-related issues have long been one of the most important topics in China, and these issues are related to a series of major national requirements, including social stability, people's livelihood and welfare, and economic development. Hydro-geography is an interdisciplinary subject of hydrology and geography that adopts the principles, perspective and methodologies of geography. The theory of the terrestrial surface system has an important enlightening effect on the systematic research of hydro-geography. First, this study discusses the cross-relationship and research content in hydro-geography, as well as the rise of research on global water systems and the ecohydrology. After summarizing the main advocates of terrestrial surface system theory and their viewpoints, this study explores the relationship between the comprehensive and regional aspects of geographic research, while proposing that the "three characteristics" (i.e., comprehensive, regional and orderly characteristics of processes) should be the research thought for hydro-geographical system. Furthermore, based on the expansion of the basic theories of the subject, this study presents several cases of systems science and technology that can deepen the spatiotemporal dynamic process mechanism (orderliness) of hydro-geography. Finally, several key development and research directions of hydro-geographic research in China are discussed, mainly including: research on the impact of climate change and impacts of human activities on the water cycle process; research on the dynamic evolution mechanism of the four major balances in ecohydrology; research on renewability of water resources; the process of evapotranspiration of plants (crops) and water-saving control; hydro-geographic zoning, mapping technology and intelligence technology applications.
水文地理研究发展若干问题商榷
DOI:10.11821/dlxb202201001
[本文引用: 3]
水问题研究一直是我们国家最重要的课题之一,关系到社会稳定、民生福祉、经济发展等一系列国家重大需求。水文地理是水文学与地理学交叉学科,主要采用地理学原理、观点和方法。陆地表层系统的提出对水文地理的系统性研究具有重要的启发作用。首先,对水文地理学的交叉关联、研究内容、全球水系统和生态水文研究的兴起进行阐述;其次,在总结陆地表层系统论思想的主要倡导者及其观点后,讨论了地理研究综合性和区域性的关系,提出综合性、区域性和时空动态过程机理等“三性”应是水文地理系统的研究思想;再次,基于学科基础理论的扩展,给出深化水文地理时空动态过程机理的系统科学技术的几个案例;最后,讨论了中国水文地理研究的几个重点发展方向,主要包括气候变化与人类活动对水循环过程的影响、生态水文四大平衡动态演变过程机理、水资源可再生性维护、“蓝绿水”的认知意义、水文地理区划与制图技术及智能技术等。
The green, blue and grey water footprint of crops and derived crop products
DOI:10.5194/hess-15-1577-2011
URL
[本文引用: 1]
. This study quantifies the green, blue and grey water footprint of global crop production in a spatially-explicit way for the period 1996–2005. The assessment improves upon earlier research by taking a high-resolution approach, estimating the water footprint of 126 crops at a 5 by 5 arc minute grid. We have used a grid-based dynamic water balance model to calculate crop water use over time, with a time step of one day. The model takes into account the daily soil water balance and climatic conditions for each grid cell. In addition, the water pollution associated with the use of nitrogen fertilizer in crop production is estimated for each grid cell. The crop evapotranspiration of additional 20 minor crops is calculated with the CROPWAT model. In addition, we have calculated the water footprint of more than two hundred derived crop products, including various flours, beverages, fibres and biofuels. We have used the water footprint assessment framework as in the guideline of the Water Footprint Network. Considering the water footprints of primary crops, we see that the global average water footprint per ton of crop increases from sugar crops (roughly 200 m3 ton−1), vegetables (300 m3 ton−1), roots and tubers (400 m3 ton−1), fruits (1000 m3 ton−1), cereals (1600 m3 ton−1), oil crops (2400 m3 ton−1) to pulses (4000 m3 ton−1). The water footprint varies, however, across different crops per crop category and per production region as well. Besides, if one considers the water footprint per kcal, the picture changes as well. When considered per ton of product, commodities with relatively large water footprints are: coffee, tea, cocoa, tobacco, spices, nuts, rubber and fibres. The analysis of water footprints of different biofuels shows that bio-ethanol has a lower water footprint (in m3 GJ−1) than biodiesel, which supports earlier analyses. The crop used matters significantly as well: the global average water footprint of bio-ethanol based on sugar beet amounts to 51 m3 GJ−1, while this is 121 m3 GJ−1 for maize. The global water footprint related to crop production in the period 1996–2005 was 7404 billion cubic meters per year (78 % green, 12 % blue, 10 % grey). A large total water footprint was calculated for wheat (1087 Gm3 yr−1), rice (992 Gm3 yr−1) and maize (770 Gm3 yr−1). Wheat and rice have the largest blue water footprints, together accounting for 45 % of the global blue water footprint. At country level, the total water footprint was largest for India (1047 Gm3 yr−1), China (967 Gm3 yr−1) and the USA (826 Gm3 yr−1). A relatively large total blue water footprint as a result of crop production is observed in the Indus river basin (117 Gm3 yr−1) and the Ganges river basin (108 Gm3 yr−1). The two basins together account for 25 % of the blue water footprint related to global crop production. Globally, rain-fed agriculture has a water footprint of 5173 Gm3 yr−1 (91 % green, 9 % grey); irrigated agriculture has a water footprint of 2230 Gm3 yr−1 (48 % green, 40 % blue, 12 % grey).
Global consumptive water use for crop production: The importance of green water and virtual water
Understanding of water resilience in the Anthropocene
The impact of global land-cover change on the terrestrial water cycle
DOI:10.1038/nclimate1690 [本文引用: 1]
Observations of increased tropical rainfall preceded by air passage over forests
DOI:10.1038/nature11390 [本文引用: 1]
Forest-rainfall cascades buffer against drought across the Amazon
DOI:10.1038/s41558-018-0177-y
[本文引用: 1]
Tree transpiration in the Amazon may enhance rainfall for downwind forests. Until now it has been unclear how this cascading effect plays out across the basin. Here, we calculate local forest transpiration and the subsequent trajectories of transpired water through the atmosphere in high spatial and temporal detail. We estimate that one-third of Amazon rainfall originates within its own basin, of which two-thirds has been transpired. Forests in the southern half of the basin contribute most to the stability of other forests in this way, whereas forests in the south-western Amazon are particularly dependent on transpired-water subsidies. These forest-rainfall cascades buffer the effects of drought and reveal a mechanism by which deforestation can compromise the resilience of the Amazon forest system in the face of future climatic extremes.
Empirical estimate of forestation-induced precipitation changes in Europe
DOI:10.1038/s41561-021-00773-6 [本文引用: 1]
Shifts in regional water availability due to global tree restoration
DOI:10.1038/s41561-022-00935-0
[本文引用: 1]
Tree restoration is an effective way to store atmospheric carbon and mitigate climate change. However, large-scale tree-cover expansion has long been known to increase evaporation, leading to reduced local water availability and streamflow. More recent studies suggest that increased precipitation, through enhanced atmospheric moisture recycling, can offset this effect. Here we calculate how 900 million hectares of global tree restoration would impact evaporation and precipitation using an ensemble of data-driven Budyko models and the UTrack moisture recycling dataset. We show that the combined effects of directly enhanced evaporation and indirectly enhanced precipitation create complex patterns of shifting water availability. Large-scale tree-cover expansion can increase water availability by up to 6% in some regions, while decreasing it by up to 38% in others. There is a divergent impact on large river basins: some rivers could lose 6% of their streamflow due to enhanced evaporation, while for other rivers, the greater evaporation is counterbalanced by more moisture recycling. Several so-called hot spots for forest restoration could lose water, including regions that are already facing water scarcity today. Tree restoration significantly shifts terrestrial water fluxes, and we emphasize that future tree-restoration strategies should consider these hydrological effects.
Global water availability boosted by vegetation-driven changes in atmospheric moisture transport
DOI:10.1038/s41561-022-01061-7 [本文引用: 1]
Irrigation as a potential driver for anomalous glacier behavior in high mountain Asia
DOI:10.1002/2017GL076158
PMID:29937602
[本文引用: 1]
Many glaciers in the northwest of High Mountain Asia (HMA) show an almost zero or positive mass balance, despite the global trend of melting glaciers. This phenomenon is often referred to as the "Karakoram anomaly," although strongest positive mass balances can be found in the Kunlun Shan mountain range, northeast of the Karakoram. Using a regional climate model, in combination with a moisture-tracking model, we show that the increase in irrigation intensity in the lowlands surrounding HMA, particularly in the Tarim basin, can locally counter the effects of global warming on glaciers in Kunlun Shan, and parts of Pamir and northern Tibet, through an increase in summer snowfall and decrease in net radiance. Irrigation can thus affect the regional climate in a way that favors glacier growth, and future projections of glacier melt, which may impact millions of inhabitants surrounding HMA, will need to take into account predicted changes in irrigation intensity.
Manifestations and mechanisms of the Karakoram glacier Anomaly
DOI:10.1038/s41561-019-0513-5
PMID:31915463
[本文引用: 1]
Global-scale glacier shrinkage is one of the most prominent signs of ongoing climatic change. However, important differences in glacier response exist at the regional scale, and evidence has accumulated that one particular region stands out: the Karakoram. In the past two decades, the region has shown balanced to slightly positive glacier budgets, an increase in glacier ice-flow speeds, stable to partially advancing glacier termini, and widespread glacier surge activity. This is in stark contrast to the rest of High Mountain Asia, where glacier retreat and slowdown dominate, and glacier surging is largely absent. Termed the, recent observations show that the anomalous glacier behaviour partially extends to the nearby Western Kun Lun and Pamir. Several complementary explanations have now been presented for explaining the Anomaly's deeper causes, but the understanding is far from being complete. Whether the Anomaly will continue to exist in the coming decades remains unclear, but its long-term persistence seems unlikely in light of the considerable warming anticipated by current projections of future climate.
Divergent hydrological response to large-scale afforestation and vegetation greening in China
Large-scale afforestation enhances precipitation by intensifying the atmospheric water cycle over the Chinese Loess Plateau
Contribution of Tibetan Plateau ecosystems to local and remote precipitation through moisture recycling
DOI:10.1111/gcb.v29.3 URL [本文引用: 2]
Human domination of the global water cycle absent from depictions and perceptions
DOI:10.1038/s41561-019-0374-y [本文引用: 1]
Future trend of Yellow River sediment changes
黄河泥沙未来变化趋势
A safe operating space for humanity
Planetary boundaries: Guiding human development on a changing planet
The planetary boundary (PB) concept, introduced in 2009, aimed to define the environmental limits within which humanity can safely operate. This approach has proved influential in global sustainability policy development. Steffenet al.provide an updated and extended analysis of the PB framework. Of the original nine proposed boundaries, they identify three (including climate change) that might push the Earth system into a new state if crossed and that also have a pervasive influence on the remaining boundaries. They also develop the PB framework so that it can be applied usefully in a regional context.
The water planetary boundary: Interrogation and revision
DOI:10.1016/j.oneear.2020.02.009 URL [本文引用: 2]
Integrating the water planetary boundary with water management from local to global scales
Historic achievements and historical changes in New Era's water conservancy
新时代水利事业的历史性成就和历史性变革
Research progress and commentary of green water resources
绿水资源研究进展及评述
Contribution of recycled moisture to local precipitation in the inland Heihe River Basin
DOI:10.1016/j.agrformet.2019.03.014 URL [本文引用: 1]
Impact of climate change on terrestrial water cycle in China
气候变化背景下中国陆地水循环时空演变
Different glacier status with atmospheric circulations in Tibetan Plateau and surroundings
DOI:10.1038/nclimate1580 [本文引用: 1]
The imbalance of the Asian water tower
Global land change from 1982 to 2016
DOI:10.1038/s41586-018-0411-9 [本文引用: 1]
The need for green and atmospheric water governance
Atmospheric water resource and precipitation conversion
空中水资源及其降水转化分析
Length and time scales of atmospheric moisture recycling
The residence time of water vapour in the atmosphere
A precipitation recycling network to assess freshwater vulnerability: Challenging the watershed convention
DOI:10.1029/2019WR025310
PMID:32025063
[本文引用: 1]
Water resources and water scarcity are usually regarded as local aspects for which a watershed-based management appears adequate. However, precipitation, as a main source of freshwater, may depend on moisture supplied through land evaporation from outside the watershed. This notion of evaporation as a local "green water" supply to precipitation is typically not considered in hydrological water assessments. Here we propose the concept of a, which establishes atmospheric pathways and links land surface evaporation as a moisture supply to precipitation, hence contributing to local but also remote freshwater resources. Our results show that up to 74% of summer precipitation over European watersheds depends on moisture supplied from other watersheds, which contradicts the conventional consideration of autarkic watersheds. The proposed network approach illustrates atmospheric pathways and enables the objective assessment of freshwater vulnerability and water scarcity risks under global change. The illustrated watershed interdependence emphasizes the need for global water governance to secure freshwater availability.©2019. The Authors.
Simulated impacts of irrigation on the atmospheric circulation over Asia
Recent progress on the sources of continental precipitation as revealed by moisture transport analysis
Atmospheric basins: Identification of quasi-independent spatial patterns in the global atmospheric hydrological cycle via a complex network approach
Tracking the global flows of atmospheric moisture and associated uncertainties
DOI:10.5194/hess-24-2419-2020
URL
[本文引用: 1]
. Many processes in hydrology and Earth system science relate to continental moisture recycling, the contribution of terrestrial evaporation to precipitation. For example, the effects of land-cover changes on regional rainfall regimes depend on this process. To study moisture recycling, a range of moisture-tracking models are in use that are forced with output from atmospheric models but differ in various ways. They can be Eulerian (grid-based) or Lagrangian (trajectory-based), have two or three spatial dimensions, and rely on a range of other assumptions. Which model is most suitable depends not only on the purpose of the study but also on the quality and resolution of the data with which it is forced. Recently, the high-resolution ERA5 reanalysis data set has become the state of the art, paving the way for a new generation of moisture-tracking models. However, it is unclear how the new data can best be used to obtain accurate estimates of atmospheric moisture flows. Here we develop a set of moisture-tracking models forced with ERA5 data and systematically test their performance regarding continental evaporation recycling ratio, distances of moisture flows, and “footprints” of evaporation from seven point sources across the globe. We report simulation times to assess possible trade-offs between accuracy and speed. Three-dimensional Lagrangian models were most accurate and ran faster than Eulerian versions for tracking water from single grid cells. The rate of vertical mixing of moisture in the atmosphere was the greatest source of uncertainty in moisture tracking. We conclude that the recently improved resolution of atmospheric reanalysis data allows for more accurate moisture tracking results in a Lagrangian setting, but that considerable uncertainty regarding turbulent mixing remains. We present an efficient Lagrangian method to track atmospheric moisture flows from any location globally using ERA5 reanalysis data and make the code for this model, which we call UTrack-atmospheric-moisture, publicly available.\n
PML-V2 (China): Evapotranspiration and gross primary production dataset (2000.02.26-2020.12.31)
中国区域PML-V2陆地蒸散发与总初级生产力数据集(2000.02.26—2020.12.31)
The 30 m annual land cover dataset and its dynamics in China from 1990 to 2019
DOI:10.5194/essd-13-3907-2021
URL
[本文引用: 1]
. Land cover (LC) determines the energy exchange, water and carbon cycle between Earth's spheres. Accurate LC information is a fundamental parameter for the environment and climate studies. Considering that the LC in China has been altered dramatically with the economic development in the past few decades, sequential and fine-scale LC monitoring is in urgent need. However, currently, fine-resolution annual LC dataset produced by the observational images is generally unavailable for China due to the lack of sufficient training samples and computational capabilities. To deal with this issue, we produced the first Landsat-derived annual China land cover dataset (CLCD) on the Google Earth Engine (GEE) platform, which contains 30 m annual LC and its dynamics in China from 1990 to 2019. We first collected the training samples by combining stable samples extracted from China's land-use/cover datasets (CLUDs) and visually interpreted samples from satellite time-series data, Google Earth and Google Maps. Using 335 709 Landsat images on the GEE, several temporal metrics were constructed and fed to the random forest classifier to obtain classification results. We then proposed a post-processing method incorporating spatial–temporal filtering and logical reasoning to further improve the spatial–temporal consistency of CLCD. Finally, the overall accuracy of CLCD reached 79.31 % based on 5463 visually interpreted samples. A further assessment based on 5131 third-party test samples showed that the overall accuracy of CLCD outperforms that of MCD12Q1, ESACCI_LC, FROM_GLC and GlobeLand30. Besides, we intercompared the CLCD with several Landsat-derived thematic products, which exhibited good consistencies with the Global Forest Change, the Global Surface Water, and three impervious surface products. Based on the CLCD, the trends and patterns of China's LC changes during 1985 and 2019 were revealed, such as expansion of impervious surface (+148.71 %) and water (+18.39 %), decrease in cropland (−4.85 %) and grassland (−3.29 %), and increase in forest (+4.34 %). In general, CLCD reflected the rapid urbanization and a series of ecological projects (e.g. Gain for Green) in China and revealed the anthropogenic implications on LC under the condition of climate change, signifying its potential application in the global change research. The CLCD dataset introduced in this article is freely available at https://doi.org/10.5281/zenodo.4417810 (Yang and Huang, 2021).
Understanding the new development stage, applying the new development philosophy, and creating a new development dynamic
把握新发展阶段, 贯彻新发展理念, 构建新发展格局
The greatest water problem: The inability to link environmental security, water security and food security
DOI:10.1080/07900620120094073 URL [本文引用: 1]
Blue Revolution: Integrated Land and Water Resources Management
Reduced sediment transport in the Yellow River due to anthropogenic changes
DOI:10.1038/ngeo2602 [本文引用: 1]
Revegetation in China's Loess Plateau is approaching sustainable water resource limits
DOI:10.1038/nclimate3092 [本文引用: 1]
Approaching moisture recycling governance
DOI:10.1016/j.gloenvcha.2017.04.007 URL [本文引用: 1]
Speech at symposium on ecological protection and high-quality development in the Yellow River Basin
在黄河流域生态保护和高质量发展座谈会上的讲话
Study on characteristics of virtual water flow spatial change and influencing factors in China
城市化背景下中国虚拟水流动空间变化特征及其驱动因素研究
Assessing agricultural water use effect of China based on water footprint framework
基于水足迹的中国农业用水效果评价
Study on the characteristics of inter-regional water footprint spatial transfer network in China
中国省际水足迹空间转移网络特征研究
Water footprint and space transfer at provincial level of China based on MRIO model
DOI:10.31497/zrzyxb.20190504
[本文引用: 1]
Based on the input-output table of 31 provinces (autonomous regions and municipalities) in China in 2012, the water footprint and water footprint trade structure of the provinces in China were calculated and analyzed by establishing the I-O model of water resources expansion, and the spatial transfer pattern of the provinces was analyzed based on the interprovincial trade. The results showed that: (1) In 2012, the total amount of internal water footprint, the net input water footprint of international trade, and the net export water footprint of interprovincial trade were 4819.3×108 m3, 261.3×10⁸ m3, and 801.6×10⁸ m3, respectively. Inter-provincial trade played a leading role in the national water footprint trade. (2) In terms of the provincial-level region, 19 were net output provinces, such as Hebei and Heilongjiang, 12 were net input provinces, such as Beijing and Tianjin. In the view of the industry, the net output water footprint of the primary industry, the net input of the secondary industry, and the net output of the tertiary industry were 757.9×10⁸ m3, 222.2×10⁸ m3, and 4.6×10⁸ m3, respectively. (3) The inter-provincial water footprint spatial transfer has the inconsistency between the source and the destination provinces, the geographical proximity of provincial transfer, and the phenomenon was obvious in resources-rich provinces and economically developed areas.
基于MRIO模型的中国省(市)区水足迹测度及空间转移格局
DOI:10.31497/zrzyxb.20190504
[本文引用: 1]
基于2012年中国31个省(市)区的投入产出表,建立水资源扩展型的投入产出模型,测算了中国31个省(市)区的水足迹及水足迹贸易量,并基于省际贸易分析了省(市)区间空间转移格局。结果显示:(1)2012年,中国水足迹总量为4819.3亿m<sup>3</sup>,国际贸易净输入水足迹为261.3亿m<sup>3</sup>,省际贸易净输出水足迹为801.6亿m<sup>3</sup>,省际贸易在全国水足迹贸易中占主导地位。(2)就省(市)区而言,河北、黑龙江等19个省(市)区为净输出省份,北京、天津等12个省(市)区为净输入省份;分产业来看,第一产业水足迹净输出757.9亿m<sup>3</sup>;第二产业净输入222.2亿m<sup>3</sup>、第三产业净输出4.6亿m<sup>3</sup>。(3)省际间水足迹空间转移具有来源与去向的不一致性,同时存在省(市)区转移的地理邻近性,资源丰富省份和经济发达地区转移现象明显。
Deciphering the pattern for inter-provincial water stress transferring: A case study on China's mainland
中国省际水资源压力的转移模式
