

1 引言
健康是人民的基本诉求,人民健康是民族昌盛和国家富强的重要标志[1]。健身资源作为全民健身活动的基本载体,在促进居民生理和心理健康方面发挥着重要的作用,其空间均衡程度不仅关系到居民获取健康服务的公平性,更与人类健康福祉存在紧密联系[2-3]。2014年国务院印发《关于加快发展体育产业促进体育消费的若干意见》文件,标志着全民健身正式上升为国家战略。国家体育总局第三次调查结果显示,中国20~69岁居民健身率仅为14.7%,2017年中国人均体育场地面积为1.66 m2,远低于美国的16 m2,健身休闲产业的经济贡献率仅为3.26%[4]。由此可见,在全民健身战略实施以来仍然存在居民健身意识薄弱、公共健身场地短缺和健身休闲产业发展水平较低等突出问题。在此背景下,2019年国务院进一步印发《关于促进全民健身和体育消费推动体育产业高质量发展的意见》,文件指出要增加健身资源供给和丰富服务业态,以满足居民对健康生活的追求。商业健身资源作为健身资源的重要补充和新兴服务业态,以其独有的专业性、社交性和娱乐性受到不同群体的欢迎,探究商业健身资源集聚的区域差异对弥补公共健身资源的不足和培育新经济增长点具有重要意义[5-6]。
国外学者对健身资源的关注始于人们对身材和体型的认知态度[7],西方文化将肥胖作为负面的不健康指标,追求健身资源开始成为健康生活方式的主要表征[8]。随后,国外学者将研究重点聚焦在以下几个方面:① 不同群体对健身资源的空间感知和行为特征。Danis等研究认为不同性别对商业健身俱乐部空间感知侧重具有差异,男性较关注健身设施本身,女性更为关注商业健身俱乐部周边社会安全状况[9]。Uffelen等[10]和Rimmer等[11]探讨了老年人和残疾人对健身资源的空间可获得性。② 健身资源空间布局公平性评估。Talen等基于重力模型、旅行成本和最小距离等方法评估了体育健身场所空间布局的社会公平性[12-13]。③ 健身资源与城市经济之间的关系。Bess认为体育健身资源布局应该与住宅、商业等功能用地相结合,推动城市经济繁荣发展[14]。Crompton等认为大型体育场馆建设可以提升公民对城市的认同感,也会促进城市旅游经济发展[15]。④ 健身资源空间格局及影响因素。Newsome等发现美国大型体育设施的郊区化趋势已扭转并在向城市中心回流[16]。Erkip认为人口规模、收入水平、距离可达、教育程度以及性别等因素会对健身资源布局产生影响[17]。
国内学者针对健身资源也开展了较多的探索。随着全民健身和体育强国上升为国家战略,公共健身资源的区位选址[18]、空间格局与影响因素[19]、供需匹配[20]、可达性[21]成为国内城市地理学和规划学科的研究热点。例如,陈旸将GIS空间分析技术引入社区体育服务中,通过空间分析和辅助决策系统进行社区体育服务设施的选址[22]。张建波等基于遥感影像数据对长春市健身空间开展空间格局及影响因素分析[23]。张培刚等从居民健身需求视角出发探讨公共体育资源与居民之间的供需匹配关系[24]。蔚芳等基于2SFCA分析法发现杭州市公共体育设施可达性存在空间极化效应[25]。近年来,随着社会节奏的加快和居民生活水平的提升,公共健身资源中设施类型的单一性和资源总量的稀缺性难以满足居民对健身的多样化需求,而商业健身资源所提供的健身设施更加多样,参与式体验感更为丰富,且使用时间更加灵活,能够较好满足不同群体对健身的需求。在此背景下,商业健身资源获得快速发展,地理学、社会学和管理学等学者也逐步关注到商业健身资源这一新兴服务业态并开展相关研究,主要集中在以下几个方面:① 居民健身及消费行为动机研究。徐琳认为消费者参与健身的动机分为任务型和休闲型,不同动机的消费者存在不同的服务诉求[26]。姜玉培等基于大众点评数据对南京市居民健身行为时空特征进行分析,发现居民夏季健身需求较旺盛,工作日和非工作日差别不大[27]。② 经营模式及管理研究。王乔君等通过问卷调查和实地考察提出要构建健身俱乐部系统网络化、管理多元化和服务多样化的市场体系[28]。田里等认为健身房的经营管理应该注重提升服务质量和利用多样化的营销手段[29]。③ 空间演化及影响因素研究。李仁杰等[30]、王珏晗等[31]、娄金男等[32]和孙枫等[4]分别基于兴趣点(POI)数据对北京市、广州市、哈尔滨市和上海市的商业型健身房开展空间格局及影响因素分析。④ 女性健身参与的社会分层研究。熊欢从社会分层理论和女性主义理论出发对不同收入群体女性的健身行为和观念进行探究,发现不同收入群体女性参与健身活动的机会和制约条件存在差异[33-34]。
综上所述,目前学术界围绕健身资源已经开展较多研究,由于地理空间分析存在尺度效应[35],已有研究多集中在单一城市和社区等微观尺度下的公共健身资源,而针对商业健身资源的相关研究又多集中在管理学和社会学,地理学视角下宏观尺度的商业健身资源的集聚演化呈现出何种规律?大数据时代下,作为新兴资源要素的商业健身资源是否会在空间集聚上存在新表现?尽管目前包括商业健身资源的新兴资源要素在发展前期的地理空间意义较弱,但随着中国改革开放的不断深入,市场对该类业态的影响将更加深远与持久,通过追踪个例新兴资源要素的空间动态及其演变研究,在不断积累的情况下可能表现并发现其普遍地理意义。因此,有必要对基于时空大数据支撑的全国尺度下商业健身资源集聚的格局演化及其形成机理进行探讨。本文以商业健身资源为研究对象,旨在通过研究可以在一定程度上折射出新经济背景下中国新兴资源要素集聚的区域差异特征。
鉴于此,本文基于百度POI数据和传统统计数据,采用资源空间集聚度和热点分析方法,从空间集聚和空间关联集聚两个方面刻画中国商业健身资源集聚演化规律,运用地理探测器方法探测其关键因素,以期为优化中国商业健身资源空间格局、缩小健身资源区域差异和推动健康中国战略实施提供科学参考。
2 理论基础构建
地理本性是指一个区域在地理空间上呈现出的有别于其他区域的本质特性[36]。1993年经济地理学家Krugman提出地理本性论以解释经济集聚和区域发展现象[37],其认为自然禀赋是第一地理本性,第二地理本性是人类适应环境及其对环境改造的结果,主要包括交通和区位等要素。随着信息化时代的到来,刘清春等[38]、夏海斌等[39]提出以人力资本、信息化水平和研发水平等为代表的第三地理本性。集聚是资源要素在自由流动和优化重组下的基本空间配置模式[40]。资源的集聚演化是一个渐进的动态过程[41],而资源在集聚演化过程中深刻受到三大地理本性的影响,同时与地理本性论联系紧密的新古典经济学、新经济地理学、演化经济地理学等理论的发展也为研究资源集聚演化提供了理论支撑。
农业社会时期,新古典经济学理论指出,在地形地势、气象气候和土壤肥力等自然条件与自然资源禀赋方面具有比较优势的区域往往率先获得发展的机会,进而推动区域发展,第一地理本性的自然禀赋是促进资源集聚和推动区域发展的初始动力。进入工业社会以来,新经济地理学理论认为资源集聚与区域比较优势联系较弱,规模经济、运输成本和要素流动等是推动资源集聚演化的重要驱动力,以交通、区位和劳动力等传统社会经济要素为代表的第二地理本性成为资源集聚与区域差异的主导因素。随着信息化社会的到来,人才规模、创新能力和信息化水平等新经济要素在塑造区域新发展格局中发挥着至关重要的作用。同时,演化经济地理学理论中的知识溢出、人力资本和技术创新既为解释区域发展新格局提供了思路,也为借鉴第三地理本性探讨新经济背景下区域发展新格局提供了相应的理论基础。由此,本文构建了基于地理本性的资源集聚与演化的基本理论框架(图1)。
图1
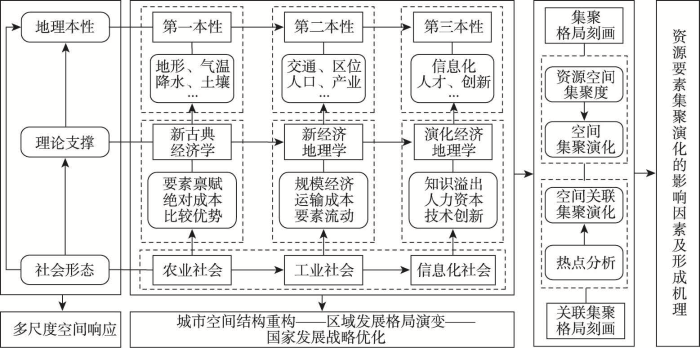
图1
基于地理本性的资源集聚与演化的理论基础构建
Fig. 1
Theoretical foundation construction of resources agglomeration and evolution based on geographical nature
地理本性视角下资源的集聚与演化在空间发展上呈现出多尺度空间响应关系,资源集聚的过程是企业在城市空间选址最优化的结果,进而带动集聚区域周边土地利用方式的变化,推动城市空间结构的重构。在中国新的区域发展总体格局下,与传统资源要素比较,新兴资源要素对国家新的发展格局战略更具重要意义,新兴资源要素的集聚演化也可能呈现不同的空间特征。随着交通和通讯网络的发展,基于流空间视角下的城市网络联系逐步增强,区域的发展伴随着空间溢出效应会对周边邻近城市的发展产生影响。因此,应该重视空间关联视角下资源要素集聚的作用机制。基于此,在资源集聚的格局刻画上,一方面,本文以区位商思想为基础,通过构建资源空间集聚度对中国商业健身资源空间集聚演化规律进行分析。另一方面,运用兼顾空间集聚与相邻关联的热点分析法探讨中国商业健身资源空间关联集聚演化特征。本文认为三大地理本性共同推动了资源要素的集聚和区域发展格局的演变,然而,三大地理本性在促进新兴资源要素集聚与演化过程中分别扮演着何种角色?三大地理本性要素之间的交互组合如何作用于新兴资源要素集聚与演化?以上问题值得探讨。
3 研究方法、概念界定与数据来源
3.1 研究方法
3.1.1 资源空间集聚度
式中:Dit为第i个城市第t年的商业健身资源空间集聚度;Rit为第i个城市第t年的商业健身资源数量;Ait为第i个城市第t年的城市行政面积;Rt为第t年的全国商业健身资源总量;At为第t年的全国城市行政面积。
3.1.2 热点分析
式中:xj是城市j的商业健身资源数量;wij为要素i和j的空间权重;n为城市总数。如果
3.1.3 地理探测器
中国商业健身资源集聚存在明显的空间异质性特征,本文借助地理探测器中的因子探测和交互探测识别影响商业健身资源空间关联集聚的主要因素[46]。公式如下:
式中:L为各因素的类型;n和nh分别为研究区域内的样本数和类型h内的样本数;
3.2 概念界定与数据来源
目前,学术界在公共健身资源和商业健身资源概念界定方面并未形成统一认识,综合前人研究[47-48]以及相关政策文件[49-50],本文认为公共健身资源是指由国家政府财政拨款或社会资金筹集建设的,以满足城乡社区(村)居民健身需求为目的的户外健身场所,具有公益性和开放性特征,主要包括户外健身器材、开放式篮球场和足球场等。商业健身资源是指能够为特定居民提供健身娱乐、减压塑型等功效的室内商业型服务场所,具有盈利性和有偿性特征,主要包括商业健身中心、游泳馆、瑜伽馆及室内球类场馆。与公共健身资源相比,商业健身资源能够较好的满足居民多层次和多样化的健身体验需求。本文考虑到不同类型商业健身资源的群体适宜度、接受度和需求度等因素,特选取商业健身中心作为研究对象。
POI数据具有位置精度高、更新速度快和产业分类细等特点,能够准确地反映城市要素集聚能力[51],虽然POI数据是点位数据,但是每个POI点位的背后是对应的地理事物,是在综合考虑区域尺度的经济、社会、文化和交通等多因素耦合,或者点位微观尺度的商圈距离、地价水平、住宅密度和交通站点等微区位要素耦合下的必然结果,因此,应用POI大数据探索新兴资源要素在地理空间上的新表现具有一定地理意义。本文主要以中国367个地级及以上行政区为研究区域,以商业健身中心为研究对象,POI数据主要来自于2012年、2014年和2017年百度地图,经过重复值剔除、异常点筛选和坐标纠偏等处理,最终提取有效信息6733个、8654个和41906个(图2)。为进一步检验数据的可靠性,首先,将每一年份POI数据导入ArcGIS 10.2中,观察其在各个城市空间中的分布,不存在明显的空间不连续情况。其次,将文中的商业健身资源POI数量与上海体育学院、三体云动数据中心联合发布的《中国健身行业数据报告》和相关既有研究[32]中的商业健身资源数量进行对比,发现数量差别相对较小,因此,上述检验基本可以反映本文数据的可靠性。影响因素指标数据主要来自《各省市统计年鉴》《中国城市统计年鉴》以及各地市国民经济和社会发展统计公报。针对部分地市缺乏对常住人口数据开展统计的情况,鉴于上述地市的地理空间区位基本上处在中国人口分布的相对“边缘地区”,而且在人口迁移方面,上述地市均属于非活跃区和平衡活跃区,因此,本文使用户籍人口替代上述地市的常住人口不会对全国人口分布的时空格局产生实质性影响。限于统计标准一致性,在影响因素部分暂未将香港、澳门和台湾纳入研究范围。
图2
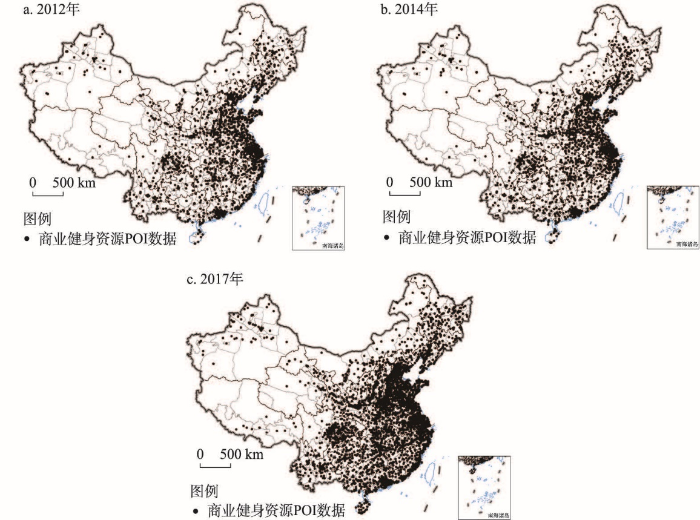
图2
2012—2017年中国商业健身资源POI数据空间分布
注:基于自然资源部标准地图服务网站GS(2016)1594号标准地图制作,底图边界无修改。
Fig. 2
Spatial distribution of POI data of commercial fitness resources in China during 2012-2017
4 商业健身资源集聚格局演化
4.1 空间集聚演化
基于资源空间集聚度方法对中国商业健身资源空间集聚演化特征进行分析。通过K-S正态性检验结果发现,2012年、2014年和2017年中国商业健身资源空间集聚度数据不具有正态性特征,因此,在利用ArcGIS 10.2进行可视化分级时采用几何间隔法更为科学,在此基础上,运用该方法将2012年、2014年和2017年中国商业健身资源空间集聚格局划分为5级(图3)。
图3
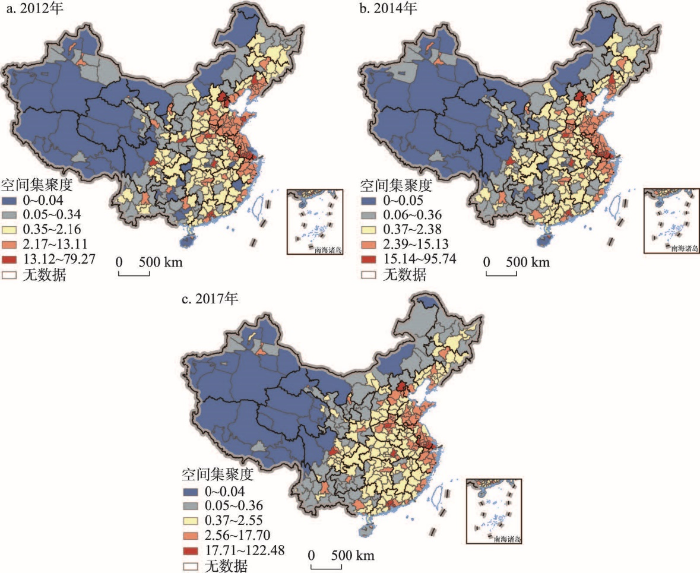
图3
2012—2017年中国商业健身资源空间集聚格局
注:基于自然资源部标准地图服务网站GS(2016)1594号标准地图制作,底图边界无修改。
Fig. 3
Spatial agglomeration pattern of commercial fitness resources in China during 2012-2017
(1)中国商业健身资源集聚类型的城市数量结构逐步向“橄榄型”演变。依据中国商业健身资源空间集聚类型的城市数量比例关系可知,中值区的城市数量在持续增加,且占据主导地位,低值区和高值区的城市数量在不断的减少,所占比例均较低。具体而言,2012年中国商业健身资源空间集聚低值区和较低值区的城市数量分别为69个和79个,占比分别为18.8%和21.53%。2017年低值区城市数量下降至40个,较低值区城市数量增加至86个,占比分别为10.9%和23.43%。2012年中国商业健身资源空间集聚中值区的城市数量为116个,占比为31.61%。2017年中值区城市数量增加至150个,占比为40.87%。2012年中国商业健身资源空间集聚较高值区和高值区的城市数量分别为81个和22个,占比分别为22.07%和5.99%。2017年较高值区和高值区城市数量分别下降至76个和15个,占比分别为20.71%和4.09%。中国商业健身资源集聚类型的城市数量结构呈现出的“橄榄型”特征,有助于提升居民在获取健康资源过程中的使用机会。
(2)中国商业健身资源空间集聚高值区呈现出以京广铁路(含高铁)与长江黄金水道为骨干的“十”字型廊道的空间格局形态与演化趋势,区域中心城市在此格局中扮演重要角色,京广沿线城市经济发展和长江经济带则发挥着重要的支撑作用。具体而言,上海市和深圳市在中国商业健身资源空间集聚演化中发挥着极强的引领作用,空间集聚度稳居前两位。此外,位于西部的成都市,中部的武汉市,东部的苏州市、无锡市和南京市,南部的广州市和东莞市,北部的北京市和郑州市,属于仅次于上海市和深圳市的高值区。由此,在空间上,由东西连线的上海市、苏州市、南京市、无锡市、武汉市、成都市,南北连线的北京市、郑州市、武汉市、广州市、东莞市、深圳市,共同构成中国商业健身资源空间集聚高值区的“十”字型格局的基本雏形,未来随着京广沿线城市和长江经济带资源集聚能力的进一步提升,“十”字型格局的廊道形态在空间上将会更加显著。上述格局的呈现不仅仅反映了商业健身资源高值区空间集聚的状态,同时也是城市综合实力的体现,其中武汉市位于“十”字型格局的中心,在地理区位上发挥着连接东西、贯穿南北的枢纽作用。
(3)中国城市群地区是商业健身资源较高值区空间集聚的主体区域。研究期间,中国商业健身资源空间集聚的较高值区分布相对稳定,自北向南主要在辽中南、京津冀、中原、山东半岛、长三角、海峡西岸以及粤港澳大湾区等城市群地区呈现连片分布,其中沿海地区的城市群发挥着主导作用,尤其是在山东半岛和长三角城市群表现出更强的空间连片发展态势。需要指出的是,作为国家级城市群的长江中游城市群和成渝城市群,在商业健身资源集聚的过程中表现并不突出。目前虽然长江中游城市群商业健身资源的空间连片发展趋势较弱,在空间集聚上呈现出武汉、长沙和南昌“一核双心”结构特征,但是随着长江经济带战略的实施,武汉都市圈、长株潭城市群、环鄱阳湖城市群的发展,该“一核双心”地区可能成为中国商业健身资源空间集聚较快的区域。成渝城市群中成都市的商业健身资源集聚能力显著强于重庆市,而且其周边地市的资源集聚能力相对较差,因此,成渝城市群商业健身资源集聚演化呈现出“单核心”空间结构。
4.2 空间关联集聚演化
资源空间集聚度较好地刻画了中国商业健身资源空间集聚格局。在此基础上,运用兼顾空间集聚与相邻关联的热点分析能够更好地探讨空间关联视角下中国商业健身资源的集聚演化规律。为了进一步反映中国商业健身资源空间关联集聚演化特征,基于ArcGIS 10.2软件测度
根据商业健身资源冷热点空间分布(图4),为了更深入地分析商业健身资源的空间关联集聚与演化特征,在保持热点区和次热点区最大范围的前提下,分析“热区”与“冷区”的空间集聚与演化格局,本文以次冷点区和次热点区分界线作为划分“热区”与“冷区”的界线。基于此,本文提出了中国商业健身资源空间关联集聚的“巴彦淖尔—湛江线”。从图4可以看出,研究期间,中国商业健身资源冷热点分布大致以“巴彦淖尔—湛江线”为界,热点和次热点区基本位于“巴彦淖尔—湛江线”以东地区,该线与著名的“胡焕庸线”相交于甘肃省平凉市。平凉市节点的“胡焕庸线”以北区域,商业健身资源次热点区跨越“胡焕庸线”向西发展;平凉市节点的“胡焕庸线”以南地区,商业健身资源配置相对较为滞后,依然以冷点区为主。以上的空间分布规律,一方面表明,平凉市节点的“胡焕庸线”以南地区的西半部,商业健身资源配置水平较低且提升较慢;另一方面表明,平凉市节点的“胡焕庸线”以北区域,随着中国区域协调发展、高质量发展和新型城镇化等战略的推进,仅以本研究为例,以商业健身资源为代表的新兴资源要素,具有跨越“胡焕庸线”并向西发展的趋势,而且该趋势在时间演化上逐渐加强。本文所提出的“巴彦淖尔—湛江线”是在大数据支撑下,作为新兴资源要素的中国商业健身资源在关联集聚演化的空间热点上呈现出的规律,虽然并非是基于商业健身资源总量直接所呈现出的格局特征,但在资源高、低值空间聚类与相邻关联的状态下,对于在中国“胡焕庸线”总体格局下的新发现,依然具有一定的地理意义与研究启示。随着中国改革开放和区域协调发展政策的深化落实,该线反映了在整合有关资源发展、国家相关政策和战略规划下,西北地区可能在某些新业态的发展方面,具有率先突破“胡焕庸线”发展的态势,从而推动区域协调发展。
图4
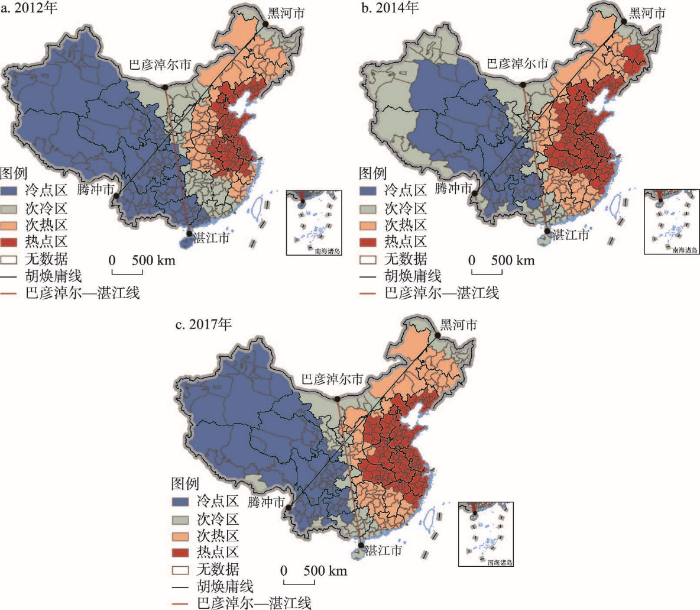
图4
2012—2017年中国商业健身资源空间关联集聚格局
注:基于自然资源部标准地图服务网站GS(2016)1594号标准地图制作,底图边界无修改。
Fig. 4
Spatial correlation and agglomeration pattern of commercial fitness resources in China during 2012-2017
在上述“巴彦淖尔—湛江线”空间特征的同时,中国商业健身资源冷热点区域的阶梯式分布特征较为明显,自东向西由热点区、次热点区逐步演替为次冷点区、冷点区,其中空间热点区域经历了由环渤海、长三角地区向华北、华中和华东地区扩张演化的过程,东北和西北地区的次热点区域具有跨越“胡焕庸线”并向西发展的态势,而且在时间演化上呈现逐渐加强的趋势,冷点和次冷点区域整体变化相对稳定,局部变化主要表现为广西东部和广东西部地区由冷点区演变为次冷点区。具体来看,2012年中国商业健身资源热点区域主要集中布局在环渤海地区和长三角地区,次热点区围绕热点区分布。2014年中国商业健身资源开始向北在黑龙江和吉林省交界处形成新的热点区,同时热点区开始向西逐步覆盖山西省、河南省和湖北省,向南开始往江西省和福建省扩张。2017年中国商业健身资源主要热点区保持相对稳定,但也伴随着扩张和收缩,主要表现在热点区向西和向南分别在山西省和江西省存在一定程度扩张,东北地区黑龙江和吉林省交界处的热点区演化为次热点区。值得注意的是,位于西部的成渝城市群地区在商业健身资源空间关联集聚分析中被识别为冷点区,此现象与一般规律和认知有所不同,这主要是由于热点分析识别的是空间关联下的商业健身资源集聚格局,虽然成都市的商业健身资源空间集聚度较高,但是其周边城市的资源集聚能力处于比较低的水平。因此,热点分析下的成渝城市群地区依然属于冷点区,这也表明成渝城市群内部区域差异显著,极化现象比较突出,城市之间的空间关联性相对较弱。
5 地理本性视角下商业健身资源集聚与演化的形成机理
5.1 指标构建
本文尝试从区域的地理本性视角出发,探讨中国商业健身资源集聚演化背后的机理。为定量识别影响中国商业健身资源集聚与演化的关键因素,本文通过综合参考前人相关研究[4,31 -32,38-39],选取地形地势、气温和降水作为表征第一地理本性的主要指标,选取交通设施、市场规模、消费能力和城市规模作为表征第二地理本性的主要指标,选取人力资本、创新能力、开放程度和信息化水平作为表征第三地理本性的主要指标(表1)。以中国各地市商业健身资源空间关联集聚
表1 中国商业健身资源集聚演化的影响因素
Tab. 1
| 地理本性 | 变量 | 影响因素 | 具体指标选取(单位) |
|---|---|---|---|
| 第一地理本性 | x1 | 地形地势 | 中国各地市的地形起伏度(°) |
| x2 | 气温 | 中国各地市的气温年均值(℃) | |
| x3 | 降水 | 中国各地市的降水年均值(mm) | |
| 第二地理本性 | x4 | 交通设施 | 中国各地市的道路面积(km2) |
| x5 | 市场规模 | 中国各地市的年末常住人口数(万人) | |
| x6 | 消费能力 | 中国各地市的人均可支配收入(元) | |
| x7 | 城市规模 | 中国各地市的建成区面积(km2) | |
| 第三地理本性 | x8 | 人力资本 | 中国各地市的普通高等学校在校学生数(万人) |
| x9 | 创新能力 | 中国各地市的专利授权量(件) | |
| x10 | 开放程度 | 中国各地市的实际利用外资金额(万美元) | |
| x11 | 信息化水平 | 中国各地市的电信业务收入(万元) |
5.2 因素探测
5.2.1 因子探测分析
基于地理探测器对2012—2017年中国商业健身资源集聚与演化的影响因子展开相关分析。结果表明(表2),研究期间,第一地理本性要素在影响因素排序中,基本稳定排在后3位,其中地形地势的解释力高于气温和降水。总体上,上述3个因子对商业健身资源集聚演化的影响相对较小。第二地理本性要素对商业健身资源集聚与演化的解释力在不断下降,2012年第二地理本性要素中的城市规模和交通设施的解释力排在前2位,消费能力排在第4位,而在2014年和2017年上述因子排名均出现不同程度的下滑。第三地理本性要素对商业健身资源集聚与演化的解释力在持续提升,尤其是在2014年和2017年。第三地理本性要素中的开放程度和创新能力替代第二地理本性要素中的城市规模和交通设施,成为解释力最高的因子,表明相对于第一和第二地理本性中的传统自然、经济社会要素,第三地理本性中的新经济要素对商业健身资源集聚与演化的作用程度在持续加强。
表2 2012—2017年中国商业健身资源集聚演化的影响因子探测结果
Tab. 2
| 序号 | 2012年 | 2014年 | 2017年 | |||||
|---|---|---|---|---|---|---|---|---|
| 因子排序 | q值 | 因子排序 | q值 | 因子排序 | q值 | |||
| 1 | 城市规模(x7) | 0.8211*** | 开放程度(x10) | 0.8225*** | 开放程度(x10) | 0.8689*** | ||
| 2 | 交通设施(x4) | 0.7887*** | 创新能力(x9) | 0.7941*** | 创新能力(x9) | 0.8213*** | ||
| 3 | 创新能力(x9) | 0.7104*** | 交通设施(x4) | 0.7625*** | 信息化水平(x11) | 0.7991*** | ||
| 4 | 消费能力(x6) | 0.6698*** | 消费能力(x6) | 0.7447*** | 交通设施(x4) | 0.7799*** | ||
| 5 | 开放程度(x10) | 0.6491*** | 城市规模(x7) | 0.6932*** | 城市规模(x7) | 0.7557*** | ||
| 6 | 信息化水平(x11) | 0.6168*** | 信息化水平(x11) | 0.6417*** | 消费能力(x6) | 0.6467*** | ||
| 7 | 人力资本(x8) | 0.4711*** | 人力资本(x8) | 0.4409*** | 人力资本(x8) | 0.4617*** | ||
| 8 | 市场规模(x5) | 0.2577*** | 市场规模(x5) | 0.2373*** | 市场规模(x5) | 0.3998*** | ||
| 9 | 地形地势(x1) | 0.2516*** | 地形地势(x1) | 0.2331*** | 地形地势(x1) | 0.2401*** | ||
| 10 | 降水(x3) | 0.0463** | 降水(x3) | 0.0809*** | 降水(x3) | 0.1396*** | ||
| 11 | 气温(x2) | 0.0328* | 气温(x2) | 0.0306* | 气温(x2) | 0.0991*** | ||
注:*、**、***分别表示在0.10、0.05和0.01的置信度水平上统计显著。
整体而言,第三地理本性要素中的开放程度、创新能力和信息化程度是影响中国商业健身资源集聚演化的主导因素,第二地理本性要素中的城市规模、交通设施、消费能力和市场规模,以及第三地理本性要素中的人力资本在推动商业健身资源集聚和演化中发挥着不同程度的促进作用。而以地形地势、气温和降水为代表的第一地理本性要素在商业健身资源集聚演化中发挥着基础性作用。
5.2.2 交互探测分析
通过地理探测器中的交互探测对双因子之间交互作用开展分析。结果表明,中国商业健身资源的集聚演化是三大地理本性要素共同作用下的结果,2012年其主导因子交互作用类型主要呈现出以第二地理本性要素与第三地理本性要素交互、第二地理本性要素与第一地理本性要素交互为主,其中第二地理本性要素占据主导地位。2014年和2017年其主导因子交互作用类型演变为以第三地理本性要素之间的交互、第三地理本性要素与第一地理本性要素交互为主,其中第三地理本性要素占据主导地位。值得注意的是,第一地理本性要素中的气温和降水因素在单因子探测中并不属于主要影响因子,然而在双因子交互作用中却发挥着比较重要的作用,表明该类因子主要通过与其他因子协同作用的方式影响着商业健身资源的集聚与演化,而地形地势因素则在交互作用中属于相对惰性的因子。具体来看,研究期间,双因子交互作用驱动力均强于单因子作用,交互作用类型表现为双因子增强和非线性增强两种效应并存,表明绝大多数因子之间是在交互作用下对商业健身资源集聚演化产生影响。中国商业健身资源双因子交互作用类型共有55组,限于篇幅,选取排名前10组的交互类型(表3),其中2012年各因子交互作用类型中城市规模和创新能力的解释力最高,q值为0.9246,气温和城市规模的解释力次之,q值为0.9178。2014年各因子交互作用类型中开放程度和信息化水平的解释力最高,q值为0.9464,其次为创新能力和开放程度的交互作用,q值为0.9225。2017年各因子交互作用类型中创新能力和开放程度的解释力最高,q值为0.9541,而开放程度和信息化水平的解释力次之,q值为0.9523,表明开放程度、创新能力和信息化水平不仅在单因子探测中属于解释力强的因子,在双因子交互作用中同样属于主导因素。
表3 2012—2017年中国商业健身资源集聚演化的因子交互作用探测
Tab. 3
| 序号 | 2012年 | 2014年 | 2017年 | |||||
|---|---|---|---|---|---|---|---|---|
| 交互因子 | q值 | 交互因子 | q值 | 交互因子 | q值 | |||
| 1 | x7∩x9 | 0.9246 | x10∩x11 | 0.9464 | x9∩x10 | 0.9541 | ||
| 2 | x2∩x7 | 0.9178 | x9∩x10 | 0.9225 | x10∩x11 | 0.9523 | ||
| 3 | x4∩x11 | 0.9076 | x2∩x7 | 0.9179 | x3∩x9 | 0.9366 | ||
| 4 | x6∩x7 | 0.9065 | x6∩x7 | 0.9009 | x7∩x10 | 0.9325 | ||
| 5 | x2∩x11 | 0.9052 | x6∩x10 | 0.8977 | x2∩x10 | 0.9313 | ||
| 6 | x3∩x9 | 0.8862 | x2∩x10 | 0.8917 | x2∩x9 | 0.9301 | ||
| 7 | x7∩x11 | 0.8819 | x3∩x10 | 0.8901 | x4∩x11 | 0.9272 | ||
| 8 | x3∩x7 | 0.8774 | x7∩x9 | 0.8887 | x2∩x11 | 0.9246 | ||
| 9 | x7∩x8 | 0.8716 | x2∩x9 | 0.8871 | x4∩x10 | 0.9238 | ||
| 10 | x2∩x9 | 0.8694 | x3∩x9 | 0.8865 | x3∩x11 | 0.9172 | ||
5.3 形成机理分析
通过在对影响商业健身资源集聚与演化的主要因子开展定量测度的基础上,进一步对地理本性视角下影响商业健身资源集聚格局的形成机理进行探讨(图5)。第一地理本性在商业健身资源集聚演化过程中发挥着基础控制作用。就单因子探测结果而言,以地形地势、气温和降水等自然条件为代表的第一地理本性要素的解释力最弱,这表明中国整体地形地貌、气温和降水等自然特征对商业健身资源的集聚演化起到一定的抑制作用,其影响了商业健身资源空间集聚的初始格局。相对而言,在交互因子探测中,第一地理本性中的气温和降水要素与第二、第三地理本性要素之间的交互作用对商业健身资源集聚演化的解释力较强,尤其是当第一地理本性中的气温和降水要素和第三地理本性要素交互作用时展现出更强的解释力,这意味着第二和第三地理本性要素的出现,减弱了第一地理本性带来的抑制作用。总而言之,商业健身资源的集聚与演化离不开自然因素的参与,地形、气温和降水等自然因素是商业健身资源集聚与演化的基底。
图5
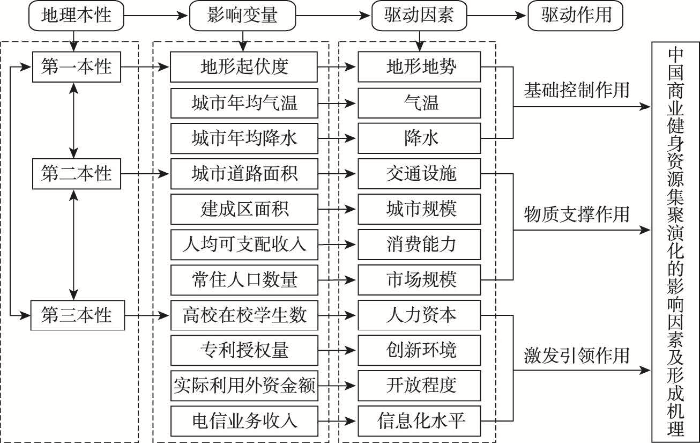
图5
中国商业健身资源集聚演化的影响因素与形成机理
Fig. 5
Influencing factors and formation mechanism of spatial agglomeration and evolution of commercial fitness resources in China
第二地理本性要素在商业健身资源集聚与演化中发挥着物质支撑作用。① 交通设施在居民与商业健身资源之间扮演着桥梁的连接支撑作用。交通可达性代表了居民到达商业健身资源所需要付出的时间成本,交通可达性的高低不仅影响着居民的出行效率,同样也影响着居民的出行意愿。因此,商业健身资源更倾向于在交通网络发展水平较高的城市内部集聚。② 市场规模在商业健身资源集聚演化中发挥着需求支撑作用。基于供需理论来看,商业健身资源和居民分别属于供给侧和需求侧,商业健身资源自身的盈利性质驱动其在市场需求潜力大的区域布局,在宏观尺度上主要表现为倾向于在人口规模较大的城市布局,微观尺度上主要倾向于在城市内部的住宅区附近开展区位选址[4]。因此,商业健身资源的集聚演化往往是主动与人口增长和流入的区域产生动态耦合的过程。③ 消费水平在商业健身资源集聚演化中发挥着经济支撑作用。消费者的可支配收入越高,表明其拥有更强的经济支付能力和支付意愿,往往具备更高的消费水平,区域消费能力和水平也影响着资源要素的流动方向,消费水平高的地区更能够满足商业健身资源的趋利性需求,进而对商业健身资源的集聚产生较强吸引力。④ 城市规模在商业健身资源集聚演化中发挥着综合支撑作用。城市规模是城市综合实力的体现,而城市综合实力是保障基础设施建设和资源有效供给的基础。同时,城市基础设施的建设和资源的有效供给则支撑了商业健身资源的集聚,可以说商业健身资源的集聚水平在一定程度上体现了该地区的综合发展水平。
第三地理本性要素在商业健身资源集聚演化过程中发挥着激发与引领作用。商业健身资源作为新兴资源要素,第三地理本性要素并不像第一和第二地理本性要素直接作用于商业健身资源的集聚演化,其更多是通过城市开放包容的文化理念、创新的社会氛围以及数字化的智能设施等新经济要素为商业健身资源的出现、集聚和关联等孕育良好的环境,更为其提供通畅的成长空间。因此,第三地理本性要素在商业健身资源发展初期发挥着激发作用,在其集聚演化过程中发挥着引领作用。① 人力资本和开放程度对商业健身资源的集聚演化发挥着理念引领作用。高学历人才一般拥有较高层次的消费理念、较强的文化资本以及经济资本,乐于尝试和接受新鲜事物,商业健身资源多层次和多样化的健身体验可以更好地满足其需求。开放程度表征了经济要素在国家或区域之间的自由流动程度,往往一个地区的开放程度越高,其在经济、文化等方面参与国际化交流的机会越多,居民对新兴资源要素的出现和发展展现出的包容理念就越强。② 信息化水平和城市创新能力对商业健身资源的集聚演化发挥着技术引领作用。国务院发布的《全民健身计划(2021—2025年)》指出,推进体育产业数字化转型,推动数字赋能全产业链协同转型。随着数字经济和人工智能等新经济形式的出现,企业的数字化和智能化水平是提升自身竞争力的必然要求,而城市创新能力是完成上述要求的必然条件。针对商业健身资源来说,顾客健身数据的记录、存储、监测、分析等功能的实现,以及智能健身场景的个性化搭建等技术迭代升级的背后是城市创新能力和信息基础设施建设水平的集中体现,因此城市信息化水平和创新能力对商业健身资源内在竞争力的提升发挥着技术引领作用。
虽然不同因子在商业健身资源空间集聚形成过程中发挥着不同的作用,以传统自然、经济社会要素为代表的第一和第二地理本性分别对商业健身资源集聚与演化起着基础控制和物质支撑作用,以新经济要素为代表的第三地理本性在商业健身资源集聚演化中发挥着激发与引领作用,但是在商业健身资源集聚演化的影响因子系统中,最终推动商业健身资源集聚演化系统运转的是多因素之间的协同作用。
6 结论与讨论
6.1 结论
本文将新兴地理数据和传统统计数据相结合,综合运用多种定量方法,从空间集聚和空间关联集聚两个方面研究中国商业健身资源集聚的格局演化,并采用地理探测器识别其关键因子及其交互作用。主要结论如下:
(1)中国商业健身资源集聚类型的城市数量结构逐步向“橄榄”型演变,空间集聚高值区呈现出以京广铁路(含高铁)与长江黄金水道为骨干的“十”字型廊道的空间格局形态与演化趋势,区域的中心城市在此格局中扮演重要角色,京广沿线城市经济发展和长江经济带则发挥着重要的支撑作用。未来随着京广沿线城市和长江经济带资源集聚能力的进一步提升,“十”字型格局的廊道形态在空间上将更加显著。同时,中国城市群地区是商业健身资源较高值区空间集聚的主体区域,自北向南主要在辽中南、京津冀、中原、山东半岛、长三角、海峡西岸以及粤港澳大湾区等城市群地区呈现出连片的集聚特征,其中沿海地区的城市群起着主导作用,尤其是在山东半岛和长三角城市群表现出更强的空间连片发展态势。
(2)中国商业健身资源冷热点区域的阶梯状分布特征较为明显,自东向西由热点区、次热点区逐步演替为次冷点区、冷点区,其中空间热点区域经历了由环渤海、长三角地区向华北、华中和华东地区扩张演化的过程,东北和西北地区的次热点区域具有跨越“胡焕庸线”并向西发展的态势,而且在时间演化上呈现逐渐加强的趋势,冷点和次冷点区域整体变化相对稳定,局部变化主要表现为广西东部和广东西部地区由冷点区演变为次冷点区。值得注意的是,热点分析下的成渝城市群地区属于冷点区,此现象与一般规律和认知有所不同,这表明成渝城市群内部区域差异显著,极化现象比较突出,城市之间的空间关联性相对较弱。
(3)中国商业健身资源的集聚演化是三大地理本性要素交互耦合作用下的结果,第一、第二和第三地理本性分别发挥着基础控制作用、物质支撑作用和激发引领作用。就单因子而言,第三地理本性要素中的开放程度、创新能力和信息化程度是影响中国商业健身资源集聚演化的主导因素,第二地理本性要素和第三地理本性要素中的人力资本在推动商业健身资源集聚演化中发挥着不同程度的促进作用,第一地理本性要素在商业健身资源集聚演化中发挥着基础性作用。就双因子交互作用而言,双因子交互作用类型以第三地理本性要素之间的交互、第三与第一地理本性要素交互为主,其中第三地理本性要素占据主导地位。需要注意的是,第一地理本性要素中的气温和降水因子在单因子探测中并不属于主要影响因子,然而在双因子交互作用中却起着比较重要的作用,表明该类因子主要通过与其他因子协同作用的方式影响着商业健身资源的集聚与演化。
6.2 讨论
随着时间的发展,虽然中国商业健身资源集聚类型的城市数量结构在逐步向“橄榄型”演变,但是商业健身资源在市场配置的引导下,依然存在一定的空间不均衡现象,难以满足欠发达地区居民对健康生活方式的迫切需求。商业健身资源的合理高效配置需要参考其集聚格局及演化,同时也应该对主导影响因素进行重点关注并调整优化。不同地区商业健身资源集聚演化和影响因素均具有异质性,需要综合各种因素交互作用,基于因地制宜的理念和措施缩小商业健身资源集聚的区域差异。综合考虑,未来在开展公共健身资源布局规划时,需要适当向内陆地区的非中心城市倾斜,使其与商业健身资源相互补充、相互配合,构建更为完善均衡和覆盖面更广的城市健身资源布局体系,同时更要注重乡村地区公共健身资源的布局,缩小城乡健身资源差异,防止居民对健康生活的向往与健康资源分布不平衡、不充分之间的矛盾升级。本文基于新兴地理数据与传统统计数据相结合的方式,综合运用多种定量分析方法对中国商业健身资源集聚的格局演化及其形成机理进行探究,是对商业健身资源在宏观尺度研究方面的一个补充和拓展,为推动“全民健身计划”的实施和“健康中国”战略的实现提供相应的借鉴参考。文章以下几个方面仍有待继续探讨:① 本文提出的“巴彦淖尔—湛江线”是在大数据支撑下,作为新兴资源要素的中国商业健身资源在空间关联集聚演化上呈现出的规律,其空间上呈现的平凉市节点以北区域跨越“胡焕庸线”的景观是次热点区集聚的现实表现,代表的是一种趋势。很显然,还需要更多的其他类型新兴资源要素空间规律进行验证。②“胡焕庸线”作为稳定的国情地理分界线,对国家发展战略具有极强的指导意义[52]。本文所提出的“巴彦淖尔—湛江线”可能是在“胡焕庸线”基本格局下,以商业健身资源为代表的新兴资源要素在空间关联集聚上呈现出的新表现。在未来研究中,一方面,将继续积累更多连续年份的“POI+”数据,同时持续关注其他类型新兴资源要素在全国尺度上的空间演化规律,以期进一步印证该线的存在可能。另一方面,新兴资源要素与其他地理要素之间的空间关联与耦合特征、传导效应等尚不明晰,“巴彦淖尔—湛江线”的发现及其稳定性,可能仍是一个假说,未来还需要更多针对性理论来阐释,需要更多相关实证研究来验证。
参考文献
Regional inequalities of residents' health level in China: 2003-2013
DOI:10.11821/dlxb201704010
[本文引用: 2]

As one of the core problems clsoely related with human development, health inequality has aroused an increasing concern in the world. Through an integration of the coefficient of variation, Theil index, exploratory spatial data analysis (ESDA) and spatial panel econometric model, we examine the regional inequality, spatial-temporal dynamic patterns and the key factors of the residents' health level (RHL) in China from 2003 to 2013. The aim is to provide scientific basis for policy making on regional health inequality reduction in China. The results are shown as follows: (1) China's RHL index decreased from 0.404 to 0.295 in 2003-2013, with an annual rate of 2.698%. Specifically speaking, the growing rate in the western region was higher than that in the eastern and central regions, but the there is no change in RHL in terms of the basic pattern which decreases from the east to central part then to the west. (2) The regional inequality of RHL presented an extending trend in 2003-2013. Among this, the RHL inequality between regions presented a reducing trend, but that within a region presented an expanding trend. And the growing rate of inequalities of RHL in the western region was higher than that of the eastern and central regions. (3) The spatial distribution of RHL has tended into the letter "T" shape, and the RHL presented a stepped decrease from the east to the central part then to the west and a symmetric decrease from the north to the central part then to the south. (4) By observing the change of Moran's I in 2003, 2008 and 2013, we found that the spatial agglomeration range of RHL presented a narrowing trend. All the hot spots and cold spots presented a shrinking tendency, the RHL in the west formed a stable cold spot, including Xinjiang, Qinghai and Xizang, but that in the east coastal area formed a stable hot spot, including Shandong, Henan, Qinghai, Hubei, Anhui, Jiangsu and Shanghai. (5) The selected explanatory variables, such as per capita GDP, per capita spending on health, urbanization level and environment quality, have significant direct impacts on the RHL in China. With the increase of per capita GDP, per capita spending on health and urbanization level and the improvement of environment quality, the RHL will be raised. Finally, this paper points out the attention should be focused on the research of the regional inequality of RHL, such as the problems of the residents' multi-time-domain, multi-scale and multi-influencing mechanism.
中国居民健康水平的区域差异: 2003—2013
DOI:10.11821/dlxb201704010
[本文引用: 2]
健康不公平作为影响人类发展的核心问题,已引起世界各国的广泛关注。基于变异系数、泰勒指数、空间自相关分析和空间面板计量模型,本文探讨了2003年以来中国居民健康水平的区域差异、时空变化及其关键影响因素,旨在为政府制定全民健康政策提供科学依据。结果发现:① 2003-2013年,中国居民健康水平提高26.98%,西部增幅高于东、中部,但始终保持着“东—中—西”阶梯式递减态势;② 中国居民健康水平的区域差异总体呈扩大趋势,其中地带间差异趋于缩小,地带内差异趋于扩大,西部地带内差异扩大尤为显著;③ 居民健康水平的空间分布转为明显的“T”字型格局,并呈“东—中—西”阶梯式及“北—中—南”对称式递减;④ 居民健康水平的空间集聚程度趋于减小,热点区与冷点区均呈收缩态势,且西部形成规模显著的稳定性冷点,东部沿海形成规模显著的稳定性热点;⑤ 人均GDP、人均公共医疗卫生支出、城市化水平及环境质量等因素对居民健康水平时空变化具有显著影响,随着人均GDP与人均公共医疗卫生支出的增加、城市化水平的提高及环境质量的改善,居民健康水平随之提高。未来,还需对居民健康水平的多时域、多尺度及多影响机制等问题开展深入研究。
Progress in urban health geography using complexity theory
复杂理论视角下城市健康地理学探析
Regional differences of quality medical resources in China based on different scales
基于不同尺度的中国优质医疗资源区域差异研究
Spatial pattern and its impact mechanism of urban commercial fitness space: Evidences from Shanghai, China
DOI:10.13249/j.cnki.sgs.2021.02.002
[本文引用: 4]
The reasonable layout of urban commercial fitness space and the identification of influencing factors are the basis for the sustainable development of urban fitness industry and the effective implementation of ‘Healthy China’ strategy. Based on POI (Point of Interest) data from Baidu and network evaluation data from Meituan, this article explores the spatial pattern and impact mechanism of commercial fitness space in Shanghai. The results show that: 1) The core-edge pattern of commercial fitness space is presented as a whole in Shanghai. A core agglomeration distribution area has been formed at the junction of Huangpu District, Jing’an District, Xuhui District, Changning District, Putuo District and Hongkou District, and there is no phenomenon of ‘hollow city center’. 2) The distribution of commercial fitness space keeps a high coincidence with the spatial distribution of high population density, high housing prices, developed transportation networks, residential area, office buildings and shopping centers in Shanghai. 3) Population density, underground distance, residential area distance, office building distance, chain situation and housing price level are the key factors affecting the spatial pattern. Population density has the greatest impact, followed by housing price level and office building distance, underground distance, residential area distance and chain situation are the smallest. Housing price level has negative impact, the remaining five have positive impact. Through the analysis of influencing mechanism, the paper is proposed to meet people’s growing demand for fitness, optimize urban commercial space, improve the quality of urban life, and help to achieve the national strategic goal of ‘Healthy China’.
城市商业型健身休闲场所空间格局及影响机理: 以上海市为例
DOI:10.13249/j.cnki.sgs.2021.02.002
[本文引用: 4]
基于百度POI和美团网评分数据,分析上海市商业型健身休闲场所空间格局及影响机理。结果显示:① 上海市商业型健身休闲场所整体呈现核心?边缘格局,黄浦区、静安区、徐汇区、长宁区、普陀区和虹口区的交界处形成了核心集聚分布区。② 上海市商业型健身休闲场所分布与高人口密度区、高房价地区、交通网络发达区、住宅小区、写字楼和购物中心等空间分布保持较高的契合度。③ 人口密度、地铁距离、小区距离、写字楼距离、连锁情况和房价水平等6个变量是影响空间格局的关键因素,人口密度影响最大,房价水平和写字楼距离其次,地铁距离、小区距离和连锁情况最小,房价水平为负向影响,其余为正向影响。分析影响机理,以期满足人们日益增长的健身休闲需求,优化城市商业空间,提升城市生活品质,助力实现“健康中国”国家战略目标。
The changing global economic landscape and China's potential growth rate and high quality development in the post epidemic era
全球经济大变局、中国潜在增长率与后疫情时期高质量发展
Research on supply and demand coordination and high quality development of sports fitness and leisure industry in the new era
新时代体育健身休闲业供需协调与高质量发展研究
The consumption of body-building and the construction of place in a metropolis
DOI:10.11821/xb201110003
[本文引用: 1]
How consumption restructures man-land relationship is becoming an important subject in human geography, with the coming of global consumption society. Western geographers began to study the connection between consumption practice and geography early in the 1990s, and today the research has already extended to the issues such as geographical imagination, place identity and space production, all of which could be reflected in consumption relationship. As a way of life under urbanization, consumption of body-building has become an important topic in the interdisciplinary field of body geography, space imagination and place construction. This paper analyzes how the actors translate body-building by some qualitative methods, on the basis of place theory of constructivism and actor network theory. The authors believe that the actors' consumption relationship socially constructed a "healthy paradise", which is geographically imagined, and the consumption imagination is highly connected with the stability of discourse power. Geographical space produces both functional consumption relationship and node-typical man-land relationship, and the latter imaginatively embeds local consumption relationship into global consumptive cultural network, which then links and extends local man-land relationship into globalization. By the way of body practice, the consumption relationship of body-building under actor network reconstructs micro-location into a place with multiple levels. Compared with traditional dualistic man-land relationship, the man-land relationship constructed by consumption of body-building is manifold. Here, place is a crucial node where reality is mixed with virtual world, and locality is intersected with global world. Therefore, place has the function of representation for social discourse. The conclusion indicates that a kind of manifold-and-node man-land relationship could be found in geographic micro-location. From the perspective of consumption geography, this paper explores the relationship between place construction and fitness club as a micro-location in a shopping mall, and also contributes to the research on shopping malls.
大城市健身消费与地方建构
Fashion cultures: Theories, explorations and analysis
DOI:10.1016/S0037-0738(00)00004-X URL [本文引用: 1]
Environmental characteristics influences on physical activity among overweight adolescents: Urban neighbourhood parks
DOI:10.1016/j.sbspro.2014.10.073 URL [本文引用: 1]
Gender differences in physical activity motivators and context preferences: A population-based study in people in their sixties
Fitness facilities still lack accessibility for people with disabilities
DOI:S1936-6574(16)30186-8
PMID:28143707
[本文引用: 1]
Fitness facilities have potential to serve as places of 'health enhancement' for many underserved populations, particularly among people with physical/mobility disabilities where walking outdoors to meet recommendations for regular physical activity is not an option due to mobility or safety issues.To examine the accessibility and usability of fitness facilities across the U.S. from a broader framework of physical and program access.A convenience sample of 227 fitness facilities in 10 states were assessed by trained evaluators using the Accessibility Instrument Measuring Fitness and Recreation Environments (AIMFREE) tool. Non-parametric tests were performed to determine whether AIMFREE section scores were different by geographic region (urban, suburban), business type (nonprofit, for-profit), facility affiliation (fitness center/health club, park district/community center, hospital/rehabilitation facility, university/college), and facility construction date (pre/post passage of the Americans with Disabilities Act, ADA). Raw scores were converted to scaled scores with higher scores indicating better accessibility based on a criterion-referenced approach.Section scale scores (11/13) were low (<70) with differences found across facility affiliation. While facilities built after passage of the ADA had higher accessibility scores compared to pre-ADA facilities, only programs and water fountains had scaled scores ≥70 regardless of facility construction date.There exists a strong and urgent need to encourage owners and operators of fitness facilities to reach a higher level of accessibility. Until then, many people with physical/mobility disabilities will continue to have limited access to programs, equipment, and services offered at these facilities.Copyright © 2016 The Author(s). Published by Elsevier Inc. All rights reserved.
The social equity of urban service distribution: An exploration of park access in Pueblo, Colorado, Macon and Georgia
DOI:10.2747/0272-3638.18.6.521 URL [本文引用: 1]
Assessing spatial equity: An evaluation of measures of accessibility to public playgrounds
DOI:10.1068/a300595
URL
[本文引用: 1]
Geographical and political research on urban service delivery—who benefits and why—has proliferated during the past two decades. Overall, this literature is not characterized by a particular attention to the importance of method in drawing conclusions about spatial equity based on empirical studies. Specifically, there has been scant interest in the effect of geographic methodology on assessing the relationship between access and socioeconomic characteristics that are spatially defined. In this paper we take a spatial analytical perspective to evaluate the importance of methodology in assessing whether or not, or to what degree the distribution of urban public services is equitable. We approach this issue by means of an empirical case study of the spatial distribution of playgrounds in Tulsa, Oklahoma, relative to that of the targeted constituencies (children) and other socioeconomic indicators. In addition to the ‘traditional’ measure (count of facilities in an areal unit), we consider a potential measure (based on the gravity model), average travel distance, and distance to the nearest playground as indicators of accessibility. We find significant differences between the spatial patterns in these measures that are suggested by local indicators of spatial association and other techniques of exploratory spatial data analysis. The choice of access measure not only implies a particular treatment of spatial externalities but also affects conclusions about the existence of spatial mismatch and inequity.
Beyond economic impact: An alternative rationale for the public subsidy of major league sports facilities
DOI:10.1123/jsm.18.1.40
URL
[本文引用: 1]
Government contributions to the funding of major league facilities ipso facto recognize that some portion of the benefits accruing from such facilities accrue to the public in general, rather than being captured exclusively by the franchise owner. The challenge for facility advocates is to demonstrate the return on investment to the taxpayer. This has been elusive. The canard that substantial returns accrue from the direct economic impact of visitors to games has been discredited. A taxonomy of four alternate sources of spillover benefits that are most frequently cited is proposed: increased community visibility; enhanced community image; stimulation of other development; and psychic income. Justifications using to the first three of these alternates are conceptualized as focusing on external audiences, with the intent of encouraging their investment of resources in the community. In some contexts, some economic benefits may accrue from these sources, but in most cases they cannot be demonstrated to be sufficient to justify the taxpayers’ investment. It is argued that psychic income, which focuses internally on the benefits received by existing residents in the community, is likely to be key to justifying public subsidy of major league facilities. It is suggested that the contingency valuation method is an appropriate approach for measuring the psychic income provided by a professional sport franchise.
Changing intra-urban location patterns of major league sports facilities
DOI:10.1111/0033-0124.00209 URL [本文引用: 1]
The distribution of urban public services: The case of parks and recreational services in Ankara
DOI:10.1016/S0264-2751(97)00026-7 URL [本文引用: 1]
Research on facilities location planning of community sports
社区公共体育设施选址规划研究
A study of systematical simulation on the coupling between urban public sports facility layout and residents' leisure sports living space
城市公共体育设施布局与居民休闲体育生活空间耦合的系统仿真研究
Study on the residents' requirement for fitness and ecological construction of sports resources under the Healthy China project
“健康中国”背景下居民健身需求与生态体育资源建设的影响研究
GIS-based spatial accessibility and equity evaluation of urban public sports facilities in Shanghai
基于GIS的上海市公共体育设施空间可达性与公平性评价
Optimizing the distribution of community sports service facilities based on GIS
基于GIS的社区体育服务设施布局优化研究
Spatial characteristics, pattern and influencing factors of fitness spaces in Changchun city
长春市健身空间的演变特征、类型与影响因素
Sports facility and its layout for residents' needs
居民需求导向的公共体育设施选择与空间布局
Measuring spatial accessibility to physical activity spaces in Hangzhou using 2SFCA method
基于2SFCA法的杭州体育活力空间可达性评价
A research on the satisfaction to the gym membership services based on consumption motives
基于消费动机的商业健身俱乐部会员服务满意度研究
Study on the characteristics of spatial temporal distribution and formation mechanism of residents physical fitness behaviors in the commercial physical fitness places: A case study of central city district of Nanjing
商业健身场所居民健身行为的时空特征及形成机制研究: 以南京市中心城区为例
Construction of the market system of body building clubs consideration on the investigation of the current situation of Ningbo body building clubs
健身俱乐部市场体系之构建: 基于宁波市经营性健身俱乐部现状调研的思考
Study on the management and sales promotion of commercial gymnasiums
营业性健身房经营与促销问题的研究
Spatial pattern of health clubs in Beijing at various scales
DOI:10.11820/dlkxjz.2010.02.015
[本文引用: 1]
<p>The research target is the health club, which is a special type of the recreation space in a city. Based on GIS and geostatistical software, using point pattern identification and ESDA(exploratory spatial data analysis) methods, the paper analyzes the spatial pattern characteristics of health clubs in Beijing. The nearest neighbor indicator(NNI) and quadrat analysis results indicate that the health clubs cluster together evidently at a whole region scale. But if we observe the pattern in the units separated by the roads or district, it presents different spatial patterns, varying from clustering to random, even dispersing. The analyzing results of health clubs based on the 5 scale cell units from 1 km to 5 km grids make further explanation that its spatial pattern are influenced evidently by the units’ scale. At any scales the density and NNI of health club samples have evident spatial diversification. From the Moran’s I statistics and Moran Scatterplot Map we also find the evident spatial autocorrelation of the units. The 2 km and 3 km unit scales are the best scales for finding the microscopic spatial pattern and diversification. So the whole region scale is not the only or the best scale for spatial pattern research of recreation spaces especially for the health clubs. In some microscopic units the spatial pattern will be more evident and the research results will even be opposite to that at the whole region scale. The pattern description based on more statistical units at various scales may discover the points’ distributional characteristics and the patterns more easily. The spatial pattern research of health club points in units at various scales provides a new way of describing spatial patterns of recreation space points. And the effects of such a way are also demonstrated in this paper.</p>
北京市健身俱乐部多尺度空间格局
Spatial distribution and its influential factors of commercial fitness clubs in Guangzhou
DOI:10.13284/j.cnki.rddl.002979
[本文引用: 2]
<p>As a fast-growing industry in recent years, commercial fitness clubs have become significant parts of consumer services industries. However, relatively few studies on the spatial distribution of commercial fitness clubs in a city have been conducted at the street and town level. In addition, there are few studies on factors influencing the spatial distribution of commercial fitness clubs by quantitative analysis methods. To make up for this deficiency, this paper analyzed the spatial distribution of commercial fitness clubs utilizing the methods of GIS spatial analysis and spatial auto-correlation on the basis of POI data of 743 commercial fitness clubs, 136 subway stations and 6 013 residential neighborhoods in Guangzhou City collected from online map. Furthermore, spatial lag model (SLM) has been adopted to explore the influential factors of the spatial distribution of commercial fitness clubs in Guangzhou based on the latest demographic and housing-related data from the 6th population census in 2010 in Guangzhou. The results show: 1) The spatial distribution of commercial fitness clubs in Guangzhou is unbalanced and its quantity decreases generally from the central urban area to surrounding regions where small clusters exist as well, which shows a “center circle + peripheral group” structure. Specifically, 70.52% of the commercial fitness clubs are located in the central urban area, and the rest 29.48% which are located in the surrounding regions mostly gather in central towns. There is significant spatial agglomeration and correlation of commercial fitness clubs in Guangzhou. 2) Only a few commercial fitness clubs are located along main roads or near subway stations, while most of the commercial fitness clubs, accounting for 94.21%, are located near residential neighborhoods. That is to say, the distribution along city roads and subway stations is not obvious, but obvious near residential neighborhoods. 3) With regard to the influential factors on the spatial distribution of commercial fitness clubs, population scale and educational level play more important roles than location factors and community features. Both of these two demographic characteristics have positive impact on the quantity of commercial fitness clubs in townships. This result proves that market is a significant factor influencing the spatial distribution of consumer services industries. In this paper, it is found that the location factor is not a key factor affecting the spatial distribution of commercial fitness clubs in Guangzhou, which is different from previous views that location factors, especially traffic location, have essential effects on the spatial distribution of consumer services industries. The findings in this paper would enrich the research on spatial distribution of consumer services industries.</p>
广州市商业型健身房空间分布及其影响因素
Spatial layout evolution of urban commercial gymnasium and its influencing factors: A case study of Harbin city
哈尔滨市商业型健身房的空间演变及其影响因素
Qualitative research on the stratification of urban women's participation in sport
中国城市女性体育参与分层现象的质性研究
A study on sports participation of middle-class women in urban China
中国城市中产阶层妇女的体育参与研究
Scale and economic geography inquiry
经济地理学研究中的尺度问题
Tourism system adaptability analysis of coastal cities based on geographical natures
DOI:10.18402/resci.2022.03.16
[本文引用: 1]
Geographical nature refers to the essential characteristics of a region. From Krugman's geographical nature to the three major geographical natures, the location factor reflects the regional characteristics of the information age more comprehensively. The study integrates the active elements into the framework of geographical nature analysis, and builds a new coastal city tourism system adaptability evaluation index system. This paper evaluates the tourism systems adaptability of 14 coastal cities in 2006, 2011 and 2016, and proposes classification improvement strategies. The research results show that: (1) The adaptability index of tourism system in 14 coastal cities has been improved, but the growth rate has slowed down. The adaptability index of Zhoushan, Xiamen and Qingdao increased significantly, Dalian, Sanya, Qinhuangdao, Guangzhou, Shanghai and Lianyungang increased rapidly, while Beihai, Tianjin, Ningbo, Shenzhen and Yantai grew slowly. (2) The adaptability index of tourism system in different cities has obvious difference. For the three major elements of geographical nature, the first nature has the greatest influence on most coastal cities. The third nature has a greater influence than the second nature on more than half of the cities. Fully reflecting the tourism resources is the fundamental support for the coastal city tourism system adaptability, and soft power such as innovation factors is becoming a new driving force for the growth of adaptability. (3) From the view of adaptability structure, it can be divided into three types according to the leading role of three natures. When the first nature adaptability is short, we should pay more attention to the sustainable utilization and protection of tourism resources, improve the quality of tourism products and enrich the tourism routes. When the second nature adaptability is short, we need to optimize the tourism business environment and enhance the level of tourism services. When the third nature adaptability is short, we should pay more attention to digital, information and other innovative elements, develop new tourism industry form, and enhance the vitality of tourism development. In the future, we should promote the organic integration of regional resources, make up the short board of adaptability, and enable the sustainable development of tourism in coastal cities.
基于地理本性的滨海城市旅游系统适应性分析
DOI:10.18402/resci.2022.03.16
[本文引用: 1]
地理本性是指一个区域区别于其他区域的、在地理空间上的本质特征。从Krugman的两大地理本性到中国学者提出的三大地理本性,区位要素更全面地体现了信息时代的区域特性。本文将流动空间的活跃要素融入地理本性分析框架中,构建全新的滨海城市旅游系统适应性评价指标体系,对2006、2011和2016年3个年份的14个滨海城市旅游系统适应性进行全面评价并提出分类提升建议。结果表明:①14个滨海城市旅游系统适应性均呈现增强趋势,但适应性指数增速趋缓。舟山、厦门、青岛适应性指数大幅增长,大连、三亚、秦皇岛、广州、上海、连云港增长较为明显,北海、天津、宁波、深圳、烟台增长缓慢。②各城市旅游系统适应性指数具有明显差异性。三大地理本性要素中,对多数滨海城市而言,第一本性对旅游系统适应性影响最大,第二本性影响程度降低,第三本性影响程度扩大,充分反映旅游资源禀赋是滨海城市旅游系统适应性的根本支撑,创新要素等软实力正在成为适应能力增长的新动能。③基于旅游系统适应性结构可将滨海城市分为3类。第一本性适应能力存在短板时,需重点关注旅游资源的可持续利用与保护,围绕资源特性提升旅游产品品质、丰富旅游线路;第二本性存在短板时则需完善旅游系统配套、优化营商环境,提升旅游服务水平;第三本性存在短板时则需更重视数字化、信息化等创新要素对旅游系统的助推,大力开发旅游新兴业态,增强旅游发展活力。未来应统筹推进区域资源有机整合,补齐适应性短板,为滨海旅游可持续发展赋能。
First nature, second nature, and metropolitan location
DOI:10.1111/jors.1993.33.issue-2 URL [本文引用: 1]
Research on geographical elements of economic difference in China
DOI:10.11821/yj2009020017
[本文引用: 2]
<p>Much research has been done on the effect of geographical elements on economic difference throughout the world. Furthermore, based on the theory of two nature of metropolitan location proposed by Krugman, as well as the theory of human-land relationship and comparative advantages, this paper presents three geographical elements that affect economic differences. The first geographical element includes natural environment, i.e., elevation, slope, undulating topography, human climate index, water resource index, and potential agricultural production; the second consists of traffic and location, which are represented by transport facilitation and economic position respectively; and the third contains human capital and R&D level, respectively represented by years of schooling and the number of patents. Supported by Arcgis 9.0 software, this paper, through modeling, analyzes the impact of various geographical elements on economic difference within the whole country and three major regions. The result shows that the geographical environment plays an increasingly important role in economic development. In addition, it extends the knowledge of Sachs et al. about geographical elements of economic development. At present, China's economy is in transition. Among all geographical elements, the great one affecting economic difference is transport facilities index, reaching 0.374. So more capital should be injected in infrastructure construction in the future.</p>
中国区域经济差异形成的三次地理要素
Evolution of land differentiation in Chinese mainland
DOI:10.11821/yj2012120001
[本文引用: 2]
In this paper,on the basis of three natures which determine Chinese spatial heterogeneity, further analysis of the role of three natures on the regional development and evolution is done in the point of view of evolutionary economic geography.The first nature which determines the spatial lock of Chinese agriculture-the Line of Qinling Mountain-Huaihe River and the Great Wall plays a leading role in the first industrial revolution(Agricultural Revolution).When times transferred from the agricultural society to industrial society,the second nature composed of transportation and infrastructure increasingly contributed to the regional economic development. The original spatial lock was broken.The central cities locked the basic spatial structure.Center- Hinterland structure can be found in the region.The third nature promotes regional structural variation.The structure of Hub-Network is created.The path dependence of three natures can be observed significantly,which means the second nature is initially driven by the first nature,and the third nature is initially driven by the first and second natures.In the process of regional evolution, Hu Huanyong Line,which is a famous geographical boundary in China,has not been broken.The Hu Huanyong Line has become the basic lock of regional development in China.
中国大陆空间结构分异的进化
Spatial-temporal evolution of factors aggregating ability in urban agglomeration in the middle reaches of the Yangtze River
DOI:10.11821/dlxb201710002
[本文引用: 1]
Due to China's rapid urbanization and industrialization, the demand for resource factors is surging. Competition for such factors between cities and regions has given us a severe challenge to increase our ability to aggregate resource factors. This paper conducted an in-depth analysis of 20 years (1995-2014) of spatial-temporal evolution of the factor aggregating ability in the urban agglomeration in the middle reaches of the Yangtze River (UAMRYR). Analytical results highlighted that: (1) From 1995-2014, the comprehensive factor aggregating ability in this region had been on an increase despite fluctuation, ranking fourth nationwide. The differential factor aggregating ability between cities within this region had been basically balanced while fluctuating. At the same time, the distribution of such resource factors as science and technology innovation, finance, and the opening strategy, had tended to be concentrated along the middle reaches of the Yangtze River. (2) During this period, the factor agglomeration pattern of UAMRYR formed a multi-center "core-periphery" structure, with core cities such as Wuhan, Changsha and Nanchang, and there is no significant change on the spatial pattern. In general, the factor agglomeration pattern was still in the primary stage of the urban polarization for central cities, the integrated factor agglomeration has not yet formed. (3) The factor aggregating patterns in UAMRYR tended to be decentralized. As the primate city, Wuhan had a low factor aggregating primacy. The factor agglomeration placed emphasis on moving the pathway of "northwest-southeast" in UAMRYR. There were significant disparities on agglomeration patterns for various factors, while most factors presented agglomeration to central cities.
长江中游城市群要素集聚能力的时空演变
DOI:10.11821/dlxb201710002
[本文引用: 1]
随着城市化和工业化的快速推进,对资源要素的需求量大增,城市和区域间对要素的争夺不断加剧,强化自身要素集聚能力成为各城市和区域面临的紧迫挑战。以长江中游城市群为研究对象,对1995-2014年20年间长江中游城市群要素集聚能力的时空演变特征进行研究。结果表明:① 1995-2014年,长江中游城市群要素综合集聚能力在波动中保持增长,在全国处于第四极地位;城市群内城际要素集聚能力差异在波动中保持平衡;科技创新、金融、对外开放等要素更趋向于集聚分布。② 1995-2014年,长江中游城市群要素集聚格局形成了以武汉、长沙、南昌等核心城市为主导的多中心“核心—边缘”结构,空间格局变化较小;其要素集聚格局仍处于初级的中心城市极化发展阶段,一体化的要素集聚组合体尚未形成。③ 长江中游城市群要素集聚格局较为分散,首位城市武汉在整个城市群的要素集聚首位度较低;要素集聚重心跃迁路径沿“西北—东南”整体走向进行往复迁徙;各类要素集聚格局演化分异显著,大部分要素集聚格局呈中心城市指向特征。
Geographic effects and agglomeration evolution: A data-mining analysis
DOI:10.11820/dlkxjz.2009.06.004
[本文引用: 1]
Economic agglomeration is a common geographical phenomenon in the industrial society. It occurs in different scale of geography, and has a variety of spatial structures. There are two opinions about the geographical effects on urban evolution. One is to believe that geography plays an important role in the formation and development of cities. The other is to view the economies of agglomeration as the driving factor, where geography simply determines urban locations. To explore the opinions mentioned above, this paper uses the data mining techniques to examine the relationships between urban location and geography in the formation and development of agglomeration. It can be found that the emergence of industrial agglomeration is more influenced by the first-nature geography than by the second-nature geography, but the first-and-a-half-nature geography and second-nature geography as well largely influence the development of economic agglomeration.
地理作用和集聚演化: 基于数据挖掘的分析
Research on the spatial pattern of population agglomeration and dispersion in China
DOI:10.11820/dlkxjz.2010.10.003
[本文引用: 1]
<p>Population agglomeration and dispersion are the most direct and the most concentrated expression of population spatial distribution pattern. The research on population agglomeration and dispersion spatial pattern and its formation mechanisms in a specific region will not only help to reveal the population agglomeration and dispersion in the region of the inherent law itself, but also benefit the study of the overall regional population spatial pattern, and even further, the study of regional economy agglomeration and urbanization. With the largest population and significant difference in regional natural condition and economy, China’s population agglomeration and dispersion, in terms of not only the size but also complexity, are not comparable in the world. Thereby, research on the spatial pattern of China’s population agglomeration and dispersion, which will contribute to grasping the essence of China’s population spatial distribution pattern, is of great significance in both academy and practice. The article chose the classification evaluation of population agglomeration, which classified China into many population agglomeration types of different levels according to their population centralization index, and then, discussed them in each type. Based on this and the comprehensive consideration on the spatial distribution pattern of China’s population, natural conditions, human environment suitability and economic development, the article generalized the spatial pattern of China’s population agglomeration and dispersion.</p>
基于人口集聚度的中国人口集疏格局
DOI:10.11820/dlkxjz.2010.10.003
[本文引用: 1]
人口集聚和疏散是人口空间分布格局最直观和最集中的体现,研究一个地区人口集疏的空间格局,不仅可以揭示该地区人口集疏的内在规律,也有利于深入研究该地区的整体人口分布的态势和规律,更能够体现出区域内经济格局以及城市化格局的发展。基于人口集聚度的中国人口集疏空间格局的研究,有助于准确把握中国人口空间分布的基本脉络,具有一定的学术价值和实践意义。本研究采用了人口集聚度分级评价的方法,依据人口集聚度的不同,将各个地区划分为不同等级的人口集聚区,并对其分别讨论。在此基础上,结合中国人口分布格局、自然条件空间格局、人居环境自然适宜性评价结果以及经济发展格局和城市化格局,对中国的人口集疏的空间格局进行了归纳,得出了中国人口分布“西疏东密”的传统空间格局突出,人口集聚以平原地区为依托并呈现“沿海、沿江、沿线”高度集聚的特征的结论。
Spatial evolution characteristics and driving forces of Chinese highly educated talents
DOI:10.11821/dlxb202102006
[本文引用: 1]
Talents are the core driving force for regional innovation and development, and they are also the key to urban competition in the future. Based on the data of the sixth population census and the national 1% population sampling survey in 2015, this paper uses the concentration index (CI), Gini index (GI) and several related spatial analysis methods to examine the spatial patterns of highly educated talents across China and the drivers behind these patterns from 2010 to 2015. The results are as follows: (1) Talents show highly concentrated and unbalanced spatial distribution patterns at the city level over the five years, but the trend of concentration and imbalance has gradually eased. Results from standard deviation ellipse (SDE) indicate that the distribution direction of highly educated people is "NE-SW". Furthermore, there is a significant spatial spillover effect in the distribution of talents, with three major urban agglomerations of China as the highlands. (2) Economic opportunities are the dominant drivers for the distribution of highly educated talents in China. Among them, wages are the core driver, and gross GDP and industrial structure of each city also exert a significant impact. (3) After controlling the impacts of economic opportunities, local quality variables represented by basic public services (e.g., education and medical care), transportation accessibility and urban consumption facilities play an important role in the distribution of highly educated talents. (4) There are significant differences between the driving factors for talents in urban agglomerations and non-urban agglomerations: economic opportunities are the main driving force for the distribution of talents in both urban agglomerations and non-urban agglomerations, while local qualities including education, consumption, transportation and natural environment have a more significant impact on the distribution of talents in urban agglomerations. This study provides references for the formulation of urban and regional talent policies and regional development policies.
中国高学历人才的空间演化特征及驱动因素
DOI:10.11821/dlxb202102006
[本文引用: 1]
人才是推动地区创新发展的核心动力,也是未来城市竞争的关键。基于第六次全国人口普查和2015年全国1%人口抽样调查数据,运用集聚度、基尼系数等空间统计分析以及负二项回归模型方法,对2010—2015年中国城市高学历人才的空间演化特征及驱动因素展开研究。结果发现:① 人才呈现出高度集中且不平衡的空间分布格局,但不平衡的趋势有所缓解,分布方向为“东北—西南”走向。人才分布的空间溢出效应显著,城市群是人才集聚的高地。② 经济机会是影响中国高学历人才集聚的主导力量,其中工资是核心驱动因素,地区的发展水平、产业结构同样产生显著影响。③ 控制经济机会的影响后,以教育和医疗等基础公共服务、交通可达性和城市消费设施为核心的地方品质变量在高学历人才的空间集聚过程中发挥重要作用。④ 城市群与非城市群人才驱动因素存在显著差异:经济机会是城市群和非城市群人才集聚的主要驱动力;教育、消费、交通以及自然环境等地方品质变量对城市群人才集聚的影响更为显著。本研究为城市和区域人才政策和区域发展政策的制定提供借鉴与参考。
Pattern evolution and its contributory factor of cold spots and hot spots of economic development in Beijing-Tianjin-Hebei region
DOI:10.11821/dlyj201701008
[本文引用: 1]
The rapid and imbalanced economic development in the Beijing-Tianjin-Hebei region has widened the gap between Beijing-Tianjin and surrounding areas since the 1990s, therefore, it is an important social consensus to achieve coordinated development. In this paper, we analyzed the imbalanced economic development in the Beijing-Tianjin-Hebei region by proposing a GDP Index using the DMSP/OLS nighttime light data to represent the regional economic development. Then the Getis-Ord General G, Global Moran's I and Optimized Hot Spot Analysis were applied to qualify the spatial pattern of the GDP Index. Third, Space Time Pattern Mining, Spatial Lag Model (SLM) and Spatial Error Model (SEM) were employed to identify the dynamics of the spatial pattern and evaluate the effects of four factors, which were natural environment (elevation and gradient), infrastructure (road network), policy (land use cover) and administrative division (urban or rural area), to the imbalance in the economy, respectively. Results show that: (1) the study area can be divided into three groups based on the level of economic development: urban Beijing-Tianjin, rural Beijing-Tianjin and urban Hebei, and rural Hebei. And there are two economic development gaps caused by Siphon Effect between urban and rural Beijing-Tianjin, and Beijing-Tianjin and Hebei, which is different from the previous view that only one economic development gap between Beijing-Tianjin and Hebei. (2) The dynamics of spatial pattern of economic development are mainly constant hot spot, fluctuant hot spot and fluctuant cold spot. The degree of hot spot, which is mostly in Beijing-Tianjin, decreases from urban center to rural area as concentric circles. In contrast, the majority of cold spots, which have no obvious ring structure, are located in rural Hebei. (3) The economic development in the Beijing-Tianjin-Hebei region has non-linear relationship with natural environment, infrastructure, policy and administrative division. In the hot spot region where the economy is more developed, all four factors, especially infrastructure, policy and administrative division, are positively correlated with economic development. However, high gradient, insufficient infrastructure and improper policy limit the economic development in the place with less developed economy, i.e. the cold spot region. This research may be helpful to understand the process and current conditions of economic development in the Beijing-Tianjin-Hebei region, and useful to realize coordinated development in this region.
京津冀地区经济发展冷热点格局演化及其影响因素
DOI:10.11821/dlyj201701008
[本文引用: 1]
为了探讨京津冀地区经济发展失衡,引入DMSP/OLS夜间灯光构建GDP指数,利用优化的热点分析和时空模式挖掘识别经济发展的格局演化,以SLM和SEM模型从自然环境、基础设施及区域开发等方面量化失衡因素。结果表明:① 区域经济发展趋于波动性集聚,经济发展呈明显的京津市区、京津郊区和河北区县城区、河北偏远县乡等3种类型,而京津市区和郊区之间、京津市域和河北省域之间都存在显著的“虹吸效应”所诱发的发展断崖。② 持续的热点、振荡的热点和振荡的冷点是经济发展冷热点的主要演化模式。经济发展热点自中心城区至远郊呈同心圆圈层式弱化,而无明显圈层变化的冷点集中连片地广布在河北乡村。③ 经济发展与自然环境、基础设施和区域开发有复杂非线性关系,经济发展繁荣地区(热点)多受惠于基础设施和区域开发及行政区划的整体优势,而合适的海拔条件次之。经济发展落后地区(冷点)总体受制于坡度条件和基础设施及区域开发的总体劣势。
Distribution characteristics and influencing factors of commercial center and hotspots based on big data: A case of the main urban area of Urumqi city
DOI:10.18306/dlkxjz.2020.05.004
[本文引用: 1]
<p id="C5">The structure of commercial space is vital to the vitality of cities, therefore it is essential to quantitatively identify and analyze the distribution of different types of commercial sites so as to optimize the configuration of commercial resources and facilitate the orderly development of cities. Taking the main urban area of Urumqi City as the case study area, using 136975 business-related points of interest (POIs) including six types of businesses in 2018 and open street map (OSM) road network, and based on head/tail division rule, this study identified high-density commercial parcels and used kernel density estimation to estimate the core region of business activities. The Getis-Ord <i>G</i> <sup>*</sup> method was used to identify the overall and different types of commercial hot spot areas. Geographic detector analysis was performed to explore the determinants of overall and different types of commercial site distribution in Urumqi, and Pearson correlation coefficient matrix of commercial sites was established to estimate the impact of the combination and coordination of business forms on commercial space. The findings of this study suggest that the key features of high-density commercial parcel distribution are central-peripheral, separated by highways and internal loops; the number of high value parcels from the center to the peripheral area reduces progressively; and the distribution of the six types of commercial sites varies. Commercial zone presents multi-core distribution characteristics, the agglomeration characteristic is apparent in the urban center region, and the northern commercial agglomeration is gradually becoming obvious. There are six main commercial centers including Nanhu, Zhongshan Road, Youhao, Huizhan Center, Midong New Area, and Tieluju. Tuwu Expressway and Wukui Expressway together constitute the two axes of commercial hotspots. Hotspots of the six types of commercial sites can be divided into three spatial structures. Business and finance show a single-center distribution trend; accommodation and food & restraurant are of banded extension type; while services and shopping spots are of banded dual-core type. The primary determinants of the spatial distribution of commercial sites are: land price, agglomeration effect, and road network density. The influence of population and central accessibility is secondary; elevation has no significant effect. In particular, for business and financial services, land price and center accessibility are the main factors affecting the distribution. Accommodation and food & restraurant are affected by road network density. Shopping and services are significantly affected by population density. Business and finance sites, food & restraurant and shopping sites all have strong synergistic effects on the formation of urban commercial space, while others are not significance. </p>
大数据视角下的商业中心和热点区分布特征及其影响因素分析: 以乌鲁木齐主城区为例
DOI:10.18306/dlkxjz.2020.05.004
[本文引用: 1]
商业空间结构是城市经济活动的重要载体,识别商业中心和商业热点区以及探究其影响因素对于商业资源优化配置显得尤为必要,进而指导城市有序发展。论文以乌鲁木齐主城区为例,利用开放平台大数据兴趣点(point of interest, POI),采用地理学空间统计方法定量识别商业中心和商业热点区,对商业分布和空间集聚特征进行分类和解读,并利用地理探测器方法探寻其影响因素。主要结论如下:① 乌鲁木齐市商业高值区分布在吐乌大高速—和平渠沿线地带,大型商业中心主要有南湖商圈、中山路商圈、友好商圈、会展商圈、米东商圈、铁路局商圈。② 商业热点区呈现“T型”双轴分布,北部新城商业地带与南部传统商业地带共同构成乌鲁木齐市最具活力的商业地带;6类商业热点区的分布可归纳为3种类型,商务和金融服务类为单一点状型,住宿和餐饮服务类为带状延伸型,生活与购物服务类为带状双核型。③地价、集聚效应、路网密度等是影响商业宏观分布的主要因素,其次为人口密度和中心可达性,自然因素如高程、地形起伏度等对商业布局影响有限;各因素对不同类型商业业态的影响程度各异,如人口密度、路网密度对购物类影响较大,中心可达性和地价对于商务、金融类影响较大;就各业态类型网点间的关系而言,商务和金融类协同作用强,餐饮与购物类协同效应较强,共同影响城市商业空间。
Geodetector: Principle and prospective
DOI:10.11821/dlxb201701010
[本文引用: 1]
Spatial stratified heterogeneity is the spatial expression of natural and socio-economic process, which is an important approach for human to recognize nature since Aristotle. Geodetector is a new statistical method to detect spatial stratified heterogeneity and reveal the driving factors behind it. This method with no linear hypothesis has elegant form and definite physical meaning. Here is the basic idea behind Geodetector: assuming that the study area is divided into several subareas. The study area is characterized by spatial stratified heterogeneity if the sum of the variance of subareas is less than the regional total variance; and if the spatial distribution of the two variables tends to be consistent, there is statistical correlation between them. Q-statistic in Geodetector has already been applied in many fields of natural and social sciences which can be used to measure spatial stratified heterogeneity, detect explanatory factors and analyze the interactive relationship between variables. In this paper, the authors will illustrate the principle of Geodetector and summarize the characteristics and applications in order to facilitate the using of Geodetector and help readers to recognize, mine and utilize spatial stratified heterogeneity.
地理探测器: 原理与展望
DOI:10.11821/dlxb201701010
[本文引用: 1]
空间分异是自然和社会经济过程的空间表现,也是自亚里士多德以来人类认识自然的重要途径。地理探测器是探测空间分异性,以及揭示其背后驱动因子的一种新的统计学方法,此方法无线性假设,具有优雅的形式和明确的物理含义。基本思想是:假设研究区分为若干子区域,如果子区域的方差之和小于区域总方差,则存在空间分异性;如果两变量的空间分布趋于一致,则两者存在统计关联性。地理探测器q统计量,可用以度量空间分异性、探测解释因子、分析变量之间交互关系,已经在自然和社会科学多领域应用。本文阐述地理探测器的原理,并对其特点及应用进行了归纳总结,以利于读者方便灵活地使用地理探测器来认识、挖掘和利用空间分异性。
Spatial characteristics of urban health resources at block scale: A case study of central urban area of Nanjing
基于街区尺度的城市健康资源空间分布特征: 以南京中心城区为例
Spatial correlation between urban health resources and population distribution: A case study of the central urban area of Changsha city
DOI:10.18402/resci.2019.08.09
[本文引用: 1]
Based on points of interest, remote sensing, and statistical data of the central urban area of Changsha City, this study analyzed the correlation of the aggregation, proximity, and accessibility of urban health resources and population by using Ripley’s k function, colocation quotient, and two-step floating catchment area methods. The results show that: (1) The spatial distribution of urban health resources and population showed clustering characteristics, but there were significant differences in the scale and intensity of agglomeration at different scales, indicating that the coordination of spatial distribution between urban health resources and population needs to be improved. (2) The correlation of proximity between urban health resources and population distribution is poor, showing a non-linear relationship. Urban health resources and population distribution tend to be far away from each other, but the proximity between different types of health resources and the population is different. (3) Accessibility of urban health resources showed a center-periphery structure spatially. However, urban health resource accessibility and population density distribution indicate a mismatch of supply and demand of health resources. Finally, in order to address the problems existing between urban health resource provision and population distribution, specific optimization and adjustments were recommended, focusing on “coordinating the layout, improving proximity, and precision allocation.”
城市健康资源与人口分布空间关联性: 以长沙中心城区为例
DOI:10.18402/resci.2019.08.09
[本文引用: 1]
基于长沙市中心城区空间点数据、遥感影像面数据和统计年鉴数据,主要运用Ripley’k函数、协同区位商和两步移动搜索法等定量方法,从集聚性、邻近性和可达性3个方面研究长沙市健康资源与人口分布的空间关联特征。结果表明:①城市健康资源与人口分布整体上均表现出集聚特征,但多尺度下集聚规模和强度差异明显,间接反映出二者在空间布局协调性上有待提高。②城市健康资源与人口分布之间的邻近性较差,相互之间呈现出非邻近特征,表明二者在空间分布上趋向于远离对方,联系紧密程度较低,但不同类型健康资源与人口之间邻近程度也各不相同。③城市健康资源可达性在空间布局上属于中心-外围结构,然而城市健康资源可达性与人口密度分布在县区和街道尺度上均出现一定程度的不匹配状况,说明城市健康资源在供给和需求空间配置上存在错位问题。最后针对城市健康资源与人口分布之间存在的问题,从“协调布局、邻近规划、精准配置”等方面提出具体的优化调控路径。
Notice of the State Council on printing and distributing the National Fitness Plan (2021-2025)
http://www.gov.cn/zhengce/content/2021-08/03/content_5629218.htm, 2021-07-18.
关于印发全民健身计划(2021—2025年)的通知
http://www.gov.cn/zhengce/content/2021-08/03/content_5629218.htm, [2021-07-18.]
Guidance on accelerating the development of fitness and leisure industry
http://www.gov.cn/xinwen/2016-10/28/content_5125602.htm, 2016-10-28.
关于加快发展健身休闲产业的指导意见
http://www.gov.cn/xinwen/2016-10/28/content_5125602.htm, 2016-10-28.]
Urban research using points of interest data in China
DOI:10.13249/j.cnki.sgs.2021.01.015
[本文引用: 1]
The rising of POI (Point of Interest) data drives an innovation of urban research. In order to sort out the progress of urban research using POI data in China, summarize the directions of research, methods of data analysis and shortcomings, and provide references for the future application of POI data in China’s urban development, CiteSpace was used to analyze 625 related literatures in CNKI (China National Knowledge Infrastructure) database from 2010 to 2019. Result shows that a large number of literatures in urban research using POI data emerged since 2013, and boomed in 2017. According to the results of knowledge map analysis, the main applications of POI data in urban research are identification of urban functional areas, division of urban central areas and boundaries, identification of business agglomeration and recommendation of interested points. While the main methods for analyzing POI data are kernel density analysis, spatial correlation analysis and DBSCAN algorithm. Plenty researches show that POI data is a kind of effective data for urban research, and very helpful for researchers to better understand the spatial structures, distribution patterns and development rules of cities. In future, it can be combined with machine learning and the other algorithms to provide a decision-making method for a long-term development of urban expansion and internal functional structure adjustment. However, POI data can not replace the shape data in some scenarios, and the impact of public awareness should be seriously taken into account individually for different researches.
POI数据在中国城市研究中的应用
DOI:10.13249/j.cnki.sgs.2021.01.015
[本文引用: 1]
兴趣点(Point of Interest,POI)数据的兴起带动了城市研究的革新。为梳理中国POI数据在城市研究的应用进展,阶段性总结其应用方向、数据分析方法及尚存不足,并为未来POI数据在中国城市发展中的应用提供思路和借鉴。应用CiteSpace工具对中国知网2010—2019年625篇相关文献进行知识图谱分析,结合分析结果对POI数据应用方向和数据分析方法进行梳理总结。结果表明:时间上,国内应用POI数据进行城市研究的文献在2013年后大量涌现,2017年呈现爆发式增长;应用上,主要用于城市功能区划分、城市中心区和边界识别、查明业态集聚分布以及兴趣点推荐4个方面;方法上,常用的有核密度分析、DBSCAN聚类分析和空间自相关分析3类。研究表明,POI地理大数据是一种研究城市发展的有效数据,有助于研究者深入了解城市的空间结构、分布格局和发展规律,未来可进一步与机器学习等算法结合,为城市外部扩张和内部功能结构调整在更长期的发展上提供一个决策分析手段,但POI数据尚无法代替面数据,研究时也要充分考虑到公众认知度高低对研究的影响。
The ideological origins and geographical demarcation significance of Hu Huanyong Line
DOI:10.11821/dlxb202106001
[本文引用: 1]
In the early 20th century, China was faced with domestic crisis and foreign invasion, and the man-land contradictions were unprecedented fierce. Geographers pondered and explored the issues of national fortune such as China's population status, northwest exploitation and internal migration, thus China's population geography emerged as the times required. "The distribution of population in China" published by Hu Huanyong in 1935 is a symbol of maturity of China's population geography. The Hu Huanyong Line (also known as Hu Line) proposed in this paper, which he originally called the Aihui-Tengchong Line, is a significant geographical demarcation of China's population. The existence and stability of the Hu Line have been repeatedly verified by census data, and its scientific principles have also been revealed and explained by the academic circles from aspects of nature, economy, social culture, etc. This paper points out that grain and employment are the two hidden logics behind the Hu Line. The Hu Line is becoming a crucial national geographic demarcation, which has an increasingly essential impact on the cognition and analysis of China's national conditions. Recent research on the Hu Line has been widely extended in various fields and meanings, and there arose some amendments and adaptations of the line in practice. Under the influence of "Premier Li Keqiang's three questions", whether the Hu Line can be broken through has become an academic hot spot. This paper holds that it is more important to create more opportunities of the northwest region than to increase the share of population so as to balance regional development.
胡焕庸线的学术思想源流与地理分界意义
DOI:10.11821/dlxb202106001
[本文引用: 1]
20世纪早期,中国面临内忧外患、人地关系矛盾空前剧烈,地理学家对于中国人口国情、西北开发及国内移民等关乎国运问题的思考与探索,孕育了中国的人口地理学。1935年胡焕庸发表的“中国人口之分布”是中国人口地理学走向成熟的标识,文中提出的“瑷珲—腾冲线”即“胡焕庸线”,是中国人口地理的重要分界线。胡焕庸线的存在性与稳定性被人口普查等现实数据反复验证,其科学原理也被学术界从自然、经济、社会文化等方面加以揭示和阐释。本文指出食物与就业是胡焕庸线潜在的两大逻辑。胡焕庸线正在成为一条重要的国家地理分界,对认知与分析中国国情产生越来越重要的影响。近年来胡焕庸线的研究有了广泛引申,并衍生出多个领域、多种意义下的胡焕庸线,在应用层面上还出现了对该线的修正与变通。在“总理三问”的影响下,胡焕庸线能否突破成为一个学术热点,本文认为重要的不是增加西北人口份额,而是让西北地区获得更多发展机会,促进区域均衡发展。
