

1 引言
21世纪以来,中国常住人口城镇化率从2000年的36.22%上升到2020年的63.89%,已处于中国城镇化中后期发展阶段。城镇化是城乡发展转型的主要驱动力,是保持经济持续健康发展的强大引擎,是地理学界一直关注的热点问题。与此同时,地区间自然环境与社会经济发展水平的差异使得城镇化水平存在显著的空间不均衡性[1],中心城市城镇化水平高,外围区域城镇化水平低,省际边界区域尤为突出。省际边界区是以省级行政边界为起点向行政区内部横向延展一定宽度所构成的、沿边界纵向延伸的窄带型区域[2],省际边界区内部县域在空间上的临近使得其在自然本底、资源禀赋、文化习俗以及地方政策等方面具有相似性,但受省区以中心城市为导向的经济布局和边界“切变”效应等因素影响,省际边界县域空间联系并不密切[3-4]。与省域内中心县区相比,省际边界区远离行政和经济辐射中心,既是省级政策的交汇区,又是区域摩擦的集中地,发展较为缓慢,城镇化发展水平较低。2019年11月国务院印发实施《中共中央国务院关于建立更加有效的区域协调发展新机制的意见》[5],指出深化区域合作机制需不断加强省际交界地区合作,探索省际毗邻区域协同发展新机制,扎实推进省际毗邻区域协同发展。在国家区域协调发展战略的支持下,省际边界区发展地位逐渐提升,成为湖南、浙江等诸多省份未来发展的重点区域。因此,开展省际边界区城镇化基本规律探索对优化中国城镇化发展格局,推进区域协调发展,提升国家整体竞争力具有重要意义。
城镇化作为表征区域与城乡发展水平的重要因子,目前国内外对此已有大量研究。国外城镇化研究起步早,主要涉及城镇化内涵、发展进程、影响因素、发展模式[6]、城市问题[7]等方面,城镇化内涵从人口集中、产业结构升级、生活质量提高等方面不断丰富,城镇化发展进程的衡量标准由城镇化率、人口密度和城镇密度等构成[8-9],对影响因素的解析大多从经济发展[10]、人口迁移[11]、产业结构[12]、教育、行政政策和发展规划[13]等方面进行。此外,国外学者将城镇化研究与社会学、生态学等学科交叉融合,侧重从经济发展向资源、环境、乡村建设等可持续发展问题转变[14⇓-16]。国内对城镇化的研究主要基于单一人口数据或构建评价指标体系测度城镇化发展水平,揭示城镇化格局特征及动态演变[17],分析不同尺度城镇化水平的地区差异[18],总结城镇化空间分异的影响因素[19],利用地形与土地利用等空间数据研究山区城镇化高质量发展,探索山地开发与建设空间格局及其演化特征[20⇓-22],在城乡关系视角下研究城镇化,构建新型城镇化与乡村振兴两大战略耦合协调机理,从小城镇视角探究城乡融合发展的影响机制[23-24]。2014年国务院印发《国家新型城镇化规划(2014—2020年)》,标志着中国城镇化发展进入新的阶段[25],从新型城镇化的理论内涵[26]、水平评价[17,19]、发展模式[27]、与经济发展、生态环境、基本公共服务等要素的耦合性[28⇓-30]、城市扩张导致的城乡病、土地问题、生态资源问题等发展问题和对策[31-32]对新型城镇化可持续发展进行探究。2021年《中华人民共和国国民经济和社会发展第十四个五年规划和2035年远景目标纲要》中明确提出要构建国土空间开发保护新格局,推动区域协调发展,推进以人为核心的新型城镇化[33],省际边界区作为新型城镇化现研究阶段的薄弱地区,开展省际边界区城镇化空间格局探究有助于准确把握中国经济社会发展空间结构深刻变化与发展趋势,从国家战略层面进一步优化顶层设计,实施更精准的政策,推动新型城镇化迈向高质量发展。因此,本文将围绕“省际边界区城镇化格局演变的关键影响因素识别及驱动机理探测”这一科学问题,开展省际边界区县域尺度城镇化水平测度,分析并总结省际边界区城镇化空间发展格局的基本规律,挖掘深层次空间耦合机理,因地制宜地制定政策并提升实施效果,从而完善新型城镇化多样化的区域性发展模式。评价城镇化发展水平方法主要采用熵值法[17]、因子分析法[19]、变异系数法[34],主客观赋权法通过对综合评价指标体系的各项指标主客观权重进行综合,缩小偏差,其运用是未来的主要趋势[29]。对影响因素探究多运用空间计量模型[17]、地理加权回归[35]、地理探测器[36]等,其中地理探测器仅用于探测主要驱动因子,缺少对影响因素的交互探测,运用地理探测器对城镇化空间格局进行主导因素及交互关系探测,是揭示省际边界区域城镇化空间格局驱动机制的有效手段。
20世纪90年代国外学者对边界地区展开研究,主要在国家层面上探讨边界区的经济贸易活动[37]、边境走私[38]和边界效应的测度[39]以及区域一体化程度等,对国家内部省际(州际)边界区鲜有涉及,对边界区城镇化研究更少。国内舒庆等[40]最早开始对省际边界区域探讨,指出行政区边缘地区经济由于要素流通受阻、地方政府干预等表现出衰竭性的特征[34],之后学者多是对京津冀、江浙沪等东部发达地区的省际边界区开发[41]、边界效应测定[42]、经济发展差异[34]、区域协调与可持续发展[43]、城市化模式[44]、经济空间结构[45]等开展研究。中西部省际边界区由于特殊的地理区位,经济发展水平不高,影响力较弱,受到的关注较东部发达地区少,且从全国整体尺度分析省际边界区城镇化时空演变规律的成果更不多见。因此,本文以2019年标准行政区划下全国887个省际边界县为研究对象,采用空间自相关模型探究2000—2019年中国省际边界区城镇化发展时空格局和空间关联特征,利用地理探测器识别影响省际边界区城镇化空间格局的主导因素及其交互关系,并构建驱动机制理论模型,在此基础上划分驱动类型区并提出针对性建议,从而丰富省际边界区研究,也为相关区域城镇化协调发展政策制定提供科学依据。
2 研究区概况与研究方法
2.1 研究区概况
截至2021年底,中国共有34个省级行政区(即23个省、5个自治区、4个直辖市、2个特别行政区),2844个县级行政单元(暂未包括香澳台地区),本文研究对象为省级行政单元(包括省、自治区、直辖市)相邻的县域行政单元,其中海南省、台湾省存在隔海相邻的情况,文中对这种情况暂不予考虑。由于各市所辖市辖区变化较大,故以2019年中国行政区划为准,经过处理得到887个省际边界区县域,面积占全国的47.9%。省际边界区的分界线多是江河、山脉天然地形,使得边界区内部形成丰富的自然资源,但其生态环境脆弱,开发建设困难。省际边界区在地理空间上远离省域经济中心,由于省界和边缘区位的约束和影响,使其受到核心区的辐射带动微弱,难以得到政府应有的资金及政策支持,基础设施和公共服务设施建设投入匮乏,区域经济、社会发展受限。2019年省际边界区人均GDP仅为全国平均水平的69%,第二、三产业增加值占GDP比重与全国相差14.05个百分点,对生产要素的集聚力弱,资金、劳动力、自然资源等外流现象严重,异地城镇化现象明显,致使省际边界区内部缺乏持续有效的内生动力,城镇化水平低、发展缓慢。
2.2 数据来源与处理
经济社会统计数据主要来自于2001年、2011年和2020年《中国县域经济统计年鉴》《中国区域经济统计年鉴》、各省(自治区、直辖市)统计年鉴以及各县市统计公报。数字高程模型(DEM)、土地利用等地理空间数据来自中国科学院资源环境科学数据中心(
2.3 省际边界区城镇化水平评价指标体系构建
综合现有相关研究成果[46⇓⇓-49]并充分考虑数据可获取性、典型性,本文从人口、经济、空间、社会、绿色5个维度选取表征城镇化发展的指标,构建城镇化水平综合评价指标体系(表1)。其中,人口城镇化方面,选取城镇人口占比和人口密度反映人口非农化过程及城镇对乡村人口的吸引力[46];经济城镇化方面,选取人均GDP、人均规模以上工业总产值与人均第三产业增加值反映地区的经济发展状况、工业发展态势与服务业水平[46-47,49];空间城镇化方面,选取建设用地占总用地面积的比例表征土地开发程度[47];社会城镇化方面,分别从居民生活水平、医疗、教育等方面选取人均城乡居民储蓄余额、每万人医疗床位数与在校中小学生数指标综合反映社会发展状况[46];绿色城镇化方面,选取CO2排放量与PM2.5浓度表征城镇化的生态环境质量[49]。为消除不同县域间人口规模差异的影响,各项指标采用人均指标。
表1 中国省际边界区城镇化水平评价指标体系及权重
Tab. 1
| 一级指标 | 二级指标 | 单位 | 表征意义 | 属性 | 客观权重 | 主观权重 | 综合权重 |
|---|---|---|---|---|---|---|---|
| 人口城镇化 | 城镇人口占比 | % | 城镇化发展水平 | + | 0.030 | 0.174 | 0.085 |
| 人口密度 | 人/km2 | 人口集聚能力 | + | 0.200 | 0.058 | 0.126 | |
| 经济城镇化 | 人均GDP | 元/人 | 经济发展状况 | + | 0.069 | 0.194 | 0.141 |
| 人均规模以上工业总产值 | 元/人 | 工业化水平 | + | 0.159 | 0.092 | 0.136 | |
| 人均第三产业增加值 | 元/人 | 服务业水平 | + | 0.080 | 0.082 | 0.095 | |
| 空间城镇化 | 建设用地占总用地面积的比例 | % | 土地开发程度 | + | 0.161 | 0.106 | 0.153 |
| 社会城镇化 | 人均城乡居民储蓄余额 | 元/人 | 居民生活水平 | + | 0.175 | 0.068 | 0.127 |
| 每万人医疗床位数 | 张 | 医疗保障水平 | + | 0.045 | 0.038 | 0.048 | |
| 在校中小学生人数 | 人 | 文化教育状况 | + | 0.062 | 0.021 | 0.042 | |
| 绿色城镇化 | CO2排放量 | Mt | 生态发展质量 | - | 0.002 | 0.125 | 0.016 |
| PM2.5浓度 | μg/m3 | - | 0.017 | 0.042 | 0.031 |
2.4 研究方法
2.4.1 综合权重求解
为避免各项指标的量纲差异对计算结果的影响,对指标进行标准化处理,针对正效应指标和负效应指标,分别采用不同的标准化处理[46],计算公式为:
式中:i为指标序号;Xij为实际计算值;maxXi和minXi分别为第i指标的最大值和最小值。
为减小主观因素与数据离散程度对权重的影响,本文通过熵值法和层次分析法分别计算得到客观权重W1i和主观权重W2i后,借助最小信息熵原理对主客观权重进行综合[29],缩小偏差,得到综合权重Wi,具体计算公式为:
式中:W1i、W2i分别为熵值法与层次分析法计算所得权重。
2.4.2 综合指数计算
运用线性加权平均法计算省际边界县域城镇化综合指数,计算公式为:
式中:Xij表示省际边界县域城镇化综合指数;
2.4.3 空间自相关模型
(1)全局空间自相关。应用全局空间自相关衡量省际边界县域城镇化水平在空间上是否具有显著的空间关联,通常用Moran's I表示,计算公式为:
式中:n为省际边界区县域的数量;xi、xj分别为省际边界区县域城镇化水平在相应空间单元上的取值;Wij为空间权重矩阵,若相邻则值为1,不相邻为0。Moran's I值的区间为[-1, 1],若为(0, 1]则表示正相关,要素属性趋于空间聚集分布;若为[-1, 0),则表示负相关,要素分布趋于分散,值越趋于1或-1,表示空间分布差异性越大,值等于0则表示不存在空间关联,为随机分布。
(2)局域空间自相关。全局空间自相关能测度出空间上内部类似水平单元的相似程度,但掩盖了局部的异质性,常用空间联合局域指数(LISA)探索集聚中心的空间位置,识别具有高值或低值的要素空间聚类。局部Moran's I的计算公式为:
在关联显著的前提下,通过Moran's I可将省际边界区县域划分为高—高(H-H)、高—低(H-L)、低—高(L-H)、低—低(L-L)4种空间关联类型。
2.4.4 地理探测器
采用地理探测器模型中的因子探测和交互探测识别影响省际边界区城镇化空间格局的主要影响因子及其交互关系。因子探测主要分析不同影响因素对研究区城镇化空间格局的解释程度。其计算公式为:
表2 两个自变量对因变量的交互作用类型
Tab. 2
| 判据 | 交互作用 |
|---|---|
| q(X1∩X2)<min(q(X1), q(X2)) | 非线性减弱 |
| min(q(X1), q(X2))<q(X1∩X2)<max(q(X1), q(X2)) | 单因子非线性减弱 |
| q(X1∩X2)>max(q(X1), q(X2)) | 双因子增强 |
| q(X1∩X2)=q(X1)+q(X2) | 独立 |
| q(X1∩X2)>q(X1)+q(X2) | 非线性增强 |
3 结果分析
3.1 省际边界区城镇化时空格局
以自然断点分级法为基础,参考现有研究成果以25%、40%、55%和70%为分界点,将省际边界区城镇化水平划分为低、较低、中等、较高和高5类[36](图1)。2000—2019年中国省际边界区城镇化水平不断提高,但受地理区位限制,中心城市辐射带动作用小,整体仍处于低水平和较低水平。2000年、2010年和2019年城镇化发展水平的均值为0.12、0.13和0.16,年均增长率为1.63%,与全国11.81%的年均增长率[28,51]相比,省际边界区县域城镇化增速较慢。2000—2010年城镇化发展水平的年增长率为0.64%,2000年以后中国总体经济实力和财政能力大幅增强,以工补农、以城带乡和财政扶贫政策虽在着力推进,但中心城市仍处于极化发展阶段,向外辐射较弱,使得省际边界区城镇化发展增速较慢。2010—2019年研究区城镇化水平年均增长率为2.56%,随着中国西部大开发和中部崛起战略的实施、偏远地区扶贫政策的落实以及国家主体功能区空间开发的有序推进,受政策利好影响,基础薄弱的省际边界区城镇化水平增速较快。
图1
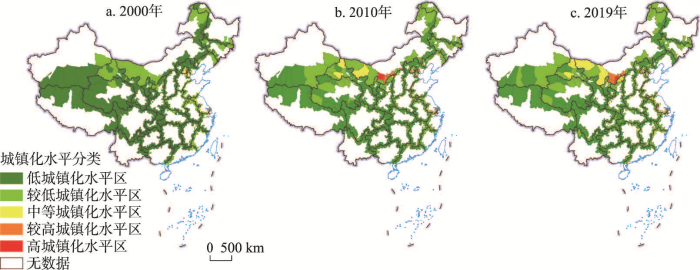
图1
2000年、2010年和2019年中国省际边界区县域城镇化格局
注:基于自然资源部标准地图服务网站GS(2020)4619号标准地图制作,底图边界无修改。
Fig. 1
Spatial characteristics of urbanization of inter-provincial border areas in China in 2000, 2010, and 2019
2000—2019年省际边界区城镇化水平空间分布不均衡,整体呈现东—中—西阶梯状递减趋势。2000年高水平城镇化县域数量最少,仅有8个,集中分布在长三角地区,较高水平区主要分布在北京、天津、江苏南部等地,中等水平区分布较分散,分布在北京(昌平、怀柔、房山、大兴)、天津(宝坻、西青)、上海(金山)、浙江北部(吴兴、南浔、桐乡、平湖)、江苏南部(仪征、溧水、吴江、宜兴)等地区,233个县为较低水平城镇化,588个县为低水平城镇化,两者占全部省际边界区县域数量的92.56%,较低水平城镇化地区和低水平城镇化地区连成一片,构成网络状的分布格局。2010年高水平城镇化县域新增内蒙古鄂托克旗,空间上仍集中分布在长三角地区,较高水平城镇化县域数量增加到27个,新增县域分布于内蒙古中西部(阿拉善右旗、鄂托克旗、乌审旗、伊金霍洛旗、准格尔旗、丰镇市),空间上向西扩散明显,新增区域主要依托矿产资源开发、呼包鄂榆城市群建设逐渐提升自身及其周围县域城镇化水平,中等水平城镇化县域数量有所增加,在空间上碎片化趋势加强,分布范围有向东、向南扩展的趋势,较低水平城镇化县域数量由2000年的233增至2010年的283个,低城镇化水平县域数量降至499个,二者占研究区的88.16%,广泛分布在西部、中部和东北地区。2019年高城镇化水平县域数量上无变化,在空间上新增内蒙古乌审旗,29个较高水平城镇化县域空间格局较为稳定,主要分布在京津冀、长三角以及呼包鄂榆城市群等高城镇化区域周围,较低水平城镇化数量增加到352个,低水平城镇化县域数量减少到429个,较低水平和低水平城镇化县域占研究区的88.05%,交错分布在西部、中部和东北地区。整体来看,2000—2019年研究区低水平城镇化县域数量不断减少,较低水平城镇化县域数量增加,低水平和较低水平城镇化区连片分布在西南地区和东北地区,中等水平城镇化数量持续增加,分布范围扩大,新增区域主要分布在西北地区的内蒙古、甘肃和青海,高水平和较高水平城镇化数量基本不变,不断向京津冀、长三角以及内蒙古中西部地区集聚。
3.2 省际边界区城镇化空间关联特征
为进一步分析中国省际边界区城镇化的空间演变特征,对2000—2019年研究区的城镇化水平进行全局空间自相关测算,得到Moran's I的数值(2000年0.57,2010年0.46,2019年0.41)全部为正,且Z得分均超过0.01置信水平的临界值1.96,即呈现出显著的空间正相关性,表明中国省际边界区县域城镇化水平在空间上并不独立,一直处于空间集聚状态,Moran's I指数逐渐下降至0.41,县域城镇化的空间集聚效应有所减弱但仍显著。对数据进行空间局域自相关处理,得到空间关联局域指数(表3),2000—2019年中国省际边界县域城镇化水平空间自相关类型基本稳定,L-L类型占主导,数量占县域单元总量的31%~36%,其次是H-H类型占18%~21%,其余两种类型合占总县域单元的8%~12%,可见,研究区城镇化空间类型呈偏正态分布,低城镇化水平对应的县域数量多,城镇化水平高的县域数量少。
表3 2000年、2010年和2019年中国省际边界区县域城镇化水平局域空间集聚统计(LISA)
Tab. 3
| LISA集聚 | 2000年(个) | 2010年(个) | 2019年(个) | |
|---|---|---|---|---|
| 显著性空间集聚 | 高—高(H-H) | 181 | 173 | 163 |
| 高—低(H-L) | 22 | 24 | 32 | |
| 低—高(L-H) | 68 | 78 | 64 | |
| 低—低(L-L) | 308 | 312 | 281 | |
| 非显著性空间集聚 | 县域单元数量 | 308 | 300 | 347 |
| 总计 | 887 | 887 | 887 |
为进一步说明城镇化水平在空间上的聚集分布状况,得到2000年、2010年、2019年LISA聚集图(图2),2000—2019年省际边界区县域城镇化空间格局高值、低值集聚化特征明显。L-L类型的县域在分布上具有锁定效应,主要分布在中西部地区的山系,空间集聚特征明显,主要为甘肃、青海、西藏、四川、云南、贵州、广西、湖北等省交界地区。该类区域在空间分布上与武陵山、秦巴山、六盘山片区、滇桂黔石漠化片区等中国连片特困区基本吻合,人均GDP在1000~34200元之间,地形起伏度均大于1.5,落后的经济水平与恶劣的自然条件共同作用导致区域城镇化动力不足,形成低—低集聚区。H-H类型的县域分布较为稳定,空间分布呈“T”型格局,即城镇化水平较高的地区主要分布在东部沿海省份交界区和内蒙古中西部地区,前者省际边界区的县域长期受长三角城市群和京津冀城市群辐射影响,城市要素流动、技术扩散等溢出效应显著,带动周边县域城镇化水平不断提升,明显高于其他省际边界区县域;后者蕴含丰富矿产资源,资源型企业众多,人均规模以上工业总产值达192415元以上,人均GDP高达101496元以上,社会公共服务较完善,加之依托呼包鄂榆城市群建设,城镇化水平高于其他省际边界区。L-H类型数量变化不大,分布较为分散,多数分布在河北北部地区,长期受到北京、天津辐射带动,城镇化水平较高,其余零星分布在安徽东部、辽宁西部、山西东北部等地,由本地区资源开发和周围相对发达的地区经济辐射共同作用使得城镇化水平高。H-L类型区总体上分布在西北地区,主要受“丝绸之路经济带”建设影响,空间分布范围不断扩大。总体而言,省际边界区县域城镇化水平的空间关联类型中,城镇化水平较高的区域主要集中在长三角、京津冀和内蒙古中西部地区,而西北地区、东北地区、西南地区省际边界县域城镇化水平低并呈现集聚状态。
图2
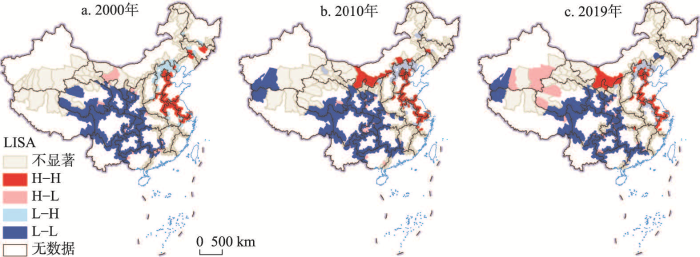
图2
2000年、2010年和2019年中国省际边界区县域城镇化空间关联类型分布
注:基于自然资源部标准地图服务网站GS(2020)4619号标准地图制作,底图边界无修改。
Fig. 2
Distribution of spatial autocorrelation types of China's inter-provincial border counties' urbanization in 2000, 2010, and 2019
3.3 省际边界区城镇化空间格局影响因素
3.3.1 影响因素选取
参考相关学者的研究[18,46],本文以省际边界区县域城镇化水平为被解释变量,从经济发展、政府行为、社会投资、交通水平、公共服务、自然条件等方面选取解释变量建立指标体系(表4),运用地理探测器对研究区城镇化空间分异格局的影响因素进行因子探测及交互探测。经济实力强的地区具有吸引资本、技术、人才等生产要素的优势,带动城镇化建设,以人均GDP表征地区经济实力状况[1]。产业结构的非农化促使劳动力向非农行业转移,带动人口城镇化进程,用第二、三产业增加值占GDP的比重反映就业非农化水平[48]。良好的货币金融环境为经济发展和城镇化进程提供金融支持,用年末金融机构贷款余额反映金融支持条件[46]。政府的宏观调控行为为城镇化发展提供强有力的保障,用人均财政支出衡量政府的调控行为和行政能力[36]。固定资产投资的增加可加速完善城镇基本公共服务设施,为县域城镇化建设提供支持和保障,用人均全社会固定资产投资衡量社会投资水平[46]。道路交通优势度是度量区域交通网络结构及区域对外联系的重要指标,用路网密度和邻近高速出口距离表征[52]。县域的公共服务供给用教育水平和医疗水平来衡量,即每万在校中小学生拥有专任教师数和每千人拥有卫生技术人员数[17]。地形起伏会影响区域人口分布,而坡度陡会增加后续城市建设用地成本,用地形起伏度和平均坡度来反映自然条件状况[53]。
表4 城镇化空间格局影响因素指标体系
Tab. 4
| 自变量类型 | 自变量具体名称 | 变量解释 | 数据类型 |
|---|---|---|---|
| 经济发展 | X1 人均GDP | 地区经济实力状况[1] | 统计数据 |
| X2 第二、三产业增加值占GDP比重 | 产业非农化水平[48] | 统计数据 | |
| X3 年末金融机构贷款余额 | 金融支持条件[46] | 统计数据 | |
| 政府行为 | X4 人均财政支出 | 政府能力[36] | 统计数据 |
| 社会投资 | X5 人均全社会固定资产投资 | 社会投资水平[46] | 统计数据 |
| 公共服务 | X6 每千人拥有卫生技术人员数 | 医疗水平[17] | 统计数据 |
| X7 每万在校中小学生拥有专任教师数 | 教育水平[17] | 统计数据 | |
| 交通通达性 | X8 路网密度(国道、省道、铁路、高速公路) | 道路交通优势度[52] | 矢量数据 |
| X9 邻近高速公路出口距离 | 矢量数据 | ||
| 自然条件 | X10 地形起伏度 | 自然条件[53] | 栅格数据 |
| X11 平均坡度 | 栅格数据 |
3.3.2 主导影响因素识别
将解释变量导入地理探测器模型求得各解释变量对省际边界区城镇化空间格局的影响力值(q值),结果显示(表5),2000—2019年省际边界区城镇化空间格局影响因子大小依次为X1>X8>X2>X3>X11>X5>X9>X6>X4>X10>X7,表明经济发展类和交通通达性因子对省际边界区城镇化发展格局起主导作用,社会投资、政府行为和自然条件对研究区城镇化空间格局演化起到重要作用,公共服务对其影响相对较弱。
表5 2000年、2010年和2019年中国省际边界区县域城镇化水平影响因素地理探测结果
Tab. 5
| 自变量名称 | p值 | 显著性 | q值 | 解释力排序 | 2000年 | 2010年 | 2019年 |
|---|---|---|---|---|---|---|---|
| X1 | 0.000 | 0.05 | 0.55 | 1 | 0.54 | 0.55 | 0.55 |
| X2 | 0.000 | 0.05 | 0.43 | 3 | 0.42 | 0.30 | 0.35 |
| X3 | 0.000 | 0.05 | 0.43 | 4 | 0.18 | 0.46 | 0.39 |
| X4 | 0.000 | 0.05 | 0.13 | 9 | 0.23 | 0.13 | 0.10 |
| X5 | 0.000 | 0.05 | 0.20 | 6 | 0.13 | 0.17 | 0.19 |
| X6 | 0.000 | 0.05 | 0.14 | 8 | 0.15 | 0.14 | 0.06 |
| X7 | 0.000 | 0.05 | 0.05 | 11 | 0.03 | 0.10 | 0.02 |
| X8 | 0.000 | 0.05 | 0.46 | 2 | 0.43 | 0.43 | 0.43 |
| X9 | 0.000 | 0.05 | 0.15 | 7 | 0.14 | 0.11 | 0.15 |
| X10 | 0.000 | 0.05 | 0.08 | 10 | 0.08 | 0.09 | 0.09 |
| X11 | 0.000 | 0.05 | 0.27 | 5 | 0.29 | 0.23 | 0.21 |
通过分别探测2000年、2010年和2019年省际边界区县域城镇化空间格局的影响力q值,发现自然条件对省际边界区城镇化空间格局的影响有所弱化,而社会经济因素对其的影响逐渐增强。人均GDP、第二、三产业增加值占GDP比重、年末金融机构贷款余额的影响力始终处于前列,表明经济发展是中国省际边界区城镇化空间格局的主导因素,改革开放以来,中国经济发展逐渐呈现出较大空间差异[34],进而导致省际边界区各县城镇化阶段不同,2000—2019年东部长三角、京津冀地区经济繁荣(2000年、2010年、2019年上述地区省际边界区县域GDP均值为95.30亿、537.96亿、1163.45亿),带动城镇化快速发展,西部西藏、贵州、云南等地经济发展滞后(2000年、2010年、2019年上述地区省际边界区县域GDP均值分别为10.86亿、51亿、133.49亿),制约城镇化发展。人均财政支出的影响力逐渐下降,表明政府行为对城镇化空间格局的作用力有所减弱,也进一步说明市场的发展对省际边界区城镇化的作用越来越显著。人均全社会固定资产投资的影响力从0.13增加到0.19,说明社会投资对省际边界区城镇化空间格局的影响逐渐增强,通过增加研究区卫生、社会保障和社会福利事业、教育、文化等民生领域投资进而带动城镇基础设施建设,在提高省际边界区人民生活质量、推动城镇化平稳发展等方面发挥积极作用。每千人拥有卫生技术人员数和每万在校中小学生拥有专任教师数对城镇化空间格局影响较小,且随时间减弱,但仍然是省际边界区城镇化发展的重要驱动力,医疗水平和教育水平的提高会大大提高人口素质,促进城乡文明的融合,同时改变就业结构和物质空间结构,推进城镇化进程。路网密度、临近高速公路出口距离对省际边界区城镇化空间格局影响较为稳定,且路网密度的影响力排名一直居于第二,说明交通通达性对其影响较大,交通状况的改善有助于增加区域之间、区域内部的可通达性,加速区域、城市之间要素流动,从而推进城镇化进程。自然条件作为基础因素,对省际边界区城镇化空间格局的影响随时间变化影响力逐渐减弱,西南地区地处高原、丘陵地带,平均坡度大于17°,人口密度在200人/km2以下,城市后续建设成本大,故城镇化发展缓慢,东部大部分地区平均坡度在0°~15°之间,适合人口聚集、经济开发、城市建设,为城镇化发展提供良好的基础。
3.3.3 交互探测结果
通过对影响因子交互探测的结果(图3)分析发现,各影响因素在省际边界区城镇化空间格局的演化过程中存在交互作用,不同影响因子两两之间交互后解释力明显增强,且结果均表现出不同程度的双因子增强或非线性增强,没有出现减弱和独立的关系,表明省际边界区城镇化空间格局是经济发展、政府行为、交通水平、社会投资和自然条件等多种因素共同作用的结果。人均GDP与其余因子的交互作用最强,解释力在55%以上,其次是路网密度与其余因子的交互作用,解释力在46%以上,说明省际边界区城镇化空间格局的发展主要受经济发展、交通通达性与其他因子共同作用。另外,人均财政支出在单因子探测中影响力相对较弱(q = 0.126),而人均财政支出与人均全社会固定资产投资、每万在校中小学生拥有专任教师数、邻近高速出口距离和地形起伏度交互作用后影响力呈非线性增强,交互作用后的q值分别为0.334、0.199、0.289和0.412,表明政府行为对省际边界区城镇化空间格局的影响需在与社会投资、公共基础服务、交通水平、自然条件等因素的共同作用下才能充分体现,同时反映出政府职能从管理型向服务型转变取得一定成效,政府在区域发展中发挥调控职能,通过调整财政支出的领域引导社会公众投资,加强医疗、教育、交通等基础设施建设,提升自身城镇化建设的能力与水平。同样,每万在校中小学生拥有专任教师数在单因子探测中影响力排名居于末位(q = 0.045),但在与其他因子交互作用后q值均显著增大,尤其是在与人均GDP和路网密度交互作用后,q值为0.577和0.527,对城镇化空间格局影响增强,说明教育水平单个因素对省际边界区城镇化空间格局影响程度较弱,基础教育的规律在于周期长、见效缓、后劲大,对城镇化主要表现为间接影响,因此当基础教育与经济发展和交通能力等因素共同作用后,能够显著推动城镇化的发展。
图3
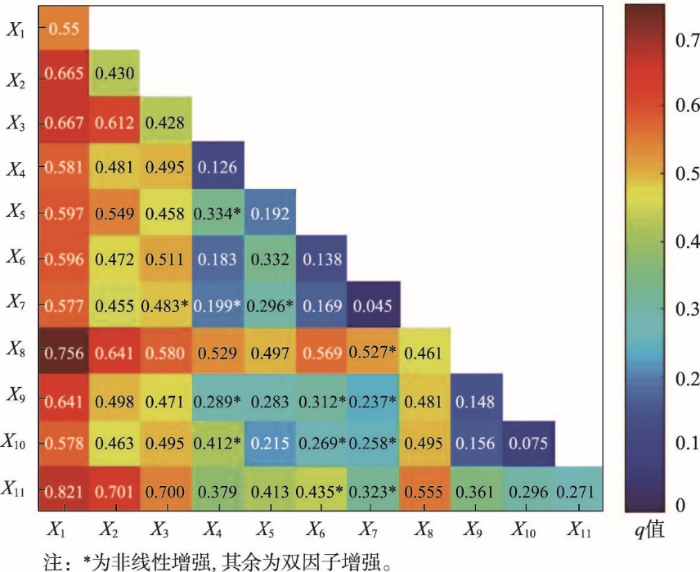
图3
2000—2019年中国省际边界区城镇化空间格局各影响因素的交互探测结果
Fig. 3
Interactive detection results of impact factors of China's inter-provincial border counties' urbanization in 2000-2019
3.3.4 城镇化空间格局的形成机理
基于主导影响因素识别和交互探测结果,进一步构建省际边界区城镇化空间格局演变的形成机理(图4)。具体而言,表征地区经济发展水平的人均GDP、第二、三产业增加值占GDP比重、年末金融机构贷款余额的单因子解释力较强,达0.40以上,且与其余指标的交互作用显著,充分反映出省际边界区城镇化空间格局演变主要受经济发展的直接推动。交通通达性的单因子解释力较强,且与其他10项指标交互作用显著,表明道路交通是促进生产要素流动、加强对外联系、加快城镇化进程的重要媒介。医疗服务、社会投资、自然条件的自身影响力较弱,与经济发展、交通通达性因子交互作用显著,交互结果呈双线性增强,表明上述因子对省际边界区城镇化空间格局演变起次要直接作用。教育服务、政府行为的单因子解释力最弱,与经济发展、社会投资、交通通达性、自然条件等交互作用极其显著,交互结果呈非线性增强,表明教育水平与政府行为对研究区城镇化空间格局演变具有间接作用。总之,省际边界区城镇化空间格局演变是在经济发展和交通水平主要驱动和直接作用下,医疗水平、社会投资和自然条件次要驱动和直接作用以及政府行为与教育服务间接作用后的结果。
图4
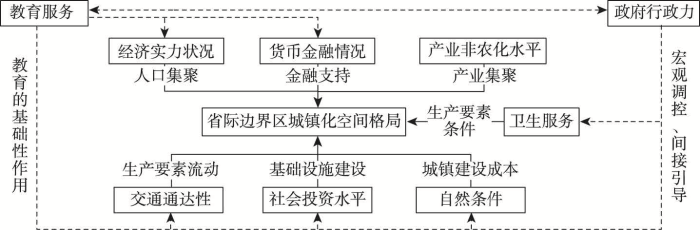
图4
中国省际边界区城镇化空间格局形成机理
注:实线表示直接作用,虚线表示间接作用。
Fig. 4
The mechanism of spatial autocorrelation types of China's inter-provincial border counties' urbanization
3.3.5 城镇化驱动类型及差别化发展政策
图5
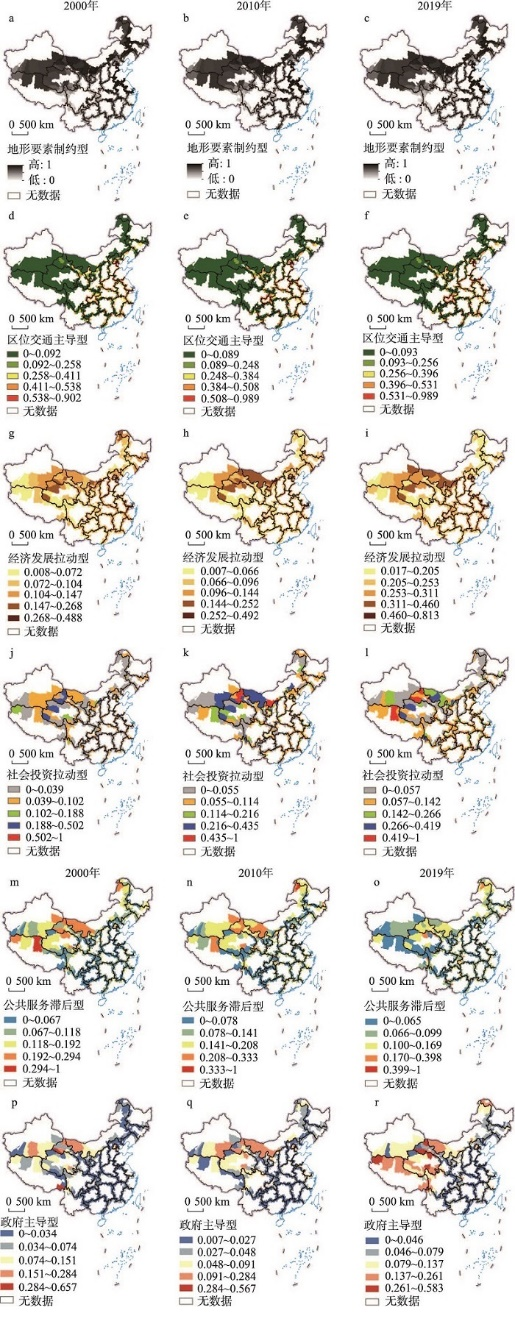
图5
2000年、2010年和2019年中国省际边界区县域城镇化空间格局影响因子的空间分布
注:基于自然资源部标准地图服务网站GS(2020)4619号标准地图制作,底图边界无修改。
Fig. 5
Spatial distribution of impact factors of China's inter-provincial border counties' urbanization in 2000, 2010, and 2019
(1)地形要素制约型。人类经济活动场所趋向低地、坡度平缓(0~15°)处分布,且随时间变化逐渐向坡度< 6°的地区集中布局[22]。该类型区典型分布在川藏、川陕鄂渝和川黔桂等省际边界交界区(图5a~5c),地理位置偏远,且以山地丘陵为主,自然条件很大程度上限制了城镇的建设与发展。该类型区一方面在聚落布局和经济建设时应着重考虑地理位置良好、交通便利的低地形起伏地区,根据其地质地貌特点坚持资源节约,提高资源集约利用效率,促进人口与城镇、产业与城镇协同集聚,加快现有山区村镇就地建设步伐,提升山区村镇的城镇功能[21];另一方面因地制宜,发展山地农业、梯田农业、农牧业结合等特色农业,通过发展经济带动城镇化发展;与此同时,还需重视生态环境保护,提高城镇资源环境承载能力,增强其发展的可持续性。
(2)区位交通主导型。路网密度和临近高速公路出口的距离作为衡量连接其他地区的交通通达水平,影响着各县区之间以及县城和中心城市之间的人力、物质、信息等要素的流动以及农村生产要素非农化的市场介入性。图5d~5f中显示交通水平整体呈现出东部地带向西北省际边界区递减的趋势,研究区路网密度为0.15 km/km2,而京津冀城市群、成渝双核城市群、长三角城市群等省际边界县域属区位交通主导型类型区,其路网密度达0.3 km/km2,交通呈高质量发展良好态势,通过交通影响区域生产要素和人口的集聚配置水平和经济社会发展,进而拉动上述县域城镇化发展。此类型区应加强交通基础设施建设,合理规划线路布局,建立方便快捷的交通网络,保持交通优势度领先地位。
(3)经济发展拉动型。人均GDP,第二、三产业增加值占GDP比重以及年末金融机构贷款余额反映县区的经济实力和产业结构,此类型区集中分布在京津冀、长三角城市群、内蒙古中西部地区(图5d~5f),人均GDP达10000元以上,第二、三产业增加值占GDP比重达72%以上,城镇化率从14%增长到62%以上。该类型区一方面要提高中心城市的辐射带动作用,另一方面应充分发挥资源优势、区位优势、交通优势,强化优势产业发展,优化产业结构,挖掘县域经济增长的潜力,为城镇化发展提供经济支持。
(4)社会投资拉动型。人均全社会固定资产投资是衡量城市经济活力的重要指标,研究区全社会固定资产投资总量大体上持续增长,该因素对陕蒙边界、宁蒙边界、蒙甘边界、甘青边界、青新边界、青藏边界等西北地区所辖省际边界区县有较大影响(图5j~5l),上述县域属社会投资拉动型类型区,政府通过西部大开发战略、“一带一路”倡议等引导全社会对西部地区资本积累和资源配置,吸引相关生产要素的集聚,进而促进城镇化的发展,但由于地区人口密度小,人口流动活力弱,城镇化进程缓慢。该类型区需政府合理引导投资,加大有效投资力度,积极鼓励民间资本的参与,提高社会资本对省际边界区县域基础设施投入,提升省际边界区的城镇化水平。
(5)公共服务滞后型。随着居民生活水平的不断提高和健康意识的逐渐增强,医疗服务需求持续释放,医疗公共服务对城镇化的驱动作用越来越强,每千人拥有卫生技术人员数反映省际边界区县域的医疗公共服务水平。公共服务滞后型主要分布在川渝边界、川藏边界、川黔边界、川滇边界等西南地区(图5m~5o)。《2019年新型城镇化建设重点任务》明确指出,加快推动城乡融合发展,务必要增加基层医务人员岗位吸引力,吸引专业技术人才进入基层,提升基层医疗机构能力。因此,上述县域应增加公共服务供给,统筹布局医疗服务、文化设施等公共设施,健全医疗、养老等社会保障体系,提升公共服务水平,增强城镇对人口的吸引力。
(6)政府主导型。政府利用财政政策对城镇化建设统筹规划,引导资源配置和要素流动。该因素对内蒙古、甘肃、青海、新疆、西藏所辖省际边界县域影响较大(图5p~5r),反映出西北地区城镇化发展主要受政府政策驱动。针对该类型区,政府需考察区域的整体特征,根据其基础条件和发展优势制定发展战略,打破行政界线阻隔,加强县域统一规划,吸引区域共同配合,推进西部地区的基础公共服务均等化,促进要素的集聚,进而推进城镇化的进程。
4 讨论与结论
4.1 讨论
本文在对省际边界区城镇化时空演变过程分析时发现,2000—2019年中国省际边界区城镇化水平呈现出东中西阶梯状递减的空间分布特征,与中国经济东中西地带性梯度存在一致性。东部地区经济基础较好,省区内部通过产业合作、对口帮扶等形式对省际边界县域经济发展起推动作用,进而带动其省际边界区城镇化发展,2000—2019年东部264个省际边界县域多年人均GDP为33714元,城镇化水平多年均值为0.1723。中部地区发展相对滞后,农业产业化程度低,工业发展差距大,经济外向程度低,城镇化进展缓慢,247个中部省际边界县域多年人均GDP为25343元,城镇化水平多年均值为0.1260。西部地区受大山大河等天然屏障的阻隔以及政府优先发展中心城市的政策影响,省际边界县域经济落后,教育、医疗等资源配置不均衡,城镇化进程迟缓,西部376个省际边界县域多年人均GDP为23548元,城镇化水平多年均值为0.1129。从省际边界区城镇化空间格局的影响因素来看,2000—2019年人均GDP、第二、三产业增加值占GDP比重、年末金融机构贷款余额对研究区城镇化空间格局的影响力一直位于前5,表明经济发展是研究区城镇化空间格局的主导因素。由此可见,中国省际边界区城镇化与经济格局存在一致性,存在地带间的梯度差异,进一步说明经济发展水平是城镇化的基础。
通过分析省际边界区城镇化空间关联特征发现,距离发达地区城市群近的县域城镇化水平高,城市群重点优势区域辐射带动作用强,是区域经济与城镇化发展的重要支撑。受京津冀和长三角城市群的辐射和带动作用影响,东部省际边界县域城镇化水平较高,而内蒙古中西部地区省际边界县域依托呼包鄂榆城市群建设以及开发丰富的矿产资源,促进经济发展及基础设施建设,该区域城镇化水平较高。中西部省区经济发展落后,工业基础薄弱,交通基础设施不完善,国家虽先后出台了西部大开发和中部崛起战略,但地方政府通常把有限资源投入到中心城市,区域经济协调能力较差,长江中游、成渝、中原和关中平原城市群建设较晚,还未完全发挥出扩散效应,致使中西部省际边界县域城镇化发展滞后。由此可见,省际边界区城镇化发展具有空间近邻效应。
地理位置偏远是省际边界区遇到发展困境的现实原因。中国四省交界的县仅有5处,分别是苏鲁豫皖边界区(安徽砀山县、山东单县)、陕甘宁蒙边界区(陕西定边县、宁夏盐池县)和湘黔鄂渝边界区(重庆酉阳县),上述县域主要受区位边缘性和边界阻隔影响,距离省会城市最近的约120 km,最远的达577 km,接受中心城市经济辐射困难,容易造成行政管理和政策治理边缘化,同时又是省际政策的交汇区,政策不一导致区域间缺乏合作,阻碍地区间经济主体的自由竞争和生产要素的自由流动,导致城镇化水平(0.0656~0.1920)低。陕川渝、滇川黔、湘鄂渝、滇黔桂、湘黔桂、粤湘桂等3省边界县域属于城镇化水平低低集聚区,位于中西部交界地区,在空间分布上与乌蒙山、武陵山、六盘山、大兴安岭南麓、滇桂黔石漠化区等集中连片特困区基本吻合,上述县域以山地丘陵为主,城镇开发建设成本高,见效周期长,经济基础薄弱,资本、技术、人才等生产要素不足,城镇化水平(0.0639~0.2213)较低。与3省、4省边界县域城镇化水平相比,两省边界县域城镇化水平较高但仍符合东中西梯度递减规律,江浙、浙闽等边界两侧县域城镇化水平(0.1245~0.5307)较高,湘赣、晋豫、湘鄂等边界两侧县域城镇化水平(0.0934~0.4118)较低,川藏、新藏等边界两侧县域城镇化水平(0.0607~0.2298)低。总之,省际边界县域接壤边界数量越多,城镇化水平越低,省际边界区县域城镇化空间的边缘性特征突出。
通过分析发现省际边界区城镇化6种驱动类型区之间存在交叉和关联,地形要素制约型类型区随时间演变城镇化空间格局分布稳定,主要分布在西部山脉广布的地区,自然生态环境承载力脆弱,社会经济发展水平较低,城镇化进程缓慢,往往也是公共服务滞后区,因此多受到政府的重视,城镇化发展主要受政府主导或社会投资拉动。区位交通主导型类型区城镇化空间格局随交通运输体系的完善逐渐呈网状分布,交通是经济发展的引擎,区位交通好的地区经济发展较快,城镇化水平较高,因此城镇化受区位交通主导的地区亦是经济发展拉动型类型区。经济发展拉动型类型区城镇化空间格局稳定,主要分布在城市群周围,受其辐射带动城镇化发展,由于经济发展受到资源禀赋、产业结构、交通、政府等多种因素共同作用,城镇化水平受经济发展拉动的地区可能是区位交通主导,也可能是政府主导。
4.2 结论
本文以中国887个省际边界县域为研究区,从5个维度构建评价指标体系度量其2000—2019年城镇化水平,结合空间自相关分析表征城镇化空间格局演变特征,运用地理探测器识别主要影响因素及交互关系,划分驱动类型区并提出差别化建议。结论如下:
(1)2000—2019年中国省际边界区县域城镇化水平不断提高,但受地理区位限制,城镇化增长速度较慢,整体仍处于较低水平,空间上呈现东—中—西阶梯状递减趋势。低城镇化水平县域数量不断减少,较低城镇化水平数量增加,二者占研究区县域的88%以上,广泛分布在中国的西部、中部和东北地区。中等城镇化水平县域数量由2000年41个持续增加到2019年的70个,分布较为零散。高水平和较高水平数量较少,且数量基本稳定,主要分布在京津冀、长三角、呼包鄂榆等城市群周边地区。
(2)2000—2019年省际边界县域城镇化水平呈现出显著的空间正相关性,呈现出一定程度上的集聚特征。中国省际边界县域空间自相关类型基本稳定,空间类型呈偏正态分布,31%~36%的县域为L-L类型,其次是H-H类型占研究区的18%~21%。空间关联类型高值、低值集聚化特征明显,H-H型的县域主要分布在东部沿海省份交界地区和内蒙古中西部地区,空间分布呈“T”型格局,L-L型的县域则集聚分布在西北地区、东北地区、西南地区的省际边界区。
(3)自然条件对省际边界区城镇化进程影响有所弱化,q值由0.37降至0.30,而社会经济因素对城镇化空间格局影响逐渐增强,其中经济发展类因子和交通通达性因子是省际边界区城镇化发展的主导驱动力。交互探测结果均表现出不同程度的双因子增强或非线性增强。省际边界区城镇化空间格局演变是在经济发展和交通水平主要驱动和直接作用下,医疗水平、社会投资和自然条件次要驱动和直接作用以及政府行为与教育服务间接作用后的结果。
(4)按照主导因素将省际边界区划分为地形要素制约型、区位交通主导型、经济发展拉动型、社会投资拉动型、公共服务滞后型和政府主导型6类驱动类型区,且6类驱动类型区之间存在交叉和关联。
(5)省际边界区城镇化发展具有空间近邻效应,距离发达地区城市群近的县域城镇化水平高。省际边界区县域城镇化空间的边缘性特征突出,省际边界县域接壤边界数量越多,城镇化水平越低。
本文主要对省际边界区城镇化空间格局演变及其影响因素进行分析研究,并对研究区内部城镇化空间格局进行讨论分析,总结得到省际边界区城镇化具有空间近邻性和边缘性特征。对省际边界区和其他地区城镇化对比讨论,也可以总结省际边界区城镇化演变的特征,这将是团队下一步工作的重点之一。由于省际边界区大部分是山地区域,在今后研究中将继续研究中国山地城镇化空间格局。
参考文献
Spatial pattern and influencing factors of urbanization development in China at county level: A quantitative analysis based on 2000 and 2010 census data
中国县域城镇化发展格局及其影响因素: 基于2000和2010年全国人口普查分县数据
DOI:10.11821/dlxb201604007
[本文引用: 4]

利用2000 和2010 年中国人口普查分县数据,借助空间分析方法揭示近期中国常住人口城镇化格局特征及其动态变化,结合多元回归模型探讨城镇化空间分异的主要影响因素,基于主成分分析和聚类分析进行中国城镇化发展类型区划分。结果表明:① 2000-2010 年,中国常住人口城镇化率不断提高,年均增加1.3 个百分点,32%的县域城镇化水平年均增长超过1.5 个百分点;② 中国城镇化发展存在区域差异性和“低快高慢”的收敛性,东部、东北、中部、西部四大区域城镇化率年均分别增加1.4、0.5、1.4 和1.3 个百分点;③ 60%的中国县域城镇化发展集中在低城镇化率—高增长率、低城镇化率—中高增长率和低城镇化率—中增长率三种类型,且以中、西部地区分布最为密集;④ 中国县域城镇化格局基本未变,仍以珠三角、长三角、京津冀三大增长极的城镇化发展较为突出,东部地区及内陆省会城市周边的城镇化水平也相对较高;⑤ 经济发展水平、产业结构特征、人力资本状况、人口集聚能力、公共服务水平、地理区位特征对县域城镇化空间分异具有显著而稳健的影响;⑥ 中国城镇化格局可分为具有明显区类一致性和区外异质性的5 大类、20 个区域。新时期的城镇化发展应凸显地域功能、提升承载能力、夯实产业基础、强调节约集约。
Research of administrative border regions
行政边界区域刍论
Characteristics and driving factors of urban spatial expansion in inter-provincial border areas: Take the Golden Triangle of Shanxi, Shaanxi and Henan Yellow River as an example
省际边界区城市空间扩展特征及驱动因素研究: 以晋陕豫黄河金三角地区为例
Opinions of the CPC Central Committee and the State Council on establishing a more effective new mechanism for regional coordinated development. Bulletin of the State Council of the People's Republic of China
中共中央国务院关于建立更加有效的区域协调发展新机制的意见
Slums, allocation of talent, and barriers to urbanization
Urbanization by implosion
DOI:10.1016/S0197-3975(02)00069-3 URL [本文引用: 1]
Cities and growth: Theory and evidence from France and Japan
DOI:10.1016/S0166-0462(97)80005-1 URL [本文引用: 1]
South African urbanisation dynamics and the normalisation thesis
Urban sprawl and its impacts on land use change in Central Ethiopia
Urbanization and socioeconomic status in the European regions: The role of population ageing and capital city regions
DOI:10.1080/09654313.2013.812063 URL [本文引用: 1]
Driving factors of urban sprawl in Giza Governorate of Greater Cairo Metropolitan Region using AHP method
DOI:10.1016/j.landusepol.2016.07.013 URL [本文引用: 1]
Smart sustainable cities of the future: An extensive interdisciplinary literature review
DOI:10.1016/j.scs.2017.02.016 URL [本文引用: 1]
Urbanization, inequality, economic development and ecological footprint: Searching for turning points and regional homogeneity in Africa
Modelling the dynamic linkages between eco-innovation, urbanization, economic growth and ecological footprints for G7 countries: Does financial globalization matter?
Analysis of new urbanization's spatial pattern evolution and influence factors in China
DOI:10.13249/j.cnki.sgs.2016.01.008
[本文引用: 7]
The comprehensive level of new urbanization in 285 prefecture level cities of 2003-2012 was measured, and the spatial pattern of its evolution was analyzed. Based on reverse distance square weight matrix, this article tested the spatial correlation, established the spatial econometric model to analyze its influencing factors. The conclusions were as follows: in general, the spatial pattern of new urbanization showed a decreasing trend from east to west, continuously expanded to the inland area, and the level of big cities obviously was higher than the small and medium-sized cities; new urbanization level of cities had obvious spatial autocorrelation. Labor, investment, economic development, government capacity, infrastructure and industrial structure all played positive roles in promoting new urbanization. Economic development, labor and infrastructure had a positive and significant spatial spillover effect, the others showed a negative spillover. SDM model revealed that the local explanatory variables and surrounding areas variables affected new urbanization. Based on this, this article put forward some specific policy recommendations for new urbanization in China to provide a theoretical basis.
中国新型城镇化的空间格局演变及影响因素分析: 基于285个地级市的面板数据
DOI:10.13249/j.cnki.sgs.2016.01.008
[本文引用: 7]
对中国2003~2012年285个地级市的新型城镇化水平进行测度,对其空间格局的演变进行深刻剖析。基于距离平方倒数权重矩阵,检验空间相关性,建立空间计量模型分析其影响因素,得出以下结论:① 新型城镇化的空间格局总体呈东高西低态势,且不断向内陆地区扩展,大城市水平明显高于中小城市;② 中国城市的新型城镇化水平具有明显的空间相关性,劳动力、投资水平、经济发展、政府能力、基础设施以及产业结构均起到正向的促进作用,且经济发展、劳动力与基础设施具有显著的正向空间溢出效应,其他几个变量均为负溢出。③ 估计效果最好的SDM模型显示不仅是本地区解释变量,还包括周边地区的相关变量都会影响各城市新型城镇化进程。
The spatial characteristics and formation mechanism of the county urbanization in China
DOI:10.11821/xb201208001
[本文引用: 2]
The spatial and temporal characteristics and the formation mechanism of the county urbanization in China since 1990 were analyzed systematically, using the methods including regional differences, transect and geography detectors. Results show that the temporal and spatial differences of the county urbanization were significant. The "herringbone" shape region pattern of high county urbanization was gradually highlighted, which were made by the counties along the north border and in eastern coastal areas. The county urbanization process of some regions were accelerated and enhanced, including Wuhan metropolitan region, Chengdu-Chongqing region and Guanzhong-Tianshui region. The low county urbanization level was maintained in Southwest China and Qinghai-Tibet Plateau regions. The differences of urbanization and the change rate of county urbanization were converged in China after 2000, but the rate has slowed down since 2000. The county urbanization trend of transects were significantly different, including Lianyungang-Lanzhou railway and Lanzhou-Urumqi railway transects, the Yangtze River transect, the border of north China transect, 106 National Road transect, and the eastern coastal transect. There are many factors affecting county urbanization, mainly including economic development stage, the level of secondary and tertiary industries, rural net income per capita, population density, leading position of grain production, demographic statistics and special arrangements for counties. The high county urbanization in northern border regions was a typical type of statistical unrealistically high urbanization. In the future county urbanization development should follow the geographical differences, highlight its leading function, and adopt multiple urbanization development models such as promoting urbanization intensively in key urban economic development areas, separating urbanization in cropland and grain producing areas, migrating urbanization in ecological and water resource protection areas, suburban areas and urban-based urbanization and other leading county urbanization patterns.
中国县域城镇化的空间特征与形成机理
DOI:10.11821/xb201208001
[本文引用: 2]
本文综合运用样带、地统计、地理探测器等多种研究方法, 分析了1990 年以来中国县域城镇化的时空特征及形成机理。研究表明:①中国县域城镇化水平时空动态的差异特征显著, 北方边境县域高城镇化和东部沿海县域高城镇化形成的“人字形”空间形态逐渐凸显;以武汉都市圈为中心的两湖地区、成渝地区、关中—天水经济区的县域城镇化水平提升较快, 西南地区、青藏高原地区保持较低的城镇化水平;②2000 年以来中国县域城镇化水平及其变化速度的区域差异逐渐缩小, 陇海兰新线、长江沿线、北方边境、106 国道、东部沿海样带县域城镇化差异明显;县域经济发展阶段、固定资产投资、离中心城市距离、二三产业水平、农民人均纯收入、人口密度是影响县域城镇化空间分异的主要因素, 同时粮食生产主导定位、非农业人口统计口径、城镇设置标准等因素也影响县域城镇化水平及发展过程。未来城镇化发展应遵循地域差异, 凸显主导功能, 推进优化与重点发展区的集约型城镇化、耕地与粮食主产区的分流型城镇化、生态与水源保护区的迁移型城镇化, 以及园区与城镇近郊区的融入型城镇化, 实现城乡土地资源集约利用, 促进城镇化进程中人—地—业耦合与协调发展。
The comprehensive evaluation of China's urbanization and spatial difference in provincial level
中国省际城镇化综合水平及其空间分异
Evolution characteristics of slope spectrum and slope-climbing effects of built-up land in China
DOI:10.11821/dlxb202107013
[本文引用: 1]
The changes in the scale and structure of built-up land is the basis for spatial development and planning of the national territory. Previous studies mainly focused on the characteristics and patterns of the horizontal expansion of built-up land, but little attention has been given to the "three-dimensional" gradient characteristics and effects of built-up land (such as slope-climbing). Therefore, based on Google Earth Engine, this study, for the first time as far as we know, uses DEM and land use data to draw built-up land slope spectrums and calculates the average built-up land climbing index (ABCI). The gradient characteristics and laws of the slope climbing of China's built-up land from 1990 to 2018 at the national, regional, provincial, and urban scales are systematically analyzed and the various spatial effects are explored. The results show that: (1) From 1990 to 2018, the area of built-up land with slope angle above 5° in China increased by 1.43 times, and the proportion of the total built-up land area rose from 10.25% to 14.81%. Particularly, the 2010-2015 period witnessed the fastest and largest slope-climbing development of built-up land in China. Moreover, the slope-climbing intensities in the central and western regions are higher than that in other regions. (2) According to the average built-up land climbing index (ABCI) and the upper limited slope angle change (ULSC), the 34 provinces (autonomous regions and municipalities) in China can be divided into three types: high-climbing, low-climbing, and horizontally expanding. Among them, the number of high-climbing provinces accounts for more than 50% of the total. And seven horizontally-expanding provinces present the distribution characteristics of "southeast-northwest" in space. (3) Before 2010, the cities with slope-climbing phenomenon were mainly mountainous cities. However, ethnic minority settlements and low-hill and gentle slope development pilot cities became the main force for the slope-climbing of built-up land after 2010. (4) The slope-climbing of built-up land can reduce the occupation of plain arable land and ecological land by built-up land expansion to a certain extent, and thus alleviate the contradiction between supply and demand of build-up land. However, it is worth noting that development and construction without reasonable plans and bulldozing mountains to build cities driven by real estate can also lead to increased geological disasters and ecological risks.
中国建设用地的坡谱演化规律与爬坡影响
DOI:10.11821/dlxb202107013
[本文引用: 1]
城镇建设用地规模与结构变化是国土空间开发与规划研究的基础。以往相关研究更关注建设用地水平空间扩张格局特征与模式,极少关注建设用地三维梯度上的“爬坡”特征规律与影响。因此,本文基于Google Earth Engine(GEE),并结合高精度地形数据与土地利用数据,在建设用地坡谱概念基础上,首次构建了平均建设用地爬坡指数(ABCI),系统地分析了1990—2018年中国建设用地坡谱在国家、区域、省级和城市4个尺度上的变化特征与规律并深入剖析建设用地爬坡的空间影响。结果显示:① 1990—2018年中国坡度5°以上地区建设用地面积增长了1.43倍,比例由10.25%上升至14.81%。其中2010—2015年是建设用地爬坡发展最迅速与规模最大的时期,且中西部地区建设用地爬坡最为显著。② 依据平均建设用地爬坡指数与上限坡度变化,可将中国34个省(自治区、直辖市)划分为高爬坡型、低爬坡型和水平扩展型3类,其中高爬坡型省份占50%以上,水平扩展型省份仅有7个,在空间上呈现“东南—西北”的两极分布特征。③ 1990—2010年爬坡型城市以山地与丘陵地貌城市为主,2010年后少数民族聚居区及低丘缓坡开发试点城市成为建设用地爬坡的主力。④ 建设用地爬坡在一定程度上能够减少建设用地扩张对平原优质耕地与生态用地的胁迫和侵占,缓解建设用地供需矛盾,但是无规划约束的开发和房地产驱动的“削山造地”则会导致地质灾害和生态环境风险的增加。
The strategic effect and general directions of urbanization in mountain areas of China
我国山区城镇化的战略影响及其发展导向
Spatial differentiation and its influencing factors of settlements evolution in mountainous counties: A case study of Songxian county in western Henan province
DOI:10.11821/dlyj201812008
[本文引用: 2]
Combining GIS spatial analysis, topographic relief degree, terrain niche index and other methods, this paper analyzes the spatial differentiation of settlements evolution in Songxian, based on the settlement patches data of the county in 1975, 1995 and 2015. We then examine their influencing factors as well as their changes by using factor analysis, geographic detector and multiple regression analysis method. The results showed that: (1) The number of settlements decreased nearly a quarter while their scale increased more than 1.2 times over the past 40 years, however, the number during 1975-1995 reduced more than that from 1995 to 2015, while the scale expansion was more significant during the period 1995-2015. (2) Restricted by mountain topography, the settlements were mainly distributed along the main roads and rivers like ribbons, as well as distributed along the county seat and township sites forming massive texture, and their evolution followed strong path dependence; The settlements tended to be located on low land, smaller topography, gentle slope and small relief, or more settlements concentrated in the hilly region, flat and slightly undulating topography, and the areas where the slope degree is less than 6° and the terrain niche index less than 0.4. In addition, the south slope directivity of settlements' location and the south slope, southeast slope and southwest slope directivity of settlement scale's spatial distribution was gradually strengthened. (3) The location of settlements was mainly affected by topography, production conditions and the radiation effects of roads, town centers, township sites as well as proximity to industrial and mining enterprises. However, with the passage of time, the effects of topography were weakened while the impact of roads and township centers was gradually strengthened. (4) The spatial distribution of settlements scale was obviously affected by natural, social and economic factors, but the explanation effect of each factor changes over time; Among them, the influence of topography standed at the top, followed by the distance to township sites and county seat in social economic factors, but with the accelerating process of urbanization, the influence of the county center was gradually strengthened, while the influence of township sites and terrains was gradually weakened. Finally, based on the above research, some suggestions were proposed for future development and planning of the mountainous rural settlements.
山区县域聚落演化的空间分异特征及其影响因素: 以豫西山地嵩县为例
DOI:10.11821/dlyj201812008
[本文引用: 2]
综合运用GIS空间分析、地形起伏度和地形位指数等方法,分析了1975-2015年嵩县聚落演化的空间分异特征,进而运用因子分析、地理探测器和多元回归分析方法研究了影响因素及其变化。得出:① 40年间嵩县聚落数量减少了将近四分之一,而聚落总规模增加1.28倍,其数量减少量以1975-1995年阶段居多,规模扩张程度以1995-2015年阶段更为显著。② 受山区地形限制聚落在空间上多沿道路和河流呈条带状分布,沿县城和乡镇中心呈团状分布,且随时间变化具有很强的路径依赖性;聚落空间分布呈现明显的低地、小地形起伏、平缓坡度和小地形位指向性,且随时间趋于向丘陵、平起伏和微起伏、坡度
Measurement of coordination level between new urbanization and rural revitalization in Gansu Province and its influencing factors
DOI:10.7522/j.issn.1000-694X.2021.00136
[本文引用: 1]
In the context of the realization of the task of poverty alleviation in the new era, improving the coordinated development level of new urbanization and rural revitalization is conducive to consolidating and expanding the achievements of poverty alleviation in Northwest China, continuously enhancing the endogenous development power, and accelerating its integration into the new pattern of western development. In view of this, the improved coupling coordination degree model is used to quantify the coordinated development degree of new urbanization and rural revitalization in Gansu Province, and the influencing factors of their coupling coordination degree are studied combined with panel Tobit model. The results show that: (1) The spatial distribution of new urbanization and rural revitalization is basically the same, which generally presents the spatial development pattern of Hexi region > central Gansu region > southeast Gansu region > southern ethnic minority region. (2) During 2013-2018, the coordinated development effect of new urbanization and rural revitalization in the whole province, Hexi region, central Gansu region and southern ethnic areas has gradually increased. The coupling and coordinated development shows the spatial differentiation characteristics of strong northwest and weak southeast. The coupling and coordination level of Hexi and central Gansu region is significantly higher than that of southeast and southern ethnic areas. (3) There are fewer cities and prefectures with the synchronous development of new urbanization and rural revitalization, and the cities and prefectures with lagging rural revitalization have increased significantly, which are concentrated in central Gansu and southeast Gansu region. (4) Government capacity, industrialization and transportation infrastructure level play a positive role in promoting the coupling and coordination level of the two, while fixed asset investment and urban-rural income gap are not conducive to the coordinated development of new urbanization and rural revitalization. The factors affecting the coupling coordination degree of the two have obvious regional heterogeneity.
甘肃省新型城镇化与乡村振兴协调水平及其影响因素
DOI:10.7522/j.issn.1000-694X.2021.00136
[本文引用: 1]
在新时代脱贫攻坚任务实现的背景下,提升新型城镇化与乡村振兴协调发展水平,有利于西北地区巩固拓展脱贫攻坚成果、持续增强内生发展动力并加快融入西部大开发新格局。鉴于此,运用改进的耦合协调度模型对2013—2018年甘肃省新型城镇化与乡村振兴的协调发展程度进行量化,并结合面板Tobit模型对二者耦合协调度的影响因素进行研究。结果表明:(1)新型城镇化与乡村振兴的空间分布基本一致,大体上呈现河西地区>陇中地区>陇东南地区>南部民族地区的空间发展格局。(2)全省、河西地区、陇中地区及南部民族地区新型城镇化与乡村振兴的协调发展效应逐步增强,耦合协调发展呈现西北强东南弱的空间分异特征,河西和陇中地区耦合协调水平明显高于陇东南及南部民族地区。(3)新型城镇化与乡村振兴同步发展类型的市州较少,乡村振兴滞后型的市州明显增加,并且集中分布于陇中地区及陇东南地区。(4)政府能力、工业化及交通基础设施水平对二者耦合协调水平具有正向促进作用,而固定资产投资和城乡收入差距则不利于新型城镇化与乡村振兴的协调发展。影响二者耦合协调度的因素具有明显的区域异质性。
Spatio-temporal evolution of towns in China under the background of rapid urbanization
快速城镇化背景下中国小城镇时空演变及影响因素
The CPC Central Committee and the State Council issued The National New Urbanization Plan(2014-2020)
中共中央国务院印发《国家新型城镇化规划(2014—2020年)》
Cognition and construction of the theoretical connotation for new-type urbanization with Chinese characteristics
DOI:10.11821/dlxb201904002
[本文引用: 1]
Since the reform and opening up, China's rapid urbanization has boosted the development of economy and society, but it is also confronted with tremendous challenges. The multidisciplinary research has promoted the issue of National New-type Urbanization Planning, which indicates the transformation of China's urbanization strategy. Further research, however, is needed to explore the theoretical construction of China's new-type urbanization. The paper summarizes the development process of China's urbanization and points out its characteristics, which includes peri-urbanization, special national conditions, complicated factors and governance system. China's urbanization makes a great contribution to the world. Moreover, the literature demonstrates the significance of urbanization to the discipline of human and economic geography and the scientific connotations of new-type urbanization, which refers to peiple-oriented, harmonious, inclusive and sustainable. Under the background of the humanism transformation, new-type urbanization should transform from population urbanization to people-oriented urbanization. There are six crucial scientific issues: people-oriented urbanization and equalization of basic public services, urbanization with integrated and coordinated development of urban and rural, urbanization in the context of resources and environment carrying capability and climate change, diverse regional modes, spatial effect and mechanism, as well as big data and innovation of technical methods. The paper makes efforts to illustrate a framework of China's new-type urbanization connotation, which provides references for theoretical research and policy formulation.
中国特色新型城镇化理论内涵的认知与建构
DOI:10.11821/dlxb201904002
[本文引用: 1]
改革开放以来,中国快速城镇化既推动经济社会大发展,也面临巨大挑战。跨学科视野下,围绕城镇化问题的争论和持续研究对国家新型城镇化规划产生重要影响,也标志着中国城镇化方向的重大调整。但对中国特色新型城镇化的科学认知和理论挖掘仍不充分。本文归纳了中国城镇化发展的简要历程,指出半城镇化、特殊国情、复杂因素及治理体系交织的中国城镇化特征,阐明了中国城镇化对世界的巨大贡献,论述作为最显著的人文空间过程的城镇化对人文与经济地理学的学科意义,并解读了新型城镇化认知与建构的4个方面理论内涵:人本性、协同性、包容性和可持续性。伴随结构主义向人本主义发展理念的转变,新型城镇化应逐步实现从“人口城镇化”到“人的城镇化”的转变,其中有6个关键议题:人的城镇化与基本公共服务均等化、城镇化城乡综合过程与协同研究、资源环境承载与气候变化适应下的城镇化、多样化区域模式、城镇化人文社会空间效应及机制、大数据与技术方法创新。本文尝试构建中国特色的新型城镇化理论内涵的认知框架,以期为新型城镇化理论研究和政策实践提供借鉴。
Transformation strategy and development mode of China's new urbanization
中国新型城镇化转型发展战略与转型发展模式
The coupling coordination development between urbanization and economic growth and its influencing factors in China
中国城镇化与经济增长的耦合协调发展及影响因素
Interaction between urbanization and eco-environment in Tibetan Plateau
DOI:10.11821/dlxb202007005
[本文引用: 3]
Scientifically assessing the interaction between urbanization and eco-environment in the Tibetan Plateau is critical for optimization of urbanization speed and quality, and for the restoration and improvement of the eco-environment. Based on previous studies about the interaction between urbanization and eco-environment in the Tibetan Plateau, we established complete analysis models to examine the overall process, including comprehensive evaluation index analysis, coupling coordination degree measurement, coupling type identification, decoupling path exploration, and future trend prediction. We used a multi-scale comparison analysis method to clarify the differences between scales (across the Tibetan Plateau and its provinces and prefecture-level cities), identify the problem regions, and propose customized improvement measures. Here we show that the comprehensive evaluation index of urbanization has experienced a staged upward trend in different scales, and the overall urbanization index of Qinghai is higher than that of Tibet. However, the changing trends of the eco-environment index are different. The changes in eco-environment index of Qinghai show a decreasing trend, whereas Tibet's changes tend to be stable. The eco-environment index of prefecture-level cities is stratified. We also found that the changing trends of coupling coordination degree of urbanization and eco-environment in different scales were overall rising. The coupling type has changed from imbalanced recession type to nearly imbalanced recession type, and finally to grudgingly coordinated development type. However, most of these types are lagged urbanization types. The alternate change trend between strong decoupling and weak decoupling indicates a negative interaction between urbanization and the eco-environment at different scales. Thus, it can be inferred that the lagged urbanization is a prominent phenomenon. The result of predication shows that in the next 10 years the coupling coordination degree of urbanization and eco-environment will increase steadily in all geographic units, but there will be a gap in the growth rate.
青藏高原城镇化与生态环境交互影响关系分析
DOI:10.11821/dlxb202007005
[本文引用: 3]
科学评估青藏高原城镇化与生态环境交互影响的总体状况,对优化城镇化速度和质量,修复和提升生态环境状态具有重要意义。在梳理青藏高原城镇化与生态环境交互影响研究进展基础上,本文尝试构建一套完整的城镇化与生态环境交互影响分析模型体系,实现从综合评价指数分析、耦合协调度量化、耦合类型识别、解耦路径探索到未来趋势预测的全过程解析。以青藏高原及其省域、地级单元多尺度分析对比为手段,尝试厘清尺度之间的差异性,识别出问题区域,并提出针对性的改进措施。研究发现,青藏高原不同尺度间城镇化综合评价指数呈阶段性上升趋势,青海的整体城镇化指数高于西藏;生态环境指数变化趋势不同,青海呈下降态势,西藏则趋向平稳,各地级单元生态环境指数存在分层现象。青藏高原不同尺度城镇化与生态环境耦合协调度总体呈上升趋势,协调类型由失调衰退类向濒临失调衰退类转变,最后转为勉强协调发展类,基本属于城镇化滞后型。城镇化指数与生态环境指数呈现出强脱钩、弱脱钩交互出现的波动态势,说明不同尺度间存在城镇化与生态环境的负相互作用,消极城镇化现象突出。通过预测,青藏高原各地级单元在未来10年内,系统耦合协调度将稳步上升,但各地增长速度将存在显著差距。
Study on coupling coordination degree between basic public service and new-type urbanization in Beijing-Tianjin-Hebei Urban Agglomeration
京津冀城市群公共服务与新型城镇化耦合发展研究
Exploring the problems and countermeasures of resources and environments in the process of new urbanization in China
新型城镇化所存在的资源环境问题及对策初探
Strategy problem of new urbanization in big urban agglomeration
大城市群内新型城镇化发展的策略问题
The 14th Five-Year Plan for the National Economic and Social Development of the People's Republic of China and the Outline of Long-term Goals for 2035
中华人民共和国国民经济和社会发展第十四个五年规划和2035年远景目标纲要》
Spatial pattern evolution of China provincial border counties economic disparity
中国省际边缘县域经济差异空间格局演变
Spatial heterogeneity analysis of regional economic development and driving factors in China's provincial border counties
DOI:10.11821/dlxb201806006
[本文引用: 2]
The economic development difference index and spatial autocorrelation model is used to analyze the different patterns of economic development in China's provincial border counties. And the spatial heterogeneity of regional economic development and its driving factors were studied by using Ordinary Least Square (OLS) and geo-weighted regression model (GWR). The results show that the counties' economic development of the provincial border areas in China has significant spatial agglomeration, and the areas with large differences in border economic development are concentrated in the border areas such as Inner Mongolia-Gansu, Inner Mongolia-Ningxia, Shaanxi-Inner Mongolia and other border areas. There is a negative correlation between the macroeconomic regulation and the economic development of the western region. The influence of educational development level on county economic disparity shows the regional differentiation of poverty and developed counties. There is a positive correlation between the compactness of the boundary, the terrain fluctuation degree and the provincial economic development at the provincial boundary. Traffic dominance and industrial structure factor show a positive correlation trend in terms of the difference of county economic development. This paper analyzes the differences between the influencing factors and the direction of the impact of different factors on the development index of county economic development in different counties. It provides scientific basis for rationally regulating the elements of development in different regions, narrowing the economic development differences in the border areas and setting up different provincial border development strategies.
中国省际边界区县域经济格局及影响因素的空间异质性
DOI:10.11821/dlxb201806006
[本文引用: 2]
通过构建省际边界区经济发展差异指数,结合空间自相关模型对省际边界区县域经济发展差异格局进行分析,并利用全局回归(OLS)模型和地理加权回归模型(GWR)对省际边界县域经济发展差异影响因素的空间异质性进行研究。结果表明,中国省际边界区县域经济发展具有显著的空间集聚性,边界经济发展差异较大的地区集中在蒙甘边界,蒙宁边界和陕蒙边界地区。政府宏观调控因子与西部地区县域经济发展差异呈负相关趋势,教育发展水平对县域经济发展差异影响呈现出贫困与发达地区二元分异,边界的紧凑度、地形起伏度、交通优势度与产业结构因子对县域经济发展差异指数呈现出正相关趋势。本文具体分析了在不同省际边界县域内,各影响因素对县域经济发展差异指数的影响程度差异和作用方向差异,为合理调控不同地区发展要素、缩小省际边界地区经济发展差异、制定不同省际边界县域发展策略提供科学依据。
Spatio-temporal pattern and driving forces of urbanization in China's border areas
DOI:10.11821/dlxb202008004
[本文引用: 4]
Border area is not only an important gateway for inland opening-up, but also an critical part in the building of a moderately prosperous society and optimizing national urban spatial pattern in China. Due to the location, natural resources endowment, and traffic accessibility, the urbanization development is relatively slow in border areas. Therefore, border area is a special area that should be given close attention, especially under the background of the Belt and Road Initiative and China's regional coordinated development program. Based on the county-level data from 2000 to 2015, this paper tries to analyze the spatio-temporal pattern of urbanization in 134 border counties, and applies the geographical detector method to study the driving forces of urbanization in border areas. Conclusions are as follows: (1) From 2000 to 2015, urbanization rate in border areas was lower than the national average, and the gap was widening. Some border counties in southern Xinjiang, Tibet, northeast of Inner Mongolia, and Yunnan, are even facing the problem of population loss. (2) In the same period, urbanization rate in the northwestern and southwestern borders is low, but it grows relatively fast compared with other border counties; urbanization rate in Tibetan border area is the lowest and grows relatively slowly; urbanization rate in the northeastern and northern border areas is slightly higher, but it grows slowly or even stagnates. (3) Transportation and industry are the important driving forces of urbanization in border areas, while the driving forces of market is relatively weak. And there are obvious mutual reinforcements among the driving forces, while the effort of resource force increases obviously after interaction. (4) Urbanization rate in the northwestern and southwestern border areas grows relatively fast, with industrial power and transportation power, market power and administrative power as the main driving forces. Tibetan border area has the lowest urbanization rate and growth rate, as the driving force of urbanization with strong contribution has not yet formed in Tibet. In the northeastern and northern border areas, the contribution of transportation power to urbanization is greater than that of other forces, and its interaction with market and industry has obvious effects on urbanization.
中国边境地区的城镇化格局及其驱动力
DOI:10.11821/dlxb202008004
[本文引用: 4]
边境地区是内陆对外开放重要门户,也是全面建成小康社会、优化城镇空间格局的重要组成。本文深入分析2000—2015年中国134个边境县域的城镇化发展格局,基于边境地区城镇化特征构建驱动力体系,并运用地理探测器探析边境地区城镇化驱动机制。研究发现:① 2000—2015年边境地区城镇化水平长期低于全国平均水平且差距不断拉大,面临城镇化发展滞后、动力不足的困境。② 同期,西北、西南边境的城镇化水平偏低、但增速较快;西藏边境的城镇化水平最低、增速平缓;东北、北部边境的城镇化水平稍高、但城镇化速度缓慢甚至停滞。③ 交通力和产业力对边境地区城镇化贡献最大,市场力作用较小,各种驱动力之间存在明显的相互加强作用。④ 西北、西南边境分别形成了以产业力和交通力、市场力和行政力为主要驱动力的城镇化发展机制;西藏边境的自然、社会、经济条件薄弱,尚未形成具有较强贡献作用的城镇化驱动力;东北、北部边境的交通力对城镇化贡献较大,与市场、产业的交互增强效果明显。
National borders matter: Canada-U.S. regional trade patterns
Behind the scenes: Smuggling in the Thailand-Myanmar borderland
DOI:10.5509/2015884767 URL [本文引用: 1]
Non-Europe: The magnitude and causes of market fragmentation in the EU.
DOI:10.1007/BF02707689 URL [本文引用: 1]
A strange regional economic phenomenon: Administrative region economy
一种奇异的区域经济现象: 行政区经济
Attention must be paid to the development of border areas
必须重视开发边界区
Measurement of the border effect of provincial border regions: A case study of Huai-Hai economic zone
省际边界区域边界效应的测定: 以淮海经济区为例
Research on sustainable development of the County-level boundary regions in northwest Hunan Province
湘西北县际边界地区可持续发展研究
Study on urbanization model of provincial border-regions
省际边界区域城市化模式研究
Evolution rule and optimal path of county-level economy spatial structure in Anhui provincial fringe regions
安徽省际边缘区县域经济空间结构演进规律及优化路径研究
The study on comprehensive evaluation and urbanization division at county level in China
DOI:10.11821/yj2012070013
[本文引用: 10]
The China's urbanization,which is in rapid development stage,presents significant regional inequality.Using the counties as basic units can reflect the spatial pattern of China's urbanization,raise the level of understanding of spatial inequality of China's urbanization,and be beneficial to the sound development of China's urbanization. This paper constructs a comprehensive evaluation system for China's county urbanization level in three aspects of urbanization connotation: population,economy and society.Entropy method is adopted to evaluate the comprehensive urbanization levels of 2289 county units in China and levels of their subsystems.Then we transform calculated values into urbanization rate based on min-max normalization and dimensionless method.Urbanization type regions are constructed according to the relationships between population urbanization and economic-social urbanization.The driving force of each urbanization type region is evaluated by partial correlation analysis.Finally,the method of spatial autocorrelation is used to regionalize the level of China's comprehensive urbanization,population urbanization,economic urbanization and social urbanization. The results show that population and economy are two major subtypes reflecting the comprehensive urbanization level of China;the spatial distribution of China's comprehensive urbanization represents a clear administrative hierarchy;China can be divided into four urbanization types,namely,population urbanization lag region;economic-social urbanization lag region,population and economic-social urbanization lag region and comprehensive urbanization non-lag region;spatial autocorrelation is an alternative approach for regionalization researches in the field of human geography.Regionalization of four kinds of urbanization types is different in pattern,mechanism and mode.In regionalization mode of population urbanization type regions,the northern region is higher than the southern region while in regionalization mode of economic and social urbanization type regions,the eastern region is higher than the western region.
中国县域城镇化水平的综合评价及类型区划分
Spatial pattern and its influencing factors of industrialization-urbanization comprehensive level in China at town level
DOI:10.11821/dlyj020190196
[本文引用: 3]
Based on the scale-structure-benefit index system, using multiple analysis methods, the spatial pattern characteristics and influencing factors of industrialization-urbanization comprehensive level at town level in China were analyzed. The results were shown as follows. Firstly, although the high and medium value score units were not obvious from the overall spatial pattern, these were still visible with point-like shape in the core areas of urban agglomerations in Eastern and Central China. In addition, the high and medium score units of scale level were prominent, mainly distributed in the triangle area. On the whole, the spatial differentiation characteristics of scale and benefit at town level were similar to the results of previous studies. It was worth mentioning that the southeast-northwest difference with the Hu Huanyong line was clearly visible. Secondly, the internal difference degree from low to high was Eastern China, Central China, Western China and Northeast China. From the provincial and urban cluster levels, although the gap between actual variation and ideal expectations of some provinces and urban agglomerations was quite different, the overall difference in Central and Eastern China was small. Thirdly, from the spatial autocorrelation, the significant High-High and Low-Low units of scale and benefit score were obvious, and formed a new “S”-type separation, which was different from the Hu Huanyong Line. Fourthly, from the comparison perspective, the high, and medium value units of the comprehensive and structural score at county and city levels were similar to those at town level, which were mainly distributed in the core areas of urban agglomeration regions in Eastern and Central China, and some areas were surrounded by the main economic belt and Beijing-Guangzhou axis. The difference was that the centralized agglomeration units of scale strength at county and city level extended to the region in the south of the Middle and Lower Yangtze River and formed a quadrilateral shape. Seen from both sides of the Hu Huanyong Line, the distribution pattern of scale strength at town level was similar to that at county and city levels, but not obvious in comprehensive, structural and benefit pattern. It was worth mentioning that the significant High-High units greatly changed and significant Low-Low areas markedly reduced, and their overall agglomeration pattern became a little scattered. Finally, we found that economic strength, non-agricultural process, towns' modernization level, topographical conditions, rooting and path dependence were the main influencing factors, which respectively played roles of foundation, process, orientation, strength support and chain conduction.
中国镇域工业化和城镇化综合水平的空间格局特征及其影响因素
DOI:10.11821/dlyj020190196
[本文引用: 3]
基于构建的“规模-效益-结构”指标体系,运用Jenks Natural Breaks分类、地理探测器、变异系数、探索性空间数据分析等方法对中国镇域工业化和城镇化综合水平的空间格局特征及其影响因素进行分析。研究表明:① 整体空间布局呈镶嵌式分布且高值连片格局不明显,但高值区在东部、中部城市群核心区的点状串联式凸显依然可见。此外,基于规模实力的中高值集聚格局,主要分布在长江以北的“三角形”区域;中低值、低值在西部的大范围绵延分布态势明显。整体而言,镇域尺度下规模、效益分异特征与以往研究类似,以胡焕庸线为分界的东南—西北差异清晰可见。② 空间内部差异度从低到高依次为东部、中部、西部和东北,与国家经济格局吻合。基于省域、城市群尺度发现,虽然部分省区、城市群内部差异与预期差别较大,但整体上依然表现出中东部内部差异较小,西部、东北乡镇实力不强且内部差异较大的客观事实。③ 从空间关联看,综合、结构水平的高值、低值集聚的格局化特征不明显,总体与空间分布格局类似;规模、效益水平的集聚格局类似且类似于已有研究,但显著LL区的集聚格局突破胡焕庸线并形成“S”型分隔,体现出镇域尺度细化后的集聚新特点。④ 从尺度对比看,县域、市域尺度下综合、结构水平的中高值分布格局与镇域尺度类似,呈现出以中东部城市群核心区、沿海与京广发展轴辐射区为表征的空间格局。不同的是,县域、市域尺度下规模实力的中高值集聚区范围扩大延伸至长江中下游以南,形成“四边形”区域。从胡焕庸线分异特征看,两者仅有规模水平分布类似,综合、结构与效益水平的分异表征不明显。从空间集聚看,显著HH区变化较大,主要表现在内蒙古、宁夏、甘肃省份的增多与连绵分布;显著LL区的分布范围明显缩小且胡焕庸一线西侧的大范围集聚区被局部打散、打乱。基于定量与定性结合的方法,从经济实力、非农化进程、乡镇现代化水平、地形地貌条件、根植性与路径依赖等方面进行影响分析,发现这五个方面分别起核心支撑、活力支撑、进程性、基础性与“链”式传导等作用。
Temporal-spatial characters and driving mechanism of new urbanization in multi-dimensional proximity in the Yangtze River Economic Belt
多维邻近下新型城镇化的时空分异特征和驱动机制: 以长江经济带为实证
Comprehensive evaluation on China's urbanization quality
中国城镇化质量综合评价
Geodetector: Principle and prospective
DOI:10.11821/dlxb201701010
[本文引用: 2]
Spatial stratified heterogeneity is the spatial expression of natural and socio-economic process, which is an important approach for human to recognize nature since Aristotle. Geodetector is a new statistical method to detect spatial stratified heterogeneity and reveal the driving factors behind it. This method with no linear hypothesis has elegant form and definite physical meaning. Here is the basic idea behind Geodetector: assuming that the study area is divided into several subareas. The study area is characterized by spatial stratified heterogeneity if the sum of the variance of subareas is less than the regional total variance; and if the spatial distribution of the two variables tends to be consistent, there is statistical correlation between them. Q-statistic in Geodetector has already been applied in many fields of natural and social sciences which can be used to measure spatial stratified heterogeneity, detect explanatory factors and analyze the interactive relationship between variables. In this paper, the authors will illustrate the principle of Geodetector and summarize the characteristics and applications in order to facilitate the using of Geodetector and help readers to recognize, mine and utilize spatial stratified heterogeneity.
地理探测器: 原理与展望
DOI:10.11821/dlxb201701010
[本文引用: 2]
空间分异是自然和社会经济过程的空间表现,也是自亚里士多德以来人类认识自然的重要途径。地理探测器是探测空间分异性,以及揭示其背后驱动因子的一种新的统计学方法,此方法无线性假设,具有优雅的形式和明确的物理含义。基本思想是:假设研究区分为若干子区域,如果子区域的方差之和小于区域总方差,则存在空间分异性;如果两变量的空间分布趋于一致,则两者存在统计关联性。地理探测器q统计量,可用以度量空间分异性、探测解释因子、分析变量之间交互关系,已经在自然和社会科学多领域应用。本文阐述地理探测器的原理,并对其特点及应用进行了归纳总结,以利于读者方便灵活地使用地理探测器来认识、挖掘和利用空间分异性。
Analysis on the coupling and coordinated development and influencing factors of new urbanization,rural revitalization and economic growth quality in Chinese provinces
中国省域新型城镇化、乡村振兴与经济增长质量耦合协调发展及影响因素分析
基于新型城镇化、 乡村振兴和经济增长质量的丰富内涵, 构建了新型城镇化—乡村振兴—经济增长质量耦合协调评价指标体系, 运用熵值法、 耦合协调度模型对 2011 - 2018 年中国 31 省区市新型城镇化 —乡村振兴—经济增长质量三系统综合发展水平及耦合协调度进行量化, 并结合面板 Tobit 模型对耦合协调度的影响因素进行研究。 结果表明: ①31 省区市新型城镇化—乡村振兴—经济增长质量三系统综合发展水平呈现显著的区域差异, 其中, 三系统综合水平都相对较高的省区市主要分布在东部地区, 而东北、 中部和西部地区三系统综合水平较低, 绝大多数低于全国平均水平。 ②全国三系统耦合协调度整体上偏低, 研究期内呈现缓慢上升并趋于稳定的发展趋势。 从空间演变来看, 耦合协调度具有显著的空间分异规律, 呈现 “东部> 中部 > 东北 > 西部” 的发展格局, 但耦合协调度的省际差异在逐步缩小, 均衡发展趋势有所显现。 ③在全国层面, 政府能力、 交通基础设施水平、 金融发展水平、 产业结构、 人口增长及劳动力质量对三系统耦合协调度具有显著的正向促进作用, 而城乡收入差距则不利于三系统的协调发展。 ④三系统耦合协调度的影响因素具有明显的区域异质性。
Spatial coupling cooperative analysis of road transport superiority and urbanization at county level in China
DOI:10.18306/dlkxjz.2016.07.002
[本文引用: 2]
With the fifth and sixth census and road network data, and using a spatial interoperability evaluation model and a spatial lag model, the spatial coupling relationship between China's road transport superiority degree and urbanization rate at the county level was analyzed. The result shows that: (1) Regional difference of China's urbanization rate is significant at the county level. Urbanization rate is low in traditional agricultural areas, poor contiguous mountainous counties (districts), and the spatial mismatch between economic development and labor resources was widespread, with urbanization taking place in areas away from residents’ place of origin in underdeveloped areas. (2) Regional difference of road transport superiority degree is clear between the eastern and western regions and between the transport hubs and peripheries, with a clear “point-axis” spatial structure at the regional level. Road transport superiority degree showed a partial normal distribution at the county level. (3) The overall coverage of highways, national highways, provincial highways, and county and township roads affects road accessibility for production flow, information flow, and non-agricultural market entrance of rural production factors, which affect urbanization development at the county level. Urbanization was obviously facilitated by the presence of highway exits and railway stations. (4) The spatial interoperability grade of road transport superiority degree and urbanization rate shows a partial normal distribution, with significantly mutual influence between urbanization and road transport development levels.
中国县域城镇化的道路交通影响因素识别及空间协同性解析
DOI:10.18306/dlkxjz.2016.07.002
[本文引用: 2]
本文基于人口普查数据和路网数据,利用空间滞后回归模型和耦合协调度模型等,对中国县域城镇化率的道路交通影响及其空间耦合协同性进行分析,研究表明:①中国县域低城镇化水平的县(区)主要集中在传统农区、集中连片贫困山区、高寒经济欠发达区。经济发展水平与人力资源空间上的错位,致使经济欠发达地区的人口倒挂,异地城市化特征显著;②中国县(区)道路交通优势度宏观上呈现出东西部区域差异和交通枢纽与外围区域的差异,“点—轴”地域结构特征显著,县域道路交通优势度数值呈现偏正态分布;③道路交通是城镇间和城镇与区域间联系的核心纽带和产业转型升级发展的传输廊道,开放式的道路系统增强了农村生产要素非农化转型的市场可介入性,对县域城镇化发展有积极作用。高速公路出口、火车站的布局对城镇化影响和带动农村要素非农化作用较为明显;④中国县域交通优势度与城镇化率耦合协调度分级分布为偏正态分布,城镇化发展与交通优势度相互影响显著,呈一定的双向耦合性。
The relief degree of land surface in China and its correlation with population distribution
DOI:10.11821/xb200710007
[本文引用: 2]
<p>The relief degree of land surface (RDLS) is an important factor in describing the landform macroscopically. Under the new proposed concept, based on the macro-scale digital elevation model data, by using ARC/INFO software, the RDLS of 10km×10km grid size is extracted and mapped in China. Then this paper systemically depicts the distribution rules of RDLS in China and its correlation with population distribution by analyzing the ratio structure, spatial distribution and altitudinal characteristics of the RDLS. The distribution rule is elaborately expatiated in three separate ways: the ratio structure, the accumulative frequency, and the change along with the longitude and latitude, which clearly reflects the regional topographic framework of China. The result shows that the majority of the RDLS is low in China, for more than 63% of the area in China with the RDLS lower than 1 (relative altitude ≤ 500 m). As for the spatial distribution, in general, the RDLS of the west is higher than that of the east and so is the south than the north. Specifically, the Hengduan Mountains and the Tianshan Mountains regions have the highest RDLS, while the Northeast China Plain, the North China Plain and the Tarim Basin have the lowest ones. The RDLS of 28<sup>o</sup>N, 35o<sup>o</sup>N and 42<sup>o</sup>N as well as of 85<sup>o</sup>E, 102<sup>o</sup>E and 115oE accords well with the three topographic steps in China. The RDLS of China decreases with the increase of longitude and the change clearly illustrates the landform characteristics that most of the mountains are located in the west and most plains in the east of China. The RDLS of China decreases with the increase of latitude as well and the trend shows that there are more mountains and hills in South China and more plains and plateaus in North China. In the vertical direction, the ratio of high RDLS increases with the increase of altitude. Finally, this paper analyzes the correlation between the RDLS and population distribution in China and the result shows that the RDLS is an important factor affecting the distribution of population and most people in China live in low RDLS areas. To be more specifically, where the RDLS is zero, the population amounts for 0.83% of the total; where the RDLS is less than 1 (relative altitude ≤ 500 m), the population reaches 20.83%; where the RDLS is less than 2, the population amounts for 97.58% of the total; and where the RDLS is bigger than 3, the population only amounts for 0.57%. That is to say, more than 85% of the population in China lives in areas where the RDLS is less than 1 and less than 1% of the population lives in areas where the RDLS is bigger than 3. The correlations between the RDLS and population distribution of eight regions in China are different. The correlation is obvious in northeast, north, central and south China, while it is nearly nonexistent in Inner Mongolia and the Qinghai-Tibet region.</p>
中国地形起伏度及其与人口分布的相关性
Spatial distribution of extreme poverty and mechanism of poverty differentiation in rural China based on spatial scan statistics and geographical detector
DOI:10.11821/dlxb202004008
[本文引用: 1]
Poverty has appeared as one of the long-term predicaments facing human development in the 21st century. The essence of extreme poverty is absolute poverty, where individuals experience long-term shortages of essential resources or suffer from harsh environment. Extreme poverty is the priority for poverty alleviation and the tough row to hoe. We select the major poverty influencing factors from natural and social factors to build an evaluation index system based on spatial poverty and related theories. First, we use Pearson correlation analysis to differentiate poverty impoverishing and alleviation factors. Then, we use GIS and back propagating neural networks to define a natural impoverishing index (NII) and social economic poverty alleviation index (SEPAI), respectively, at provincial, municipal, and county levels. We then calculate a poverty pressure index (PPI) at provincial, municipal, and county levels by combining NII and SEPAI, and explore poverty spatial characteristics. We used the flexible spatial scanning statistical method to identify the severely impoverished counties among the poverty-stricken counties with PPI>1.63, which had higher poverty rate and difficulty in poverty alleviation. Finally, we diagnose dominant factors that differentiate severely impoverished counties, and identify the dynamic mechanism of regional extreme poverty differentiation using the geodetector model. Besides, we construct a theoretical basis for anti-poverty in rural China. The results show that NII and PPI spatial distributions are highly consistent at provincial, municipal, and county levels, with a significant distribution pattern: high in eastern China and low in western China. In contrast, SEPAI has relatively low spatial consistency at provincial, municipal, and county levels. The PPI poverty distribution pattern tends toward large dispersion, small aggregation dividing across the Heihe-Bose Line. A total of 655 poverty-stricken counties were identified, mainly distributed in major ecologically functional and agricultural production areas in China. High risk areas identified by spatial scanning are mainly distributed in the northwest, southwest minority, and border areas. We also identified 208 severely impoverished counties, mostly located in inter-provincial fringe areas. The geodetector model identified seven dominant impoverishing factors, with significant differences between the four identified rural extreme poverty types: terrain detail oriented, location traffic dominated, economic income leading, and ecoenvironment constrained regions.
中国农村深度贫困的空间扫描与贫困分异机制的地理探测
DOI:10.11821/dlxb202004008
[本文引用: 1]
从自然和社会经济因素中选取贫困的影响因子,建立评价指标体系,通过Pearson相关分析确定了贫困的主要影响因素,利用GIS空间分析和BP人工神经网络,分别模拟了省域、市域和县域3个尺度下的自然致贫指数与社会经济消贫指数,进一步计算获得了3个尺度下的贫困压力指数,对其空间分布格局进行分析;借助Flexible空间扫描探测识别出深度贫困县,在此基础上运用地理探测器揭示其主导致贫因素,并提出差别化的减贫对策建议。结果表明:① 省域、市域、县域3个尺度的自然致贫指数和贫困压力指数在空间分布上具有较高的一致性,呈现出明显的“东低西高”的空间分布格局;社会经济消贫指数的空间分布一致性不高,县域尺度更为破碎。以黑河—百色线为界,县域贫困压力指数在空间上表现出“大分散、小聚集”的分布状态。识别出的全国贫困县共计655个,主要分布在重点生态功能区和农产品主产区。② 3个尺度下,空间扫描识别出的贫困高风险区主要分布在西北、西南少数民族和边疆地区。县域尺度下识别出208个深度贫困县,多位于省际边缘区。③ 地理探测器识别出深度贫困县的7个致贫主导因素,按照主导因素将深度贫困县划分为地形要素制约型、区位交通制约型、经济收入制约型和生态环境制约型4类。
