

1 引言
人口密度是单位面积上的人口数量,是表征区域人口分布特征的定量指标[1]。高分辨率人口密度数据集是揭示人口分布规律的基础依据。为在栅格尺度整合人口、资源、环境数据集,推动全球变化的定量研究工作,20世纪90年代初,HDP(The Human Dimensions of Global Environmental Change Programme)第3工作组倡议研制全球人口密度栅格数据集[2],“自上而下的人口普查数据分解算法”[3](含面积加权[4⇓⇓⇓-8]和线性回归[9⇓⇓⇓⇓⇓⇓⇓⇓⇓⇓⇓⇓-22]两类人口密度模型)率先得到了发展,GPW[7]、GHS-POP[8]、WPE[9]、HYDE[16]和LandScan[19]均是利用此类算法生产的全球人口密度栅格数据产品。2015年联合国可持续发展目标(Sustainable Development Goals, SDGs)认为,栅格人口密度模型的信度和效度亟待改进[23],与之相呼应,近年来随机森林模型在“自上而下的人口普查数据分解算法”[24⇓⇓-27]和“自下而上的人口调查数据估计算法”[28-29]中得到了广泛应用。
然而在构建人口密度随机森林模型时,下列问题并未得到妥善解决,制约了人口密度随机森林模型的信度和效度。① 训练样本的数据质量仍受可塑性面积单元问题(Modifiable Areal Unit Problem, MAUP)困扰[30⇓-32]。人口密度属于定比量化指标,改变统计单元的形状或面积,人口密度值将发生变化。人口密度随机森林模型通常以人口普查区[24⇓⇓-27]或人口调查区[28-29]为单位开展采样,此时只能借助聚合运算才能获得建模所需的训练样本数据(含人口密度和影响因子),受MAUP困扰,样本数据质量存疑[33-34]。② 模型存在区群谬误问题(Ecological Fallacy)[35]。由于人口密度随机森林模型的输入单元多为人口普查区或人口调查区,输出单元多为公里网格或公顷网格,模型的输入单元粒度远大于输出单元粒度,故模型隐含区群谬误问题。③ 模型存在混淆人口分布规律问题。以中国为例,在地域辽阔的国土中,存在众多地理区划单元[36],各区划单元的人口分布规律和影响机制存在显著差异[37⇓-39]。仅用一套训练样本构建覆盖中国的人口密度随机森林模型[24,27],会混淆不同区域(例如平原和山区)的人口分布规律[40]。④ 忽视分区遴选人口密度影响因子。由于人口密度随机森林模型属于监督模型,故引入不同的影响因子,计算所得的人口密度数据集存在显著差异。“千篇一律”的样本模式,不仅存在引入错误影响因子的风险,而且会阻碍探讨“各美其美,美美与共”的人口分布法则和影响机制[34]。
为系统破解上述问题,本文提出了一套人口密度随机森林模型优化方案。发扬地理学中国学派的区划传统,将石家庄划分为平原城镇、平原乡村、山区城镇、山区乡村4个综合禀赋区,通过分区采样,分区建模,克服人口密度随机森林模型混淆人口分布规律的问题;以公顷网格为采样单元,开展分层采样,统一模型输入单元和输出单元的粒度,规避聚合运算,避免训练样本受到MAUP问题困扰,消除模型隐含的区群谬误问题;以模型的平均拟合优度为衡量标准,系统开展递增式影响因子遴选实验;通过对10组独立的人口密度预测数据集的优化组合,提高人口密度栅格数据集的稳定性。
2 材料与方法
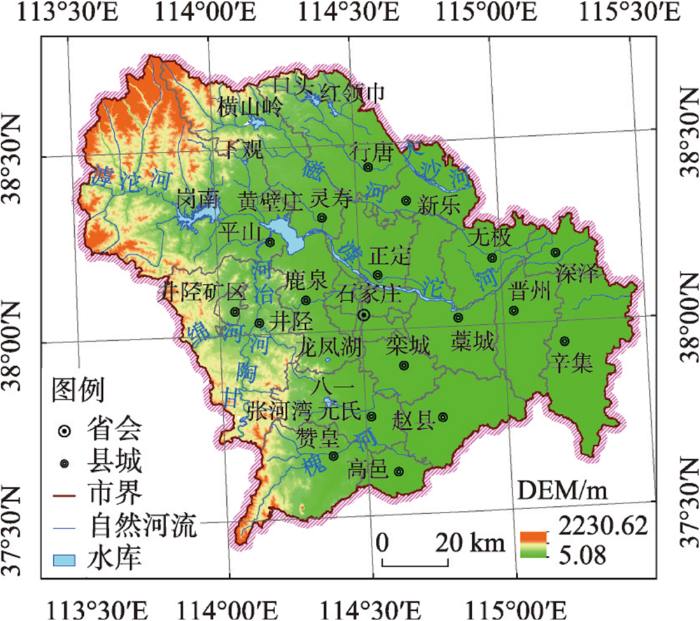
2.1 研究区概况
图1
2.2 数据来源
文中所用主要数据集详见表1。村人口数据集为2007年4月30日24时石家庄市户籍人口分村统计数据,村界、聚落数据集取自第二次全国土地调查数据集,依托上述3个数据集,利用二元加权模型,计算获得聚落人口密度数据集,是文中建模所需的人口密度标签数据集。
表1 主要数据集
Tab. 1
| 目标数据集 | 原始数据集 | 数据来源 | 处理方法 |
|---|---|---|---|
| 聚落人口密度 数据集 | 村人口数据集 | 石家庄市公安局 | 二元加权模型① |
| 村界数据集 | 第二次全国土地调查数据集 | ||
| 聚落数据集 | 第二次全国土地调查数据集 | ||
| 自然禀赋因子 数据集 | DEM数据集 | 地理国情监测云平台1∶25万DEM数据 | 投影转换和重采样[42] |
| 地形起伏度数据集 | Focalmean函数[43] | ||
| 坡度数据集 | 坡度函数[42] | ||
| 年均气温数据集 | 1971—2000年 河北省及周边气象台站气象监测数据 | Kriging插值[6] | |
| 年均降水数据集 | Spline插值[44] | ||
| 距河流距离数据集 | 2015年1∶100万全国基础地理数据库 | 欧氏距离 | |
| 距自然河流距离数据集 | 欧氏距离 | ||
| 经济禀赋因子 数据集 | 距POIs距离数据集 | 2012年百度中国POIs数据集 | 欧氏距离[34] |
| 距聚落距离数据集 | 聚落数据集 | 欧氏距离 | |
| 创新禀赋因子 数据集 | POIs核密度数据集 | 2012年百度中国POIs数据集 | 核密度[34] |
| 聚落核密度数据集 | 聚落数据集 | 核密度 | |
| 夜光影像数据集 | 2007年DMSP/OLS夜光影像数据集 | 重采样(像元大小为100 m) | |
| 分区训练样本 | 分区训练样本数据集 | 通过分层采样,每区获得10套训练样本数据集 | 分层采样 |
注:① 处理方法参考未公开发表中文期刊文献:李艳成, 温佩璋, 刘劲松. 基于聚落的人口统计数据空间分解算法。
文中从自然禀赋、经济禀赋和创新禀赋3个维度选取人口密度的候选影响因子。其中,自然禀赋因子包括海拔高度、地形起伏度、坡度、年均温、年均降水量、距河流距离(包括自然和人工河流)、距自然河流距离;经济禀赋因子包括距POIs距离、距聚落距离;创新禀赋因子包括POIs核密度、聚落核密度、夜光影像。上述数据集全部采用Albers伪圆锥等积投影。各栅格数据集均为GeoTiff格式,栅格尺寸统一为100 m×100 m,统一了各数据集的四至点坐标。
2.3 研究方法
人口密度随机森林模型的优化方案如图2所示,包括综合禀赋分区和影响因子分区遴选实验2大关键逻辑环节。综合禀赋分区强调将中国地理学的区划传统嫁接到人口密度随机森林模型的建模之中,目的在于分区建模,分区揭示人口分布规律,分区认识人口分布影响机制,以实现“各美其美,美美与共”的人口密度建模目标。人口密度影响因子分区遴选实验包括分层采样、人口密度预测数据集的优化组合、分区人口制图、模型效度检验等关键技术环节。
图2
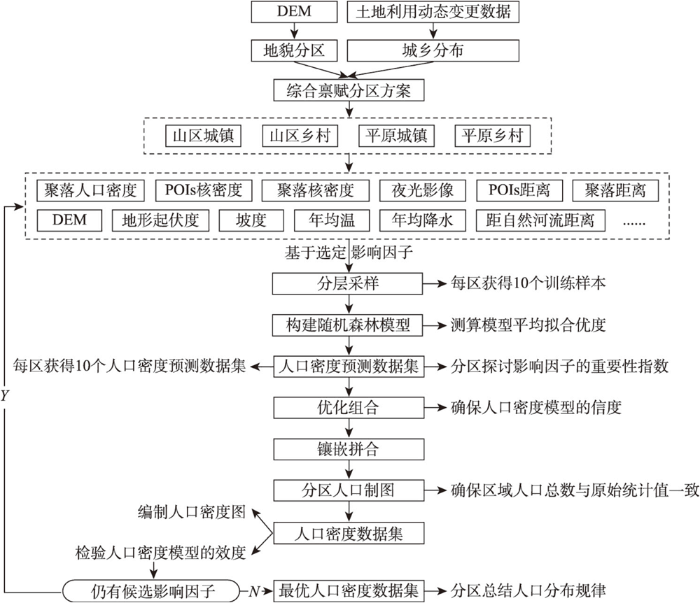
图2
人口密度随机森林模型优化流程
Fig. 2
Flow chart of the optimization of population density using a random forest model
2.3.1 综合禀赋分区
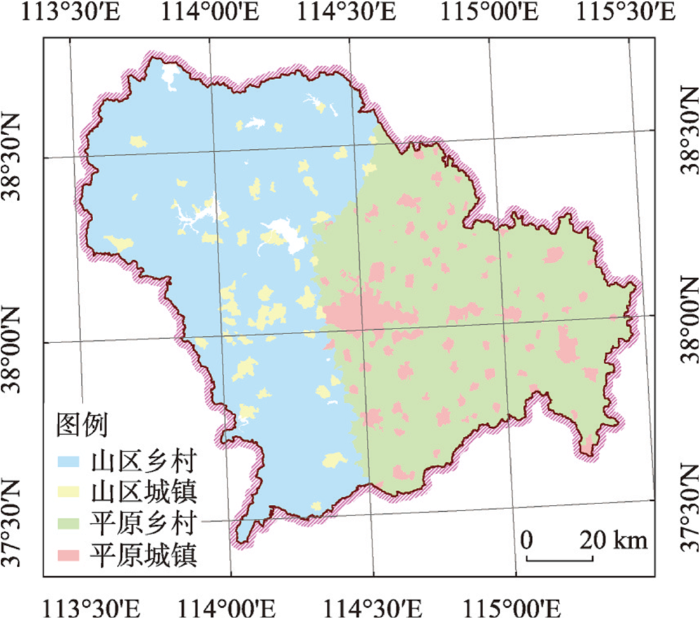
以100 m等高线为界,保持村界的完整性,将研究区分为平原和山区;将含有201城和202镇两类聚落的村和居委会设定为城镇,将只含有203村聚落的村或居委会设定为乡村;将地貌分区数据集与城乡分区数据集叠加,把研究区划分为平原城镇、平原乡村、山区城镇、山区乡村4类禀赋区,生成分区计算掩膜(图3)。综合禀赋分区划定了揭示人口分布规律和影响机制的建模单元,规定了人口密度随机森林模型的建模尺度。基于行政区划数据集(县、乡)和研究区计算掩膜,得到县级分区密度制图掩膜和乡级人口密度准则效度检验掩膜。
图3
2.3.2 分层采样
借助分层采样,构造训练样本。分层采样是依据禀赋区聚落人口密度数据集的均值和标准差,按照公式(1),将禀赋区分为若干层。
式中:i是禀赋区编号,i = 1代表山区乡村,i = 2代表山区城镇,i = 3代表平原乡村,i = 4代表平原城镇;
根据训练样本的采样规模和层面积占比,确定层采样规模。若第i个禀赋区第j层的面积为
式中:
各禀赋区随机进行10次分层采样,获取10组相互独立的训练样本。
2.3.3 拟合优度R2
拟合优度R2是检验模型效度的标准化测度指标,其计算公式如下:
式中:ρi是人口密度真实值;
R2在文中有2个作用。一是人口密度随机森林预测模型的R2,其取值范围介于负无穷和1之间。随机森林模型利用袋外样本,测算人口密度预测模型的R2。利用10个人口密度随机森林预测模型的R2的算术平均值,比较不同实验组别人口密度预测模型的拟合效果,是遴选人口密度影响因子的重要宏观量化指标。二是利用乡(或街道)真实人口统计数与人口密度数据集乡(或街道)的人口汇总数构建一元线性回归方程(公式(5)),并用R2测度人口密度数据集的准则效度,其取值范围为0~1,R2越大,表示人口密度数据集的准则效度越高,并据此与国际著名人口密度模型进行准则效度对比。
式中:i是禀赋区编号,i = 1代表山区乡村,i = 2代表山区城镇,i = 3代表平原乡村,i = 4代表平原城镇,i = 0代表研究区;
2.3.4 人口密度预测数据集的优化组合
由于人口密度随机森林模型高度依赖训练样本,若仅用一套分层采样获得的训练样本集构建人口密度随机森林模型,则无法保证人口密度预测数据集无偏。为确保人口密度预测数据集的再测信度,根据正态分布理论,优化人口密度预测模型的输出环节。首先通过分层采样,独立抽取10个训练样本集,对应构建10个人口密度随机森林模型,获得10个(n = 10)相互独立的人口密度预测数据集。
分区计算10个人口密度预测模型的平均拟合优度值,并将其作为人口密度预测模型准则效度的评价指标和构造人口密度数据集优化组合系数的评判阈值,其计算公式如下:
式中:i是禀赋区序号,i
若从各区10个人口密度预测数据集中随机抽取6个人口密度预测数据集,则理论上每个禀赋区均存在210种人口密度预测数据集的组合方案。实验表明,各分区人口密度预测数据集的210种组合的拟合优度平均值符合正态分布。当某一组合中6个人口密度预测模型的拟合优度的平均值大于10个人口密度预测模型的平均拟合优度值时,则给该组合所含各人口密度预测数据集分别累计1次,否则不累计。按这个原则,将210种组合逐个评估一遍,则某个人口密度预测数据集的优化组合系数Wi =该人口密度预测数据的有效累计次数/10个人口密度预测数据的有效累计次数之和。通过加权平均,获得各禀赋区人口密度预测数据集,将各禀赋区人口密度预测数据集拼接在一起,则获得研究区人口密度预测数据集。
式中:ρ是通过加权平均获得的某禀赋区人口密度预测最终数据集;Wi是基于某禀赋区第i个训练样本获得的人口密度预测数据集的权重;ρi是基于某禀赋区第i个训练样本所获的人口密度预测数据集。
2.3.5 分区密度制图(Dasymetric Mapping)
分区密度制图是将人口密度预测数据集转换为人口密度数据集的国际通行计算方法,借助人口密度预测数据集获得每个栅格的分配权重,从而确保人口密度数据集中每个人口统计单元(县)的人口总数与原始人口统计汇总数据相等,分区密度制图公式如下[27]:
式中:Popgrid是人口密度数据集中栅格grid的人口数(即人口密度值);Popcounty是人口密度数据集中栅格grid所属县county的原始人口统计汇总数;Wgrid是人口密度预测数据集中栅格grid的人口密度预测值;Wcounty是人口密度预测数据集中栅格grid所属县county在人口密度预测数据集中的人口汇总数;Wgrid/Wcounty实质就是county县人口统计汇总数在栅格grid的分配权重。
3 人口密度模型优化实验
3.1 遴选人口密度影响因子
3.1.1 遴选人口密度影响因子的实验方案
表2 遴选人口密度影响因子的实验方案
Tab. 2
| 实验组别 | 前测控制组 | 后测实验组 | |||||||
|---|---|---|---|---|---|---|---|---|---|
| 引入部分自然禀赋因子 | 河流距离 | 创新禀赋 | 经济禀赋 | ||||||
| 01 | A | B | C | D | E | ||||
| 02 | A | B | C | D | E | F1 | |||
| 03 | A | B | C | D | E | F2 | |||
| 04 | A | B | C | D | E | Fm | G1 | ||
| 05 | A | B | C | D | E | Fm | G2 | ||
| 06 | A | B | C | D | E | Fm | G3 | ||
| 07 | A | B | C | D | E | Fm | Gn | H1 | |
| 08 | A | B | C | D | E | Fm | Gn | H2 | |
注:A表示DEM;B表示地形起伏度;C表示坡度;D表示年均气温;E表示年均降水;F1表示距河流距离;F2表示距自然河流距离;Fm表示各区选中的河流因子(m=1或2);G1表示夜光影像;G2表示POIs核密度;G3表示聚落核密度;Gn为各区选中的创新禀赋因子(n=1或2或3);H1表示距POIs距离;H2表示距聚落距离。
表3 各禀赋区影响因子遴选实验人口密度预测模型的平均拟合优度对照表
Tab. 3
| 禀赋分区 | 自然禀赋因子 | 河流因子 | 创新禀赋因子 | 经济禀赋因子 | |||||||
|---|---|---|---|---|---|---|---|---|---|---|---|
| 前测因子 | 距河流距离 | 距自然河流距离 | 夜光影像 | POIs核密度 | 聚落核密度 | POIs距离 | 聚落距离 | ||||
| 山区城镇 | 0.135 | 0.148 | 0.142 | 0.172 | 0.180 | 0.156 | 0.185 | 0.525 | |||
| 山区乡村 | -0.093 | -0.079 | -0.084 | -0.063 | -0.068 | -0.075 | -0.068 | 0.533 | |||
| 平原城镇 | 0.164 | 0.178 | 0.220 | 0.236 | 0.263 | 0.240 | 0.265 | 0.515 | |||
| 平原乡村 | -0.109 | -0.089 | -0.097 | -0.092 | -0.087 | -0.080 | -0.080 | 0.711 | |||
图5
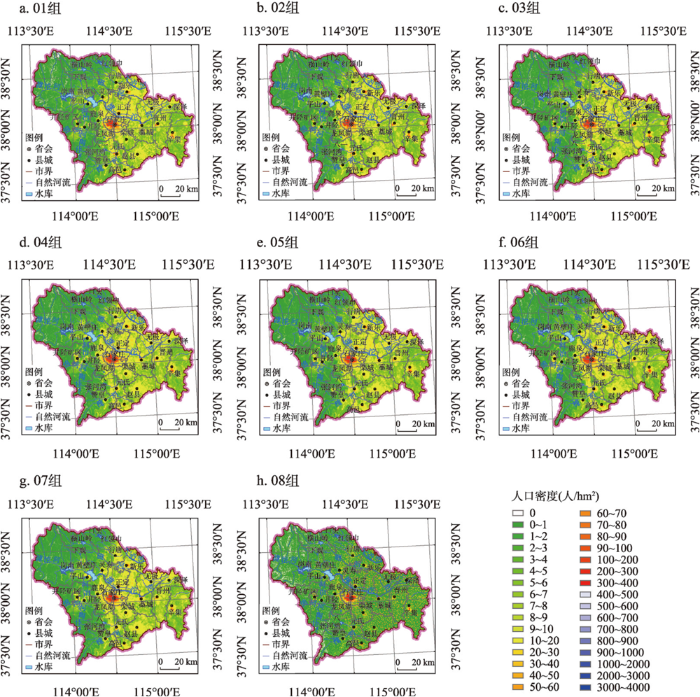
图5
01~08组实验所获石家庄人口密度预测数据集
Fig. 5
Datasets of the predicted Shijiazhuang population density for experiments from groups 01 to 08
依据演化经济地理学理论,农业文明时代人口分布受自然河流显著影响,山区人口呈现逐水而居的特征,平原人口则避水而居[24],因此在01组实验(即前测实验1)中,将A(海拔高度)、B(地形起伏度)、C(坡度)、D(年均气温)、E(年均降水)作为人口密度随机森林模型的影响因子,模拟构建自然禀赋因子影响下的人口密度预测模型。随着农耕文明的不断发展,人类修建了许多人工河流(减河、运河、灌渠等),在02组实验(即后测实验1)和03实验(即后测实验2)中,分别增加了F1(距河流距离,含自然河流和人工河流)、F2(距自然河流距离),尝试回答人工河流是否对人口分布有显著影响。
信息文明时代,要素集聚是人口再分布的重要驱动力,是创新禀赋的重要表现。夜光影像、POIs核密度和聚落核密度均能反映设施集聚特征,故将这3个数据集选做创新禀赋候选影响因子。设计04(后测实验3)、05(后测实验4)、06(后测实验5)等实验,分别增加G1(夜光影像)、G2(POIs核密度)、G3(聚落核密度)等实验刺激,尝试回答聚落核密度是否能够替代POIs核密度?不同禀赋区选用哪个创新禀赋因子更好?等系列问题。
工业文明时代,城乡区位显著影响人口就业和生活,是人口再分布的重要驱动力。设计07(后测实验6)、08(后测实验7)两组实验,分别增加H1(距POIs距离)、H2(距聚落距离)等实验,尝试回答聚落距离和POIs距离哪个因子更合适的问题。
3.1.2 各区人口密度影响因子的遴选结果
随着逐步引入不同的禀赋因子,各禀赋区人口密度预测模型的平均拟合优度值不断提升(表3)。在平原城镇和山区城镇区,当引入创新禀赋因子时,人口密度预测模型的平均拟合优度值有小幅提升,说明城镇地区人口分布已受到创新禀赋因子的影响。当引入距聚落距离因子后,各禀赋区的人口密度预测模型的平均拟合优度值均得到显著提升,说明城乡区位是影响人口分布的关键因子。
表4 各禀赋区人口密度影响因子的遴选结果
Tab. 4
| 禀赋分区 | DEM | 地形起 伏度 | 坡度 | 年均温 | 年降水 | 河流因子 | 创新禀赋因子 | 经济禀赋因子 | ||||||
|---|---|---|---|---|---|---|---|---|---|---|---|---|---|---|
| 距河流 距离 | 距自然河流 距离 | 夜光 影像 | POIs核 密度 | 聚落核 密度 | 聚落 距离 | POIs 距离 | ||||||||
| 山区城镇 | √ | √ | √ | √ | √ | √ | - | ◎ | √ | O | √ | - | ||
| 山区乡村 | √ | √ | √ | √ | √ | √ | - | √ | ◎ | O | √ | - | ||
| 平原城镇 | √ | √ | √ | √ | √ | - | √ | O | √ | ◎ | √ | - | ||
| 平原乡村 | √ | √ | √ | √ | √ | √ | - | O | ◎ | √ | √ | - | ||
注:-代表不选影响因子;√代表首选影响因子;◎代表二选影响因子;O代表三选影响因子。
3.1.3 人口密度影响因子的空间异质性分析
以08组实验为例,利用人口密度随机森林预测模型的重要性指数(Importance Index),说明影响因子的空间异质性特征(图4)。山区城镇人口密度主要受聚落距离(0.418)、POIs核密度(0.103)、海拔高度(0.099)、地形起伏度(0.081)等因子的影响;平原城镇人口密度主要受聚落距离(0.297)、POIs核密度(0.230)等因子影响;山区乡村人口密度主要受聚落距离(0.551)、年均温(0.072)、年降水(0.069)等因子的影响;平原乡村人口密度主要受聚落距离(0.710)的影响。总的来看,人口分布与聚落之间有很强的空间依附关系,距聚落距离(经济禀赋因子)是影响人口分布的最重要因子。聚落核密度(创新禀赋因子)已成为山区城镇、平原城镇、平原乡村人口分布的第二重要影响因子。自然禀赋因子对现代人口分布影响较小,其中城镇地区气温、降水等对人口分布影响较小,但气温、降水对乡村地区人口分布影响较大;由于聚落供水设施的不断完善,距河流距离或距自然河流距离对人口分布影响较小。
图4

图4
分区人口密度影响因子的重要性指数(实验08)
Fig. 4
Importance index of the factors affecting population density in different areas (Experiment 08)
随着社会进步(从农业文明奔向工业文明或信息文明),在华北平原和太行山区过渡地带,自然禀赋因子作为一种外部因子,对人口分布的影响持续减弱。经济禀赋和创新禀赋因子已成为该区人口分布的主要影响因素。以石家庄为例,聚落距离(反映城乡区位)是影响人口密度分布的最重要因子;创新禀赋因子(聚落核密度)也逐步发挥了重要影响作用,尤其在城镇地区,创新禀赋因子是影响城镇地区人口分布的第二重要因子。只有在经济欠发达、自然禀赋条件较差的山区乡村,自然禀赋因子仍是影响人口分布的重要因素。
3.2 计算结果和模型检验
3.2.1 人口密度预测数据集的优化组合输出结果
利用2.3.4所述方法,获得每个人口密度预测数据集的优化组合系数;通过线性组合,获得分区人口密度预测数据集;通过镶嵌拼接,获得01~08组实验的石家庄人口密度预测数据集(图5)。从视觉效果看,01~07组实验所获石家庄人口密度预测数据集没有显著差异,但08组实验所获石家庄人口密度预测数据集反映人口明显向聚落集聚。
表5列出了01组~08组实验所获石家庄人口密度预测数据集的关键统计特征,结果表明:① 当引入恰当的影响因子时,预测数据集的人口密度最大值会有所提升,说明所获人口密度预测数据集能更好刻画城乡人口密度差异。② 当引入恰当的影响因子时,预测数据集的人口密度平均值有所下降,人口密度预测数据集获得的研究区人口预测总数与真实人口总数越发接近,说明模型的预测精度得到了改善。③ 当引入恰当的影响因子时,预测数据集的人口密度标准差持续变大,说明人口密度预测数据集的空间异质性特征得到了持续改善。
表5 石家庄人口密度预测数据集关键统计指标对照 (人/hm2)
Tab. 5
| 实验 组别 | 最大值 | 平均值 | 标准差 | 实验 组别 | 最大值 | 平均值 | 标准差 |
|---|---|---|---|---|---|---|---|
| 01 | 335.858 | 7.259 | 14.143 | 05 | 362.073 | 7.396 | 15.926 |
| 02 | 319.384 | 7.385 | 14.136 | 06 | 335.565 | 7.425 | 15.027 |
| 03 | 329.105 | 7.360 | 14.466 | 07 | 342.875 | 7.406 | 16.043 |
| 04 | 354.606 | 7.436 | 15.676 | 08 | 405.284 | 6.967 | 24.585 |
3.2.2 分区密度制图结果
利用2.3.5所述方法,以县为单位开展分区密度制图,获得了01~08组实验石家庄人口密度数据集(图6)。从08组实验所获的人口密度数据集看,石家庄人口分布极不均衡,总体趋势是中部高四周低,人口集聚的“核心—边缘”特征明显;山区聚落少、小、稀,人口密度低;平原聚落多、大、稠,人口密度高。山区人口密度“零值区”呈碎斑状连片分布;平原地区没有人口密度“零值区”。河流平原段周边人口密度低,聚落稀。滹沱河出山后,其北岸由于有设防水平高的河堤,聚落离河流干流距离较近,且密度较大;其南岸由于缺乏设防水平高的河堤,聚落离河流干流距离较远,密度较小。
图6
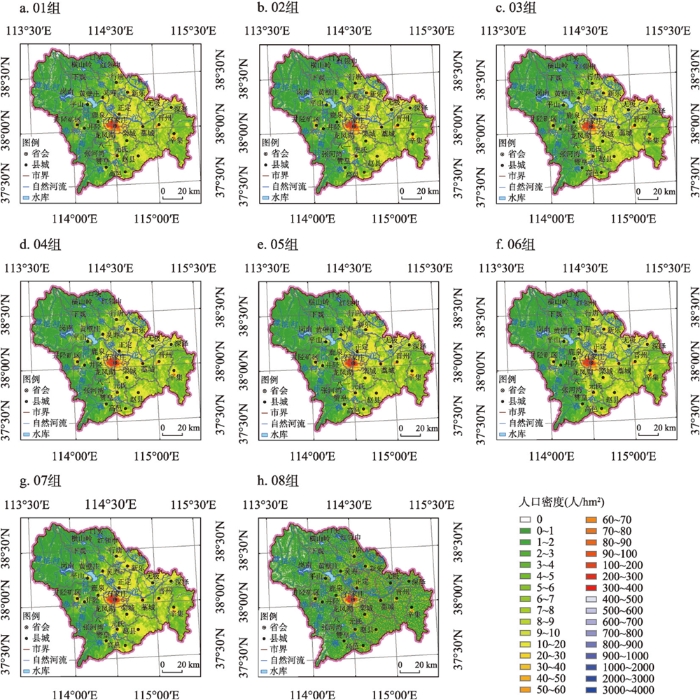
图6
01~08组实验石家庄人口密度数据集
Fig. 6
Shijiazhuang population density datasets for the experiments from groups 01 to 08
表6 石家庄市人口密度数据集关键统计指标对照表(人/hm2)
Tab. 6
| 实验组别 | 最大值 | 平均值 | 标准差 | 实验组别 | 最大值 | 平均值 | 标准差 |
|---|---|---|---|---|---|---|---|
| 01 | 420.510 | 6.775 | 15.137 | 05 | 373.971 | 6.775 | 16.278 |
| 02 | 453.410 | 6.775 | 15.050 | 06 | 397.708 | 6.775 | 15.522 |
| 03 | 408.598 | 6.775 | 15.660 | 07 | 355.833 | 6.775 | 15.890 |
| 04 | 350.737 | 6.775 | 15.484 | 08 | 512.187 | 6.775 | 24.492 |
3.2.3 人口密度数据集的准则效度检验
基于石家庄人口密度数据集汇总获得各乡(镇)人口预测总数,令其为Y,令各乡(镇)人口登记总数为X,建立一元线性回归方程,计算回归方程的拟合优度R2,作为人口密度数据集的准则效度(表7)。从01组实验到08组实验,回归方程的拟合优度R2越来越大,说明人口密度随机森林模型的准则效度得到了显著提升。其中,08组实验所获人口密度数据集精度最高。
表7 乡(镇)人口预测数与人口统计数的拟合优度R2
Tab. 7
| 实验 组别 | 01 | 02 | 03 | 04 | 05 | 06 | 07 | 08 |
|---|---|---|---|---|---|---|---|---|
| R2 | 0.890 | 0.882 | 0.919 | 0.936 | 0.934 | 0.923 | 0.941 | 0.967 |
4 讨论
4.1 灵活制定分区策略
实验表明,分区建立人口密度随机森林模型有利于探讨人口分布规律和影响机制,但这并不意味只有分区才能构建人口密度随机森林模型。一般来说,对一个幅员辽阔的国家或地区,通常要采用分区建模策略;而对一个面积较小或景观单一的国家或地区,往往不须采用分区建模策略,只需构建一个人口密度随机森林模型。
综合禀赋分区一般要兼顾自然禀赋分区和城乡划分。当研究区面积很大时,通常采用拿来主义策略,直接将综合自然区划、农业区划、生态环境区划、地貌区划等研究成果作为自然禀赋分区成果。当研究区面积较小时,在不打破人口普查或调查单元的情况下,即可采用主成分分析法和聚类分析法,开展综合禀赋分区;也可采用主导因素法(例如:以海拔高度为标准,将黄淮海平原分别划分为洪积平原、冲积平原、海积平原),获得自然禀赋分区。
由于城镇化是一个持续演变过程,因此城乡范围是动态演变的,城乡划分是禀赋分区中的难点问题。对于土地利用数据变更及时的地区,可参考第二次全国土地调查或第三次全国国土调查成果数据划定城镇分布范围;对于缺乏土地利用数据的地区,可依据夜光影像,采用阈值法,确定不同时期的城乡分布范围。例如:在利用第三次至第七次人口普查数据编制青藏高原人口密度图时,就可利用夜光影像数据,界定不同时点青藏高原的城乡分布范围。
分区建模实质上有两点好处:一是明确了模型的表达对象(禀赋区域),从而避免了混淆人口分布法则的难题;二是明确了模型的尺度(禀赋分区的范围)。分区建模为因地制宜、因时制宜揭示世界人口分布规律和影响机制,准确把握世界人口分布的过去、现在和未来,提供了科研协作框架和统一的技术框架。
4.2 进一步加强训练样本数据集的遴选工作
与随机采样相比,分层采样显著改善了训练样本数据集中人口密度标签值的分布稳定性。但针对每个禀赋区生成的10个训练样本数据集是否具有代表性?文中并未细致追究,其实这是有瑕疵的。抽样程序一般包括界定总体、制定抽样框、决定抽样方案、实际抽取样本、评估样本质量等5个环节。评估样本质量是对样本的质量、代表性、偏差进行初步检验和衡量,其目的是防止由于样本偏差过大而导致失误。通常采用比较法来评估样本质量,即将反映总体中某些重要特征及其分布的资料与样本中同类指标的资料进行比较。后续研究应利用比较法,尝试评估训练样本质量,力争提出满足分层采样策略的训练样本数据集的形式化筛选模型,为进一步开展人口密度随机森林的信度评价创造条件。
4.3 人口密度随机森林模型可能不必引入交通区位因子
相关研究表明,人口密度与交通通达度(表征交通区位的量化指标)具有显著相关性[46-47],因此,在构建人口密度模型时,交通区位因子是常被引入的影响因子[23,25⇓ -27,48⇓⇓ -51]。本文将交通通达度作为实验刺激,设计了第09组实验(后测实验8)。结果表明,在引入交通通达度后,人口密度预测数据集的最大值、人口密度预测模型的平均拟合优度R2、人口密度数据集的标准差均出现了小幅下降的现象(即出现了影响因子边际效应),说明不宜将交通通达度引进到石家庄市人口密度随机森林模型之中。其实,1978年改革开放以来中国交通基础设施变化巨大,准确获取历史时期交通要素数据集的难度极大。如果在构建人口密度随机森林模型时不必引入交通区位因子,将显著降低各普查年份人口密度随机森林模型的构建难度。
4.4 聚落数据集在构建人口密度随机森林模型中发挥了极其重要的作用
聚落是人口生产、生活的集聚地,聚落分布与人口分布有着紧密联系。聚落数据集在创建人口密度标签数据集(聚落人口密度数据集)、经济禀赋因子(距聚落距离)、创新禀赋因子(聚落核密度)等方面都是不可或缺的核心数据集。
利用面积加权法,以矢量格式的村人口空间数据集为起点,以矢量格式的聚落和公顷网格数据集为约束,编制聚落人口密度栅格数据集,其人口密度的最大值高于GPWv4,其人口分布基尼系数大于GHS-POP和GPW,在人口分布的城乡差异和空间集聚特征方面有优异表现。聚落人口密度数据集是创建人口密度随机森林模型理想的人口标签数据集。
学者常使用距POIs距离来表征城乡区位特征,常使用POIs核密度或夜光影像来表征要素集聚特征。但无论是POI数据,还是夜光影像数据都存在一定的局限性。以百度POI为例,POI包括生活、生产、公共服务3大类、24小类,其中,许多小类POI数据与人口分布无关。如果囫囵吞枣、不加区分,盲目引用POI数据,往往会导致人口密度随机森林模型出现偏差。另外,POI数据是大数据时代的产物,2010年以前,实际上还没有POI数据,若想构建1982年、1990年、2000年的人口密度随机森林模型,则面临无法找到POI数据的尴尬境地。夜光影像不仅自身存在“灯撒效应”(Blooming Effect),而且夜光影像的历史数据集也仅能回溯到20世纪90年代后期。
由于全球对地观测事业的不断发展,聚落数据(土地利用数据产品)具有较好的历史可回溯性。例如采用全球10 m粒度的聚落数据集和以乡为单元的人口普查数据集,项目组已经成功编制了2020年青藏高原聚落人口密度数据集,为构建青藏高原人口密度随机森林模型,探讨青藏高原人口分布规律和影响机制,奠定了扎实基础。可以预见,在构建全球不同区域的高分辨率人口密度随机森林模型时,聚落数据集已不是约束条件。考虑数据可得性,如果用距聚落距离代替距POIs距离,用聚落核密度代替POIs核密度或夜光影像,则会在保证模型效度的前提下,降低构建历史时期人口密度随机森林模型的难度。
4.5 部分实验模型与国际著名人口密度模型准则效度的比较
以乡真实人口统计数为自变量,以著名人口密度栅格数据集的乡人口汇总数为因变量,利用公式5构建一元线性回归方程;利用公式4测算不同模型在不同禀赋区的准则效度R2,计算结果详见表8。考察研究区不同模型的准则效度,08组模型在众多随机森林模型产品中表现最好,随机森林模型(08组、WorldPOP、01组、ChinaPOP、POIPOP)整体优于线性回归模型(LandScan、GRUMP、CnPOP),线性回归模型整体优于类型赋权模型(HYDE);二元加权和面积加权混合模型(GHS-POP)优于面积加权模型(GPW)。
表8 部分实验模型与国际著名人口密度模型准则效度(R2)的对比
Tab. 8
| 模型 | ① | ② | ③ | ④ | ⑤ | ⑥ | ⑦ | ⑧ | ⑨ | 01组 | 08组 |
|---|---|---|---|---|---|---|---|---|---|---|---|
| 平原城镇 | 0.796 | 0.967 | 0.851 | 0.802 | 0.974 | 0.933 | 0.860 | 0.964 | 0.893 | 0.966 | 0.983 |
| 平原乡村 | 0.363 | 0.773 | 0.417 | 0.681 | 0.687 | 0.658 | 0.604 | 0.758 | 0.726 | 0.812 | 0.939 |
| 山区城镇 | 0.522 | 0.811 | 0.638 | 0.851 | 0.694 | 0.731 | 0.555 | 0.770 | 0.897 | 0.694 | 0.896 |
| 山区乡村 | 0.278 | 0.781 | 0.356 | 0.639 | 0.631 | 0.561 | 0.600 | 0.734 | 0.717 | 0.682 | 0.889 |
| 研究区 | 0.896 | 0.911 | 0.657 | 0.708 | 0.528 | 0.874 | 0.706 | 0.910 | 0.836 | 0.890 | 0.967 |
注:①~⑨分别为GPW、GHS-POP、HYDE、CnPOP、GRUMP、LandScan、ChinaPOP、WorldPOP、POIPOP等人口密度栅格数据集,其中①、②、③、⑤、⑥为2000年数据集,④、⑦、⑧、⑨为2010年数据集。
考察禀赋区不同模型的准则效度,08组模型表现最优,尤其是在农村地区,对面积加权模型、类型赋值模型和线性回归模型均产生了碾压优势。值得注意的是,08组模型的准则效度好于二元加权和面积加权混合模型(GHS-POP),这说明采用基于聚落的人口统计数据空间分解算法(克服了局部匀质化问题)所获聚落人口密度数据集(即建模所用人口密度标签数据集)的质量要显著优于GHS-POP人口密度数据集,折射出GHS-POP所用二元加权和面积加权混合模型的局部匀质化问题对乡村和山区的人口密度值仍有不良影响。
5 结论
文中提出了人口密度随机森林模型的全流程优化方案,实验结果表明:分区建模、分层采样、因子遴选、加权输出、分区密度制图是优化方案中5个关键的改进环节。
① 按禀赋区构建人口密度随机森林预测模型,能克服人口密度预测数据集中混淆人口分布法则的错误现象;将分层采样单元定为公顷网格,能使训练样本数据集免受MAUP问题的困扰,在形式上尝试降低区群谬误问题对模型的不良影响;分层采样显著提高了训练样本数据集中人口密度分布的稳定性。② 开展递增式人口密度影响因子遴选实验,通过分区优选人口密度随机森林的影响因子,能显著改善人口密度预测数据集的拟合优度。实验证实,不同禀赋区确实存在不同的人口分布影响机制,即人口分布的影响机制存在空间差异。③ 利用本文提出的人口密度预测数据集的优化组合方法,使得组合输出的人口密度预测数据集的“零值区”显著减少,显著改善了人口密度随机森林模型的稳定性。④ 分区密度制图能够进一步提高人口密度数据集的最大值,人口密度数据集的区分度与人口密度预测数据集的区分度大致相当。⑤ 现代人口分布不仅受自然禀赋因子影响,而且更受经济禀赋和创新禀赋因子影响。在石家庄,聚落距离(经济禀赋因子)是人口分布的最主要影响因子;聚落核密度等(创新禀赋因子)是城镇地区人口分布的第二位影响因子;气候、降水等自然禀赋因子对人口分布的影响减弱,但在乡村地区仍有较大影响。⑥ 石家庄人口分布具有非均衡特征,其总体趋势是中部高四周低,人口集聚的“核心—边缘”特征明显;平原地区人口密度高于山区地区;山区聚落少、小、稀,人口密度低;平原聚落多、大、稠,人口密度高。山区人口密度“零值区”呈碎斑状连片分布。
人口密度随机森林模型优化方案为揭示地方性人口分布规律和影响机制提供了统一的技术框架,为完整认识全球人口分布时空演变规律和影响机制提供了中国方案。
参考文献
Population data and global environmental change
Spatially disaggregated population estimates in the absence of national population and housing census data
DOI:10.1073/pnas.1715305115
PMID:29555739
[本文引用: 1]

Population numbers at local levels are fundamental data for many applications, including the delivery and planning of services, election preparation, and response to disasters. In resource-poor settings, recent and reliable demographic data at subnational scales can often be lacking. National population and housing census data can be outdated, inaccurate, or missing key groups or areas, while registry data are generally lacking or incomplete. Moreover, at local scales accurate boundary data are often limited, and high rates of migration and urban growth make existing data quickly outdated. Here we review past and ongoing work aimed at producing spatially disaggregated local-scale population estimates, and discuss how new technologies are now enabling robust and cost-effective solutions. Recent advances in the availability of detailed satellite imagery, geopositioning tools for field surveys, statistical methods, and computational power are enabling the development and application of approaches that can estimate population distributions at fine spatial scales across entire countries in the absence of census data. We outline the potential of such approaches as well as their limitations, emphasizing the political and operational hurdles for acceptance and sustainable implementation of new approaches, and the continued importance of traditional sources of national statistical data.Copyright © 2018 the Author(s). Published by PNAS.
Using latitude and longitude grid cells to compile a population density map: Taking the Beijing-Tianjin-Tangshan area as an example
用经纬网格单元编制人口密度图: 以京津唐地区为例
World population in a grid of spherical quadrilaterals
DOI:10.1002/(SICI)1099-1220(199709)3:3<203::AID-IJPG68>3.0.CO;2-C
PMID:12348289
[本文引用: 1]
"We report on a project that converted subnational population data to a raster of cells on the earth. We note that studies using satellites as collection devices yield results indexed by latitude and longitude. Thus it makes sense to assemble the terrestrial arrangement of people in a compatible manner. This alternative is explored here, using latitude/longitude quadrilaterals as bins for population information.... The results to date of putting world boundary coordinates together with estimates of the number of people are described. The estimated 1994 population of 219 countries, subdivided into 19,032 polygons, has been assigned to over six million five minute by five minute quadrilaterals covering the world."excerpt
Taking advantage of the improved availability of census data: A first look at the gridded population of the world, Version 4
Using classified and unclassified land cover data to estimate the footprint of human settlement
DOI:10.5334/dsj-2018-001 URL [本文引用: 2]
LandScan: A global population database for estimating populations at risk
Modeling the population of China using DMSP operational linescan system nighttime data
Study on spatial distribution of population based on remote sensing and GIS
基于RS、GIS的人口空间分布研究
DOI:10.11867/j.issn.1001-8166.2002.05.0734
[本文引用: 1]
人口的空间分布问题涉及人口学、经济学、地理学等多个学科,统计型人口数据的空间化是"数字地球"的重要研究内容。阐述了人口地域分布的基本理论,回顾了人口空间分布的研究进展,结合研究实践,提出了在遥感、GIS技术支持下,统计型人口数据空间化的研究思路和技术流程,并对该方法的特点和应用前景做了展望。
Land cover change over the last three centuries due to human activities: The availability of new global datasets
DOI:10.1007/s10708-004-5050-z URL [本文引用: 1]
Simulation of Chinese population density based on land-use
基于土地利用的中国人口密度模拟
Three centuries of global population growth: A spatial referenced population (density) database for 1700-2000
The HYDE 3.1 spatially explicit database of human-induced global land-use change over the past 12,000 years
Modeling population density of China in 1998 based on DMSP/OLS nighttime light image
DOI:10.11821/xb200502010
[本文引用: 1]
Spatial distribution of population density is crucial for analyzing the relationship among economic growth, environment protection and resource utilization. In this study, population density of China in 1998 at 1-km resolution grids was simulated by integrating DMSP/OLS non-radiance calibrated nighttime light image, SPOT/VEGETATION 10-day maximum NDVI data, population census data and vector data of county boundary. Not only the population density in light patches but also that out of them was estimated in four types of areas. For each area, in light patches, the model for population density estimation was developed based on the significant correlation between light intensity and population, and in "dark area", the models for population density estimation were developed based on Coulomb's law and field superposing theory. Compared with the existed methods for spatializing population density, our method is simpler and more cost saving. The result of the study is consistent with those of other researches on the whole, but the spatial difference is more distinct and the information is richer. The maximum population density simulated is 41096 persons/km2 and average population density at inhabitable area of China is 189 persons/km2. It indicates that the 1-km resolution non-radiance calibrated DMSP/OLS nighttime lights image has the potential to provide population density estimation at 1-km grids.
基于夜间灯光数据的中国人口密度模拟
DMSP/OLS nighttime light imagery for urban population estimates in the Brazilian Amazon
DOI:10.1080/01431160500181861 URL [本文引用: 1]
LandScan USA: A high-resolution geospatial and temporal modeling approach for population distribution and dynamics
DOI:10.1007/s10708-007-9105-9 URL [本文引用: 2]
Dasymetric modelling of small area population distribution using land cover and light emissions data
DOI:10.1016/j.rse.2006.11.020 URL [本文引用: 1]
Population spatialization in China based on night-time imagery and land use data
DOI:10.1080/01431161.2011.569581 URL [本文引用: 1]
Population spatial processing for Chinese coastal zones based on census and multiple night light data
基于人口普查与多源夜间灯光数据的海岸带人口空间化分析
WorldPop, open data for spatial demography
High resolution, contemporary data on human population distributions, their characteristics and changes over time are a prerequisite for the accurate measurement of the impacts of population growth, for monitoring changes and for planning interventions. WorldPop aims to meet these needs through the provision of detailed and open access spatial demographic datasets built using transparent approaches. The Scientific Data WorldPop collection brings together descriptor papers on these datasets and is introduced here.
Spatiotemporal patterns of population in mainland China, 1990 to 2010
According to UN forecasts, global population will increase to over 8 billion by 2025, with much of this anticipated population growth expected in urban areas. In China, the scale of urbanization has, and continues to be, unprecedented in terms of magnitude and rate of change. Since the late 1970s, the percentage of Chinese living in urban areas increased from ~18% to over 50%. To quantify these patterns spatially we use time-invariant or temporally-explicit data, including census data for 1990, 2000, and 2010 in an ensemble prediction model. Resulting multi-temporal, gridded population datasets are unique in terms of granularity and extent, providing fine-scale (~100 m) patterns of population distribution for mainland China. For consistency purposes, the Tibet Autonomous Region, Taiwan, and the islands in the South China Sea were excluded. The statistical model and considerations for temporally comparable maps are described, along with the resulting datasets. Final, mainland China population maps for 1990, 2000, and 2010 are freely available as products from the WorldPop Project website and the WorldPop Dataverse Repository.
Spatialization of population in the Pearl River Delta in 30 m grids using random forest model
DOI:10.18306/dlkxjz.2017.10.012
[本文引用: 3]
Grid population data can enable integrated analysis of population statistics with other spatial data on resources and the environment. Based on a Random Forest model and using nighttime lights, road network, surface water network, built-up area, slope, and DEM as control variables, the 2010 population data of the Pearl River Delta were distributed into 30 m grids. The estimation results were compared with three other public datasets. The importance of input variables was analyzed based on the results. The result shows that the accuracy of this simulation reached 83.32%, which is better than the WorldPop and the Population Grids of China datasets, and more close to the GPW dataset. Moreover, the 30 m resolution of our result furnishes detailed information of population density of the Pearl River Delta. According to the importance of covariates from the Random Forest model, strength of nighttime lights, distance to water, distance to built-up area, and density of roads are important factors in population distribution modeling in the Pearl River Delta. With the Random Forest model and multi-source data, high resolution population spatialization can be achieved. High spatial resolution grid data can provide important data source for high precision city management and policy making.
基于随机森林模型的珠江三角洲30 m格网人口空间化
DOI:10.18306/dlkxjz.2017.10.012
[本文引用: 3]
人口空间化是实现人口统计数据与其他环境资源空间数据融合分析的有效途径。本文选取夜间灯光数据、道路网数据、水域分布数据、建成区数据、数字高程模型和地形坡度数据作为影响珠江三角洲人口分布的变量因子,利用随机森林模型对珠江三角洲2010年人口数据进行了30 m格网空间化,并将模拟结果与三个公开数据集作精度对比,最后基于随机森林模型的变量因子重要性分析珠江三角洲人口空间分布的影响因素。结果表明:本文模拟整体精度达到82.32%,均优于WorldPop数据集以及中国公里网格人口数据集,接近GPW数据集,而且在人口密度中等区域模拟精度最高;通过对变量因子重要性进行度量,发现夜间灯光强度是珠江三角洲人口分布的最重要指示性指标,到水域的距离、到建成区的距离和路网密度对珠江三角洲人口分布均具有重要作用。利用随机森林模型结合多源信息能够实现高空间分辨率的人口空间化,可为精细化城市管理提供重要数据源,也可为相关政策决策制定提供支持。
Population distribution pattern and influencing factors in Tibet based on random forest model
DOI:10.11821/dlxb201904004
[本文引用: 3]
Clarifying the spatial pattern of population distribution, its influencing factors and regional differences at the township level is of great guiding significance for formulating sustainable development policies in ecologically fragile areas. Based on the population census data of Tibet at the township level in 2010, the population density and spatial factors were extracted. The density and clustering characteristics of the population distribution were analyzed by spatial statistical method. The multiple linear regression method and the random forest regression method were used to explore the population influencing factors and their regional differences of population distribution. The results showed that: (1) The population density of Tibet at the township level showed a strong spatial non-equilibrium. The general trend was high in the southeast and low in the northwest, and there was a strong spatial coupling between the main rivers and the main traffic trunks in high density area. (2) The "core-edge" characteristic of population clustering was obvious, and roughly to the wave of Borong (Nyalam County)-Gangni (Anduo County) as the demarcation line. (3) In the multiple linear regression method, the artificial surface index had the greatest influence on the population distribution, followed by the nighttime light index and road network density. (4) Random forest method was more accurate than multiple linear regression method to predict the population density, which can be used to sort the importance of the influencing factors. The influencing factors of the first six factors were the night light index, artificial surface index, road network density, industrial output value, GDP and multi-year average temperature, and these factors were positively correlated with population density. Among topographic factors, the contribution rate of elevation and slope was the largest, which was negatively correlated with population density. (5) The influencing factors and their interactions of population distribution in Tibet showed obvious regional differences. The valley was a gathering area for population in the study region, mainly in Lhasa River Valley, Nianchu River Valley and Sanjiang River Valley. (6) Through the analysis of random forest regression, the conceptual model can be used to express the influencing factors of population distribution, and the dominant factors were summarized as land use structure, road accessibility and urbanization level.
基于随机森林模型的西藏人口分布格局及影响因素
DOI:10.11821/dlxb201904004
[本文引用: 3]
在乡镇尺度下厘清人口分布格局及其影响因素与区域差异,对在生态脆弱区制定可持续发展政策具有重大指导意义。基于2010年西藏自治区的乡镇尺度人口普查数据,提取人口密度和空间因子,利用空间统计方法分析了人口分布的疏密特征和集聚特征,对比运用多元线性回归方法和随机森林回归方法探索该地区人口分布的影响因素及其区域差异。结果表明:① 西藏乡镇人口密度在空间上表现出极强的非均衡性,其总体趋势是东南高西北低,高密度区与大江大河及主要交通干线具有较强的空间耦合性;② 大致以波绒乡(聂拉木县)—岗尼乡(安多县)为西藏的人口分界线,人口集聚的“核心—边缘”特征明显;③ 多元线性回归方法中,人造地表指数对人口分布的影响程度最大,随后依次为夜间灯光指数和路网密度;④ 利用随机森林方法进行的人口密度预测比多元线性回归方法精度高,可以用来对影响因子的重要性进行排序;排序在前六位的影响因子由高到低依次为夜间灯光指数、人造地表指数、路网密度、工业总产值、GDP和多年平均气温,它们与人口密度均呈正相关关系;地形地貌要素中以海拔和坡度的贡献率最大且与人口密度均呈负相关关系;⑤ 西藏人口分布格局的影响因素及其相互作用呈现出明显的区域差异特征,河谷是西藏地区人口的集聚区,主要分布在拉萨河谷、年楚河谷以及三江河谷;⑥ 通过随机森林回归分析,可以利用概念模型来表达人口分布影响因素,将主导因素概括为土地利用结构、道路通达度及城镇化水平。
Improved population mapping for China using remotely sensed and points-of-interest data within a random forests model
DOI:10.1016/j.scitotenv.2018.12.276 URL [本文引用: 5]
Methods for determining the uncertainty of population estimates derived from satellite imagery and limited survey data: A case study of Bo City, Sierra Leone
Method of pixelizing population data
人口数据空间化的处理方法
Experimental study on optimization of population density models based on random forest
基于随机森林的人口密度模型优化试验研究
Understanding of and thinking over geographical regionalization methodology
对自然地理区划方法的认识与思考
The distribution, regionalization and prospect of China's population
中国人口的分布、区划和展望
DOI:10.11821/xb199002002
PMID:12284413
[本文引用: 1]
我国地势西高东低。东部第一台阶为湿润的平原和丘陵,人口稠密。第二台阶分布在中部和西北部,大部为干旱半干旱气候。西南部的青藏高原属高寒气候,人口稀少。一条分界线东北起于黑龙江省的黑河,西南至云南省的腾冲。此线以东居住着全国96%的人口。以西居住着4%的人口。作者把全国分为八大人口区。在未来岁月里,我国人口分布的总格局不会有很大改变。
Comparison of interpolation methods for annual precipitation in Hebei province
河北省年均降水量插值方法比较
Estimation of optimality gap using stratified sampling
DOI:10.1016/j.amc.2005.01.080 URL
Big data analysis on the existence of Hu Huanyong Line: Ecological and new economic geography understanding of China's population distribution characteristics
胡焕庸线存在性的大数据分析: 中国人口分布特征的生态学及新经济地理学认识
Study on the relationship between population density and traffic intensity
人口密度与交通强度关系研究
Disaggregating population data for assessing progress of SDGs: Methods and applications
DOI:10.1080/17538947.2021.2013553 URL [本文引用: 1]
Local population mapping using a random forest model based on remote and social sensing data: A case study in Zhengzhou, China
High-resolution gridded population data are important for understanding and responding to many socioeconomic and environmental problems. Local estimates of the population allow officials and researchers to make a better local planning (e.g., optimizing public services and facilities). This study used a random forest algorithm, on the basis of remote sensing (i.e., satellite imagery) and social sensing data (i.e., point-of-interest and building footprint), to disaggregate census population data for the five municipal districts of Zhengzhou city, China, onto 100 × 100 m grid cells. We used a statistical tool to detect areas with an abnormal population density; e.g., areas containing many empty houses or houses rented by more people than allowed, and conducted field work to validate our findings. Results showed that some categories of points-of-interest, such as residential communities, parking lots, banks, and government buildings were the most important contributing elements in modeling the spatial distribution of the residential population in Zhengzhou City. The exclusion of areas with an abnormal population density from model training and dasymetric mapping increased the accuracy of population estimates in other areas with a more common population density. We compared our product with three widely used gridded population products: Worldpop, the Gridded Population of the World, and the 1-km Grid Population Dataset of China. The relative accuracy of our modeling approach was higher than that of those three products in the five municipal districts of Zhengzhou. This study demonstrated potential for the combination of remote and social sensing data to more accurately estimate the population density in urban areas, with minimum disturbance from the abnormal population density.
Projecting 1 km-grid population distributions from 2020 to 2100 globally under shared socioeconomic pathways
Spatially explicit population grid can play an important role in climate change, resource management, sustainable development and other fields. Several gridded datasets already exist, but global data, especially high-resolution data on future populations are largely lacking. Based on the WorldPop dataset, we present a global gridded population dataset covering 248 countries or areas at 30 arc-seconds (approximately 1 km) spatial resolution with 5-year intervals for the period 2020-2100 by implementing Random Forest (RF) algorithm. Our dataset is quantitatively consistent with the Shared Socioeconomic Pathways' (SSPs) national population. The spatially explicit population dataset we predicted in this research is validated by comparing it with the WorldPop dataset both at the sub-national and grid level. 3569 provinces (almost all provinces on the globe) and more than 480 thousand grids are taken into verification, and the results show that our dataset can serve as an input for predictive research in various fields.© 2022. The Author(s).
Disaggregating census data for population mapping using random forests with remotely-sensed and ancillary data
