

1 引言
山体效应是陆表山地隆起或抬升后造成山体同海拔气温内部高于外部的现象,其引起的水热空间异质性一直是自然地理学研究的经典内容之一[1⇓-3]。山体隆升引起的增温效应普遍存在,山体效应不仅改变了区域和山系尺度的地理生态格局[4],也会影响生物多样性的分布[5]。因此,揭示山体效应异质性及其驱动因子空间非平稳关系的响应格局,可为丰富山区局地复杂气候变化、资源保育等研究提供依据。1904年德国科学家Quervain在开展阿尔卑斯山生态地理研究过程中,首次指出自然垂直带界限存在自山体外部向内部逐步升高的现象。山体效应的早期研究也多处于定性对比不同山体内外植被分布界限的阶段,且尚不清楚其形成原因与作用机理。随着遥感技术的发展,山体基面高度作为山体效应的第一影响要素,被广泛应用于全球和局地尺度山体增温效应的定量化模型构建[6-7],还与降水大陆度、纬度等因子共同应用于山系/高原尺度的增温效应研究,如青藏高原、安第斯山、阿尔卑斯山、科罗拉多洛基山脉、新西兰山地[8⇓-10]等。以上因子对全球及区域尺度下山体增温效应的解释力高达60%[11-12],并加快了山体效应的定量化研究,但以上因子只能解释其对山体效应的贡献度,亟待从机理上揭示山体效应的空间异质性及成因复杂性。
山体效应异质性与空间尺度有关,随着研究尺度向局地推进,山体增温强度及成因机制则越复杂[13]。因山体规模结构、气候环境和下垫面属性等存在明显空间分异,亦会造成山体效应分布格局的多样性和形成机制的区域性[14]。山体效应是由“隆起地块”对山体自身及周围环境造成的气候效应,同时气候变化对隆起地形的响应研究也具有重要意义[15-16]。除山体基面高度外,地形地貌的空间异质性也是引起山区内外部温差的关键因素[17⇓-19];此外,草地、森林、裸岩和冰川等不同下垫面对太阳辐射的反射率有很大差异[20],加之各气象要素共同参与陆表和自由大气的能量交换,此过程中的热力循环造就山区气温空间分异进而影响山体效应的格局及程度。以往山体效应研究大多通过构建变量间的线性回归模型来审视它们对各山系的作用特点,而这种全局回归模型无法厘清驱动因子对山体效应空间异质性的贡献,也不能表达多因子的联合控制作用。可见,在考虑山体效应内涵及对其分布格局存在可能影响的诸多因子的基础上,寻求合适的方法定量探析驱动因子的空间异质性及因子间的协同或拮抗作用,对揭示山体效应的分异规律及成因机制尤为重要。地理探测器[21](GeoDetector)是度量、挖掘和利用空间异质性的新工具,可客观反映地理现象中各驱动因子的优先级和因子间的联合效应。地理加权回归模型[22-23](GWR)针对自变量和因变量间的变化关系可实现局部空间回归建模,进而揭示驱动因子的空间异质性[24]。以上模型所遵循的核心理论优势互补,有助于多视角探讨山体效应对驱动因子的响应机制,以期推进局部山体效应研究领域的深入和拓展。
当前山体效应研究涉及的山系大多分布在低纬或季风气候区,而深居内陆和中纬的天山不仅是全球七大山系之一,也是全球温带干旱区大型山地生态系统的最典型代表。开展天山山体效应强度、格局及成因的定量分析等研究,对于干旱区山体效应特征及其生态效应研究具有重要意义,也有助于更深入和全面的探究不同规模、走向、海陆位置山地山体效应的空间分异规律及作用机理。目前中国天山气温变化相关研究已取得丰硕成果,但大多研究都仅将山峰林立和沟谷密布的天山视为简单的“锥体”,局限了对其内外部和不同隆起区气温空间分异格局的表征。因此本文采用多源遥感数据,基于不同时空尺度定量刻画天山山体效应格局及分异规律,并借助地理探测器识别其主导驱动因子,结合GWR模型探析山体效应时空变化与影响因子间的地理空间关系,有助于多维阐释干旱区山地生态地理格局演变,是对现有山地气候乃至山地科学研究的有益补充。
2 研究区概况
天山位于欧亚大陆腹地,不仅是由巨大沙漠夹持的大型纬向山系,也是中亚气候的分界线及内陆水系的发源地和分水岭[25]。中国境内的天山(简称中国天山)由南天山、中天山、北天山3条平行褶皱山脉组成的巨大复合山链,占整个山系长度的2/3以上[26](图1)。南天山的汗腾格里山最为高峻,以其为界分为天山南脉和哈儿克他乌山;中天山山势平缓,自西向东包含乌孙山、那拉提山、额尔宾山等,最高峰位于额尔宾山(4835 m,43.53°N和81.00°E)穿过天山海拔4000 m以上的诸多山系;北天山西段包含博罗科努山和依连哈比尔尕山等,东段则包含博格达山和巴里坤山等;中国天山山链间镶嵌着众多山间盆地,如42.90°N和86.00°E,分别由西向东、由北至南均穿越巴音布鲁克盆地。受其山盆相间的独特地貌、山体走向及山区气流的影响,天山具有明显的大陆性气候、差异巨大的冬夏气温和垂直气温[27-28]。约4000 m的相对高差为天山地理环境的垂直分异提供了巨大的空间,造成垂直自然带结构在南北、东西方向上均存在明显差异,加之水热条件的分异作用发育了荒漠、山地森林/草原、高山草甸、极高山冰川/积雪带等完整的山地垂直生态系统[29]。
图1
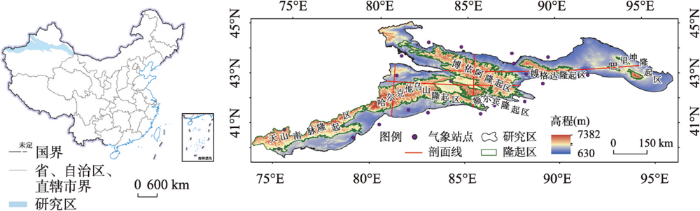
图1
研究区概况
注:基于自然资源部标准地图服务系统GS(2019)1823号标准地图制作,底图边界无修改。
Fig. 1
Overview of the study area (Tianshan Mountains of China)
3 数据与方法
本文基于多源遥感数据进行中国天山气温数据的空间降尺度处理和精度评价,运用数理统计方法和GIS空间分析技术,开展研究区山体效应估算和空间格局分析,借助地理探测器及GWR探究天山山体效应时空分异的成因机制。
3.1 数据采集及预处理
3.1.1 遥感数据
本文所需的遥感数据主要为地温、降水、DEM、NDVI、气压、湿度、风速数据。地温是空间分辨率为0.05°的MOD11C3数据,下载自NASA(
3.1.2 实测数据
实地观测数据主要为气象站点数据,下载自国家气象信息中心(
3.1.3 地形因子提取
表1 气温反演所需的地形参数
Tab. 1
| 地形因子 | 描述 | 方法/公式 |
|---|---|---|
| 海拔 | 山地隆起程度 | 由DEM数据获取 |
| 坡度 | 地表倾斜程度 | 利用ArcGIS坡度工具获取 |
| 坡向 | 地形坡面朝向 | |
| 地形位指数 | 综合反映地形的空间分异特征 | T= |
| 地形粗糙度 | 地面粗糙程度 | |
| 内外程度 | 距大地形边缘的距离 | ArcGIS距离分析 |
注:Trasp为坡向转换指数,aspect为坡向;T为地形位指数,
3.2 研究方法
3.2.1 气温降尺度模型构建
以往研究显示地温与气温间存在显著相关性[31],近地表陆面与自由大气间能量交换过程受地物和环境等多种要素的综合影响[32]。气象台站稀少不利于山区气温的空间表达,而遥感类数据可解决空间连续性问题,但其分辨率限制了对气温分布的精细和客观评估。为此本文选用与气温相关性较高的MOD11C3地表温度数据作为反演气温的基础数据[33],参考前人研究并结合可表征山区地理位置、地形和环境等条件,综合选取经度、纬度、海拔、坡度、气压、湿度、风速及NDVI等因子,构建气温空间降尺度回归模型(式(1))。采用决定系数(R2)、均方根误差(RMSE)及偏差(Bias)等综合评估降尺度反演所得气温数据与实测气温数据的一致性[34]。
式中:
另外,后续研究中为实现区域气温的精细表达,还需提取和衍生降尺度所需的栅格数据。首先将DEM(30 m)的空间分辨率定义为高分辨率(HR),LST(0.05°)和气象因子(1 km)的空间分辨率定义为低分辨率(LR)。然后提取LR尺度下气象站点对应的气象、地理和地形因子,构建气温降尺度回归模型并得到因子回归值,将LR中得到的回归系数代入HR因子数据中,借助ArcGIS构建高分辨率的天山气温数据库。
3.2.2 山体效应估算
式中:
为了展示天山各隆起区与山区整体的增温幅度的细部差异,选取几乎贯穿了研究区典型地貌单元的42.90°N、43.53°N、81.00°E和86.00°E等4条剖面线,它们可具体分析山体效应随经纬度的变化趋势及其与山地隆起程度和内外程度的相关性。
3.2.3 地理探测器
本文构建了包括3大类一级指标和8个二级因子的指标体系(表2),借助地理探测器探究中国天山不同时间尺度山体效应空间分异的成因规律,采用因子探测模块检验各因子对山体效应时空分异格局的解释力,采用交互探测模块识别各因子间的耦合方式及其对山体效应空间分异的影响强度,公式如下:
式中:
表2 中国天山山体效应空间分异影响因子
Tab. 2
| 因子类型 | 地形及区位因子 | 气象因子 | 下垫面 | |||||
|---|---|---|---|---|---|---|---|---|
| 具体指标 | 坡度(X1) | 坡向(X2) | 内外程度(X3) | 地形位指数(X4) | 地形粗糙度(X5) | 绝对高程(X6) | 降水(X7) | NDVI(X8) |
3.2.4 地理加权回归
式中:
4 结果分析
4.1 中国天山气温时空格局
图2
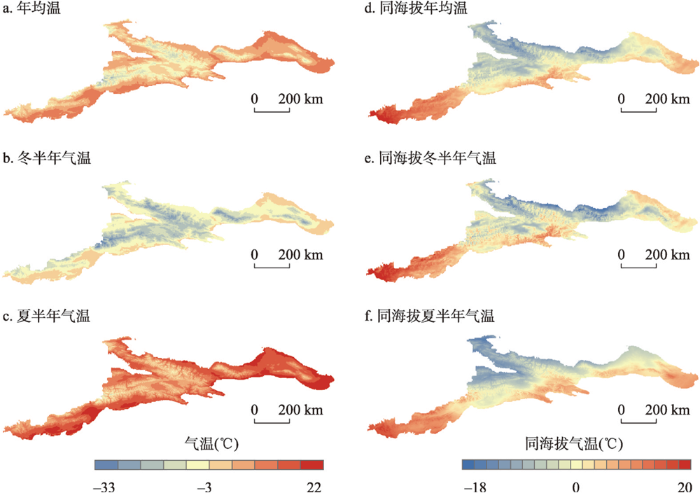
图2
中国天山气温、同海拔气温空间分布
Fig. 2
Spatial distribution of annual average, summer and winter temperature in the Tianshan Mountains of China
图3
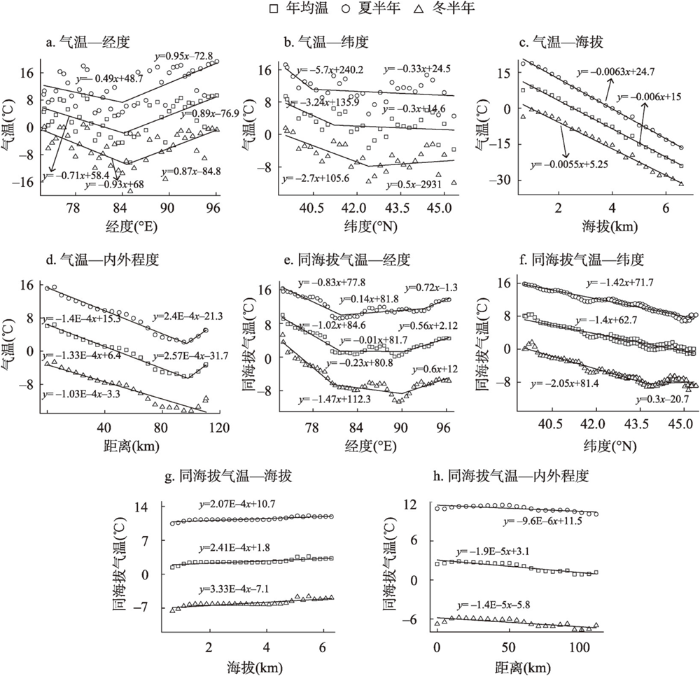
图3
中国天山气温、同海拔气温变化特征
Fig. 3
The variation characteristics of temperature and temperature at the same altitude in Tianshan Mountains of China
4.2 中国天山山体效应时空格局
4.2.1 宏观格局分析
中国天山的气候变化和下垫面属性(如植被和积雪覆盖度)均存在明显的季节性规律[39]。有必要基于不同时间尺度的同海拔气温格局探讨山体效应的空间分异特征,同时由于天山山系是由众多山脉组合而成,为能更具体识别不同隆起地块的增温效应,结合研究区地貌构造特征将其归并为6大隆起区:天山南脉隆起区、哈尔克他乌山隆起区、额尔宾隆起区、博罗科努山—依连哈比尔尕山—阿拉沟山(简称博依阿隆起区)、博格达隆起区及巴里坤隆起区。
基于逐月同海拔气温,得出年均、冬半年及夏半年的山地同海拔气温空间分布格局(图2)。与实际气温相比,研究区同海拔气温随经度变化更为复杂,纬度地带性变化更具规律性。山区同海拔气温经向(由西向东)总体呈降低特征,局地各时段又出现不同程度的升温(图3e);同海拔气温的纬度地带性特征明显,且各时段递减速率远小于同期实际气温的变化(图3f)。3个时期在39~40°N、42°N及44~45°N 处均出现不同程度的增温,以上区域分别对应分布有天山南脉隆起区、哈尔克他乌山隆起区与阿拉套山等。与此同时,隆起地块不仅造成天山同海拔气温的垂直递减率呈微弱递增趋势(图3g),还缩小由内外海拔差异造成的内外温差(图3h),但隆起区变化大于天山整体。如夏半年同海拔气温垂直递变率最快的巴里坤隆起区高达0.15 °C/100 m,高于同期的天山5倍;夏半年同海拔气温降温速率仅为0.096 °C/10 km,而同期的哈尔克他乌山与依连哈比尔尕山内外温差在1.5~2 °C,靠近内部山顶区分布的大量冰川导致同海拔气温不再升高[40]。
进一步对6个隆起区与同纬度的同海拔气温差值(表3)比较发现,虽有2个隆起区分别在冬、夏半年没有明显增温现象,但整体上中国天山山体增温效应显著而普遍,且时空差异明显。其中天山南脉隆起区、额尔宾隆起区和巴里坤隆起区是研究区年尺度山体效应最突出的构造单元,而夏半年哈尔克他乌山隆起区和冬半年的博格达隆起区山体效应不显著。山体效应宏观上由西向东呈先降低后升高的趋势,各隆起区中天山南脉、额尔宾及巴里坤隆起区是山体效应最显著的区域,天山整体和局部的差异也证明山体增温存在区域性差异。
表3 中国天山各隆起区同海拔气温分布统计
Tab. 3
| 隆起区 | 平均海拔(m) | 夏半年 | 冬半年 | |||
|---|---|---|---|---|---|---|
| 平均温度(℃) | 与同纬度均温差(℃) | 平均温度(℃) | 与同纬度均温差(℃) | |||
| 天山南脉隆起区 | 3189 | 14.49 | 0.85 | -0.70 | 1.72 | |
| 哈尔克他乌山隆起区 | 3311 | 11.08 | -0.31 | -6.19 | 0.10 | |
| 额尔宾隆起区 | 3494 | 12.34 | 0.86 | -5.04 | 1.33 | |
| 博依阿隆起区 | 3135 | 10.80 | 0.29 | -7.01 | 0.46 | |
| 博格达隆起区 | 3080 | 11.57 | 1.32 | -9.81 | -1.48 | |
| 巴里坤隆起区 | 3473 | 13.37 | 2.94 | -6.64 | 1.21 | |
综上所述,中国天山同海拔气温地带性特征明显且时空差异显著,连续性大型沟谷和山间盆地等地貌单元削弱了其地带性分布规律,同海拔气温垂直变化呈微弱升高趋势。
4.2.2 细部特征分析
中国天山山体效应的时空分异特征明显,同时各隆起区与山区整体的增温幅度不尽相同,因此有必要进一步探究不同地貌单元和不同时间尺度(冬半年和夏半年)山体效应的细部特征。
图4
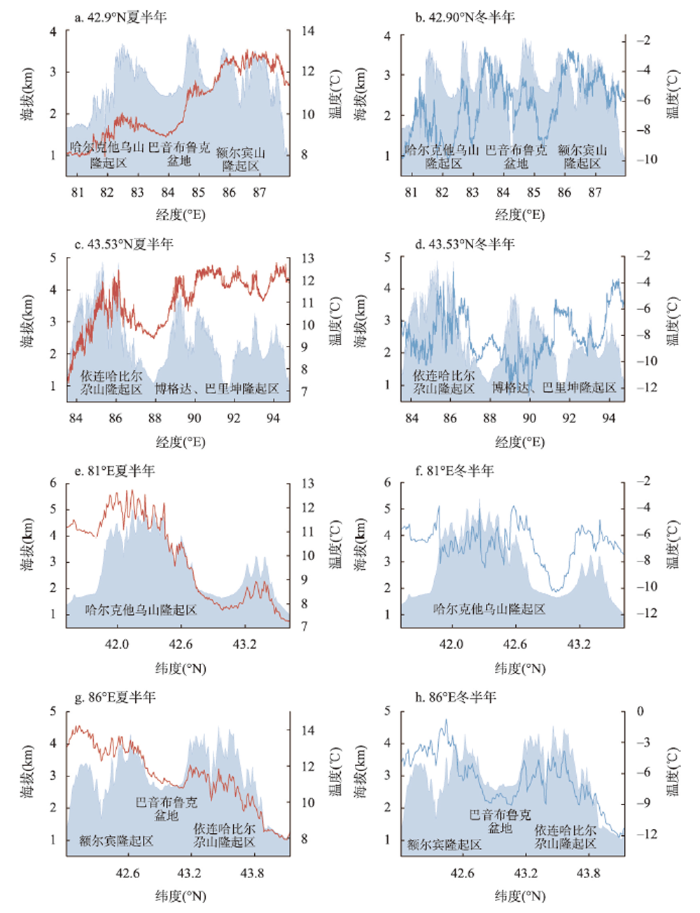
图4
中国天山同海拔气温剖面图
Fig. 4
The same altitude temperature profile in the Tianshan Mountains of China
研究区同海拔气温在太阳辐射纬向递变影响下空间分异显著,各剖面线隆起区的内部较外部增温更加明显。位于81°E(图4e、4f)剖面线的哈尔克他乌山隆起区冬、夏半年同海拔气温由南部外缘的-8.4 ℃、8.1 ℃到内部升高至-6.9 ℃和11.2 ℃左右,到北部外缘又下降至-9.9 ℃和8.8 ℃,地形隆升使得增温约1.4~5 ℃。位于84.50°E(图4g、4h)剖面线南部的额尔宾隆起区冬、夏半年同海拔气温均值为-5.7 ℃和13.1 ℃,中部巴音布鲁克盆地温度小幅降低,至北部依连哈比尔尕山隆起区又上升至-6 ℃和12 ℃,到最北部山体外缘温度下降至-12 ℃和8 ℃左右,该剖面线内外增温幅度约为1.6~6.3 ℃。额尔宾隆起区增温更为显著,是由于其纬度更低且南邻夏季温度更高的戈壁荒漠区共同所致,这也表明山体效应空间分异具有一定的复杂性,除受隆起程度影响外还受周边区域下垫面、局地气候环境等综合控制。
研究区山体效应整体分布呈东高西低、南高北低的格局特征,各隆起山地呈现出明显的由山体外部向内部升温的趋势,但隆起区的增温效应强弱有别,这可能与山体的规模、结构、隆起程度、地理位置和下垫面等因素有关。
4.3 中国天山山体效应空间分异归因
4.3.1 山区整体山体效应空间格局归因
前文研究发现中国天山冬、夏半年的山体效应在山系和隆起区尺度上均存在明显差异性。为此本文筛选了与山体效应分布相关的可能影响因子,借助地理探测器依据q值评估各因子对山体效应分布格局的贡献程度,并探究各因子对山体效应的交互作用机制。所选取的8个因子(表2)均通过置信度检验,可认为它们均与天山山体效应的分布格局存在显著关系。
因子探测结果表明,不同时段各驱动因子对山体效应的影响强度存在差异,整体贡献度排序为:地形及区位因子>气候因子>下垫面属性。冬、夏半年地形因子解释力分别高达57%和77%,其中内外程度对山体效应空间分异具有明显的主导作用,尤其在夏半年单因子解释力高达17.40%。绝对高程可以直接表征山体的隆起规模和程度,对冬、夏半年山体效应异质性的解释力分别为11.21%和10.5%。此外,地形粗糙度和地形位指数可共同表征山体的局部结构特征,二者在冬、夏半年对山体效应分异的综合贡献度分别为13.95%和23.72%,是由于地表起伏度越大、越粗糙且切割深度越大,地表热量就越难以与自由大气进行交换,进而影响到山体效应的大小。坡度、坡向是描述微地形尺度的核心因子,对同海拔气温冬、夏半年的综合贡献度分别为18.07%和25.5%,其在局部尺度上通过控制太阳辐射量以及与盛行风向的夹角影响山体的增温幅度[42],并且纬度越高局地地形因子对太阳辐射影响越大[43]。降水量是冬半年山体效应空间分异的第一影响因子,冬、夏半年的解释力分别24%和12%。NDVI可用来表达山区下垫面属性的空间异质性,探测发现其在冬、夏半年的山体效应贡献度分别达19.16%和10.65%,植被格局与气候变化是长期互相影响和适应的结果,下垫面属性的季节转变会造成粗糙度、云量与风速的变化,进一步影响近地表太阳辐射量、潜热及湍流输送等过程,使得区域气温分布具有明显季节性和空间性差异[44⇓-46],进而与其他因子共同造就了中国天山山体效应的空间格局的复杂性。
山体效应相关研究均强调隆起地块对增温效应的基础性作用[47],同时也需关注地形、气候环境和下垫面等各类因子如何共同控制山体效应的分布格局。交互探测的结果表明(图5),多种驱动因子组合交互的解释能力强于单因子,且因子间通过双因子非线性的方式可增强山体效应的空间异质性。两时段内地形与气候的交互均对山体效应空间分异的解释能力最强,其中绝对高程∩降水的交互作用对山体效应的空间分布解释力最典型,在冬、夏半年的贡献率分布为0.33和0.44,说明在同一高程带内降水量的空间差异会显著增强山体效应的空间异质性,绝对高程与内外程度、降水、NDVI之间的交互作用次之。值得注意的是,绝对高程在单因子探测中影响力不大,但与降水、NDVI的交互作用突出,是由于绝对高程与二者协调和叠加共同形成独特的山地环流系统和气候特征,有助于解释山体效应局部的时空异质性和复杂性,也进一步证实了山地隆起程度对山体增温效应的决定性作用。
图5
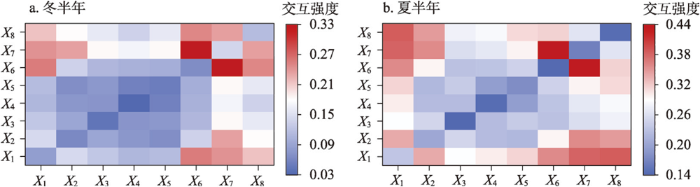
图5
中国天山同海拔气温空间分异驱动因子交互探测结果
Fig. 5
Interactive detection results of spatial differentiation drivers of temperature at the same altitude in the Tianshan Mountains of China
总体来看,不同时段单因子及因子间的贡献度和主导类型存在差异。单因子探测结果表明地形及区位因子对山体效应时空分异影响最大,内外程度和高程的主导作用强烈。而地形—气候的因子间交互作用更明显,绝对高程与内外程度、降水、NDVI的交互作用对山体效应时空分异作用尤为突出。
4.3.2 各隆起区山体效应空间异质性归因
依据地理探测器探测结果,选择对研究区山体效应空间异质性解释力较大的内外程度、绝对高程、降水、NDVI等驱动因子,引入GWR模型识别主要驱动因子在作用方向和强度的空间差异。
GWR相关系数表明各驱动因子均具有空间非平稳性,且变异程度及特征不一(表4)。绝对高程(图6b)对山体效应的影响具有显著的空间非平稳性(冬:-12.11~45.17,夏:-21.75~29.81),整体主要以正向影响为主。绝对高程有效促进了隆起区增温,其中博依阿隆起区和额尔宾隆起区的山体效应受绝对高程的正反馈作用最强烈。降水(图6c)与NDVI(图6d)对冬、夏半年山体效应的影响以负反馈作用为主,降水 (-11.26)的负反馈作用较NDVI(-0.96)更为突出。一般而言,降水量越稀少山体效应越强烈,并且由地形诱发积云所产生降水释放的凝结潜热也是影响隆起区加热效应的原因之一。研究区中部及东部降水的稀少对隆起区增温起到积极作用,巴里坤隆起区负反馈作用最为强烈,西部山体效应微弱与该地区气候湿润有关。整体来看,NDVI表现为微弱的负反馈作用,与NDVI越低山体增温越显著的结论一致。哈尔克他乌山隆起区夏半年NDVI对山体效应的负反馈作用最显著,冬半年博格达及巴里坤隆起区NDVI的控制作用最强。内外程度对山体效应的影响来看(图6a),夏半年以正向为主,冬半年以负向为主。天山南脉隆起区山体效应受内外程度影响最明显,山体内部因湿润气流无法到达变得干燥,同时纬度低所获得较多的太阳辐射量造成山体效应强烈。总体而言,中部及东部隆起区绝对高程相对较高、降水稀少、植被覆盖低有利于山体增温,南部隆起区增温与内外程度关系更为密切。
表4 中国天山各隆起区主要驱动因子作用统计
Tab. 4
| 时段 | 夏半年 | 冬半年 | ||||||||
|---|---|---|---|---|---|---|---|---|---|---|
| 驱动因子 | 内外程度 | 绝对高程 | 降水 | NDVI | 内外程度 | 绝对高程 | 降水 | NDVI | ||
| 中国天山 | 3.82 | 11.90 | -7.73 | -0.47 | -2.99 | 6.39 | -11.26 | -0.72 | ||
| 天山南脉隆起区 | 15.01 | -11.56 | 13.76 | -0.79 | 0.21 | 2.71 | 0.38 | -0.35 | ||
| 哈尔克他乌山隆起区 | 0.93 | 10.34 | -8.21 | -2.25 | -2.93 | 3.02 | -6.61 | -0.59 | ||
| 额尔宾隆起区 | -1.21 | 26.16 | -17.58 | -0.48 | -5.15 | 11.90 | -11.63 | 0.12 | ||
| 博依阿隆起区 | -0.25 | 21.76 | -13.59 | 0.43 | -2.60 | 12.22 | -15.22 | 1.21 | ||
| 博格达隆起区 | 1.46 | 23.34 | -17.45 | -0.06 | -3.59 | 5.19 | -22.15 | -2.50 | ||
| 巴里坤隆起区 | 2.99 | 22.72 | -21.31 | -0.15 | -4.22 | 5.93 | -25.28 | -3.74 | ||
图6
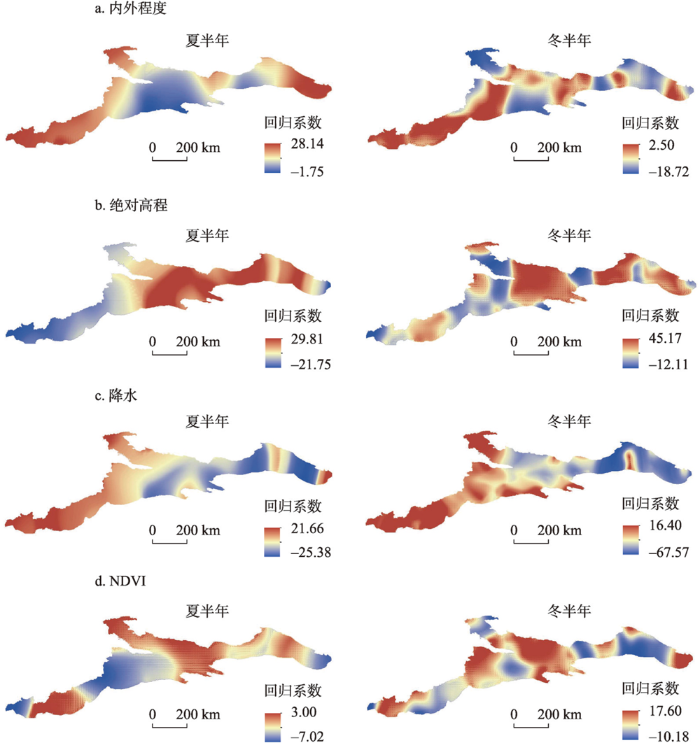
图6
中国天山同海拔气温格局受主要驱动因子作用空间分异
Fig. 6
The spatial differentiation of temperature pattern affected by the main driving factors at the same altitude in the Tianshan Mountains of China
5 讨论
5.1 中国天山与其他山地山体效应特征比较
全球诸多山体的规模/结构、地理位置、基面高度等因素造成山体内部热力效应强弱有别,为增进对山体效应系统性和完整性的认识,收集了全球代表性山地现有研究成果,与本文得出的中国天山山体效应特征进行对比分析。
目前已有典型山地的山体效应特征对比来看,世界“第三极”——青藏高原山体效应最为强烈,其内外温差最高可达10 ℃[35];秦岭[11]、安第斯山脉[17]、阿尔卑斯山[9]与落基山脉[8]增幅次之,天山隆起区冬半年最大增幅约为7 ℃,夏半年约为5 ℃,中国天山的山体效应相对较弱。天山的宽广度和平均海拔等大于阿尔卑斯山等山地,造成其山体效应较小的原因为:一方面,山体效应的剧烈程度与山体基面高度的分布高度一致,青藏高原基面高度[48]分布在2000~5000 m的范围内,山体效应最强烈的西部基面高度更是高达5000 m;秦岭[49]、安第斯山脉[9]山体基面高度在147~4000 m内,阿尔卑斯山[9]、落基山脉[8]基面高度从6~2342 m不等,而天山[48]山体的基面高度(0~2000 m)明显小于其他山脉;另一方面,山体所处的海陆位置与结构、走向及盛行风向、微地形等共同影响区域大气环流进而形成局地气候,以上能量交换过程会影响山体效应的宏观和局部格局。南北走向的安第斯山脉中段玻利维利亚高原西部在南部西风带的影响下大陆度较高[50],因而其山体效应最显著;同为南北走向的落基山脉阻挡盛行西风带来的潮湿气流,错落有致的山脉及巨大沟壑的地形特点和大陆性气候共同导致山体增温[8]。山体效应的强弱也与降水大陆度有关,天山作为东西走向且深居内陆的中纬度山地,山体内分布的大量盆地和谷底气候温和湿润,天山北坡更是能够获得北冰洋冷湿气流带来较多的降水,进而导致天山山体效应强弱的南北差异。以上山地都具有明显的山体效应,并且各自的规模、走向、地理位置及各尺度下的大气环流和地理因素均存在差异。
5.2 山体效应评估因子筛选
山区地—气温转换过程受到多要素的综合影响,本文仅考虑了气压、风速、湿度等部分气象和地形因子。事实上,未纳入本文的其他因子也会影响到山区气候特征[51]。例如,坡向对山区太阳辐射能的分布具有决定性的作用,同时对山区热力、风速、降水再分配等产生重大影响[52];地形起伏度和地形遮蔽度对区域温度和太阳辐射分异影响较大[53]。从地表辐射收支与能量平衡角度来看,地表反照率是关键要素,而下垫面、降水、冰川积雪等的变化将影响地表通量进而改变区域气候[54-55]。太阳辐射作为地球表面能量的主要能源,复杂地形下太阳辐射亦具有时空异质性[56]。在复杂地形区,地形阴影是直接和间接影响太阳辐射的重要因素[57],同时多云天气具有显著的各向异性辐射[58],从能量平衡的视角综合考虑地形、环境要素及其对山区辐射增温的耦合效应,或将对山体效应形成有更为直接的认知。由此来看,本文在探究山体效应空间分异时的因子选取中存在主观和客观局限性。除因子选择外,还需纳入不同因子对地气温转化的作用尺度差异以提高气温反演精度。本文在反演气温的基础上对中国天山山体效应进行评估,并探测影响山体效应的主要驱动因子并模拟其作用的空间非平稳性,厘清了不同隆起区增温主导因子的作用机制。不仅提供一个新的维度来定量确定驱动山体效应产生空间异质性的因子,还探讨了其与山体效应强弱的空间关系。但山体效应主要驱动因子在不同尺度上存在差异,空间尺度变化可能改变山体增温幅度与驱动因子之间的关联性和强度,加之部分因子数据难以获取和量化。因此,未来研究需要将多时空尺度和多源数据相结合,通过跨尺度对山体效应的空间分异规律开展全面的探究。
6 结论
本文基于多源遥感数据和实测气象数据构建山区气温反演模型,分析中国天山山体效应的时空分异特征,并采用地理探测器及GWR模型揭示不同时空尺度山体效应空间分异的驱动机制,主要得到以下结论:
(1)中国天山气温格局复杂多样,其分布整体呈东西高中部低、边缘高内部低的环状格局。气温与海拔、内外程度均呈负相关,夏半年垂直递减率高达0.63 ℃/100 m,距边界的递减速率高达1.39 ℃/10 km,冬半年因广泛而普遍的逆温现象导致垂直递减率仅为0.55 ℃/100 m,气温由外围至内部腹地的降温速度减小至1.03 ℃/10 km。
(2)研究区山体增温效应普遍且显著,隆起区的增温效应强于天山整体均值,其中天山南脉、额尔宾隆起区与巴里坤隆起区的增温效应最为突出。连续大型沟谷和山间盆地等地貌单元的干预既减慢部分隆起区纬向递减速率,也削弱山地气温的海拔依赖性。自西向东,冬、夏半年同海拔气温由外部至内部增幅分别为0.2~3.9 ℃和0.2~3.3 ℃;由北至南冬、夏半年内外增温约1.4~6.3 ℃,增温效应由山体边缘向内部明显增强。
(3)中国天山山体效应时空分异受地形及区位因子主导,其中内外程度和海拔是影响山体效应分异的关键因子。因子间的交互作用对山体效应空间分异的影响大于单一因子,地形与气候是主要交互类型,绝对高程和降水是增强冬、夏半年山体效应空间异质性的主导组合类型。
(4)驱动因子对中国天山山体效应空间变化的作用方向和强度存在明显的空间异质性。绝对高程与山体效应变化呈显著正相关,降水和NDVI则以负反馈作用为主。地形对山体效应的宏观控制作用更大,其与降水、下垫面等因子耦合共同形成独特的山地环流系统和气候特征,进而增强研究区山体效应的时空异质性。
参考文献
The "mountain effect" in the abandonment of grasslands: Insights from the French Southern Alps
DOI:10.1016/j.agee.2016.01.032 URL [本文引用: 1]
Ecological characteristics of mountains and research issues of mountain ecology
DOI:10.17520/biods.2004003
[本文引用: 1]

Mountains are complex ecological systems, with unique structures and functions, and have rich biodiversity, water and mineral resources, and opportunities for tourism. Mountain ecology is the study of mountain structures, functions, and processes, as well as the exploration, sustainable utilization and conservation of mountain resources. In this paper, we review the effects of major topographic elements on ecological factors, summarize the ecological benefits of mountains, and discuss the current research issues and topics for Mountain Ecology. It is emphasized that in topography of mountainous areas is the most critical controlling factor for ecological structures, functions, and processes. Topography affects the abundance and distribution of organisms by modifying solar radiation, heat, moisture, soil and fertility. For this reason, topography and topographyinduced ecological phenomena and processes are considered to be the most critical topics in mountain ecology. Topographic research addresses such issues as ecological complexity, biodiversity, mountain climate changes, mountain ecological engineering, mountain sustainable development, and quantification of topographic elements (elevation, slope, aspect, and location). Among these, developing appropriate methods for quantifying topographic elements is a key technique. We also suggest a need for a synthetic study of relationships between humans and the natural world based mountain sustainable development.
试论山地的生态特征及山地生态学的研究内容
DOI:10.17520/biods.2004003
[本文引用: 1]
山地是一个生态复杂系统,它具有特定的结构和功能,拥有丰富的生物多样性资源、水资源、矿产资源和旅游资源。开展山地生态学研究对阐明山地系统的结构与功能、山地的生态现象与过程,以及合理开发利用和保护山地资源都有极为重要的意义。本文在简要分析山地地形的主要要素对生态因子影响的基础上,对山地的生态效应进行了归纳,探讨了山地生态学应包含的主要研究内容。作者认为,在山区,地形地貌是形成山地结构和功能以及各种生态现象和过程的最根本因素,它通过改变地表的光、热、水、土、肥等生态因子而发生作用。因此,山地生态学应把地形地貌与各种生态现象和过程的相互作用作为其核心的研究内容。作者提出,山地生态学研究主要包括: 山地生态复杂性与生物多样性、山地气候变化、山地生态工程、山区可持续发展综合研究以及山地生态学研究技术与方法论等内容。
A comparison of montane and lowland rain forest in Ecuador: II. The climate and its effects on the distribution and physiognomy of the forests
Invertebrates in the litter and soil at a range of altitudes on Gunung Silam, a small ultrabasic mountain in Sabah
DOI:10.1017/S026646740000184X
URL
[本文引用: 1]
The numbers and biomass of litter and soil invertebrate fauna were investigated in six plots at altitudes of 280 m, 330 m, 480 m, 610 m, 790 m and 870 m on Gunung Silam, Sabah, East Malaysia. There were relatively high numbers and biomass in the lower plots, where the Oligochaeta were a high proportion of the total invertebrate biomass. The biomass of other invertebrate groups was low in the soil. There was a marked effect of altitude, particularly for the Oligochaeta above 610 m. The low biomass of the Oligochaeta in the higher plots suggested that the importance of this group may be diminished at relatively low altitudes on small mountains. However, several other soil faunal groups showed no evidence of an altitudinal effect, and it is suggested that the stunted forests near the summits of small mountains such as Gunung Silam may have a different litter and soil fauna from forests of a similar physiognomy at high elevations on large mountains.
Implications of mass elevation effect for the altitudinal patterns of global ecology
DOI:10.1007/s11442-016-1303-2
[本文引用: 1]
The varied altitudinal gradient of climate and vegetation is further complicated by mass elevation effect (MEE), especially in high and extensive mountain regions. However, this effect and its implications for mountain altitudinal belts have not been well studied until recently. This paper provides an overview of the research carried out in the past 5 years. MEE is virtually the heating effect of mountain massifs and can be defined as the temperature difference on a given elevation between inside and outside of a mountain mass. It can be digitally modelled with three factors of intra-mountain base elevation (MBE), latitude and hygrometric continentality; MBE usually acts as the primary factor for the magnitude of MEE and, to a great extent, could represent MEE. MEE leads to higher treelines in the interior than in the outside of mountain masses. It makes montane forests to grow at 4800-4900 m and snowlines to develop at about 6000 m in the southern Tibetan Plateau and the central Andes, and large areas of forests to live above 3500 m in a lot of high mountains of the world. The altitudinal distribution of global treelines can be modelled with high precision when taking into account MEE and the result shows that MEE contributes the most to treeline distribution pattern. Without MEE, forests could only develop upmost to about 3500 m above sea level and the world ecological pattern would be much simpler. The quantification of MEE should be further improved with higher resolution data and its global implications are to be further revealed.
Quantitative research of mass elevation effect in Colorado Rocky Mountains
DOI:10.11821/dlyj201708006
[本文引用: 4]
Rocky Mountains is the Northern America's largest inland mountains. Its mass elevation effect (MEE) imposes substantial forcing on treeline altitude. As a result, its treeline elevation is much higher than other inland mountains and coastal mountains of the continent. However, most existing literatures on MEE are from a qualitative perspective. This study applied meteorological station records, NCAR/NCEP free air temperature and DEM data to calculate MEE-related temperature increases from inner to out of the Colorado Rocky Mountains (ΔT) and to quantify values of MEE factors, including latitude, mountain bass elevation (MBE), hydric continentality and surface openness. Thereby the magnitude of MEE was computed with ΔT and MEE factors. MEE's impacts on treeline distribution were estimated through isothermal line altitude of the warmest month 10℃ from inner to out of mountains of different ranges. Elevation of isothermal line was interpolated by MODIS land surface temperature data coupled with elevation and deduced temperature lapse rate. Results show that: (1) ΔT is an ideal indicator for MEE. ΔT at adopted stations ranges from 0.78 °C to 4.29°C, whereas mean value is 2.07 ℃. ΔT showed a descending trend from outer ranges toward inner ranges. The greatest ΔT occurred at the center ranges between 38°-39°N. (2) The resulted MEE model for the Colorado Rocky Mountains taking MBE and hydric continentality as independent variables has a high explanatory power of R2 of 71.2%. MBE had the most significant contribution to the model with 55.21%, whereas latitude and surface openness were eliminated. (3) The 10 ℃ isothermal line of the hottest month in the Colorado Rockies was higher in inner ranges than in outer ranges at all the three latitudes, with a difference of 400 m to 700 m. At 38°N and 39°N, differences of 10℃ isothermal line elevation between inner and outer ranges showed strong variation, whereas less at 40°N. This difference corresponds well to air temperature difference between the inner and outer mountain ranges. The findings suggest that MEE was crucial for driving treeline up to higher elevation in the Rocky Mountains. This study developed a quantitative model for the MEE of the Colorado Rocky Mountains and improved our understanding of MEE and its significance for treeline distribution.
科罗拉多落基山脉山体效应定量化研究
DOI:10.11821/dlyj201708006
[本文引用: 4]
落基山脉作为北美最大的内陆山地,其山体效应对林线分布具有很大影响,导致林线海拔远高于周围内陆山体及其他海岸山地。然而,以往落基山脉山体效应研究多集中于定性研究,但是山体效应如何量化,如何根据落基山脉的地形气候条件构建区域山体效应的定量化模型,目前鲜有研究。通过分析台站处山体增温及量化落基山脉山体效应的影响因子,并计算最热月均温10 ℃等温线的海拔高度,来定量化地估算科罗拉多落基山脉山体效应值大小及其对林线分布的影响。结果表明:① 用山体增温值表示山体效应大小是合理且比较理想的指标。科罗拉多落基山脉增温显著,所有台站的增温均值为2.07 ℃,增温幅度为0.78~4.29 ℃。② 科罗拉多落基山脉山体效应的主要影响因素为山体基面高度和降水大陆度,二者与山体增温构建的线性拟合模型具有较高的解释能力,判定系数高达71.2%。③ 科罗拉多落基山脉不同纬度带山体内外最热月10 ℃等温线分布高度对比表明,山体内部理想林线高度均高于山体外部的理想林线分布,内外分布差异为400~700 m。定量分析科罗拉多落基山脉的山体效应模型,优化了区域尺度的山体效应模型精度,有助于深入认识山体效应及其对垂直带分布的影响。
The effect of mountain base elevation on the altitude of timberline in the southeastern Eurasia: A study on the quantification of mass elevation effect
DOI:10.11821/xb201007002
[本文引用: 1]
<p>This paper focuses on the method of quantifying the phenomenon of mass elevation effect (massenerhebungs effect). Geographers have taken notice of mass elevation effect and its influence on mountain altitudinal belts for more than 100 years. But so far, our knowledge on mass elevation effect has been very limited, let alone its quantitative effect on mountain altitudinal belts. Geographers and botanists have established many unitary or dibasic fitting models between mountain altitudinal belts' distribution and longitude or latitude, or both. But most of these models involve small scales and could not be expanded to other regions; while others are established for the northern hemisphere or the whole globe with very low precision. The reason is that these models neglect one of the most important factors controlling the distribution of altitudinal belts—mass elevation effect. It is well known that the higher the mountain range, the greater the mass elevation effect is. So, mountain's base altitude could be a represent of mass elevation effect. We collect 173 samples of forest line distribution, and use latitude, longitude and mountain base elevation (MBE) as independent variables to build a multiple linear regression equation for timberline altitude in the southeastern Eurasian continent. The result turned out that the contribution of latitude, longitude and mountain base elevation to timber line distribution reaches 30.60%, 26.53%, and 42.87%, respectively. North of northern latitude 32°, the contribution for each of the three factors amounts to 53.08%, 21.25%, and 25.67%, respectively; to the south, the contribution is 14.94%, 48.98%, and 36.08%, respectively. The results indicate that MBE, serving as a proxy indicator of mass elevation effect, is a significant factor determining the elevation of altitudinal belts. Compared with other factors, it is more stable and independent in affecting forest line elevation. Of course, mass elevation effect is also determined by other factors, including mountain's volume, the distance to the edge of a land mass, the structures of the mountains nearby, etc. They need to be included in the study of mass elevation effect in the future.</p>
山体基面高度对欧亚大陆东南部林线分布的影响: 山体效应定量化研究
DOI:10.11821/xb201007002
[本文引用: 1]
根据收集到173 个林线数据,采用纬度、经度和基面高度的三元一次方程拟合欧亚大陆东南部林线分布,计算各自的标准回归系数和贡献率,以此来确定山体基面高度(山体效应的简明表达形式) 对林线分布高度的影响。结果表明,纬度、经度和山体基面高度对林线分布高度的贡献率分别为30.60%、26.53%、42.87%。以北纬32o为界线,对其以北、以南区域也分别进行了分析,基面高度的贡献率达到24.10%和39.11%。分析不同尺度和区域山体基面高度作用于林线的贡献率不难发现:在欧亚大陆东南部以基面高度代表的山体效应对于林线高度的影响显著,明显地超过了纬度和经度。基面高度的作用受气候条件和海陆位置影响较小,不论大陆内部或沿海,基面高度分异对山地垂直带分异的影响都相对独立和稳定。该结果定量地表明了山体效应对林线分布高度的重要作用。
Estimation of air temperature based on MODIS and analysis of mass elevation effect in the Qinling-Daba Mountains
DOI:10.11821/dlyj020190164
[本文引用: 2]
As a huge mountain range in the North-South boundary of China, the Qinling-Daba Mountains are characterized by prominent mass elevation effect (MEE) and play an important role in the azonality pattern of climate and ecology in central China. The essence of the MEE is the warming effect of mountains, as huge mountain and plateau absorbs more solar radiation compared with the free atmosphere of the same altitude and then releases in the form of long-wave radiation external heat, making the internal mountain temperature higher than the external in the same altitude of free atmosphere. Therefore, the temperature difference between the mountain interior and the periphery has been suggested as an appropriate indicator to quantify the MEE. To analyze MEE of the Qinling-Daba Mountains, MODIS land surface temperature (LST) data, STRM-1 DEM data and observation data from 118 meteorological stations were combined to estimate monthly mean air temperature by ordinary linear regression (OLS) and geographical weighted regression (GWR) methods in the Qinling-Daba Mountains. Air temperature at an altitude of 1500 m (the average elevation of the Qinling-Daba Mountains) in the interior of the Qinling-Daba Mountains was calculated by a fixed lapse rate and compared with that in the periphery. The results show that: (1) Compared with OLS method, the GWR method has higher accuracy with R 2 > 0.89 and the root mean squared error (RMSE) = 0.68-0.98 ℃. (2) The monthly mean temperature at the altitude of 1500 m estimated by GWR presents a gradual upward trend from east to west. In the western Qinling Mountains, the annual average temperature and temperature in July at the altitude of 1500 m increase about 6 ℃ and 4.5 ℃ compared with the eastern flank, while in the Daba Mountains, they are about 8°C and 5 ℃ higher in the west than in the east. (3) From south to north, with the Hanjiang River as the boundary, the monthly mean temperature at the altitude of 1500 m tends to rise from the rim of the mountains to the ridge. (4) Compared with the lower valleys in Hanzhong and western Henan, the monthly mean temperatures at the altitude of 1500 m are approximately 3.85-9.28 ℃, 1.49-3.34 ℃ and 0.43-3.05 ℃ higher those in the great undulating high mountains in the western Qinling-Daba Mountains, the great undulating middle-high mountains in the Qinling Mountains and the great undulating middle mountains in the Daba Mountains, respectively, and the average temperature difference is about 3.50 ℃. This shows that the MEE of the Qinling-Daba Mountains is obvious and its impact on the distribution patterns of mountain climate and ecology needs to be further studied.
基于MODIS的秦巴山地气温估算与山体效应分析
DOI:10.11821/dlyj020190164
[本文引用: 2]
秦巴山地作为横亘在中国南北过渡带的巨大山脉,其山体效应对中国中部植被和气候的非地带性分布产生了重要的影响,山体内外同海拔的温差是表征山体效应大小较为理想的指标。本研究结合MODIS地表温度(LST)数据、STRM-1 DEM数据和秦巴山地的118个气象站点的观测数据,分别采用普通线性回归(OLS)和地理加权回归(GWR)两种分析方法对秦巴山地的气温进行估算,在此基础上将秦巴山地各月气温转换为同海拔(1500 m,秦巴山地平均海拔)气温,对比分析秦巴山地的山体效应。结果表明:① 相比OLS分析,GWR分析方法的精度更高,各月回归模型的R <sup>2</sup>均在0.89以上,均方根误差(RMSE)在0.68~0.98 ℃之间。② 利用GWR估算得到的同海拔气温,从东向西随海拔升高呈现了明显的升高的趋势,秦岭西部山地比东段升高约6 ℃和4.5 ℃;大巴山西部山地年均和7月份同海拔的气温较东段升高约8 ℃和5 ℃。③ 从南向北,以汉江为分界,秦岭与大巴山的同海拔的气温均呈现出由山体边缘向内部升高的趋势。④ 秦巴山地西部大起伏高山,秦岭大起伏高中山和大巴山大起伏中山,相比豫西汉中中山谷地,各月均同海拔气温分别升高了约3.85~9.28 ℃、1.49~3.34 ℃和0.43~3.05 ℃,平均温差约为3.50 ℃,说明秦巴山地大起伏中高山的山体效应十分明显。
Magnitude and forming factors of mass elevation effect on Qinghai-Tibet Plateau
DOI:10.1007/s11769-016-0834-x URL [本文引用: 1]
Influence of albedo and evapotranspiration on the mass elevation effect in the Qinling-Daba Mountains of China
地表反照率和蒸散发对秦巴山地增温效应的影响
Classification of the high-Andean Polylepis forests in Bolivia
DOI:10.1007/s11258-004-0025-1 URL [本文引用: 1]
Spatial distribution modeling of temperature increase for the uplifted mountain terrains and its characteristics in Southwest China
DOI:10.1007/s11629-016-4120-2 URL [本文引用: 1]
Temperature lapse rate in complex mountain terrain on the southern slope of the central Himalayas
DOI:10.1007/s00704-012-0816-6 URL [本文引用: 1]
The characteristics of temperature variability with terrain, latitude and longitude in Sichuan-Chongqing Region
DOI:10.1007/s11442-012-0923-4 URL [本文引用: 1]
The feedback of land use/cover change on climate
DOI:10.11849/zrzyxb.1999.04.005
[本文引用: 1]
Land Use /Cover Change (LUCC) directly reflects the dominant factor leading to global change—human activities.The study on LUCC will enhance the understanding of the interaction between global change and terrestrial ecosystems,and improve the accuracy of evaluating and predicting the responses of terrestrial ecosystems to global change.In this paper,based on the two well known balance equations—heat and water balance equations on the earth's surface,the authors discuss the feedback of LUCC on climate.The study shows:(a)Vegetation has the function of reducing runoff,storing water and mitigating the effects of global climate change.The effect of vegetation on precipitation may not be considered.(b)The effect of vegetation on climate depends on specific regions.(c)In the middle latitude areas,if changes of the surface albedo and runoff meet the following relationship,Δf=5Δα×10<sup>-4</sup>g/cm<sup>2</sup>·min vegetation will not have an effect on earths surface temperature.This result indicates that strategies concerning global change should be suitable to local conditions.
土地利用/覆盖变化对气候的反馈作用
Geodetector: Principle and prospective
DOI:10.11821/dlxb201701010
[本文引用: 1]
Spatial stratified heterogeneity is the spatial expression of natural and socio-economic process, which is an important approach for human to recognize nature since Aristotle. Geodetector is a new statistical method to detect spatial stratified heterogeneity and reveal the driving factors behind it. This method with no linear hypothesis has elegant form and definite physical meaning. Here is the basic idea behind Geodetector: assuming that the study area is divided into several subareas. The study area is characterized by spatial stratified heterogeneity if the sum of the variance of subareas is less than the regional total variance; and if the spatial distribution of the two variables tends to be consistent, there is statistical correlation between them. Q-statistic in Geodetector has already been applied in many fields of natural and social sciences which can be used to measure spatial stratified heterogeneity, detect explanatory factors and analyze the interactive relationship between variables. In this paper, the authors will illustrate the principle of Geodetector and summarize the characteristics and applications in order to facilitate the using of Geodetector and help readers to recognize, mine and utilize spatial stratified heterogeneity.
地理探测器: 原理与展望
DOI:10.11821/dlxb201701010
[本文引用: 1]
空间分异是自然和社会经济过程的空间表现,也是自亚里士多德以来人类认识自然的重要途径。地理探测器是探测空间分异性,以及揭示其背后驱动因子的一种新的统计学方法,此方法无线性假设,具有优雅的形式和明确的物理含义。基本思想是:假设研究区分为若干子区域,如果子区域的方差之和小于区域总方差,则存在空间分异性;如果两变量的空间分布趋于一致,则两者存在统计关联性。地理探测器q统计量,可用以度量空间分异性、探测解释因子、分析变量之间交互关系,已经在自然和社会科学多领域应用。本文阐述地理探测器的原理,并对其特点及应用进行了归纳总结,以利于读者方便灵活地使用地理探测器来认识、挖掘和利用空间分异性。
Revealing the climatic impacts on spatial heterogeneity of NDVI in China during 1982-2013.
DOI:10.11821/dlxb201903010
[本文引用: 1]
Climate change is a major driver of vegetation activity, and thus its complex processes become a frontier and difficulty in global change research. To understand the complex relationship between climate change and vegetation activity, the spatial distribution and dynamic characteristics of the response of NDVI to climate change from 1982 to 2013 in China were investigated by the geographically weighted regression (GWR) model. The GWR was run based on the combined datasets of satellite vegetation index (GIMMS NDVI) and climate observation (temperature and moisture) from meteorological stations nationwide. The results noted that the spatial non-stationary relationship between NDVI and surface temperature has appeared in China. The significant negative temperature-vegetation relationship was distributed in northeast, northwest and southeast parts of the country, while the positive correlation was more concentrated from southwest to northeast. And then, by comparing the normalized regression coefficients for different climate factors, regions with moisture dominants for NDVI were observed in North China and the Tibetan Plateau, and regions with temperature dominants for NDVI were distributed in the East, Central and Southwest China, where the annual mean maximum temperature accounts for the largest areas. In addition, regression coefficients between NDVI dynamics and climate variability indicated that the higher warming rate could result in the weakened vegetation activity through some mechanisms such as enhanced drought, while the moisture variability could mediate the hydrothermal conditions for the variation of vegetation activity. When the increasing rate of photosynthesis exceeded that of respiration, there was a positive correlation between vegetation dynamics and climate variability. However, the continuous and dynamic responding process of vegetation activity to climate change will be determined by spatially heterogeneous conditions in climate change and vegetation cover. Furthermore, the description of climate-induced vegetation activity from its rise to decline in different regions is expected to provide a scientific basis for initiating ecosystem-based adaptation strategies in response to global climate change.
1982—2013年中国植被NDVI空间异质性的气候影响分析
DOI:10.11821/dlxb201903010
[本文引用: 1]
为研究气候变化与植被活动之间的复杂关系,采用1982-2013年GIMMS NDVI与气象站点温度与水分的监测资料,应用基于像元的地理加权回归方法,探究了中国植被NDVI及其动态特征对气候变化响应的空间格局。中国植被NDVI与地表温度呈空间非平稳关系,在空间上的负相关关系主要集中在东北、西北及东南部分地区,空间正相关则更为集中和连片;针对不同气候指标的标准化系数对比可知,植被NDVI受水分控制作用较为显著的区域主要集中在北方地区以及青藏高原,温度的主导作用区域则分布在华东、华中及西南地区,其中年均最高气温对NDVI的主导区域范围最广;植被NDVI动态与气候变率的回归结果表明,增温速率的升高会通过加剧干旱等机制对植被活动产生抑制作用,水分变率对植被活动的强弱起到了重要的调节作用。
Geographically weighted regression: A method for exploring spatial nonstationarity
DOI:10.1111/gean.1996.28.issue-4 URL [本文引用: 1]
Spatial modeling of soil organic matter over low relief areas based on geographically weighted regression
基于地理加权回归的地形平缓区土壤有机质空间建模
Spatial-temporal variation of snow cover in the Tianshan Mountains from 2001 to 2015, and its relation to temperature and precipitation
2001—2015年天山山区积雪时空变化及其与温度和降水的关系
Study on vertical change features of climate in the southern of Tianshan Mountains
天山南坡气候垂直变化特征
Digital spectrum and analysis of altitudinal belts in the Tianshan Mountains
天山数字垂直带谱体系与研究
Terrain composite index and its application in terrain gradient effect analysis of land use change: A case study of Taihang hilly areas
地形综合指数及其在土地利用地形梯度效应分析中的应用: 以太行山浅山丘陵区为例
Evaluating cloud contamination in clear-sky MODIS terra daytime land surface temperatures using ground-based meteorology station observations
DOI:10.1175/JCLI-D-12-00250.1
URL
[本文引用: 1]
Environment Canada meteorological station hourly sampled air temperatures Tair at four stations in the southwest Yukon were used to identify cloud contamination in the Moderate Resolution Imaging Spectroradiometer (MODIS) Terra clear-sky daytime land surface temperature (LST) and emissivity daily level-3 global 1-km grid product (MOD11A1, Collection 5) that is not flagged by the MODIS quality algorithm as contaminated. The additional cloud masking used qualitative ground-based sky condition observations, collected at two of the four stations, and coincident MODIS quality flag information. The results indicate that air temperature observed at a variety of discrete spatial locations having different land cover is highly correlated with MODIS LST collected at 1-km grid spacing. Quadratic relationships between LST and air temperature, constrained by ground observations of “clear” sky conditions, show less variability than relationships found under “mainly clear” and “mostly cloudy” sky conditions, and the more clouds observed in the sky coincides with a decreasing y intercept. Analysis of MODIS LST and its associated quality flags show a cold bias (&lt;0°C) in the assignment of the ≤3-K-average LST error, indicating MODIS LST has a maximum average error of ≤2 K over a warm surface (&gt;0°C). Analysis of two observation stations shows that unidentified clouds in MODIS LST are between 13% and 17%, a result that agrees well with previous studies. Analysis of daytime values is important because many processes are dependent on daylight and maximum temperature. The daytime clear-sky LST–Tair relationship observed for the good-quality confirmed cloud-free-sky MODIS LST quality flag can be used to discriminate cloud-contaminated grid cells beyond the standard MODIS cloud mask.
Estimation of air temperature from remotely sensed surface observations
DOI:10.1016/S0034-4257(96)00216-7 URL [本文引用: 1]
Changes of glacier mass balance in Manas river basin based on multi-source remote sensing data
DOI:10.11821/dlxb202001008
[本文引用: 1]
The glacier mass balance (GMB) is an important link between climate and water resources, which has remarkable regulation functions for river runoff. The research, using MOD11C3, TRMM 3B43 and other multi-source remote sensing data to drive the degree-day model, simulates the GMB processes and analyzes the recharge of glacial meltwater to runoff in the Manas River Basin (MRB) during 2000-2016. The results show that: (1) By constructing the temperature and precipitation inversion model, the accuracy of the meteorological remote sensing data can be effectively corrected, and the characteristics of climate change in the glacial region can be well described after downscaling. The annual average temperature and precipitation in the glacier area were -7.57 ℃ and 410.71 mm, respectively. The place at an altitude of 4200 m is a severe climate change zone. Above 4200 m, the temperature drop rates and precipitation gradients were -0.03 ℃/100 m and -2.66 mm/100 m, respectively; while below 4200 m, they were -0.57 ℃/100 m and 4.8 mm/100 m, respectively. Besides, at a higher altitude of 4700 m, the precipitation increased by 5.17 mm/100 m. (2) During the study period, the glaciers in the basin continued to be in a negative state, with a cumulative GMB of -9811.19 mm w.e. and an average annual GMB between -464.85 mm w.e. and -632.19 mm w.e. The vertical GMB increased by 244.83 w.e./100 m and 18.77 w.e./100 m in the ablation zone and the accumulation zone, respectively. From 2000 to 2002 and 2008 to 2010, the melting of glaciers slowed down, and the ablation was intensified from 2002 to 2008 and from 2010 to 2016. Strikingly, the loss of glaciers was most serious during the period 2005-2009. (3) The river runoff responded strongly to the change of GMB within the year, especially in July and August, namely, the GMB loss accounted for 75.4% of the total amount of the whole year, and the river runoff accounted for 55.1% of the annual total. The inter-annual glacial meltwater recharge rate fluctuated between 19% and 31%, which may be due to the differences of precipitation and snow melt water recharge rates in different years. The contribution rate of glacial meltwater of the MRB is close to that of other river basins on the northern slope of the Tianshan Mountains, which can further confirm the reliability of the GMB estimation results. Above all, the research can provide reference for the study of GMB in other river basins.
基于多源遥感数据的玛纳斯河流域冰川物质平衡变化
DOI:10.11821/dlxb202001008
[本文引用: 1]
冰川物质平衡变化是连接气候和水资源的重要纽带,对河川径流有重要的调节功能。本文采用MOD11C3和TRMM 3B43等多源遥感数据驱动度日模型,模拟了2000—2016年玛纳斯河(简称玛河)流域冰川物质平衡过程,并分析了冰川融水对径流的补给规律。结果表明: ① 通过构建气温及降水反演模型能有效校正气象遥感原数据的精度,且经降尺度后能较精细刻画冰川区气候变化特征。冰川区年均气温和降水量分别为-7.57 ℃和410.71 mm,海拔4200 m处为气候变化剧烈地带,气温直减率以其为界上下分别为-0.03 ℃/100 m和-0.57 ℃/100 m,降水梯度分别为-2.66 mm/100 m和4.8 mm/100 m,海拔大于4700 m后降水又以5.17 mm/100 m递增。② 研究期内流域冰川持续呈负平衡状态,累积物质平衡达-9811.19 mm w.e.,年均物质平衡介于-464.85~-632.19 mm w.e.之间。垂向物质平衡在消融区和积累区分别以244.83 mm w.e./100 m、18.77 mm w.e./100 m递增。2000—2002年、2008—2010年冰川消融减缓,2002—2008年、2010—2016年消融加剧,其中2005—2009年期间冰川亏损最为强烈。③ 年内河川径流对冰川物质平衡变化响应强烈,尤以7月、8月物质平衡亏损最为严重占全年总量的75.4%,使得同期河川径流量占全年径流总量的55.1%。年际冰川融水补给率波动于19%~31%之间,可能是不同年份降水和积雪融水补给率差异较大所致。玛河与天山北坡其他河流冰川融水贡献率非常接近,也进一步证实了本研究物质平衡估算结果的可靠性。本研究可为其他流域冰川物质平衡研究提供借鉴和参考。
Establishment of comprehensive drought monitoring model based on downscaling TRMM and MODIS data
DOI:10.31497/zrzyxb.20201019
[本文引用: 1]
The Beijing-Tianjin-Hebei region is one of the main producing areas of high-quality winter wheat in China, but drought disasters frequently occur in this region under the influence of global warming. Accurate monitoring of drought in the Beijing-Tianjin-Hebei region can not only provide scientific guidance for regional agricultural production, but also play an important strategic role in guaranteeing national food security. Therefore, in this study, drought-causing factors such as precipitation, vegetation growth, soil moisture gain and loss were considered comprehensively. Firstly, the GWR (Geographical Weighted Regression) model was used to downscale TRMM (Tropical Rainfall Measuring Mission) 3B43 data, and the Precipitation Condition Index (<em>PCI</em>) with a 1-km resolution was obtained. Combining MODIS (Moderate-Resolution Imaging Spectroradiometer) data, the Vegetation Condition Index (<em>VCI</em>), Temperature Condition Index (<em>TCI</em>) were obtained. Finally, a comprehensive drought index (<em>CDI</em>) was constructed based on the multiple regression model to achieve spatial and temporal monitoring and evaluation. The results show that: (1) The annual and monthly data of the 1-km spatial resolution TRMM based on the GWR model and proportion coefficient method have been greatly improved in spatial resolution compared with the original TRMM data, and the accuracy of the data has also passed the test, which shows that the downscaling analysis improves the description ability of TRMM data to the spatial and temporal characteristics of precipitation in the study area. (2) The results of the monitoring model are basically consistent with the drought process. The correlation coefficient (<em>R</em> value) between <em>CDI</em> and Standard Precipitation Index (<em>SPI</em>) was 0.45-0.85, and the correlation coefficient between <em>CDI</em> and drought area of crops ranged from -0.81 to -0.86, and all of them passed the very significant test of <em>P</em><0.01, and the <em>R</em> value was greater than 0.6 between the <em>CDI</em> and standardized unit yield of crop (<em>P</em><0.05), which indicated that the comprehensive drought monitoring model constructed by this research was applicable in the Beijing-Tianjin-Hebei region.
基于TRMM降尺度和MODIS数据的综合干旱监测模型构建
MODIS-based estimation of air temperature and heating-up effect of the Tibetan Plateau
DOI:10.11821/xb201301011
[本文引用: 2]
Time series of MODIS land surface temperature (LST) data, together with meteorological data of 137 stations and ASTER GDEM data for 2001-2007, were used to estimate and map the spatial distribution of monthly mean air temperatures of the Tibetan Plateau and neighboring areas. Time series and regression analyses of monthly mean land surface temperature (Ts) and monthly mean air temperature (Ta) were conducted using both ordinary linear regression (OLS) and geographical weighted regression (GWR) methods. Analysis shows that recorded Ta is rather closely related to Ts, and that the GWR method has a much better result (adjusted R<sup>2</sup> > 0.91, root mean square error (RMSE)=1.16-1.58℃) for estimating Ta than OLS. The GWR model, with MODIS Ts and altitude as independent variables, was thus used to estimate Ta for the Tibetan Plateau. For more than 80% of the stations, the Ta retrieved from Ts had residuals lower than 2℃. Analysis of the spatial pattern of retrieved Ta data showed that the mean Ta of the summer half year was higher than 0℃ even at high altitudes of 5000±600 m of the plateau, especially in the warmest month (July) the Ta in high mountain areas with altitudes of 4000-5500 m could reach as high as 10 ℃. This may help explain why the highest timber line in the northern hemisphere is located on the Tibetan Plateau. According to our results, Ta in July was probably 6-10℃ warmer in the inner plateau than in the outer plateau at any given elevation which resulted from the heating up effect of the Plateau.
基于MODIS数据的青藏高原气温与增温效应估算
Global controls of forest line elevation in the northern and southern hemispheres
DOI:10.1046/j.1365-2699.2000.00162.x URL [本文引用: 1]
Spatio-temporal variation in soil conservation service and its influencing factors in the upper reaches of the Yellow River
黄河上游地区土壤保持服务时空变化及归因
Quantitative attribution of national key town layout based on geodetector and the geographically weighted regression model
DOI:10.18306/dlkxjz.2020.10.008
[本文引用: 1]
National key towns are the leader in the development of small towns. The formation of scientific and reasonable national key town layouts is of great significance for optimizing China's urbanization strategy. Taking the 1887 and 3675 national key towns published in 2004 and 2014 respectively as samples, this study used geodector and the geographically weighted regression (GWR) model to explore the changing characteristics of their distribution and analyze the influencing factors of national key town layouts and effects at the prefecture level. The results show that: 1) After the adjustment by the government, the balance of the layout and construction effect of national key towns is enhanced. The main gathering areas moved westward and northward, the distribution of cold spots and hotspots break through the "Hu Huanyong Line", and the degree of differentiation of economic radiation effect is weakened, reflecting the powerful influence of policy factors. In addition to the inter-county balance and regional preferential policies, the distribution of national key towns is also significantly affected by factors such as altitude, road network density, and resident population urbanization rate. 2) The combination of the factor detector, the GWR model, and the interaction detector can more accurately characterize the mode of action, direction, path, and intensity of the influencing factors. The layout of national key towns is not the result of the uniform, independent, and direct effect of the five significant factors, but the product of the synergistic effect of the interaction of the factors with spatial heterogeneity. 3) The synergy between the inter-county balance policy and other factors is the dominant force in the formation of the existing layout of the key towns; the effect of the regional preferential policy is overall positive, but the target areas need to be more accurately identified.
基于地理探测器和GWR模型的中国重点镇布局定量归因
DOI:10.18306/dlkxjz.2020.10.008
[本文引用: 1]
重点镇是小城镇发展的龙头,形成科学合理的重点镇布局对优化中国城市化战略格局有重要意义。论文以2004年和2014年分别公布的1887个和3675个全国重点镇为样本,对其分布及效应的变动特征进行探究,进而在地级尺度对重点镇布局的影响因子及其作用进行地理探测和局部空间回归。结果表明:① 经增补调整,中国重点镇布局及建设效应的均衡性增强,主要集聚区西移北扩,冷热点的分布突破“胡焕庸线”,经济辐射效应的分化程度减弱,体现出政策因素的有力影响。除县际均衡和区域倾斜政策外,重点镇的分布还受到海拔高度、公路网密度、常住人口城镇化率等因子的显著作用。② 因子探测器、GWR模型和交互作用探测器的结合能更精准地刻画影响因子的作用方式、方向、路径和强度。中国重点镇的布局不是5个显著性因子均匀、独立、直接作用的结果,而是影响均具空间异质性的各因子两两交互作用后增效的产物。③ 县际均衡政策与其他因子的协同作用是形成现有重点镇分布格局的主导力量;区域倾斜政策的效果总体较好,但目标区域还需更准确。
The responses of glaciers and snow cover to climate change in Xinjiang (I): Hydrological effect
新疆冰川、积雪对气候变化的响应(І): 水文效应
Snow cover persistence reverses the altitudinal patterns of warming above and below 5000 m on the Tibetan Plateau
Some aspects of the thermal influences of the Qinghai-Tibetan Plateau on the atmospheric circulation
DOI:10.1007/BF02258032 URL [本文引用: 1]
Distributed modelling of direct solar radiation of rugged terrain over the Yellow River Basin
DOI:10.11821/xb200504017
[本文引用: 1]
<p>Due to the influences of local topographical factors and terrain inter-shielding, calculation of DSR quantity over rugged terrains is very complex. Based on DEM (digital elevation model) data and meteorological observations, a distributed model for calculating direct solar radiation over rugged terrains is developed. This model gives an all-sided consideration on factors influencing DSR. Using the selected model, normals of annual DSR quantity with a resolution of 1 km×1 km for the Yellow River Basin was generated, with DEM data as the general characterization of the terrains. Characteristics of DSR quantity influenced by geographic and topographic factors over rugged terrains were analyzed thoroughly. The results suggest that influenced by local topographic factors, i.e. azimuth, slope and so on, the annual DSR quantity over mountainous area has a clear spatial difference; and the annual DSR quantity of sunny slope (or southern slope) of mountains is obviously larger than that of shady slope (or northern slope). The calculated DSR quantity of the Yellow River Basin is provided in the same way as other kinds of spatial information and can be employed as basic geographic data for relevant studies as well.</p>
起伏地形下黄河流域太阳直接辐射分布式模拟
Temporal and spatial variation of sunshine duration and related driving forces in Tianshan Mountain during 1961-2015
1961—2015年新疆天山日照时数时空变化特征及其影响因素分析
Spatial variation of humidity and its influencing factors in the north and south slopes of the Tianshan Mountains, China during 1966-2015
1966—2015年天山南北坡空气湿度差异及其影响因素
Temperature profiles in radiative-convective equilibrium above surfaces at different heights
DOI:10.1029/1999JD900485 URL [本文引用: 1]
Mountain uplift and surface temperature changes
DOI:10.1029/96GL03953 URL [本文引用: 1]
The effect of mountain basal elevation on the distribution of snowline with different mountain basal elevations in Tibetan Plateau and its surrounding areas
DOI:10.11821/dlyj201401003
[本文引用: 2]
Mountain elevation effect (MEE) is a major factor responsible for the spatial pattern of mountain altitudinal belts. Mountain basal elevation (MBE) was thought to be the most important factor of MEE. And it almost can be regarded as MEE itself. In Tibetan Plateau and its surrounding areas, the contours of snowline present an approximation of rings, a large degree change from its basic distribution pattern with latitude. It was thought to have a close relationship with MEE and MBE. In order to quantitative analyze the Influence of MBE to snowline, we compiled 142 snowline descriptions from literatures covering the Tibetan Plateau and its surrounding areas. Snowline elevation was related to longitude, latitude and MBE, to construct a multivariate linear regression equation. And then, the standard regression coefficient and relative contribution of each influencing factors were counted out, so as to compare the influence of three factors. Afterwards, we divided all samples into 5 subsets according to their MBE (0-1000 m, 1001-2000 m, 2001-3000 m, 3001~ 4000 m, 4001-5000 m), for the purpose of analyzing the effect of MBE to the snowlines. The results turned out that, (1) to the whole research area, the relative contribution of latitude, longitude and MBE to snowline distribution reach to 30.60%, 26.53%, and 42.87%, respectively; (2) as the uplift of MBE and the reduction of research scale, the determination coefficient (R<sup>2</sup>) of each subset model diminishes and retains a high domain (0.668-0.895), which illustrates the significant and scientificity of the model clearly; (3) the relative contribution of latitude decreases linearly with the increase of MBE (92.6%-48.99%, R<sup>2</sup>=0.855), while the effect of MBE increases obviously with its uplift (3.33%-31.76%, R<sup>2</sup>=0.582), the higher the MBE, the more significant influence to snowline.
山体基面高度对青藏高原及其周边地区雪线空间分布的影响
DOI:10.11821/dlyj201401003
[本文引用: 2]
山体效应是地理地带性之外,在大尺度上影响垂直带分布的主要因素,山体基面高度则是山体效应的第一影响因子。青藏高原及其周边地区,雪线呈现出中心高、周围低,与山体基面高度相一致的环状分布模式。为分析山体基面高度对雪线分布的影响,本文共收集青藏高原及周边地区雪线数据142个,采用纬度、经度和基面高度为自变量的三元一次方程拟合研究区雪线分布,计算各自的标准回归系数和相对贡献率,再将基面高度划分成5个子集(0~1000 m、1001~2000 m、2001~3000 m、3001~4000 m和4001~5000 m),分析基面高度不同的山地对雪线的影响差异。结果表明:① 在青藏高原,纬度、经度和基面高度对雪线高度分布的相对贡献率分别为51.49%、16.31%和32.20%;② 随着基面高度的增高,各子集模型的决定系数虽有逐渐降低的趋势,但仍保持在较高的值域(R<sup>2</sup>=0.895~0.668),说明模型的有效性;③ 随基面高度的抬升,纬度和山体基面高度对雪线分布高度的相对贡献率分别表现出降低(92.6%~48.99%,R<sup>2</sup>=0.855)和增大(3.33%~31.76%,R<sup>2</sup>=0.582)的趋势,表明基面高度越高,其对雪线分布高度的影响越大。
Extraction and distribution of mountain base elevation in the Qinling-Daba Mountains
秦巴山地山体基面高度的提取及分布
DOI:10.12082/dqxxkx.2018.180227
[本文引用: 1]
秦巴山地是中国的南北分界线,也是黄河和长江的分水岭,其山体效应的定量化影响秦巴山地山体垂直带的分布格局、非地带性因素的作用强度和机理,以及中国暖温带和北亚热带的具体位置的确定。山体基面高度是影响山体效应最重要和关键的地形因子,其定量化和数字化提取是秦巴山地山体效应定量化研究的重要内容。本研究针对秦巴山地山体效应的定量化研究,使用30 m分辨率的STRM-1数据,分别基于山体特征线和流域分区2种方法提取了秦巴山地的山体基面高度分区,并根据地形起伏度和坡度,确定基面范围,计算了山体基面高度值。结果表明:① 基于山体特征线的方法将秦巴山地分为93个基面高度分区,基于流域分区的方法将秦巴山地分为209个基面高度分区,根据2种分区结果提取的基面高度值相差不大且均体现了秦巴山地地势的特点;② 秦巴山地山体基面高度从东向西呈阶梯状递增的趋势;③ 从南到北,秦巴山地的东段和中段均呈先增高后降低的趋势,即从大巴山向北至汉江谷地降低,再向北至秦岭升高;④ 山地的不同侧翼的山体基面高度不同,秦岭南坡的基面高度(1000~1809 m)明显高于北坡(850~1300 m)。秦巴山地山体基面高度与其植被带分布上限联系密切,实现山体基面高度的数字化提取,为山体效应的定量化研究提供了重要的技术支持。
Hydroclimate of the Andes (Part II): Hydroclimate variability and sub-continental patterns
A review on air temperature estimation by satellite thermal infrared remote sensing
DOI:10.11849/zrzyxb.2014.03.017
[本文引用: 1]
As an important climate resource, near surface air temperature plays an essential role in driving the vegetation growth, monitoring agro-meteorological disasters and global change. The spatially continuous air temperature images, which can be better derived from remotely sensed data than interpolated of meteorological data from limited ground stations, are required as the important input parameters by several environmental models at the regional scale. To serve and support the scientific research and business work concerning the distribution of air temperature at regional scale, in this paper, we firstly introduced the main five categories of methods to estimate air temperature from remotely sensed thermal data, including simple statistical approaches, the advanced statistical approaches, the temperaturevegetation index (TVX), the method based on surface energy balance and the one based on temperature lapse rate. Then, the approaches of maximum, minimum and mean air temperatures estimation were discussed in more details, followed by the comparison of air temperature estimation at different temporal and spatial scales. Finally, the problems and prospects for remotely sensed estimation of air temperature were summarized.
气温遥感估算方法研究综述
DOI:10.11849/zrzyxb.2014.03.017
[本文引用: 1]
气温作为重要的气候资源之一,在植被长势、农业灾害和气候变化研究中发挥着举足轻重的作用。目前大尺度农业、气候模型都需要空间分布的气温作为输入参数。除了用有限的台站数据空间插值获取气温栅格化数据外,遥感技术更为连贯精细的气温空间观测提供了有力的数据支持。为服务区域尺度气温相关的科研及业务工作,论文首先介绍了目前国内外气温遥感估算的主要方法,包括简单统计法、高级统计法、温度-植被指数分析法(TVX法)、地表能量平衡法及大气温度廓线外推法。再根据实际应用需要,重点总结比较了最高、最低和平均气温及不同时空尺度气温的遥感估算特点。最后讨论了气温遥感估算在实际应用中存在的问题并探讨了未来的研究趋势。
Simulation of the total solar radiation over micro-landform and correlation between the solar radiation and the land surface temperature
微地形上太阳辐射模拟及与地表温度关系研究
Variations of land surface albedo and its influencing factors in China from 2000 to 2017
DOI:10.11821/dlyj020210005
[本文引用: 1]
In the context of global warming, land surface albedo has become one of the important input parameters for climate simulation. The radiation data of 34 sites provided by Chinese Ecosystem Research Network (CERN), GLASS land surface albedo products, ERA-Interim reanalysis data, MODIS EVI (MOD13A3) and meteorological data provided by China Meteorological Administration were used to analyze the variation characteristics of the land surface albedo in different ecosystems based on Sen's Slope trend analysis; correlations and relative importance between land surface albedo and climate variables were calculated using all-subsets regression and hierarchical partitioning methods. The results showed that the bare land and rock or gravel land had the largest slope value from 2000 to 2017, being -0.083% yr-1 in winter. Pixels with significant correlations between land surface albedo and precipitation, EVI, soil moisture, and temperature during the growing season accounted for 73%, 79%, 56%, and 86% of the total pixels, respectively. EVI was the dominant factor in the change of land surface albedo in arid and semi-arid regions, and the independent contribution rates of these two types of regions were 41% and 56.18%, respectively. The effects of precipitation and temperature on land surface albedo in Northeast China in July lagged about 2 months. The influence of soil moisture on land surface albedo lagged about 1-2 months in the desert areas of Inner Mongolia and Middle-Lower Yangtze River Plain.
2000—2017年中国区域地表反照率变化及其影响因子
DOI:10.11821/dlyj020210005
[本文引用: 1]
在全球气候变暖的背景下,地表反照率已成为地表辐射平衡和气候研究的重要参数之一。利用中国陆地生态系统研究网络(Chinese Ecosystem Research Network,CERN)提供的34个站点辐射数据、GLASS地表反照率产品、ERA-Interim再分析资料、MODIS EVI(MOD13A3)和中国气象数据共享网提供的气象数据,基于Sen's Slope趋势分析方法,分析不同生态系统地表反照率的变化特征;利用全子集回归和分层分解方法计算地表反照率与各要素之间的相关性和相对重要性;探讨各气候因子对地表反照率的影响。结果表明,2000—2017年裸土地和裸岩砾石地变化率最大,冬季斜率达-0.083% yr<sup>-1</sup>。生长季地表反照率与降水、增强型植被指数(Enhanced Vegetation Index,EVI)、土壤水分和气温显著相关的像元分别占总像元的73%、79%、56%和86%。EVI是干旱和半干旱地区地表反照率变化的主导因素,其对地表反照率变化的独立贡献率分别为41%和56.18%。7月东北地区降水量和气温对地表反照率的影响大约滞后2个月;内蒙古沙漠地区和长江中下游平原土壤水分对地表反照率的影响大约滞后1~2个月。
Estimating solar radiation on slopes of arbitrary aspect
DOI:10.1016/S0168-1923(01)00245-3 URL [本文引用: 1]
An efficient method of estimating downward solar radiation based on the MODIS observations for the use of land surface modeling
DOI:10.3390/rs6087136 URL [本文引用: 1]
Assimilating remote sensing data into GIS-based all sky solar radiation modeling for mountain terrain
An integrated approach to estimate shortwave solar radiation on clear-sky days in rugged terrain using MODIS atmospheric products
DOI:10.1016/j.solener.2014.12.028 URL [本文引用: 1]
