

1 引言
植被净初级生产力(Net Primary Productivity, NPP)是指绿色植物在单位时间和单位面积上,由光合作用产生的有机干物质总量中扣除自养呼吸后的剩余部分[1-2]。作为植被生态系统中物质与能量转换和传递的基础,NPP在气候变化研究中可充当“指示剂”的作用,也是碳循环的一个重要指标参数[3],其变化受气温、降水、日照等多重气象因素的影响。IPCC第六次评估报告(AR6)指出,21世纪以来的前20年全球平均温度较工业革命前(1850—1900年平均)增加了1.09 °C,相伴随的降水也在20世纪80年代后呈现较明显的增加态势[4]。全球气候变化对植被物候[5]、地域分布[6]、功能和结构[7]等影响已日渐显著。统计表明,气候变暖导致了20世纪80年代至今全球陆地尤其是北半球高纬度植被的显著变绿[8];1982—1999年全球陆地NPP的变化中,6%的增加与气候变化相关,其中低纬地区增幅最大[9]。
大尺度的气候因子对区域乃至全球气候变化有显著影响[10-11],这些气候因子可以通过改变区域水热、光照、辐射等变量影响植物的光合与呼吸、物候期、生理结构和形态特征等,进而造成NPP、GPP、NDVI等植被参数相应的变化。其中行星尺度的北大西洋涛动/北极涛动(NAO/AO),作为冬季北半球中高纬度大气环流变率的第一模态,对区域环境影响尤为显著[12⇓-14]。统计显示泛北极地区近87%的区域植被生长季始期与春季AO的相关系数达-0.65(p < 0.01),说明AO正位相时,有利于春季物候的提前[15]。同时,还能通过大气波列对一些特定敏感区的气候和植被产生影响,如Li等[16]指出冬季NAO激发罗斯贝波(Rossby)向下游的传播,NAO正位相时贝加尔湖地区上空有反气旋环流异常,可增强区域下行太阳辐射、加速积雪消融、减少地表反照率,使其近地面气温上升,导致植被显著变绿,4—6月的西伯利亚地区NDVI与1—3月NAO指数的相关性达0.56(p < 0.01)。Gouveia等[17]指出1982—2002年1—3月NAO与伊比利亚半岛中部地区6—8月NDVI的相关性达-0.70,冬季NAO正位相时,夏季伊比利亚半岛中部降水减少、伴随下行短波辐射的增加、气温偏高,导致植被NPP降低。其他一些中高纬度环流因子,如斯堪的纳维亚遥相关型[18]、东大西洋遥相关型[19]等对区域植被也具有显著影响。
重要的海—气因子,也可通过大气环流直接影响当地气候、或者间接影响中高纬度区域气候,进而造成植被活动的显著变化。其中,低纬度年际气候变率最重要的气候因子厄尔尼诺—南方涛动(ENSO)对气候的影响尤为突出[20]。研究表明,ENSO暖(冷)位相时,赤道太平洋地区的环流异常导致亚马逊[21]、印度尼西亚[22]、澳大利亚[23]等受ENSO强烈影响的环太平洋低纬气候的显著异常,造成其植被生长的异常,同时还通过影响热带辐合带导致非洲热带南、北部干旱时长和水汽辐合异常,影响其植被生长的年际变化[24]。值得注意的是,ENSO还可经大气遥相关,间接影响中高纬度的气候和植被。一方面,赤道中东太平洋的海温异常能通过太平洋—北美遥相关型造成北美、欧洲等中高纬大尺度环流异常,导致从秋季至次年夏季区域气温的持续异常,引起同期NDVI的显著变化[25]。另一方面,海洋性大陆地区的非绝热异常能激发向欧亚大陆高纬度的波列影响西伯利亚地区的大气环流,造成其气候和植被的显著异常,如Li等[26]指出了在东部型厄尔尼诺年,孟加拉湾持续的海温负异常及海气反馈引发对流活动异常,可激发至远东的Rossby波列,在堪察加一带形成气旋性环流异常,导致相邻西侧的西伯利亚异常偏北风,地表气温下降,NDVI偏低。此外,大西洋多年代际振荡、高纬海冰也是重要的植被活动驱动因子[27-28]。
2 数据与方法
2.1 研究区概况
研究区位置大致介于24°N~28°N和90°E~100°E的印缅地区(图1a)。印缅地区整体地势由南向北倾斜,71%的区域海拔不到1500 m。区域内河网密集,自西向东依次有布拉马普特拉河、伊洛瓦底江、萨尔温江和湄公河等重要河流流经,且植被资源丰富,林地面积占比可达研究区总面积的80%以上(图1a),1981—2018年冬季区域平均的NPP为139.7 gC·m-2,最大超过400 gC·m-2。为了解研究区的气候背景,利用CRU和ERA5气温资料,统计了1981—2018年印缅地区所有格点的逐月气温,算术平均得到各月区域气候值,结果发现(图1b曲线),1981—2018年印缅地区平均气温CRU和ERA5分别为19.5 ℃和18.1 ℃,其中最冷月(1月)均温能达11 ℃以上。同时,利用5套格点降水依次计算了1981—2018年印缅地区平均的各月降水量,几套资料由于分辨率、来源不同,降水量的数值存在一些差异,但是总体特征的一致性还是很好的。所有资料平均后的多年平均降水量达2057 mm,但季节分配极不均匀,6—8月(夏季)降水占了全年降水总量的50%以上,每年11月份开始雨量迅速下降,11月、12月和1月的降水量均低于30 mm。总的来看,冬季温暖少雨的情况持续至次年3月(图1b),因而降水是冬季生态环境的一个敏感参数。
图1
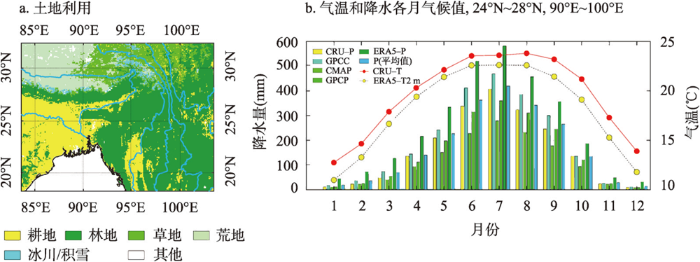
图1
印缅地区2015年土地利用及1981—2018年气候状况
Fig. 1
Land use in 2015 and long-term means of monthly temperature and precipitation during 1981-2018 over Indo-Myanmar
2.2 数据来源
本文NPP数据来自国家生态科学数据中心提供的1981—2019年逐日数据[31],该产品是利用植被参数(叶面积指数、聚集度指数、地表覆盖)遥感数据、气象数据和大气CO2浓度等,由驱动日步长的机理性生态模型(BEPS)生成。该模型综合考虑了生态、气象、水文、植物生理等过程,模拟植物的光合作用、呼吸作用、碳的分配、冠层蒸腾、土壤蒸发等生态系统碳、水循环过程[32]。模型涉及的参数相对较少,其中地表植被的信息基于遥感数据,有高效实时的优势,应用广泛,在北美加拿大地区[33]、东亚地区[34]、中国区域[35]等全球大范围陆地植被NPP的估算验证中,表明产品应用于区域植被生态系统NPP模拟和监测研究是可信的。该产品覆盖全球,空间分辨率约0.07°,时间分辨率为日。原始数据为逐日累积的NPP,本文依次将1981—2019年各月最后1 d的累积NPP减去前一月最后1 d的累积NPP,得到该月NPP值。
土地利用数据取自Liu等[36]提供的1982—2015年全球土地覆盖数据集,空间分辨率为5 km。为去除土地利用变化对AO与NPP统计关系的可能影响,选择其中的1982年和2015年两期土地利用数据提取未发生土地利用变化的NPP格点进行分析。
分析使用的逐月大气环流场为ERA5再分析资料,空间分辨率为0.25°[39],包括经向风、纬向风、垂直速度、整层水汽和比湿,涉及的高度层主要是对流层,从1000 hPa到100 hPa,共计9层。由于NPP资料时间跨度为1981—2018年,因此将所有资料的选取时段统一为1981—2018年,主要分析AO最为活跃的冬季(12—次年2月)和春季(3—5月),3个月的平均值分别计为冬季指数和春季指数。
2.3 研究方法
2.3.1 相关性分析
相关性分析可用于衡量两个要素间线性关系的强弱程度。本文使用了回归分析和皮尔逊相关分析方法计算了AO与NPP、气温、降水和大气环流,以及NPP与气温和降水等要素的回归系数和相关系数,还利用偏相关分析方法计算了NPP与气温在排除降水可能的交叉影响后的偏相关系数,相关系数和偏相关系数的计算公式可参考文献[44],取值范围均为-1~1,当回归系数/相关系数/偏相关系数大于0,表示变量间的线性关系呈现正相关,反之为负相关,考虑到这些方法很容易忽视大气海洋中的非线性过程,还利用合成分析方法进行检查。统计的显著性检验采用双侧t检验,有效自由度简单估计为样本数减2。
2.3.2 高通滤波
考虑到气候要素的时间序列存在长期趋势或者低频波动,这会干扰气候要素之间逐年变化对应关系的统计特征。本文利用Butterworth滤波器对相关气候要素的时间序列进行高通滤波,截断周期取10 a,保留周期为10 a以下的部分[45],即只分析气候要素的年际尺度变化。以计算NPP对冬季AO指数的回归系数为例,在利用两期土地利用数据剔除土地利用变化的NPP格点基础上,首先对研究区及相邻区域内每一个格点1981—2018年冬季NPP时间序列进行高通滤波,得到其年际变化分量,同时,对冬季AO指数也进行了同样的高通滤波得到其年际变率,然后将AO标准化处理后以其为自变量、NPP为因变量,计算NPP对冬季AO指数的回归系数。需要说明的是,这里高通滤波是使用通常区分气候年际与年代际变化的10 a标准,为增加结果的严谨性,本文还选择了其他的8 a、9 a和11 a等年数作为截断周期进行滤波计算,所得的结果与之非常相似,因此,后续所有涉及高通滤波的都统一使用10 a的截断周期。
3 结果
3.1 印缅地区植被NPP的显著异常
图2
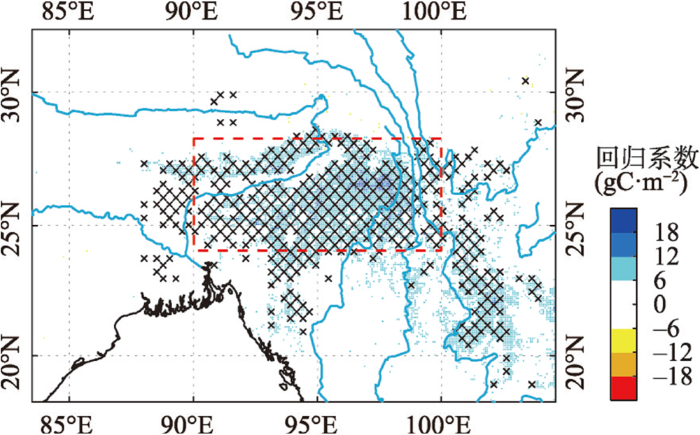
图2
冬季NPP对AO指数的回归系数
注:×表示p<0.1。
Fig. 2
Winter NPP regression coefficients upon the AO index
NPP对气候因子的变化可能有线性和非线性的响应,回归分析方法能很好地检测二者的线性关系。对于非线性的响应,可直接分析个例年份NPP的具体变化进行判断。因此,本文采用了合成分析方法对NPP进行进一步的分析。挑选了冬季AO异常年份,挑选的标准是1倍标准差,即超过+1倍标准差的为正位相异常年、低于-1倍标准差的为负位相异常年,得到的正位相异常年包括1988年、1989年、1991年、1992年和1999年,负位相异常年包括1984年、1985年、2000年、2009年和2012年。分别计算这些AO正、负位相年的NPP距平的平均值以及二者的差(正位相年减负位相年)即为合成值。结果表明,研究区95%以上的格点的合成差值均为正值,正值格点中90%以上通过了0.05的显著水平检验,正值最显著的区域主要位于25°N~28°N和95°E~99°E(图3b),总体上看,AO正位相异常年相较于负位相年研究区植被NPP可显著偏多60 gC·m-2以上。
图3
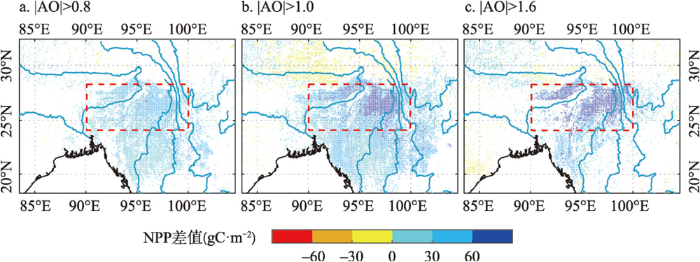
图3
AO正位相异常年与负位相异常年NPP的差值
注:仅显示0.05显著水平的值。
Fig. 3
Difference between positive AO years and negative years NPP composited by 0.8σ, 1σ and 1.6σ
NPP对AO的这种非线性响应是否是真实存在的呢?本文还检查了更极端的情况,直接将个例挑选的标准提高到1.6倍标准差,这样能得到两个AO正位相异常年(1988年和1992年)和2个负位相异常年(1985年和2009年),然后按照相同的合成方法计算NPP,结果如图3c所示,可以发现研究区内NPP的正异常变得更加显著,异常值在60 gC·m-2以上显著的区域面积超过印缅地区总面积的40%,但因个例过少,因此本文又将挑选阈值降低为0.8倍标准差,这样便能够同时得到8个AO正位相异常年(1988年、1989年、1991年、1992年、1999年、2006年、2007年和 2016年)和负位相异常年(1984年、1985年、1995年、2000年、2003年、2009年、2010年和2012年)。计算表明,伴随个例的增加,NPP的这种显著正异常依旧存在,只不过变弱了(图3a),此外,本文还检查了1.1倍的标准差,这些结果均与1倍标准差计算的NPP的正异常一致,表明NPP的这种非线性响应是稳健存在的,不过总体上还是1倍标准差合成的效果最好。
本文进一步分析了AO与印缅地区NPP的历年变化,图4是1981—2018年冬季时间序列,这里显示的区域平均NPP的时间序列与AO均为年际尺度的分量,二者逐年波动的同位相关系很明显,在21个AO正位相年中,印缅地区NPP有15 a为正值,占71.5%;17个AO负位相年中,NPP为负值的有10 a,占58.8%,其中的3个AO异常正位相和5个异常负位相年份,对应的NPP也呈明显的正异常和负异常。整体上两个时间序列的相关系数达0.57,显著水平为0.01。
图4
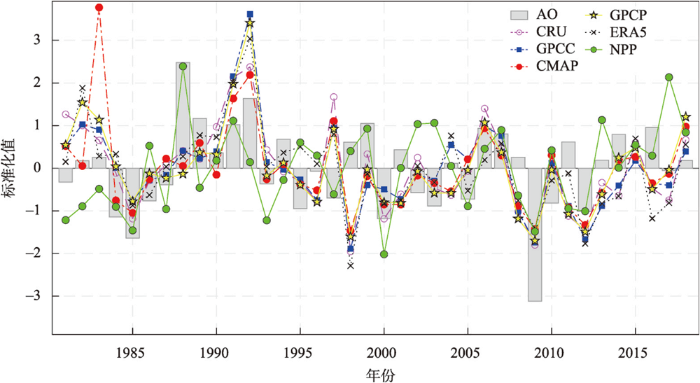
图4
1981—2018年印缅地区植被NPP、降水与AO的年际变化
注:NPP和降水为24°N~28°N和90°E~100°E区域的平均值,所有序列均已标准化。
Fig. 4
Interannual variations for winter AO, vegetation NPP and precipitation from 1981 to 2018 for the target region between 24°N-28°N and 90°E-100°E. All timeseries are normalized to facilitate comparison.
为了解AO对植被NPP可能的滞后影响,本文进一步检查了滞后1个月(对应次年1—3月)、滞后2个月(对应次年2—4月)和滞后3个月(对应次年3—5月)的研究区NPP的变化。结果显示,在冬季AO指数偏高(低)1倍标准差情况下,印缅地区大部分区域滞后1个月的NPP仍以正(负)异常为主,且多数值超过6 gC·m-2,但通过显著的区域较冬季同期减少了近10%,滞后2个月的NPP回归系数进一步下降,同时显著的区域也显著减少,滞后3个月的NPP异常更加不明显。从区域平均NPP来看,时间滞后的关系可以更清楚显示这些特征,冬季AO指数与1—3月平均NPP仍为显著正相关,相关系数为0.52(p < 0.01),而2—4月的相关则明显减弱到0.27,统计上也不显著(表1)。
表1 AO指数与印缅地区NPP的同期和滞后相关
Tab. 1
| NPP | ||||
|---|---|---|---|---|
| 同期 | 滞后1个月 | 滞后2个月 | 滞后3个月 | |
| 冬季AO指数 | 0.57** | 0.52** | 0.27 | 0.10 |
| 春季AO指数 | 0.06 | 0.09 | 0.14 | 0.05 |
注:**表示p < 0.01。
除此之外,本文还检查了春季AO指数与滞后1个月(对应4—6月)到滞后3个月(对应6—8月)的NPP年际波动的关系,发现整个研究区内没有明显的NPP显著异常集中分布区域。从区域平均的NPP时间序列看也是如此,落后1到3个月的情况下,与春季AO指数的相关系数均几乎可忽略不计,分别仅为0.09、0.14和0.05(表1)。这些结果表明,AO与印缅地区NPP的关系,主要还是冬季同期最为显著,因此,本文后续的分析主要关注冬季的情况。
3.2 降水异常
高纬度的AO很可能通过影响印缅地区的气候状况,导致植被NPP的显著异常。温度、降水和太阳辐射通常被认为是影响区域植被生长最主要的气候因素[9],不过不同地区植被生长的主导因素可能不同。温度通常是温带和寒温带地区植被生长的控制因子[46],而植被与降水的显著关系往往出现在干旱半干旱和干湿季气候差异明显的区域[47-48]。Mohamed等[49]指出北半球中高纬地区NPP的变化更多的是与温度的异常有关,热带地区的NPP则主要受降水影响。印缅地区地处北半球低纬度,冬季平均温度能达10 ℃以上,但降雨量不足60 mm(图1b),暖干的冬季气候背景下,降水可能是印缅地区植被生长的主要胁迫因子,注意到以往的研究指出冬季亚太低纬度局地的降水与AO有着显著联系[50],因此本文推测AO可能主要是通过影响研究区冬季降水,进而导致NPP的变化。
为澄清AO与降水的关系,本文统计了GPCC、CRU、CMAP、GPCP和ERA5资料的降水异常。与前面NPP分析对应,只分析年际尺度的降水变化,这些格点降水资料同样进行了高通滤波,然后分别计算其对冬季AO指数的回归系数,图5是冬季AO指数偏高(低)1倍标准差同期降水相应的变化。可以发现,AO与印缅地区的降水存在明显的同位相变化关系,对应冬季AO指数偏高(低)1倍标准差,印缅地区的降水普遍显著偏多(少)4~12 mm,其中GPCC、ERA5和CMAP显著偏多(少)12 mm以上,这个量值表明约超过30%的年份里,伴随AO指数异常偏高或者异常偏低,同期研究区降水距平百分率的绝对值变化可超过20%。当然,由于各套降水资料的分辨率、数据来源存在差异,数值大小的差异是很正常的,通常分辨率越粗的网格降水量值越小。但是五套资料显示的显著降水异常的分布特征,有很好的一致性。
图5
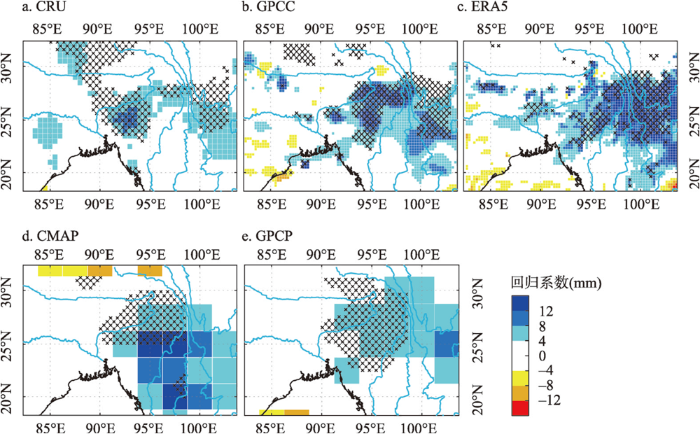
图5
冬季降水对AO指数的回归系数
注:×表示通过0.1显著性检验。
Fig. 5
Regression coefficients of winter precipitation upon the AO index
为分析降水可能的非线性响应,本文进一步对5套降水资料进行了个例合成分析。目的是比较AO正位相异常年和负位相异常年的情况,所用的合成个例和方法与前面NPP的分析相同。结果表明,研究区内所有格点合成所得的数值均为正值,不少区域的值为45~90 mm,分辨率较高的GPCC和ERA5能达90 mm以上,各套降水资料合成差值的数值虽存在一些差异,但其空间型的总体特征是稳定的。AO位相极端年份的降水差异,与前面回归系数反映的二者的同步变化是一致的。这些结果均表明,冬季AO正位相情况下,同期印缅地区降水往往显著偏多。
局地降水噪音通常较大,这可能会掩盖AO的信号,如果是大尺度的气候信号,大范围平均可有效降低局地噪音的干扰,突出信噪比。为此本文进一步计算了整个研究区所有格点的冬季平均降水,再与AO指数的历年变化进行比较。图4给出了1981—2018年多套降水资料的降水与AO指数的序列,总体上看,降水的逐年波动与AO指数有明显的同位相关系。在21个AO正异常年中,5套降水均为正值的有9 a,约占42.9%;在17个AO负异常年里,5套降水均是负值有7 a,约占41.2%,部分AO异常正位相年(如1989年、1991年和1992年)和异常负位相年(如1985年、2000年、2009年和2012年),降水对应的正异常和负异常都很明显。5套资料的降水与AO的相关系数均超过0.4,达到了0.01的显著水平(表2)。
表2 冬季AO指数、印缅地区降水、气温和NPP之间的相关系数
Tab. 2
| 降水 | 气温 | |||||||
|---|---|---|---|---|---|---|---|---|
| CRU | GPCC | CMAP | GPCP | ERA5 | CRU | ERA5 | ||
| AO | 0.43** | 0.45** | 0.41** | 0.44** | 0.40** | -0.24 | -0.19 | |
| NPP | 0.62** | 0.54** | 0.50** | 0.57** | 0.50** | -0.38* | -0.33* | |
注:**表示p < 0.01;*表示p < 0.05。
冬季AO正位相异常可导致印缅地区降水偏多,那么降水的增加是否有利于NPP的增加呢?如果冬季降水是区域NPP的重要气象驱动因子,逻辑上二者应该存在显著的同位相关系。为澄清这一问题,本文进行了分析,考虑到NPP资料的分辨率更高,因此将NPP分别以5套降水资料的像元规格进行格点平均,然后计算NPP对各套降水的回归系数,这里NPP和降水均为高通滤波后的年际分量。结果显示(图略),伴随降水1 mm的正(负)偏差,印缅地区有近50%的区域植被NPP显著增加(减少),数值量级在10 gC·m-2以上。区域平均NPP和降水的相关系数均超过了0.50(p < 0.01)。显然,统计上看降水偏多有利于印缅地区植被NPP的显著增加。
需要注意的是,气温也是一个重要的影响植被生长的气象因子。AO是否通过影响区域气温进而影响植被呢?本文计算了研究区CRU气温和ERA5的2 m气温的变化,采用与降水一致的处理方法。结果发现,伴随冬季AO指数的变化,印缅地区冬季气温的异常并不如降水那样突出,通过显著检验的格点不足研究区面积的30%。而且CRU和ERA5区域平均气温与AO指数的相关系数,仅分别为-0.24和-0.19,这些中等强度的相关并不显著(表2)。当然,二者的这种负相关本文认为很可能也与降水有关,因为温度和降水的年际波动通常并不是相互独立的。AO正位相时降水的增加伴随云量和水汽的增加,导致近地面的下行短波辐射减少,进而造成温度偏低。值得指出的是,气温降低可导致植物的呼吸速率减弱,自呼吸消耗的干物质会减少,同时,也有利于减少土壤水分的蒸发和植物蒸腾,有助于缓解植被生长的水分胁迫,利于干物质量的增加。因此,印缅地区气温的降低可能是有利于植被NPP增加的,区域平均的NPP和气温的相关系数,CRU和ERA5分别为-0.38和-0.33(p < 0.05)。如果排除降水的交叉影响,计算气温与NPP的偏相关系数,两套气温资料的最大偏相关系数仅-0.15(表3),明显变弱了。总的来看,降水很可能是印缅地区植被生长和NPP变化的主导气候因素。
表3 印缅地区冬季植被NPP与气温的偏相关系数
Tab. 3
| 消除的变量(降水) | |||||
|---|---|---|---|---|---|
| CRU | GPCC | CMAP | GPCP | ERA5 | |
| r (CRUT, NPP) | -0.03 | -0.10 | -0.15 | -0.04 | -0.05 |
| r (ERA5T2m, NPP) | 0.02 | -0.05 | -0.14 | -0.01 | -0.01 |
3.3 大气环流和水汽异常
大气水汽含量和垂直运动是影响区域降水量的重要因素。为了解降水异常相关的物理过程,本文分析AO相关的区域大气环流和水汽状况,首先计算了AO指数变化1个标准差时,冬季气柱整层水汽量的变化。结果表明,印缅地区的水汽是明显偏多(少)的,最显著的中心位置介于23°N~28°N和96°E~103°E,水汽变化量级达0.45 kg·m-2以上。那么水汽的异常在不同的高度上又有何不同呢?为此,本文沿印缅地区水汽显著偏多的98°E经线做了剖面,逐纬度、逐高度格点计算了各层比湿对冬季AO指数的回归系数可以发现(300 hPa以上的异常值很小,可忽略不计),比湿偏多异常,其分布水平方向上与整层水汽量一致,垂直方向上,集中分布在600 hPa高度以下,特别是在低层,异常值可显著增加到0.30 g·kg-1以上(图6)。
图6
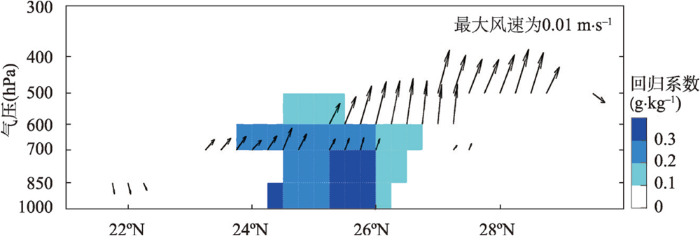
图6
98°E各气压层经向风、垂直速度和比湿对冬季AO指数的回归系数
注:仅显示0.1显著水平的值。
Fig. 6
Regression coefficients of meridional wind, vertical velocity and specific humidity along 98°E upon the winter AO index
其次,分析了区域大气环流的异常,特别是垂直运动。本文计算了对流层各个高度的垂直速度的变化。结果表明,对应冬季AO指数偏高(低)1倍标准差情况下,印缅多数地区对流层中低层冬季平均垂直速度显著偏弱(强)2.50×10⁻³ Pa·s-1,其中,700 hPa高度最明显。这意味着冬季AO偏强正(负)位相时,印缅地区局部区域对流层中低层上升(下沉)运动偏强,最显著的中心位置与水汽的异常显著区一致。为检查垂直运动在不同高度和地区的特征,本文计算了沿98°E经线对流层各层的经向风和垂直速度风矢量,剖面显示了异常较明显的300 hPa以下的区域,对应冬季AO正(负)位相,印缅地区对流层500 hPa及以下高度存在显著的上升(下沉)运动,异常风速极值0.01 m·s-1,其中在500~700 hPa的高度之间最明显(图6)。
印缅地区水汽和垂直运动的异常可能与AO导致的区域大气环流的变化有关。有研究指出AO可能通过大气波列影响低纬度气候,伴随AO异常,高纬度的大气扰动自北大西洋和欧洲向东南亚传播[51],此外AO相关的上游地区的海洋、陆面等下垫面异常也会触发大气的异常。这些大气Rossby波列可通过中东—南亚西风急流的波导效应向下游传播,进而影响南亚和东亚地区的气候[30,52 -53]。以上结果从第六次国际耦合模式比较计划(CMIP6)[54-55]和线性斜压模式[56]等模式的模拟中得到重现,说明其波列以及对区域气候影响存在的真实性。当然,大气波列造成的气候的变化依赖于真实的背景大气环流的配置情况。印缅地区最重要的背景大气环流系统是南支槽(也称印缅槽),受青藏高原地形的影响,这个系统主要是在对流层的中低层。从冬季850 hPa水平风来看(图7a),槽线位置在90°E附近,注意到整个研究区位于南支槽的东侧,即槽前偏南气流控制区。南支槽的强弱和位置的变化,会直接影响印缅地区以及中国的西南[50]甚至是中南地区[52]的降水。
图7
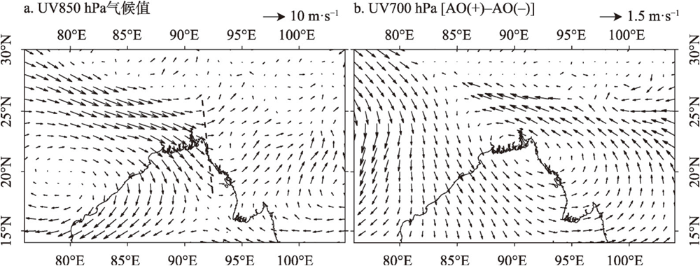
图7
1981—2018年冬季平均850 hPa水平风和AO正位相异常年与负位相异常年700 hPa水平风的差值
注:虚线为南支槽;0.1显著水平的风矢以加粗表示。
Fig. 7
Climatology of 850 hPa horizontal wind in winter and difference between 700 hPa horizontal wind in positive AO years and negative years from 1981 to 2018
本文分析了AO异常年的环流变化,合成AO正位相异常年和负位相异常年对流层的水平风的结果表明,北大西洋和东亚对流层存在的气旋和反气旋相间排列的遥相关波列,经东欧、中东到达中印半岛地区,这种分布特点在对流层中层和高层均很明显(图8b、8c)。当然,波列从中东到东亚的传播路径与200 hPa的南支西风急流轴的走向是一致的(图8a),值得注意的是,该波列在孟加拉湾—印缅地区对流层中低层存在一个显著的气旋环流中心,尤其是在700 hPa高度最明显(图7b)。这意味着AO正位相情况下,印缅地区上空易出现异常气旋性环流,反之AO负位相情况下容易出现反气旋性环流。很明显,气旋异常通过加强南支槽,进而有利于槽前的偏南气流,导致水汽输送的加强,同时,南支槽的加强也会伴随槽前上升运动的偏强[57],显然,水汽的输送和上升运动都是有利于降水增加。AO负位相时,印缅地区上空的异常反气旋会削弱南支槽,相应地印缅地区水汽减少,上升运动减弱,则不利于降水。
图8
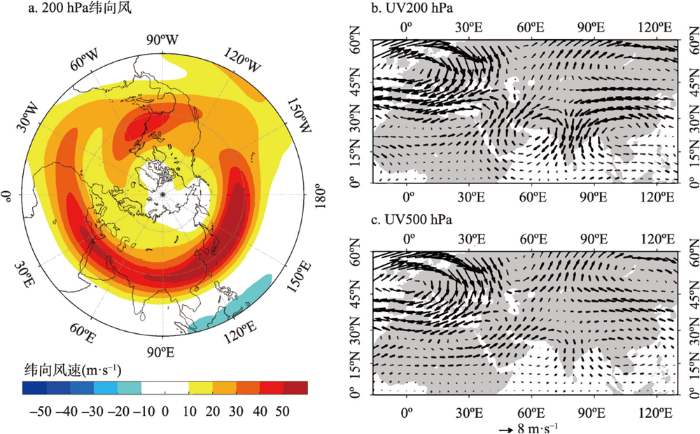
图8
1981—2018年冬季平均的200 hPa纬向风及AO正位相异常年与负位相异常年200 hPa和500 hPa水平风的差值
注:0.1显著水平的风矢以加粗表示。
Fig. 8
Climatology of 200 hPa winter zonal wind and the anomalous horizontal wind at 200 hPa and 500 hPa from 1981 to 2018
4 结论与讨论
4.1 结论
1981—2018年资料统计显示,伴随冬季AO的波动,印缅地区NPP有明显的同位相变化,异常的显著中心区位于25°N~28°N和96°E~98°E。对应冬季AO指数偏高(低)1倍标准差,区域平均NPP显著增加(减少)6.5 gC·m-2,最大异常可达20.6 gC·m-2。
AO主要通过沿副热带急流东传的波列影响印缅地区的大气环流影响降水(图9),造成NPP异常。AO偏强正(负)位相时,波列活动在孟加拉湾—印缅地区对流层中低层存在异常的气旋(反气旋)性环流,导致南支槽偏强(弱),槽前的西南气流水汽输送偏多(少),同时伴随槽前上升运动偏强(弱),均有利(不利)于印缅地区的降水,对应冬季AO指数偏高(低)1倍标准差,降水均显著增加,其中分辨率较高的ERA5和GPCC降水显著增加(减少)12 mm以上,AO异常年份的降水合成,其值超过90 mm,区域平均降水与AO指数的相关系数达0.50以上(p < 0.01)。伴随1 mm的降水增加(减少),NPP增加(减少)超过10.1 gC·m-2,二者时间序列的相关系数超过0.40(p < 0.01)。
图9
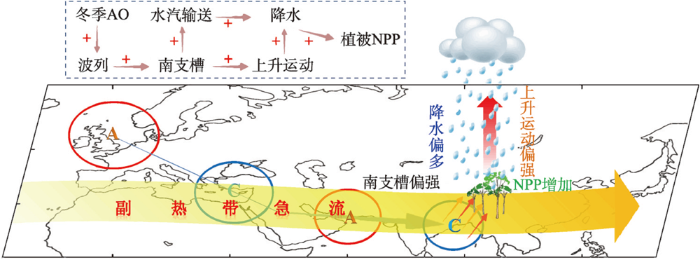
图9
AO与印缅地区植被NPP关系的物理机制示意
注:红色箭矢表示孟加拉湾的水汽输送,灰色箭矢表示波列的运动方向;文本框中符号“+”表示正相关。
Fig. 9
Schematic physical mechanism of the relationship between AO and NPP in the Indo-Myanmar
4.2 讨论
一些重要的气候因子如ENSO和IOD对低纬度的气候具有显著影响[21,42],这是否会进而影响AO与印缅地区植被NPP的关系呢?本文针对于未发生土地利用变化的NPP格点,利用多元线性回归方法,以ENSO和IOD指数为自变量,拟合NPP中的ENSO和IOD信号(图10)。由于ENSO和IOD具有锁相的特征,它们分别在北半球冬季和秋季最强,因此拟合时只考虑冬季的ENSO和秋冬季的IOD。将原始NPP的时间序列,减去拟合的ENSO和IOD贡献,所得的残差视为统计上独立于ENSO和IOD的部分。结果显示,去除ENSO和IOD的信号后,对应冬季AO指数偏高(低)1倍标准差,整个区域NPP平均增加(减少)6.61 gC·m-2,最大的增量(减少量)能达29 gC·m-2,其中研究区有近95%的区域植被NPP和AO仍是同位相关系(图10a)。此外,对去除ENSO和IOD信号后的NPP进行合成分析,也表明研究区95%以上的格点合成的差值均为正值,正值中通过0.05显著水平检验的格点超过90%,正值最显著的区域还是在25°N~28°N和95°E~99°E(图10b)。总体上看,区域平均的NPP时间序列,与AO指数的相关系数能达0.59(p < 0.01),与前面的结果也是高度一致(图10c)。这也表明本文结果不依赖于ENSO和IOD,AO是一个独立的显著影响印缅地区NPP的气候因子。
图10
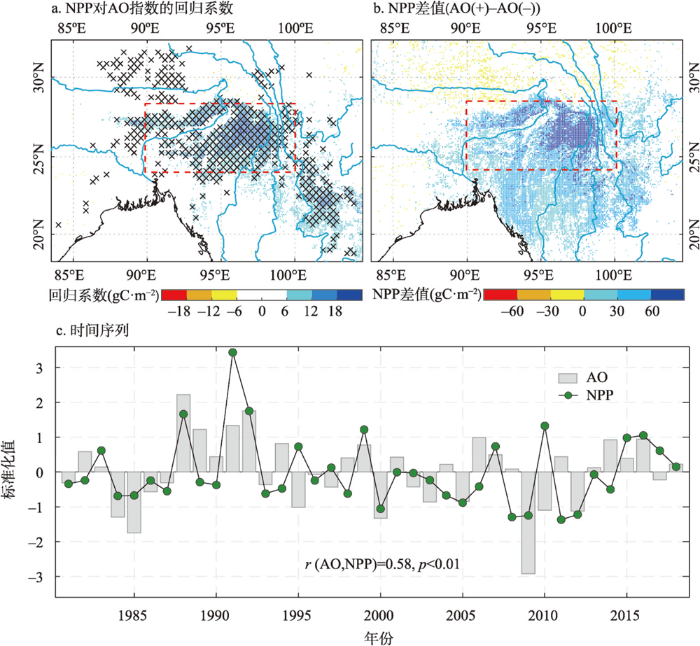
图10
冬季NPP的异常
注:a图中0.1显著水平的值以×标出;b图仅显示0.05显著水平的格点;所有资料计算前均去除了ENSO和IOD信号。
Fig. 10
Winter NPP anomalies
参考文献
Drought-induced reduction in global terrestrial net primary production from 2000 through 2009
DOI:10.1126/science.1192666
PMID:20724633
[本文引用: 1]

Terrestrial net primary production (NPP) quantifies the amount of atmospheric carbon fixed by plants and accumulated as biomass. Previous studies have shown that climate constraints were relaxing with increasing temperature and solar radiation, allowing an upward trend in NPP from 1982 through 1999. The past decade (2000 to 2009) has been the warmest since instrumental measurements began, which could imply continued increases in NPP; however, our estimates suggest a reduction in the global NPP of 0.55 petagrams of carbon. Large-scale droughts have reduced regional NPP, and a drying trend in the Southern Hemisphere has decreased NPP in that area, counteracting the increased NPP over the Northern Hemisphere. A continued decline in NPP would not only weaken the terrestrial carbon sink, but it would also intensify future competition between food demand and proposed biofuel production.
Natural eco-environmental evaluation of west route area of interbasin water transfer project
南水北调西线调水工程区的自然生态环境评价
Temporal and spatial variation of NDVI in Hulun Buir grassland and its response to climate change
呼伦贝尔草原NDVI时空变化及其对气候变化的响应
DOI:10.11755/j.issn.1006-7639(2018)-01-0097
[本文引用: 1]
利用 2001—2016年MODIS NDVI数据和气象站点资料,分析呼伦贝尔草原NDVI的时空变化特征及其对气候变化的响应。结果表明,呼伦贝尔草原NDVI整体呈上升趋势,平均倾向率为0.041·(10 a)-1,其中新巴尔虎右旗西北部、新巴尔虎左旗中部和陈巴尔虎旗西部等地增加显著;NDVI的年变化主要受降水驱动,两者呈极显著的正相关;生长季内,5月气温和5、6月总辐射与NDVI普遍呈正相关,北部草原达到显著或极显著水平,但之后逐渐转为负相关。NDVI与降水普遍呈正相关,5月下半月开始有台站达到显著或极显著水平,7月达到显著或极显著的台站数量最多,并存在明显滞后。生长季内,典型草原NDVI与降水显著或极显著正相关的台站次数明显多于草甸草原。
2021:Summary for policymakers//IPCC. Climate Change 2021:The Physical Science Basis
Global warming leads to more uniform spring phenology across elevations
DOI:10.1073/pnas.1717342115
PMID:29279381
[本文引用: 1]
One hundred years ago, Andrew D. Hopkins estimated the progressive delay in tree leaf-out with increasing latitude, longitude, and elevation, referred to as "Hopkins' bioclimatic law." What if global warming is altering this well-known law? Here, based on ∼20,000 observations of the leaf-out date of four common temperate tree species located in 128 sites at various elevations in the European Alps, we found that the elevation-induced phenological shift (EPS) has significantly declined from 34 d⋅1,000 m conforming to Hopkins' bioclimatic law in 1960, to 22 d⋅1,000 m in 2016, i.e., -35%. The stronger phenological advance at higher elevations, responsible for the reduction in EPS, is most likely to be connected to stronger warming during late spring as well as to warmer winter temperatures. Indeed, under similar spring temperatures, we found that the EPS was substantially reduced in years when the previous winter was warmer. Our results provide empirical evidence for a declining EPS over the last six decades. Future climate warming may further reduce the EPS with consequences for the structure and function of mountain forest ecosystems, in particular through changes in plant-animal interactions, but the actual impact of such ongoing change is today largely unknown.
Accelerated increase in plant species richness on mountain summits is linked to warming
DOI:10.1038/s41586-018-0005-6 [本文引用: 1]
Three-dimensional change in temperature sensitivity of northern vegetation phenology
DOI:10.1111/gcb.v26.9 URL [本文引用: 1]
Characteristics, drivers and feedbacks of global greening
Climate-driven increases in global terrestrial net primary production from 1982 to 1999
Recent climatic changes have enhanced plant growth in northern mid-latitudes and high latitudes. However, a comprehensive analysis of the impact of global climatic changes on vegetation productivity has not before been expressed in the context of variable limiting factors to plant growth. We present a global investigation of vegetation responses to climatic changes by analyzing 18 years (1982 to 1999) of both climatic data and satellite observations of vegetation activity. Our results indicate that global changes in climate have eased several critical climatic constraints to plant growth, such that net primary production increased 6% (3.4 petagrams of carbon over 18 years) globally. The largest increase was in tropical ecosystems. Amazon rain forests accounted for 42% of the global increase in net primary production, owing mainly to decreased cloud cover and the resulting increase in solar radiation.
Annular modes and climate prediction
Intensification of El Niño-induced atmospheric anomalies under greenhouse warming
DOI:10.1038/s41561-021-00730-3 [本文引用: 1]
Regional climate impacts of the Northern Hemisphere annular mode
The Northern Hemisphere annular mode (NAM) (also known as the North Atlantic Oscillation) is shown to exert a strong influence on wintertime climate, not only over the Euro-Atlantic half of the hemisphere as documented in previous studies, but over the Pacific half as well. It affects not only the mean conditions, but also the day-to-day variability, modulating the intensity of mid-latitude storms and the frequency of occurrence of high-latitude blocking and cold air outbreaks throughout the hemisphere. The recent trend in the NAM toward its high-index polarity with stronger subpolar westerlies has tended to reduce the severity of winter weather over most middle- and high-latitude Northern Hemisphere continental regions.
East Asian winter monsoon and Arctic Oscillation
DOI:10.1029/2000GL012311 URL [本文引用: 1]
Influence of Arctic Oscillation on winter climate over China
DOI:10.11821/xb200304010
[本文引用: 1]
In this study the relationships between the Arctic Oscillation and climate in China in boreal winter are investigated. The data used in this study include NCEP/NCAR Reanalysis monthly mean sea level pressure, 500 hPa geopotential heights, two Arctic Oscillation indices, and the observed temperature and precipitation. Correlation analysis for the last 41 years shows that the winter temperature and precipitation in China change in phase with AO. High positive correlation between temperature and AO is above +0.4 and appears in the northern China. High correlation coefficients between precipitation and AO cover the southern China (close to the South China Sea) and the central China (between 30o-40oN and east of ~100oE), with the values varying between +0.3 and +0.4. The correlation between the 160-station average temperature and the simultaneous sea level pressure show that the winter temperature of China is strongly connected to the sea level pressure over the high latitudes of Eurasia continent. The center is located in Siberia with values lower than -0.6. The partial correlation between the intensity of Siberian High and averaged temperature in China remains -0.58, when AO keeps constant. But the partial correlation between temperature and AO is only 0.14 when the influence of Siberian High is excluded. The relationship between AO and precipitation is also significant. The partial correlation between AO and mean precipitation of 160 stations is 0.36. But when the AO's influence is excluded, the partial correlation between the intensity of Siberian High and precipitation is only -0.16. This suggests that during the past several decades the precipitation was strongly affected by AO, but for the temperature the Siberian High plays a more important role. AO and the Siberian High correlate at -0.51, according to the data for the period 1958/59-1994/95. The possible dynamical connection between AO and the Siberian High needs further study. Using the long-term series of AO and the Siberian High spanning 1899/1900-1994/1995, their connections to climate in China are analyzed too. At the interdecadal time scale the AO shows significant influence on both temperature and precipitation. Partial correlation between AO and temperature is 0.66. For precipitation the correlation coefficient is 0.70.
近百年北极涛动对中国冬季气候的影响
Impacts of large-scale oscillations on pan-Arctic terrestrial net primary production
Links between the late wintertime North Atlantic Oscillation and springtime vegetation growth over Eurasia
DOI:10.1007/s00382-015-2627-9 URL [本文引用: 1]
The North Atlantic Oscillation and European vegetation dynamics
DOI:10.1002/joc.1682 URL [本文引用: 1]
Eurasian Arctic greening reveals teleconnections and the potential for structurally novel ecosystems
DOI:10.1038/nclimate1558 [本文引用: 1]
Global vegetation productivity response to climatic oscillations during the satellite era
DOI:10.1111/gcb.13258
PMID:26919189
[本文引用: 1]
Climate control on global vegetation productivity patterns has intensified in response to recent global warming. Yet, the contributions of the leading internal climatic variations to global vegetation productivity are poorly understood. Here, we use 30 years of global satellite observations to study climatic variations controls on continental and global vegetation productivity patterns. El Niño-Southern Oscillation (ENSO) phases (La Niña, neutral, and El Niño years) appear to be a weaker control on global-scale vegetation productivity than previously thought, although continental-scale responses are substantial. There is also clear evidence that other non-ENSO climatic variations have a strong control on spatial patterns of vegetation productivity mainly through their influence on temperature. Among the eight leading internal climatic variations, the East Atlantic/West Russia Pattern extensively controls the ensuing year vegetation productivity of the most productive tropical and temperate forest ecosystems of the Earth's vegetated surface through directionally consistent influence on vegetation greenness. The Community Climate System Model (CCSM4) simulations do not capture the observed patterns of vegetation productivity responses to internal climatic variations. Our analyses show the ubiquitous control of climatic variations on vegetation productivity and can further guide CCSM and other Earth system models developments to represent vegetation response patterns to unforced variability. Several winter time internal climatic variation indices show strong potentials on predicting growing season vegetation productivity two to six seasons ahead which enables national governments and farmers forecast crop yield to ensure supplies of affordable food, famine early warning, and plan management options to minimize yield losses ahead of time. © 2016 John Wiley & Sons Ltd.
ENSO teleconnections and impacts on US summertime temperature during multi-year La Niña life cycle
DOI:10.1175/JCLI-D-19-0701.1
URL
[本文引用: 1]
El Niño–Southern Oscillation (ENSO) teleconnections have been recognized as possible negative influences on crop yields in the United States during the summer growing season, especially in a developing La Niña summer. This study examines the physical processes of the ENSO summer teleconnections and remote impacts on the United States during a multiyear La Niña life cycle. Since 1950, a developing La Niña summer is either when an El Niño is transitioning to a La Niña or when a La Niña is persisting. Due to the distinct prior ENSO conditions, the oceanic and atmospheric characteristics in the tropics are dissimilar in these two different La Niña summers, leading to different teleconnection patterns. During the transitioning summer, the decaying El Niño and the developing La Niña induce suppressed deep convection over both the subtropical western Pacific (WP) and the tropical central Pacific (CP). Both of these two suppressed convection regions induce Rossby wave propagation extending toward North America, resulting in a statistically significant anomalous anticyclone over northeastern North America and, therefore, a robust warming signal over the Midwest. In contrast, during the persisting summer, only one suppressed convection region is present over the tropical CP induced by the La Niña SST forcing, resulting in a weak and insignificant extratropical teleconnection. Experiments from a stationary wave model confirm that the suppressed convection over the subtropical WP during the transitioning summer not only contributes substantially to the robust warming over the Midwest but also causes the teleconnections to be different from those in the persisting summer.
Satellite observation of El Niño effects on Amazon forest phenology and productivity
DOI:10.1029/1999GL011113 URL [本文引用: 2]
The carbon cycle response to ENSO: A coupled climate-carbon cycle model study
DOI:10.1175/1520-0442(2001)014<4113:TCCRTE>2.0.CO;2 URL [本文引用: 1]
In the hot seat: Insolation, ENSO, and vegetation in the African tropics
DOI:10.1002/jgrg.20115 URL [本文引用: 1]
Interannual co-variability in Northern Hemisphere air temperatures and greenness associated with ENSO and AO.
Satellite observations of El Niño impacts on Eurasian spring vegetation greenness during the period 1982-2015
Decadal variability in the terrestrial carbon budget caused by the Pacific Decadal Oscillation and Atlantic Multidecadal Oscillation
Unusual forest growth decline in boreal North America covaries with the retreat of Arctic sea ice
DOI:10.1111/gcb.12400
PMID:24115302
[本文引用: 1]
The 20th century was a pivotal period at high northern latitudes as it marked the onset of rapid climatic warming brought on by major anthropogenic changes in global atmospheric composition. In parallel, Arctic sea ice extent has been decreasing over the period of available satellite data records. Here, we document how these changes influenced vegetation productivity in adjacent eastern boreal North America. To do this, we used normalized difference vegetation index (NDVI) data, model simulations of net primary productivity (NPP) and tree-ring width measurements covering the last 300 years. Climatic and proxy-climatic data sets were used to explore the relationships between vegetation productivity and Arctic sea ice concentration and extent, and temperatures. Results indicate that an unusually large number of black spruce (Picea mariana) trees entered into a period of growth decline during the late-20th century (62% of sampled trees; n = 724 cross sections of age >70 years). This finding is coherent with evidence encoded in NDVI and simulated NPP data. Analyses of climatic and vegetation productivity relationships indicate that the influence of recent climatic changes in the studied forests has been via the enhanced moisture stress (i.e. greater water demands) and autotrophic respiration amplified by the declining sea ice concentration in Hudson Bay and Hudson Strait. The recent decline strongly contrasts with other growth reduction events that occurred during the 19th century, which were associated with cooling and high sea ice severity. The recent decline of vegetation productivity is the first one to occur under circumstances related to excess heat in a 300-year period, and further culminates with an intensifying wildfire regime in the region. Our results concur with observations from other forest ecosystems about intensifying temperature-driven drought stress and tree mortality with ongoing climatic changes. © 2013 Her Majesty the Queen in Right of Canada Global Change Biology © 2013 John Wiley & Sons Ltd Reproduced with the permission of the Minister of Natural Resources Canada.
Influence of the Northern Hemisphere annular mode on ENSO by modulating westerly wind bursts
Interannual linkage between Arctic/North Atlantic Oscillation and tropical Indian Ocean precipitation during boreal winter
DOI:10.1007/s00382-013-1681-4 URL [本文引用: 2]
Drought risk of global terrestrial gross primary productivity in recent 40 years detected by a remote sensing-driven process model
Improvement on the abilities of BEPS under accidented terrain
复杂地形条件下提高BEPS模型模拟能力的途径
Annual carbon balance of Canada's forests during 1895-1996
DOI:10.1029/1999GB001207 URL [本文引用: 1]
Integrating remotely sensed data with an ecosystem model to estimate net primary productivity in East Asia
DOI:10.1016/S0034-4257(01)00331-5 URL [本文引用: 1]
Net primary productivity of China's terrestrial ecosystems from a process model driven by remote sensing
The terrestrial carbon cycle is one of the foci in global climate change research. Simulating net primary productivity (NPP) of terrestrial ecosystems is important for carbon cycle research. In this study, China's terrestrial NPP was simulated using the Boreal Ecosystem Productivity Simulator (BEPS), a carbon-water coupled process model based on remote sensing inputs. For these purposes, a national-wide database (including leaf area index, land cover, meteorology, vegetation and soil) at a 1 km resolution and a validation database were established. Using these databases and BEPS, daily maps of NPP for the entire China's landmass in 2001 were produced, and gross primary productivity (GPP) and autotrophic respiration (RA) were estimated. Using the simulated results, we explore temporal-spatial patterns of China's terrestrial NPP and the mechanisms of its responses to various environmental factors. The total NPP and mean NPP of China's landmass were 2.235 GtC and 235.2 gCm(-2)yr(-1), respectively; the total GPP and mean GPP were 4.418 GtC and 465 gCm(-2)yr(-1); and the total RA and mean RA were 2.227 GtC and 234 gCm(-2)yr(-1), respectively. On average, NPP was 50.6% of GPP. In addition, statistical analysis of NPP of different land cover types was conducted, and spatiotemporal patterns of NPP were investigated. The response of NPP to changes in some key factors such as LAI, precipitation, temperature, solar radiation, VPD and AWC are evaluated and discussed.
Annual dynamics of global land cover and its long-term changes from 1982 to 2015
DOI:10.5194/essd-12-1217-2020
URL
[本文引用: 1]
. Land cover is the physical material at the surface of the Earth. As the cause and result of global environmental change, land cover\nchange (LCC) influences the global energy balance and biogeochemical cycles.\nContinuous and dynamic monitoring of global LC is urgently needed. Effective\nmonitoring and comprehensive analysis of LCC at the global scale are rare.\nWith the latest version of GLASS (Global Land Surface Satellite) CDRs\n(climate data records) from 1982 to 2015, we built the first record of\n34-year-long annual dynamics of global land cover (GLASS-GLC) at 5 km\nresolution using the Google Earth Engine (GEE) platform. Compared to earlier\nglobal land cover (LC) products, GLASS-GLC is characterized by high consistency, more\ndetail, and longer temporal coverage. The average overall accuracy for the\n34 years each with seven classes, including cropland, forest, grassland,\nshrubland, tundra, barren land, and snow/ice, is 82.81 % based on 2431\ntest sample units. We implemented a systematic uncertainty analysis and\ncarried out a comprehensive spatiotemporal pattern analysis. Significant\nchanges at various scales were found, including barren land loss and\ncropland gain in the tropics, forest gain in the Northern Hemisphere, and\ngrassland loss in Asia. A global quantitative analysis of human factors\nshowed that the average human impact level in areas with significant LCC was\nabout 25.49 %. The anthropogenic influence has a strong correlation with\nthe noticeable vegetation gain, especially for forest. Based on GLASS-GLC,\nwe can conduct long-term LCC analysis, improve our understanding of global\nenvironmental change, and mitigate its negative impact. GLASS-GLC will be\nfurther applied in Earth system modeling to facilitate research on global\ncarbon and water cycling, vegetation dynamics, and climate change. The\nGLASS-GLC data set presented in this article is available at\nhttps://doi.org/10.1594/PANGAEA.913496 (Liu et al., 2020).\n
Version 4 of the CRU TS monthly high-resolution gridded multivariate climate dataset
CRU TS (Climatic Research Unit gridded Time Series) is a widely used climate dataset on a 0.5° latitude by 0.5° longitude grid over all land domains of the world except Antarctica. It is derived by the interpolation of monthly climate anomalies from extensive networks of weather station observations. Here we describe the construction of a major new version, CRU TS v4. It is updated to span 1901-2018 by the inclusion of additional station observations, and it will be updated annually. The interpolation process has been changed to use angular-distance weighting (ADW), and the production of secondary variables has been revised to better suit this approach. This implementation of ADW provides improved traceability between each gridded value and the input observations, and allows more informative diagnostics that dataset users can utilise to assess how dataset quality might vary geographically.
GPCC full data monthly product version 2020 at 0.25°: Monthly land-surface precipitation from rain-gauges built on GTS-based and historical data
The ERA5 global reanalysis
DOI:10.1002/qj.v146.730 URL [本文引用: 3]
Global precipitation: A 17-year monthly analysis based on gauge observations, satellite estimates, and numerical model outputs
DOI:10.1175/1520-0477(1997)078<2539:GPAYMA>2.0.CO;2 URL [本文引用: 1]
A dipole mode in the tropical Indian Ocean
Global analyses of sea surface temperature, sea ice, and night marine air temperature since the late nineteenth century
Responses of vegetation changes to climatic variations in Hulun Buir grassland in past 30 years
DOI:10.11821/xb201101005
[本文引用: 1]
Global warming, a global concern, has led to significant vegetation changes especially in the past 30 years. The Hulun Buir Grassland in Inner Mongolia, one of the world's three prairies, is undergoing a process of prominent warming and drying. It is necessary to investigate the effects of climatic variations (temperature and precipitation) on vegetation changes for a better understanding of acclimation to climatic change. NDVI (Normalized Difference Vegetation Index), which can reflect characteristics of plant growth, vegetation coverage, biomass, and so on, is used as an indicator in monitoring vegetation changes. GIMMS NDVI from 1981 to 2006 and MODIS NDVI from 2000 to 2009 were adopted and integrated in this study to extract the time series characteristics of vegetation change conditions in Hulun Buir. The responses of vegetation coverage changes to climatic variations from the yearly, seasonal and monthly time scales were analyzed combined with temperature and precipitation data of seven meteorological sites. In the past 30 years, vegetation coverage change was closely correlated with climatic factors, and the correlations were different on different time scales. Annual average of vegetation change was better correlated with precipitation, suggesting that rainfall was the main factor for driving vegetation change. Correlations between seasonal average of vegetation coverage and climatic factors showed that the sensitivity of vegetation growth to hydrothermal condition change was different in different seasons. The sensitivity of vegetation growth to temperature in summer was higher than in the other seasons, while that of vegetation growth to rainfall in both summer and autumn was higher, especially in summer. Correlations between monthly average of vegetation coverage and climatic factors during growing seasons showed that the response of vegetation change to temperature in April and May was stronger, indicating that the temperature effect occurred in the early stage of vegetation growth. Correlations between NDVI of the current month and precipitation of the month before the current month were better from May to August, showing a hysteresis response of vegetation growth to rainfall. Grasses turned green and began to grow in April, and the impacts of temperature on grass growth was obvious, therefore, the increase of NDVI in April might be due to an advanced growing season caused by climatic warming. In summary, relationships between annual variation of monthly vegetation and climatic factors represent temporal rhythm controls of temperature and precipitation on grass growth.
近30年来呼伦贝尔地区草地植被变化对气候变化的响应
Relationships between interannual variations of spring winds in the agro-pastoral transitional zone of northern China and winter sea surface temperature
DOI:10.18306/dlkxjz.2019.05.008
[本文引用: 1]
This study investigated possible relationships between winter sea surface temperature (SST) and the interannual variation of spring wind speed in the agro-pastoral transitional zone of Northern China by employing daily wind speed observations of 64 meteorological stations, the extended reconstructed sea surface temperature, version 5 (ERSST v5) dataset, and the ERA-Interim reanalysis data. The results show that spring wind exhibited strong year-to-year variations. During the period of 1979-2016, the interannual components accounted for 36% of the total variance. Winter SST, which affects the interannual variation of wind speed in the study area in spring, presented a negative-positive-negative distribution between 20°N-65°N in the North Atlantic, and a negative-positive distribution in the domain of 10°N-55°N and 130°W-180° in the North Pacific Ocean. Interannual variations of surface spring wind in the study area were significantly related to the North Atlantic SST index (r = 0.50) and the North Pacific SST index (r = 0.44). The large-scale atmospheric circulation in the northern hemisphere is the bridge that links winter SSTs and the spring wind. In association with the North Atlantic SST anomalies of negative-positive-negative distribution from high to low latitudes, a wave pattern of pressure height anomalies appeared over the North Atlantic and Eurasia. Accompanying a negative-positive distribution in North Pacific SST anomalies, the pressure height anomalies from the North Pacific to East Asia presented a three-wave pattern. Both of them can lead to an anomalous cyclonic circulation over East Asia in spring. The anomalous cyclonic circulation existed in both the middle and the lower troposphere, which was the factor directly resulting in higher wind speed over the study area. The significant correlation between winter SST and spring wind speed implies that winter SST can be used as a skillful predictor for spring wind in practice. A statistical forecast model with winter SSTs in the North Atlantic and North Pacific as predictors can explain 32% of the interannual variance of the spring wind speed. Cross-validation shows that the time lag relationship between SST and wind speed is significant and robust.
中国北方农牧交错带春季风速的年际变化与冬季海温的关系
DOI:10.18306/dlkxjz.2019.05.008
[本文引用: 1]
利用中国北方农牧交错带1979—2016年64个气象台站的逐日风速资料、ERSST海温数据以及ERA-Interim再分析资料,探讨了前期冬季海温与北方农牧交错带春季风速年际变化的关系。研究表明,北方农牧交错带春季的风速存在强烈的逐年波动,年际方差占总方差的比例为36%。影响农牧交错带春季风速年际变化的前期冬季海温在北大西洋20°N~65°N区域呈现“负、正、负”的异常分布,在北太平洋10°N~55°N、130°W~180°区域呈现“负、正”的异常分布。冬季的海温异常与研究区春季风速年际变化联系的桥梁是北半球大尺度大气环流的异常。当北大西洋海温从高纬至低纬呈现“负、正、负”的异常分布时,从北大西洋至东亚位势高度呈明显的“正、负、正、负”的波列特征;当北太平洋海温从高纬至低纬呈现“负、正”的异常分布时,从北太平洋至东亚位势高度呈“负、正、负、正、负、正”的三波型分布。二者均能影响东亚地区春季大气环流的变化,导致东亚地区上空产生一个异常的气旋性环流,该气旋性环流在对流层中层与低层均存在,是造成研究区风速变化的直接原因。冬季海温与研究区春季风速的显著相关,说明冬季海温对农牧交错带春季风速的年际变化具有超前指示意义。利用北大西洋和北太平洋海温异常中心区的冬季海温作为预报因子,建立春季风速预报模型,可以解释风速年际变化的32%,回报交叉验证结果表明,海温与风速的时间滞后关系是显著和稳健的。
Climate controls on vegetation phenological patterns in northern mid‐and high latitudes inferred from MODIS data
DOI:10.1111/j.1529-8817.2003.00784.x URL [本文引用: 1]
Vegetation coverage change and stability in large open-pit coal mine dumps in China during 1990-2015
DOI:10.1016/j.ecoleng.2016.06.051 URL [本文引用: 1]
Proximal NDVI derived phenology improves in-season predictions of wheat quantity and quality
DOI:10.1016/j.agrformet.2015.11.009 URL [本文引用: 1]
The role of climate variability in the inter-annual variation of terrestrial net primary production (NPP)
Eleven years data set of global net primary production (NPP) and long-term climatic and land use data were used to explore the patterns of inter-annual variability of terrestrial NPP in relation to potential causal factors. Global anomalies in temperature, precipitation and cloud cover were found to significantly contribute in different ways and magnitudes to the variability of NPP of global ecosystems particularly forests and grasslands. El Niño/La Niña events represented an important factor affecting forests, woodlands and grasslands while deforestation was found to largely contribute to the NPP variability of tropical forests. Regionally, NPP variability is related to variation of precipitation in the tropics but is related to both variation and annual mean of temperature and cloud cover in the mid-northern latitudes. We hypothesized that the increase in variability of potential causal factor(s) will provoke more declines of NPP in the tropics but will yield more pulses or at least maintain a mean NPP in the mid-northern latitudes.
Extreme drought event of 2009/2010 over southwestern China
DOI:10.1007/s00703-011-0172-6 URL [本文引用: 2]
Circumglobal teleconnections, the jet stream waveguide, and the North Atlantic Oscillation
DOI:10.1175/1520-0442(2002)015<1893:CTTJSW>2.0.CO;2 URL [本文引用: 1]
Linkage between the Arctic Oscillation and winter extreme precipitation over central-southern China
DOI:10.3354/cr01041 URL [本文引用: 2]
Contrasting impacts of the Arctic Oscillation on surface air temperature anomalies in Southern China between early and middle-to-late winter
DOI:10.1175/JCLI-D-14-00687.1
URL
[本文引用: 1]
In the boreal winter, the Arctic Oscillation (AO) evidently acts to influence surface air temperature (SAT) anomalies in China. This study reveals a large intraseasonal variation in the relationship between the winter AO and southern China SAT anomalies. Specifically, a weak in-phase relationship occurs in December, but a significant out-of-phase relationship occurs in January and February. The authors show that the linkage between the AO and southern China SAT anomalies strongly depends on the AO-associated changes in the Middle East jet stream (MEJS) and that such an AO–MEJS relationship is characterized by a significant difference between early and middle-to-late winter. In middle-to-late winter, the Azores center of high pressure anomalies in the positive AO phase usually extends eastward and yields a significantly anomalous upper-level convergence over the Mediterranean Sea, which can excite a Rossby wave train spanning the Arabian Sea and intensify the MEJS. In early winter, however, the Azores center of the AO is apparently shifted westward and is mainly confined to the Atlantic Ocean; in this case, the associated change in the MEJS is relatively weak. Both observational diagnoses and experiments based on a linearized barotropic model suggest that the MEJS is closely linked to the AO only when the latter generates considerable upper-level convergence anomalies over the Mediterranean Sea. Therefore, the different impacts of the AO on the MEJS and the southern China SAT anomalies between early and middle-to-late winter are primarily attributed to the large intraseasonal zonal migrations of the Azores center of the AO.
Assessment of CMIP models in simulating the relationship between wintertime atmospheric circulation in the Northern Hemisphere and the winter-spring temperature over the Tibetan Plateau
CMIP模式对冬季北半球大气环流与青藏高原冬春季气温相关关系的模拟评估
Impacts of mid-latitude circulation on winter temperature variability in the Arabian Peninsula: The explicit role of NAO.
DOI:10.1007/s00382-022-06313-1 [本文引用: 1]
The combined impact of subtropical wave train and Polar-Eurasian teleconnection on the extreme cold event over North China in January 2021
