

1 引言
自古以来,自然灾害是影响中国人口数量的重要的因素,因造成大规模人口死亡灾害事件而备受关注,已有大量案例研究[12⇓⇓⇓-16]。而针对人口损失的长时间尺度研究则有助于探究此类灾害事件在时间上的变化。如陈玉琼等利用各种灾荒年表和目录,对历史上死亡万人以上的气候灾害的时间分布和重复率进行研究[17]。刘毅等结合正史典籍和相关研究成果,分析了历史上死亡万人以上的重大自然灾害的发生频次、人口损失的空间格局以及灾害结构[18]。刘静等结合古文献数据库检索和灾害史料,分析历史上“死者万计”事件的时空分布、演化规律、发生原因等特征[19]。王洋等针对明代华北地区的大规模人口死亡事件进行研究,并通过与气候序列作对比讨论其与气候变化的关系[20]。
从已有研究来看,目前对历史极端人口死亡事件的研究,所用资料为基本古籍和后人整编资料、年表兼有,主要以万人以上死亡为标准,利用的是历史文献中直接记载死亡人口过万的记录。本文基于中国人民大学清史研究所建立的“清代自然灾害信息集成数据库”[22],覆盖了多个层次、多种来源的历史文献,采用计算机自动筛选结合人工判别的方法筛选记录;根据历史记录中不同级别行政单元上的人口死亡数量,综合利用人口死亡数量的记录和人口死亡比例的记录,以人口死亡数量在县级单元上达到万数量级、或在省府级单元上达到10万数量级为标准,识别清代268 a间的极端人口死亡事件,重建人口死亡强度序列,分析极端人口死亡事件的时空分布。在人口死亡的原因分析上,本文建立了算法来判断自然灾害影响传递过程中,不同因子对人口死亡的作用值大小以及各因子间的关联性大小,对识别灾害影响传递的关键节点,阻断或抑制灾害链从而建立自然灾害韧弹性社会有一定参考意义[23]。
2 资料与方法
2.1 资料来源及记录处理
本文所用历史灾害记录均来源于“清代自然灾害信息集成数据库”,数据库同时收录了水旱、地震、疫病、风暴潮等多种灾害类型的自然过程和社会经济影响的记录,目前覆盖了正史、实录、档案、方志、报刊和碑刻6种主要的史料源,在资料层次上涵盖了地方、社会到中央3个层次[22,24]。其中,方志记录约占60%;报刊记录主要来自近代发行时间最久、社会影响广泛的《申报》,占10%~20%;实录记录来自《清实录》,占10%~20%;余下小部分为正史(《清史稿》)、档案和碑刻记录。通过“死、毙、尸、骸”等多个关键词在数据库中进行初次检索,并将检索结果进行去重。通过自动判别去重后的记录,筛选得到与人口死亡相关的记录。为了验证自动判别的有效性,对数据库中的记录进行抽样和人工判断,结果表明自动判别可以筛选出实际的人口死亡记录中90%的记录。而在抽样和人工判断中发现的漏筛的人口死亡记录,没有表现出在时间或空间上的分布规律,并且均不是造成万人以上人口死亡的事件记录,因此对于总体研究结果没有大的影响。
数据库中的记录已将历史纪年转换为公元纪年,由于农历年一般会对应到两个公元年上,在进行事件的识别与分析时,仅保留其对应的主要公元年份作为有效年份。如“光绪三年,旱”,将年份记为1877年。记录中的空间信息已参照牛平汉的《清代政区沿革综表》转换为宣统三年(1911年)的标准政区[25]。
2.2 极端人口死亡事件的识别
已有研究通常以人口死亡超过万作为巨灾的判断标准,而许多历史资料仅记录在一定行政单元上人口死亡的数量级,如“死者万计”。结合现行常用标准与灾害史料记录的特点,本文以在县域单元上达到万人以上死亡作为极端人口死亡事件的主要识别标准,这类极端事件在人口死亡总数量和强度上都高于巨灾的标准。由于少量事件仅有省府尺度的记录,而缺少县级记录,因此对于这类记录以人口死亡超过10万数量级作为补充标准,其在强度上接近于县尺度的万人以上人口死亡记录。对于兵灾事件(战争、民变、盗匪等),需要对兵灾事件的性质进行判断,仅识别出与自然灾害相关的事件,例如兵—疫灾害链中的兵灾、由灾荒引起的兵灾,而不包括与自然灾害无直接关联的兵灾事件。
2.2.1 单条记录中人口死亡数量的表述及判断
历史记录对死亡人口数量的表述方式不尽相同;除去一些数量信息不明确的记录,如“一应伤毙人口,加以抚恤”这类表述外,历史记录中记载人口死亡数量的信息可分为数量型、比例型和语义型3种类型(表1)。
表1 历史文献中不同类型人口死亡数量信息的关键词及示例
Tab. 1
| 类型 | 关键词 | 示例 |
|---|---|---|
| 数量型 | 十、百、千、万、十万、百万 | “淹死万七千余人” |
| 比例型 | 十之一二、十之八九、十死一二等 | “人死十分之七”“死亡过半” |
| 语义型 | 少、不少、多、甚多、载道、遍野、不可计数、不可胜计等 | “间有溺毙人口”“尸横遍野”“死者不可计数” |
其中,数量型的记录可分为十、百、千、万、十万等多个数量级。比例型的记录通常以10作为分母,如将出现“十死其一”的记录判定为死亡人口比例为1/10,若原文中的比例为一个概数,如“十损六七”则将其死亡人口比例判定为6.5/10,“半”“将半”等判定为5/10,“死亡大半”判定为8/10,“十不存一”“殆尽”等判定为9/10。
在极端人口死亡事件的识别过程中,仅选取数量型和比例型的记录。对于数量型记录,筛选出死亡人口数量级在万以上的县级记录,或在十万以上的省、府级记录。对于比例型记录,筛选出县以及县以上的记录,根据《中国人口史》中的清代人口数量进行折算[26]。对于1776年及以后的记录,《中国人口史》重建了1776年、1820年、1851年、1880年和1910年共6个关键年份的分府人口数量;对于1776年以前的记录,由于缺少分府或分省的人口数,则根据全国人口数量的增长率,以1776年为起点进行线性插值,补充1644年和1679年的分府人口数量,根据清代中期各府的县数计算以上8个关键年份的县均人口数量。
根据记录中的地点和年份,基于其前后关键年份的县均人口数量进行线性插值,并按照记录中人口死亡的比例值进行折算,筛选出折算结果满足标准的记录。其中1851—1880年,部分省在重大自然灾害中的人口损失过重,人口出现负增长,不符合人口自然增长的规律;因此假设人口自然增长率不变,将1851—1880年间每年的人口数量按照1820—1851年的人口增长率进行插值。若记录中出现“城内”等表示城市人口的关键词,则按照《中国人口史》中的分省城市人口比例先将县均人口数量折算为县城人口数量,再进行以上步骤。若同一事件同时有数量型记录和比例型记录,则以数量型记录中的人口死亡数量为准。
2.2.2 对特殊表述的人口死亡记录的处理
历史记录中对人口死亡数量有几种特殊的表述方式:原记录中有人口死亡与流出的总数量而缺少单独的人口死亡数量,如“死徙过半”。参考典型历史记录的描述,将人口死亡数量按照死亡与流出总数量的1/7进行折算( 参考对山东1876年旱灾的记录:“……投奔他乡者已有三百万人,济南一郡饿死者一万五千人,若以全省计之,当不下五十万人死亡之数……”。出自《记英人论去岁灾事》,见1877年5月2日《申报》第1版。)。原记录为洪涝灾害,仅记录了被洪水冲走、卷走的人口数量,如“漂没人口”“冲走人口”等,没有直接记录死亡人口的数量。参考河南省驻马店的“75·8”大水的记录,将死亡人口按照漂没人口的20%进行估算[27]。原记录中表述为“数万”的,按照5万进行估算。对于连续多年事件的记录,将记录的总死亡人口平均到每一年上,再根据标准进行判别。
2.2.3 极端人口死亡事件的数量级判断
以同一年、同一省级政区发生的人口死亡作为一次事件,将筛选后的记录按照年份和省进行合并,将单条记录中的人口死亡数量进行加和,估算各年各省的人口死亡数量级(P),分为4(万)、5(十万)、6(百万)3个级别,以表示人口死亡强度的大小。
2.3 极端人口死亡事件的时空分布分析
2.3.1 事件的时间分布特征分析
在一些连年的事件中,对人口死亡的记录可能是过去连续几年的累计值。因此在分析时间分布特征时,以年代作为基本尺度进行分析,以此将对单次事件的年份判断中的可能误差控制在年代内部。建立年次和省次的10 a序列,其中多次出现的省级政区仅计一次,并根据各年各省的人口死亡数量级别建立年均人口死亡数量级的10 a序列,公式如下:
式中:P为年均人口死亡数量级;c为第i年有极端事件发生的省级政区个数;pij为第i年第j个省的人口死亡数量级。
计算清代人口死亡数量级、省次和年次序列的平均值,并分阶段进行均值计算。在省次和年次的均值计算中,由于20世纪10年代仅有1910年和1911年,因此不计入均值计算。
2.3.2 事件的空间分布特征分析
分别统计清代各省发生极端人口死亡事件的年次,分析省级尺度上极端人口死亡事件分布的差异。分阶段统计不同数量级、不同灾害类型事件的县级分布(以最主要的灾害类型为准),绘制灾害图谱分析其空间特征。其中若仅有府级的记录,则将该府所有县作为万数量级进行统计;若仅有省级记录,则将当年该省的严重受灾县作为万数量级的县。
2.4 极端人口死亡事件的原因分析
自然灾害的影响由资源与环境系统产生,经由生产、设施等子系统传递至人口子系统,若超过人口子系统阈值则会引起大规模的人口死亡;在此过程中会经过若干个中间因子对灾害影响起到放大或抑制作用,因此不仅需要判断灾害类型,对具体导致人口死亡的因子也需要给予关注。根据人口死亡记录判断该次事件中人口死亡的直接因子和间接因子(表2)。判断的原则是以记录的含义为准,基于记录的描述找出人口死亡的各直接和间接因子,并结合记录的描述和经验知识判断各因子在导致人口死亡的传递路径中所处层级,其中最直接导致人口死亡的因子作用层级为1,间接因子依次递增,据此统计每个层级的因子的个数用于作用值的计算。如果人口死亡记录对于导致死亡的原因有完整说明,则以该条记录为准;若记录中表述缺失或不完整,例如仅提及饥荒导致人口死亡,但未说明导致饥荒的原因,则在数据库中检索同时、同地域的灾害记录进行补充。若对于同一次事件有多条记录,则需要综合考虑多条记录中出现的所有与人口死亡相关的因子,对重复出现的因子进行归并。
表2 直接和间接因子示例
Tab. 2
| 记录情况 | 历史记录原文 | 直接因子 | 第一间接因子 | 第二间接因子 |
|---|---|---|---|---|
| 单条记录 | “辛巳,邑民半罹水死。” | n = 1,x = 1 (洪涝) | - | - |
| 多条记录 | “康熙三十年大旱,飞蝗蔽天,民饥死者大半。” | n = 1,x = 1 (饥荒) | n = 2,x = 2 (干旱、蝗虫) | - |
| 原因缺失记录 | “岁道光己酉,邑大饥,城内外偃仆者,日数十人,谷一石值二金有奇……是岁人民大抵十损三四……” 补充同年同地记录:“道光二十九年,雨潦,斗米千钱,民无所得,食至飱泥……” | n = 1,x = 1 (饥荒) | n = 1,x = 2 (洪涝) | n = 1,x = 3 (雨水) |
对所有事件中导致人口死亡的直接或间接因子进行判断,根据不同事件的人口死亡数量级、各因子的作用层级以及因子数量,计算整个清代所有严重人口死亡事件中各因子的作用值,公式如下:
式中:fN为各因子的作用值;x为因子导致人口死亡的层级数,以直接致死因子的层级数为1,例如在旱灾中,若直接致死因子为饥荒,则饥荒的层级数x = 1,则旱灾的层级数x = 2;c表示第i年出现严重人口死亡的省次;nij为第i年第j个省同一层级中致死因子的个数;pij为第i年第j个省的人口死亡数量级。
由于各fN值之间相差较大,因此将fN值进行归一化处理为相对作用值fN,公式如下:
为了讨论各因子之间的关系,首先根据记录含义和经验知识建立各因子之间的传递关系,然后计算各因子间的关联性大小,公式如下:
式中:
3 极端人口死亡事件的识别与分析
3.1 极端人口死亡事件的时间分布特征
根据上述标准,识别出清代的268 a间共有91 a发生了极端人口死亡事件,约为3 a一遇。清代整体的极端人口死亡事件发生的省次均值约为3次,即平均每10 a内有3个省级政区发生极端人口死亡事件;年均人口死亡数量级为4左右,表明平均每年的极端事件死亡人口在万数量级。极端事件发生的省次、年次以及年均人口死亡数量级呈现相似的阶段性特点,整个清代可以分为前、中、后3个阶段,其中18世纪20—30年代和19世纪初—10年代为显著转折时期(图1)。
图1
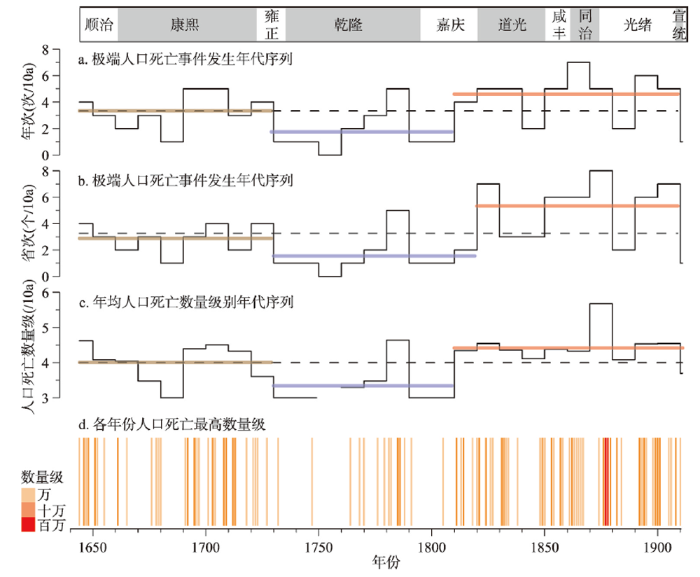
图1
清代极端人口死亡事件的时间分布
注:图a~c中黑色实线为10 a尺度序列,黑色虚线为整个清代的均值,彩色短线为3个阶段各自均值。
Fig. 1
Temporal distribution of extreme events with mass deaths in the Qing Dynasty
Ⅰ阶段:1644年—18世纪20年代(顺—康—雍三朝)期间,极端事件发生的省次、年次以及人口死亡数量级均与整个清代的均值相近,其内部又可分为清初的下降期和康熙中后期的相对高值期。清初多地战乱未平,以及干旱导致的饥荒和疫病同时并发,人口死亡数量级较高,其中1644—1649年间年均人口死亡数量级达到万。17世纪50年代以后,人口死亡事件逐渐减少,在17世纪80年代达到Ⅰ阶段的最低值,10 a间仅有1年、1省发生严重的人口死亡。随后进入17世纪90年代—18世纪20年代的相对高值期,其中18世纪20年代极端事件发生的省次和年次均高于整体平均值,但由于各事件的人口死亡数量级都较低,因此其年均人口死亡数量级低于整体均值。
Ⅱ阶段:18世纪30年代—19世纪初(乾隆—嘉庆前期)为清代的极端事件较稳定的低发期,其年次和省次的均值都低于清代的整体均值,平均每10 a发生极端事件的不到两年和两个省次。在18世纪50年代间没有极端事件发生,且内部变化较小,仅18世纪80年代高于清代整体均值,其发生年次和省次均为5左右,年均死亡数量级达到万。
Ⅲ阶段:19世纪10年代—1911年(嘉庆后期—清末)为清代后期的极端事件高发期,期间各年代的年次和省次都高于或接近于清代的整体均值,平均每10 a有5个省级政区发生极端事件,年次也近5 a,接近Ⅰ、Ⅱ阶段中出现的最高值,标志着进入了一个与Ⅰ、Ⅱ阶段截然不同的高值期。期间19世纪40年代和19世纪80年代为阶段内部的低值期,发生省次与Ⅰ阶段的均值相近,年次与Ⅱ阶段的均值相近,但年均人口死亡数量级仍达到万。19世纪70年代期间极端事件发生的年次、省次和数量级均是Ⅲ阶段也是整个清代的最高值,其中“丁戊奇荒”的连年多省受灾是形成最高值的主要原因。
3.2 极端人口死亡事件的空间分布特征
清代共有18个省级政区发生过极端人口死亡事件(图2a),总体表现为南方多于北方,东部多于西部,而黑龙江、奉天、青海、新疆、西藏等地没有极端人口死亡事件发生,其原因可能是由于这些地区地处边疆、人口相对稀少且可能缺少相应的历史记录,而不一定完全是没有极端事件发生。统计各省发生极端事件的年次,结果表明整个清代各省发生的年次均不超过15 a,其中河南、江苏、广东和山西几省的年次超过10 a。
图2
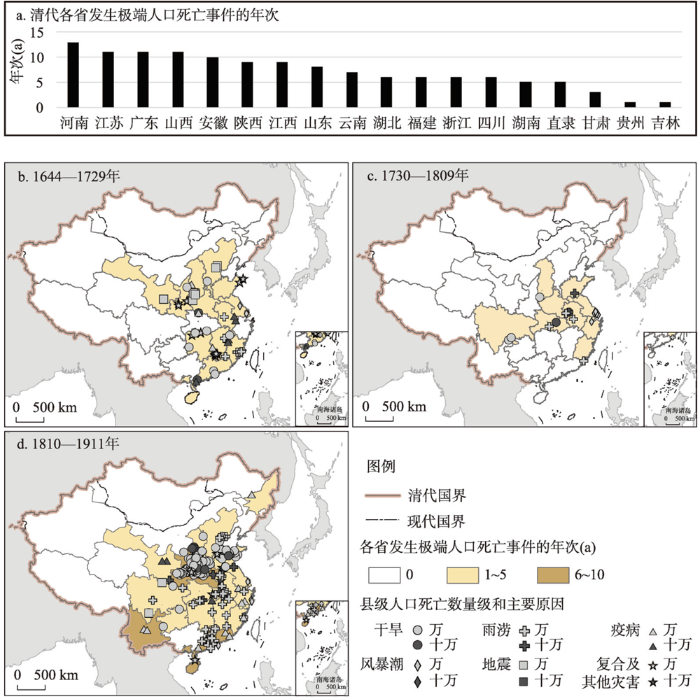
3个阶段的灾害图谱表明极端事件的县级分布也有显著差异(图2)。1644—1729年期间有12个省级政区发生过极端人口死亡事件,在南北地区均有分布,北方地区主要为干旱和地震,包括1691—1692年山陕地区的旱蝗灾害,以及1695年山西省发生的大地震。南方地区则主要为清初湘赣两省的兵灾与干旱的复合从而引发的饥荒和疫病,洪涝、疫病和风暴潮造成的人口死亡事件在多省也有分布。此阶段极端事件分布较广,但以万数量级的事件为主,十万数量级的事件较少。1730—1809年期间有9个省级政区发生过极端人口死亡事件,各省发生年次均未超过5 a。期间发生的极端人口死亡事件除河南、湖北和山西等省发生的旱涝灾害外,以江浙沿海地带的风暴潮事件最多。
1810—1911年为极端人口死亡事件分布最广的阶段,有18个省级政区发生过极端事件,且有4个省级政区发生的年次超过5 a。期间极端事件在华北地区分布最为集中,主要包括1876—1879年间的多省连旱,以及1899—1901年间的陕西省连旱。在华东、华中和华南的多省有洪涝引发的极端事件的集中分布,此外江苏、福建、广东、云南多省有疫病事件的连续分布。
3.3 极端人口死亡事件的原因分析
统计各致死因子随时间的变化和归一化后相对作用值,结果表明极端人口死亡事件与旱涝、疫病、饥荒、风暴潮、雨水、兵灾、地震等10多个因子相关(图3)。
图3
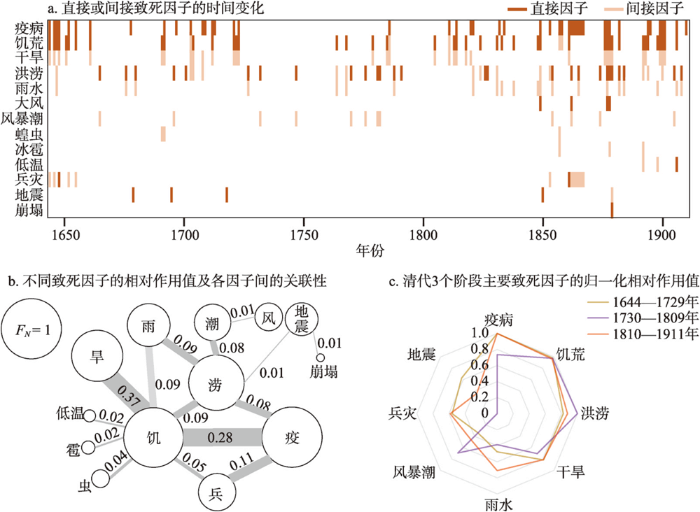
图3
清代极端人口死亡事件中的不同致死因子
Fig. 3
Different factors involved in extreme events with mass deaths in the Qing Dynasty
疫病、饥荒、洪涝是主要的直接致死因子,在灾害影响的传递中这3个因子对人口死亡起到的作用最大;在实际的防灾减灾工作中,如果能够对疫病、饥荒和洪涝3个因子进行干预以达到较好的控制,则可以大大减少人口死亡数量。从灾害分类上看,干旱和洪涝是主要导致人口死亡的自然灾害类型;从直接导致人口死亡的因子上看,减少旱灾中人口损失的关键在于备荒防疫,而对于涝灾而言关键则在于减少洪涝中被淹没的人口。干旱、雨水、风暴潮是主要的间接致死因子,尽管它们并不直接导致人口死亡,但仍可能通过饥荒、疫病等直接因子导致人口死亡;对于间接因子较难进行直接干预,但通过预测、防范等措施可以为后续环节的控制做好准备。大部分致死因子如饥荒、疫病、干旱等的发生频率在清代的前中后期都呈现高—低—高的阶段性特征,而雨涝在前期和中期的差异不大,但清后期则显著高于前两个时期。
疫病为第一致死因子,其原因除了疫病本身致死率高、持续时间长、传播范围广以外,还在于疫病是多种灾害的伴生灾害。“大灾之后,必有大疫”,如兵—疫、涝—疫是常见的灾害链,中国历史上疫病的发生在时间和空间上都与其他灾害有一定相关关系,只有少数是由病原体直接引发[34]。且发生饥荒时引起的人口健康水平下降或人口死亡也容易引起疫病的发生,从而在疫病—人口死亡之间形成一种正反馈,直至人口大量死亡或流出。饥荒的作用值仅次于疫病,主要由干旱或洪涝引发,此外蝗灾、低温、冰雹等多种灾害也会引发饥荒。再次是洪涝,主要由大雨或风暴潮引起,也有少数是由地震和崩塌事件堵塞河流引起。洪涝既作为直接致死因子,即直接淹没人口导致死亡,也作为间接致死因子,与饥荒、疫病都联系紧密。第四因子为干旱,其仅作为间接致死因子,主要通过饥荒导致人口死亡。在众多导致人口死亡的因子中,干旱、饥荒和疫病是联系最为紧密的几个因子,并组成了“干旱→饥荒+疫病→人口死亡”这条最为主要的传递路径,此外还存在“低温/冰雹/蝗虫/雨水/洪涝→饥荒→人口死亡”几条出现较少的路径,其中饥荒均是最为关键的节点。而洪涝与饥荒的总体作用值相近,其中“洪涝→人口死亡”是最主要的传递路径,其他如“雨水→洪涝→人口死亡”或“洪涝→疫病→人口死亡”出现相对较少,因此洪涝虽然与雨水、风暴潮、地震、疫病等因子都存在一定关联,但其本身就是最关键的节点。
而在清代的3个阶段中,饥荒、洪涝和疫病的作用值都高于其他因子。其中,疫病在1644—1729年间和1810—1911年间的作用值均最高,干旱在3个阶段的作用值相近,雨水在1810—1911年间作用突出,而洪涝和风暴潮在1730—1809年间作用更为突出。
4 讨论
4.1 万数量级以下及定性记录对结果的影响
本文以县域单元上达到万人、省府级尺度上达到十万人口死亡为标准,对极端人口死亡事件进行识别。而一些未达到标准的记录,如在县级尺度上不足万人死亡,或仅在省府级别上达到万人死亡的记录,以及一些定性记录都未被纳入分析。1856年未被识别为极端人口死亡事件发生的年份,处于极端事件发生的Ⅲ阶段,记录数量也相对充足。因此选取该年来讨论这部分记录对人口死亡数量级估算结果的影响。统计各省不同人口死亡数量级的县次(表3),以及人口死亡总数量,将定性记录的人口死亡均作为百数量级处理。
表3 1856年各省份发生不同人口死亡数量级事件的县次
Tab. 3
| 省份 | 灾害类型 | 县次 | |
|---|---|---|---|
| ≥1000 | <1000 | ||
| 广西省 | 兵灾 | 6 | 13 |
| 贵州省 | 兵灾 | 1 | 2 |
| 湖北省 | 干旱、地震 | 0 | 8 |
| 江苏省 | 干旱、虫灾、疫病、兵灾 | 0 | 5 |
| 福建省 | 洪涝 | 0 | 3 |
| 广东省 | 洪涝、低温 | 0 | 3 |
| 安徽省 | 干旱 | 0 | 2 |
| 山东省 | 干旱 | 0 | 2 |
| 河南省 | 干旱、虫灾 | 0 | 2 |
| 四川省 | 冰雪 | 0 | 2 |
| 山西省 | 洪涝 | 0 | 1 |
| 奉天省 | 洪涝 | 0 | 1 |
| 浙江省 | 兵灾 | 0 | 1 |
| 江西省 | 动物灾害 | 0 | 1 |
1856年没有万以上数量级人口死亡的记录,定量记录均为千及千以下的数量级,以及部分定性记录。统计结果表明,广西省有6个县达到千数量级的人口死亡,13个县达到百数量级,整体人口死亡数量为万余(表3)。贵州省有1县达到千人以上死亡,2个县达到百人以上,整体人口死亡数量仍在千数量级。其余各省人口死亡均不足万人,共有31个州县的人口死亡在百及百数量级以下。而估算的19世纪50年代的年均人口死亡为万数量级,因此1856年的人口死亡数量虽然未计入其中,但对该10 a的年均人口死亡数量级影响不大。
极端人口死亡事件基本遵循程度越严重的州县数量越少的规律,一般情况下,事件中心的严重程度越高,事件的影响范围相应越大。若一省中最严重的州县人口死亡在千数量级,除了可能有部分地区灾害记录缺失外,其一省的总体人口死亡数量一般难以达到10万数量级,因此对本文的结论不会产生很大影响。而在省府尺度上达到万数量级的一类记录与之含义相似,若是识别更低强度的人口死亡事件,如在省级尺度上达到万人死亡的事件,则需要将这两类记录都纳入统计中,否则会对结果造成较大影响。
4.2 各省级政区人口死亡原因的讨论
对导致人口死亡的原因进行分析后,发现饥荒和疫病是最主要的致死因子;其次是洪涝,其既是直接致死因子也是间接致死因子;再次是干旱、雨水和风暴潮3个间接致死因子。为了进一步讨论不同省级政区人口死亡的主要原因,选取上述6种主要致死因子进行分析。首先按照省级政区将各因子清代所有年份的作用值进行加和,然后以每种因子作用值的最大值分别进行归一化,分析主要致死因子作用值的空间特征(图4)。
图4
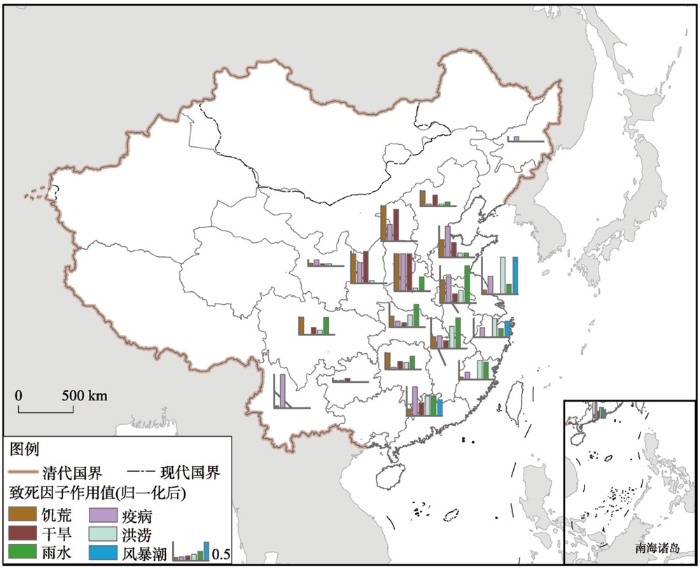
在发生过极端人口死亡事件的各省之中,饥荒在河南和山西的作用值最高,其次是陕西、安徽、山东和四川,大部分都是垦殖率较高的地区[35],因此导致承灾体的暴露度更高,而在云贵和东南各省作用值较低。疫病在河南的作用值同样最高,其次是云南、山东、广东和安徽各省。其中河南、陕西和安徽省的饥荒和疫病在各省中所处的水平相似,具有较高的伴生性,疫病很大可能是由于饥荒中的人口健康水平降低和人口死亡而产生。直隶、湖北和四川疫病的作用值显著低于饥荒,疫病的发生受到了一定抑制。云南仅有疫病的作用值十分突出,疫病的发生更多与自然环境和战乱有关。广东省与云南省相似,疫病的作用值要显著高于饥荒。
干旱和洪涝两种间接因子的作用值表现出显著的南涝北旱格局。在北方地区的直隶、山西、河南、山东和陕西5个省份中,干旱因子的作用要远高于洪涝;而在其以南的江苏、浙江、湖北、江西、福建和广东各省份中,洪涝的作用值远高于或略高于干旱。再进一步探寻洪涝的原因,发现内陆与沿海地区也存在显著差异;江苏、浙江和广东省的风暴潮作用较为明显,而四川、湖北、湖南、安徽等内陆省则主要由雨水引起。
5 结论
以“清代自然灾害信息集成数据库”为资料来源,参考现代对巨灾中人口死亡的定义,以在县域尺度上达到万人死亡为主要标准,识别出清代的极端人口死亡事件,并对极端事件的时空特征和原因进行分析。结果表明:
(1)极端人口死亡事件的时间特征。清代共有91 a发生过极端人口死亡事件,平均每10 a约有3 a和3个省发生,年均人口死亡数量级为万数量级,发生频率呈现出“较多—少—多”3个阶段的变化。1644年—18世纪20年代期间的极端事件发生特征与清代整体均值相近。18世纪30年代—19世纪初为较稳定的低发期,每10 a约有2 a和2个省发生极端事件,年均人口死亡数量级约为千数量级。19世纪10年代—1911年为极端事件高发期,每10 a约有5 a和5个省发生,年均人口死亡数量级超过万数量级。
(2)极端人口死亡事件的空间特征。清代共有18个省级政区发生过极端人口死亡事件,3个阶段的空间分布呈现出不同的特征。1644年—18世纪20年代期间,极端事件在北方地区以地震和干旱为主,在南方则以干旱和疫病和雨涝为主。18世纪30年代—19世纪初极端事件分布范围最小,有9个省级政区发生,且分布较为分散,在江浙沿海地区有较多的风暴潮事件集中发生。19世纪10年代—1911年极端事件分布最广且强度最大,北方主要为干旱事件的集中分布,南方多省有洪涝事件和疫病的分布。
(3)导致极端人口死亡的主要因子。造成极端人口死亡事件的因子共有13个且相互之间有所关联。其中疫病、饥荒和洪涝在3个阶段都是相对作用值较大的主要致死因子,干旱、雨水和风暴潮则是主要的间接致死因子,18世纪30年代—19世纪初期间的洪涝以风暴潮引起为主,而在19世纪10年代—1911年间则以雨水引起为主。
参考文献
Spatio-temporal distribution of typical natural disasters and grain disaster losses in China from 1949 to 2015
DOI:10.11821/dlxb201707011
[本文引用: 1]

Prone to natural disasters, China badly needs a research into its spatio-temporal distribution of natural disasters and the corresponding grain loss to improve grain security and achieve sustainable development. By means of Python Programming Language and on the basis of grain production loss over Chinese 31 provinces from 1949 to 2015, this paper first constructed disaster intensity index to analyze temporal features of different natural disasters, and with trend analysis as well as ESDA to analyze spatial characteristics in different provinces. Then the paper collected crop planting data to calculate and test the spatio-temporal characteristics in grain loss through estimation model on grain loss, defining grain loss rate and geodetector. The conclusions of paper are: (1) compared with the curve of disaster-affected areas, disaster intensity index constructed in this paper could better present temporal changes of natural disasters; (2) China alternately suffered from flood and drought between 1949 and 2015 and in the coming 5 to 10 years the main suffering would be flood; (3) the ranking of natural disasters is: drought>flood>low temperature >hail> typhoon, among which, the areas affected by drought and flood occupied more than half of the total; (4) natural disasters show clear spatial characteristics and the ranking of regional areas prone to disasters is: eastern region> western region; northern region > southern region. Generally speaking, northern region is prone to only one particular natural disaster while southern region tends to suffer from several natural disasters in the meantime; (5) the sum of natural disasters, drought, hail and low temperature, with their random distribution in space, presented unclear spatial autocorrelation, while flood and typhoon, with their clustering model in space distribution, showed clear spatial autocorrelation; (6) from 1949 to 2015, the general temporal changes of disasters, grain loss amount and loss rate showed a feature that the figures would rise first, and then dropped with the critical point in 2000. Meanwhile, they had significant heterogeneity in spatial distribution, great difference in single-factor explanation power, and multi-factor interaction showed a nonlinear enhancement relation. The distribution of hot and cold spots on both sides of the Hu Line presented a polarization pattern and the gravity center of grain loss gradually moved northward. Accordingly, this paper proposes that our government should adopt different precautionary measures in different regions of China: measures against drought and hail in Northwest China; measures against drought and waterlogging in Northeast China; measures against flood and low temperature in Central China; measures against waterlogging and typhoon in coastal areas of Southeast China. And our government should show more concern to and formulate feasible protection plans for hostile-environment Northwest China and high-grain-production Northeast China so that a good harvest in grains could be guaranteed.
1949—2015年中国典型自然灾害及粮食灾损特征
DOI:10.11821/dlxb201707011
[本文引用: 1]
中国是一个自然灾害频发的国家,研究其自然灾害演变特征及粮食灾损规律,对实现中国社会经济可持续发展、解决中国粮食安全问题具有重要意义。本文先基于Python语言编程获取1949-2015年中国31省市自然灾害造成的受灾、成灾、绝收面积,构建灾害强度指数分析不同灾种的时序特征分异,利用趋势分析、ESDA方法分析不同灾种在省域空间的分布特征及冷热区;再获取1949-2015年粮食种植数据,通过粮食灾损估算模型、定义粮食灾损率、地理空间探测器,计算并检验中国粮食损失时空特征及分异性。结果表明:① 相比受灾面积曲线,本文构建的灾害程度指数能够更好揭示自然灾害时序演变特征;② 1949-2015年期间中国两大主力灾害(洪灾、旱灾)交替出现,未来5~10年以洪灾为主;③ 灾种排序旱灾>洪灾>风雹>低温>台风,其中旱灾、洪灾受灾占比过半;④ 省域不同灾种间空间趋势变化特征明显,区域受灾面积东部>西部,北部>南部,且北部灾种单一、南部多灾并发;⑤ 自然灾害受灾总和、旱灾、雹灾、低温空间上全局自相关性不显著,呈随机模式分布,洪涝、台风在空间分布上具有显著的全局自相关性,呈集聚模式;⑥ 1949-2015年灾害、灾损量、灾损率整体时序趋势呈现先升后降,2000年为临界点,空间分布具有异质性,单因子解释力度差异显著,多因子交互均呈非线性增强关系,胡焕庸线两侧冷热点分布呈两极化且其重心向北迁移。建议政府加强除旱减雹(西北)、除旱排内涝(东北)、排涝防冻(中部)、排涝预台(东南沿海)等工程技术措施;同时西北(环境恶劣)、东北(中国粮仓)应作为防灾减灾重点保护区,制定专项保护方案,以保证中国粮食丰产增收。
Migration for survival under natural disasters: A reluctant and passive choice for agriculturalists in historical China
DOI:10.1007/s11430-017-9080-6 URL [本文引用: 1]
Natural disasters and population mobility in Bangladesh
DOI:10.1073/pnas.1115944109
PMID:22474361
[本文引用: 1]
The consequences of environmental change for human migration have gained increasing attention in the context of climate change and recent large-scale natural disasters, but as yet relatively few large-scale and quantitative studies have addressed this issue. We investigate the consequences of climate-related natural disasters for long-term population mobility in rural Bangladesh, a region particularly vulnerable to environmental change, using longitudinal survey data from 1,700 households spanning a 15-y period. Multivariate event history models are used to estimate the effects of flooding and crop failures on local population mobility and long-distance migration while controlling for a large set of potential confounders at various scales. The results indicate that flooding has modest effects on mobility that are most visible at moderate intensities and for women and the poor. However, crop failures unrelated to flooding have strong effects on mobility in which households that are not directly affected but live in severely affected areas are the most likely to move. These results point toward an alternate paradigm of disaster-induced mobility that recognizes the significant barriers to migration for vulnerable households as well their substantial local adaptive capacity.
Temporal and spatial distribution and disaster chain of epidemics that caused massive death in Ming and Qing dynasties
明清时期导致人口大量死亡的疫灾时空分布及灾害链研究
Natural disasters, harvests and changes in rice prices in Taiwan during the Qing Dynasty (1738-1850)
自然灾害、生产收成与清代台湾米价的变动(1738—1850)
Rising grain prices in response to phased climate change during 1736-1850 in the North China Plain
18—19世纪之交华北平原的气候变化与粮价异常
Global economic impacts of large-scale disasters: Case study of the Great East Japan Earthquake
Natural disasters, population pressure and peasant uprisings in the Qing Dynasty
自然灾害、人口压力与清代农民起义
How climate change impacted the collapse of the Ming Dynasty
DOI:10.1007/s10584-014-1244-7 URL [本文引用: 1]
The evolution of catastrophes in China and the warning
中国巨灾的演变及警示
Study on definition and division criteria of a large-scale disaster: Analysis of typical disasters in the world in recent years
巨灾定义与划分标准研究: 基于近年来全球典型灾害案例的分析
A preliminary study of the impact of the plague on the population of Jiangnan in the Qing Dynasty
清代江南瘟疫对人口之影响初探
Discussion on the "Ding Wu Famine"
也谈“丁戊奇荒”
The population loss resulting from the great drought in Shanxi in the early period of Emperor Guangxu's reign in the Qing Dynasty
山西“丁戊奇荒”的人口亡失情况
The great plague in Northeast China during 1910-1911 and the countermeasures of the ruling class and the people
1910—1911年的东北大鼠疫及朝野应对措施
Time characteristics of great climatic disasters of died people over ten thousand in Chinese history
中国历史上死亡一万人以上的重大气候灾害的时间特征
Spatial distribution of major natural disasters of China in historical period
DOI:10.11821/xb201203001
[本文引用: 1]
Based on collation of historical documents and records of China's major disasters in the historical period, this paper analyzes the characteristics of frequency and distribution of major disasters, including the number of occurrences, the structure and distribution of major disasters, and the number and disttribution of dead people induced by the major disasters. The conclusions can be drawn as follows. (1) Through the analysis of the frequency of major disasters, we found that occurrences of different types of disasters were different and the provincial patterns were significantly different from each other. There is close relationship between different types of disasters and their distribution. (2) Based on the analysis of the disaster losses, the spatial pattern of losses was not the same as that of frequency. The reasons for the above phenomena are as follows. (1) China is one of the countries most affected by natural disasters. The hazard-formative environments and hazard-formative factors of different types of disasters are significantly different. So the natural condition is the decisive factor of the distribution of different major disasters. (2) The losses caused by natural disasters were closely related to the concentration of economic and population. In general, the number of dead people was larger in the areas with more developed agriculture, culture and business.
历史时期中国重大自然灾害时空分异特征
DOI:10.11821/xb201203001
[本文引用: 1]
通过历史文献和史料记载的整理,对中国历史时期的重大自然灾害进行了系统的梳理,分析了公元前180 年-1911 年和民国时期重大自然灾害发生的频次和损失的时空格局特征,得出结论:(1) 对灾害发生的频次进行分析,不同灾种发生频次不同,空间格局呈现明显的地域分异,灾害的空间分布与灾种之间的关系明显;(2) 对灾害带来的损失进行分析,发现不同类型灾害发生的频次与灾害带来损失的空间格局并不相同。究其原因在于:(1) 各种自然灾害的孕灾环境不同,是其空间格局差异性的决定性因素;(2) 自然灾害带来的损失大小与经济和人口的集中程度密切相关。自然灾害损失较大的往往都是农业、文化、商贸较为发达的区域,这也是我国区域经济格局空间差异的必然。
The temporal-spatial distribution and case analysis of the "number of deaths amounted to more than ten thousand people" events in Chinese ancient documents
中国古文献记载中“死者万计”事件的时空特征与原因分析
Study on the mass death events in north China in Ming Dynasty
气候变化背景下明代华北地区人口大量死亡事件研究
The integrated natural disaster information system of the Qing Dynasty
清代自然灾害信息集成数据库建设
Theoretical paradigm for natural disaster-resilient society
DOI:10.11821/dlxb202105007
[本文引用: 1]
The change of global environment and the rapid development of economy have led to the increase of natural disasters, which have become one of the most serious environmental problems in modern human society. Facing the grim situation of natural disaster risk prevention and control, human society should be built strongly enough to deal with natural disaster risks. On the basis of "building a resilient society to reduce natural disaster risks", this paper focuses on analyzing the exact meaning of resilience, and interprets the connotation, composition and structure of natural disaster-resilient society through integrated hazard defense, damage recovery and emergency governance. The index system and quantitative characterization method of the natural disaster-resilient society was established to evaluate the situation of a natural disaster resilient-society in the case area. According to the differences between urban and rural areas, we designed pathways to build a natural disaster-resilient society. Then a theory paradigm of the natural disaster-resilient society, including concept-structure-index-approach, is systematically constructed. It is an inevitable option for human to build a natural disaster-resilient society, which is highly consistent with the sustainable socio-economic development. The research aims at promoting a comprehensive response to natural disaster risks, exploring ways to build a "stronger, safer and more sustainable" natural disaster-resilient society, supporting the transformation of national disaster prevention and reduction strategies, and implementing the "Nine Key Areas and Weak Links Projects".
自然灾害韧弹性社会的理论范式
DOI:10.11821/dlxb202105007
[本文引用: 1]
全球环境变化和经济快速发展导致自然灾害的增加,已经成为现代人类社会最严重的环境问题之一。面对自然灾害风险防控的严峻形势,人类社会必须建设得足够强大,以应对可能发生的自然灾害风险。在提出“构筑自然灾害韧弹性社会减轻自然灾害风险”的基础上,本文重点分析韧弹性的确切涵义,通过综合灾害防御、损害恢复和应急管控,诠释自然灾害韧弹性社会的内涵、组分和结构;建立自然灾害韧弹性社会的指标体系和定量表征方法,评估案例区自然灾害韧弹性社会的状况;进而针对城乡差异设计建设自然灾害韧弹性社会的途径。依此,系统性地构建了包括概念—结构—指标—途径的自然灾害韧弹性社会理论范式。建设自然灾害韧弹性社会是人类的必然选择,这与社会经济可持续发展高度一致。研究旨在推动综合应对自然灾害风险,探索建设“更强、更安全、更持续”的自然灾害韧弹性社会途径,支撑国家防灾减灾战略转变、实施“关键领域与薄弱环节九大工程”。
Big data and ecological history: The compilation and database construction of the historical sources of Chinese disaster history in an information age.
大数据与生态史: 中国灾害史料整理与数据库建设
Temperature changes of winter-half-year in eastern China during the past 2000 years
过去2000年中国东部冬半年温度变化
Reconstruction and analysis on the series of winter-half-year temperature change during the Qing Dynasty in the northern China region
DOI:10.11820/dlkxjz.2012.11.002
[本文引用: 1]
Based on the records of irregular first and last frost dates from the historical documents during the Qing Dynasty, the winter-half-year temperatures in northern China region are reconstructed at a five-year resolution by applying a conversion function to the historical records obtained from examining the correlation between the changes of first and last frost dates and the changes of instrument-measured regional mean temperatures in more recent years. The characteristics of temperature changes in that period are analyzed. The results indicate that: (1) the climate in northern China region in the Qing Dynasty can be characterized as cold. The mean winter- half-year temperature of that time period in the region is 0.55℃ lower than that of the present time (1951-1980), with a 1.42℃ difference in the coldest five years (1656-1660). (2) The centennial scale climate variations show a“cold-warm-cold”pattern. The two cold periods appear around 1646-1700 and 1781-1910, when the winter-half-year temperature in northern China region is about 0.77℃ and 0.58℃ lower than that of the present days respectively. During the period of 1701-1780, the climate is relatively warm, but the winter- half-year temperature is still lower than that of the present days (by 0.36℃ difference). (3) At a higher time resolution, relatively small temperature fluctuations are observed within each cold and warm time period, with two“cold troughs”during the late Qing Dynasty (1781-1910).
清代华北地区冬半年温度变化重建与分析
The social impact and the mechanisms of climate change in the North China Plain at the turn of the 18th and 19th centuries
18—19世纪之交华北平原气候转冷的社会影响及其发生机制
Spatiotemporal characteristics and influencing factors of the epidemic disasters for the past 3000 years in China
DOI:10.11821/dlxb202108012
[本文引用: 1]
Epidemics are one of the most severe events in the human disaster network. On the basis of establishing the epidemic sequence by using historical epidemic data, and using the methods such as historical section analysis, factor correlation analysis, and time sequence analysis, this article examines the spatiotemporal characteristics and causes of the epidemic disasters for the past 2720 years (770 BC-AD 1949) in China. The results show that: (1) The frequency and intensity of epidemic disasters in China have a long-term upward trend, with troughs in the warm periods and peaks in the cold periods. (2) The epidemic prevalence in China generally occurred mainly in summer and autumn, but varied with time, so that since the 1450s, the seasonal difference tended to be less significant due to the increase of the kinds and frequency of epidemics. (3) China's epidemic fluctuation cycles are mainly 620-610 a, 320-310 a, 230-220 a, 170 a, 90 a, etc., which confirms the existence of "Twelve Earthly Branches" cycle and the significant impact of sunspot activity on the epidemic cycles. (4) For the past 3000 years, within the China's territory, the Epidemic Widespread is 93.51%, which indicates the percentage of the number of affected counties to the total number of counties, and the Epidemic Thickness is 16.86 layers, which represents the ratio of cumulative affected counties to the total number of administrative counties. The epidemics in the southeast half of China occurred much more frequently and severely than those in the northwest half. (5) The expansion of the epidemic prevalent areas in China is synchronized with the areal land exploration. The change of the epidemic centers of gravity is obviously affected by the spatial changes of the economic centers of gravity. The centers shifted from north to south before the Southern Song Dynasty, and moved from east to west after that. The import of foreign infectious diseases has a great impact on the distribution pattern of epidemics in China. (6) The prevalence of epidemics is not only a natural phenomenon, but also a sociocultural phenomenon. The change in the spatiotemporal distribution of epidemics reflects the change of human-environmental relationship. The densely populated areas, the areas along the traffic line, the surrounding areas of the capital city, the natural foci areas and the disaster-prone areas are all epidemic-prone areas. (7) The geographical environment has a basic impact on the spatial distribution of epidemics, that is, low altitude, warm and humid areas are prone to the prevalence of epidemics. Natural disasters can induce epidemics, so the disaster-prone area is also the epidemic-prone area, and the disaster-prone period is also the epidemic-prone period. Climate change has impacts on epidemic fluctuations, so epidemics are more frequent in the cold periods than in the warm periods. The land excessive development and the conflict between human and land resulting from population growth intensified the epidemic prevalence. Moreover, epidemics always follow wars, that is, the frequent periods of war are also the frequent periods of epidemic.
中国3000年疫灾流行的时空特征及其影响因素
DOI:10.11821/dlxb202108012
[本文引用: 1]
疫灾是人类灾害链网中的顶级灾害。利用历史疫灾史料,建立疫灾时间序列,使用历史断面分析、因子相关分析、时间序列分析等方法,对中国过去2720年疫灾流行的时空特征及其影响因素进行研究。结果表明:① 中国疫灾流行的频度和强度有长期上升趋势,温暖期形成疫灾低谷,寒冷期形成疫灾高峰。② 中国疫灾流行总体以夏、秋季为主,但有阶段性差异,15世纪50年代以后,由于疫病种类增多,疫灾频度提高,疫灾的季节性差异逐渐不显著。③ 中国疫灾波动周期主要有620~610 a、320~310 a、230~220 a、170 a、90 a等,它们大都是12 a或11.2 a的倍数,反映了“十二地支”周期的存在和太阳黑子活动对疫灾周期的重大影响。④ 过去近3000年里,中国累积的疫灾广泛度为93.51%,疫灾厚度达16.86层,东南半壁的疫灾比西北半壁的频繁得多、严重得多。⑤ 中国疫灾区域拓展与土地开发同步,疫灾重心变迁受经济重心的牵引,南宋以前由北向南迁移,南宋以后由东向西迁移;外来疫病输入对疫灾分布格局产生重大影响。⑥ 疫灾流行既是自然生态现象,也是社会文化现象,疫灾时空分布变迁反映人地关系变迁,人口稠密区、交通沿线区、都城周边区、自然疫源区、灾害频发区都是疫灾多发区。⑦ 地理环境分异奠定疫灾空间分异,高温、高湿、低海拔地区疫灾易于流行;自然灾害对疫灾具有诱发作用,灾害频繁区也是疫灾频发区,灾害频繁期也是疫灾频繁期;气候变迁影响疫灾波动,寒冷期疫灾多发,温暖期疫灾少发;人口增加带来的土地开发和人地关系紧张,加剧疫灾的流行;疫灾与战争如影随形,战乱频繁期也是疫灾频繁期。
General characteristics of the agricultural area and fractional cropland cover changes in China for the past 2000 years
过去2000年中国农耕区拓展与垦殖率变化基本特征
DOI:10.11821/dlxb202107012
[本文引用: 1]
通过梳理和集成近年研究成果,综述了过去2000年中国主要农耕区拓展的阶段性及其间全国耕地面积和其中近千年垦殖率变化的主要特征。主要结论有:① 中国主要农耕区第一次大规模拓展出现在西汉,从黄河中下游拓至整个长江以北地区;第二次在唐宋时期,主要是长江以南农耕区域从平原低地拓垦至丘陵山地;第三次在清中叶以后,主要是对东北、西北和西南等边疆地区的拓垦和山地的深度开发。② 过去2000年中国耕地面积呈波动增加趋势,公元初突破5亿亩(1亩≈ 667 m<sup>2</sup>),8世纪前期突破6亿亩,11世纪后半叶达近8亿亩,16世纪后期突破10亿亩,19世纪前期突破12亿亩,1953年逾16亿亩,1980年逾20亿亩。③ 中国耕地空间分布的主体格局至11世纪前后就已基本奠定。1080年前后,黄淮海、关中平原等的垦殖率达30%以上,长江三角洲、鄱阳湖平原、两湖平原和四川盆地等达30%左右。1850年前后,华北平原、汾渭盆地和陇东地区、四川盆地、两湖平原、鄱阳湖平原及长三角地区等的垦殖率均超过30%。2000年前后,东北平原、黄淮海地区、汾渭盆地和陇东地区、四川盆地、长江中下游平原等农业区中有2/3以上垦殖率超过50%,辽西丘陵、坝上高原、黄土高原及南方各省的丘陵山地也多达15%以上;西北绿洲农业带及青藏高原河谷农业带的局部地区也达50%以上。
