

1 引言
通达性概念最早由英国学者Hansen提出并定义为节点之间相互作用机会的大小[4]。国外学者较早开展了相关研究,发现M-40轨道交通的修建能够提升马德里及周边区域的通达性,不同城市受益程度与空间区位显著相关,高速铁路的通达在欧洲尺度上通达程度改善明显,在区域或国家尺度上改善很小[5]。随着城镇化的快速推进,中国学者对城市群交通联系也展开了大量研究。自20世纪80年代,中国主要城市群可达性提升明显,长三角的沪苏浙地区综合交通可达性差距不断缩小[6],广佛都市圈通达性空间格局呈明显的圈层结构,从都市圈的几何中心向外围递减[7],可达性缩短了城市间“时间距离”,引起城市区位和城市关系网络发生变化,空间结构由“多中心”向“连续带状”结构演变[8]。相比沿海三大城市群,中原城市群内部的城市间轴线联系强度大于外围区域,空间联系突出了郑州与洛阳“双中心”层次结构特征,整体结构松散且集团化效应明显[9];滇中城市群交通网络空间结构形态经历了点线、放射、网络不同类型的3个阶段,并呈现一体化的发展态势[10]。近年来高铁对城市群交通格局的影响引起了学者们的广泛关注。长三角城市群的实证研究表明高铁压缩了城市群内部城市的空间距离,提高城市群区域的整体可达性[11];高铁建设促进了相对区位较优地区向周边地域的迅速扩张,强化了城市发展潜能,在长江中游城市群同样得到了验证[12]。综上来看,研究内容上多集中在城市群交通网络发展与空间联系的格局特征、时空演化以及对空间结构、空间效应等方面;研究对象上除聚焦国家级城市群外,对区域级城市群与地区性城市群同样也有所关注。
随着中国高铁网络建设的加快,对高铁网络导致的空间格局重塑成为研究热点。地理学者们相继通过加权平均旅行时间、经济潜力和日常可达性等指标测度可达性[13⇓-15],来反映城市与区域空间差异变化[16],衡量高铁网络在不同空间尺度的影响[17]。大量研究表明,跨区域高铁通道能够促进区域空间整合,呈现区域一体化的发展趋势[18⇓⇓-21]。随着对高铁网络影响区域空间重构研究的深入,一些研究开始关注到区域空间的交叠现象。国外学者相继研究发现,高铁建设扩大了区域中心城市的影响范围,继而改变城市间的竞合态势。如Willigers认为国内、国际高铁服务能够影响不同类型区域吸引力,高铁服务范围与其他区域间存在明显交互作用[22];Martín等进一步分析了与高铁服务区域重叠的区域,指出其他交通工具以及周边政策对重叠区域的竞争影响显著[23]。近年来,国内学者也从高铁流视角对区域空间交叠现象展开了一些研究,如何丹等指出高铁会造成城市影响区域重叠并加剧城市间竞争[24];初楠臣等则进一步认为高铁会驱使区域城镇体系空间格局产生“重叠区域”[25];郭嘉颖等研究指出高铁网络能够重塑日交流圈空间格局,并呈现沿高铁通道延伸并重叠范围动态扩大的趋势[26]。
目前的研究提出了高铁交通视角下会造成一定程度的区域空间分异交叠现象,更深入的研究则还需要进一步探讨在考虑这种交叠现象的基础上,高铁交通会给区域空间秩序带来什么样的影响,以及如何辨识和认识这些交叠空间。这是本文将要探讨的科学问题。为顺利开展这个研究,需要引入适用的科学方法。当前,地理学主流的城市关系空间分析方法多采用复杂网络指标测算城市网络拓扑属性、利用节点关系模式探讨子网络特征以及相互关系等,这些方法不易刻画中国城市交叠格局以及交叠空间识别。近些年,在信息网络以及公共安全等学科领域发展起一种能够有效分析复杂网络交叠问题的交叠社区发现算法[27⇓⇓-30],成功应用于挖掘网络局部集聚以及子群交互作用,如Nguyen使用交叠社区算法挖掘社交网络中不同年龄、职业等节点相互作用,将识别的社会交叠小团体用于不同场景的商业活动中[31];Das通过构建交叠社区发现算法研究网络犯罪活动,利用不同犯罪成员相互关系构造犯罪网络进行类型划分,用以预测犯罪活动并采取预防措施[32]。
考虑到交叠社区发现算法可以在刻画局部集聚特性的同时实现交叠社区划分[33],本文尝试将其引入到地理学区域划分研究中,以《交通强国建设纲要》中提出的建设“全国123出行交通圈”为切入点,对比分析了全国城市群以及中心城市通达格局及差异;基于高铁通达态势进一步使用SLPA模型对全国所有城市进行社区划分与交叠空间识别,探究区域空间格局发展新态势以及交叠空间地理特征并识别网络交叠空间,以期深化对高铁交通发展背景下区域空间格局的认识,并提出优化发展策略。
2 数据来源与研究方法
2.1 研究区概况
图1
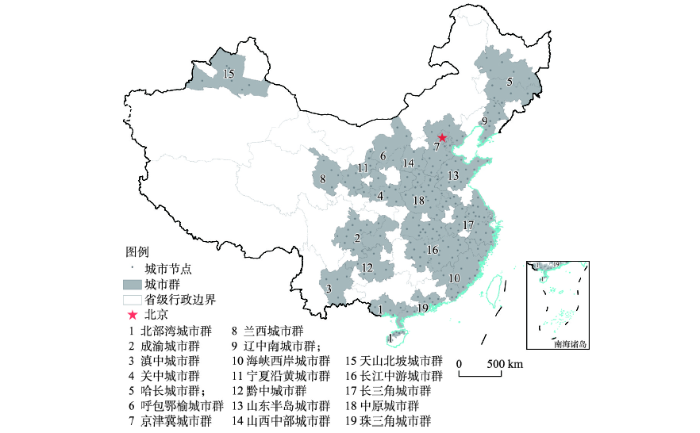
图1
中国城市群格局
注:基于自然资源部标准地图服务网站审图号为GS(2019)1651号的标准地图制作,底图边界无修改,后文同;高铁网底图根据《中长期铁路网规划》(2016—2025年)中的“八纵八横”高速铁路主通道图绘制。
Fig. 1
Urban agglomerations in China
2.2 数据来源
本文选取2021年极品时刻表中G字头高铁、D字头动车以及C字头城际全部铁路列车时刻表(
2.3 研究方法
2.3.1 通达性方法
为分析城市群内部以及城市群间的通达能力,需要定量获取各城市高铁通达的时间成本。良好的通达能力能够反映一定的交通优势度以及更好发展机会的可能。本文选取城市通过高铁网络达到其他城市列车时刻的平均值表征城市间通达程度,公式如下:
式中:Ci表示城市i的平均通达时间;Tij表示城市i到其他城市的通达时间;n为其他城市数量。
2.3.2 交叠社区模型
现实世界中交叠结构类似统计学总体的概念,一般通过样本的统计信息推断出总体的一些特征。目前关于交叠模型评测大致可以分为两步:首先根据给定参数的LFR①(①LFR(Lancichinetti-Fortunato-Radicchi)benchmark是一种生成基准网络算法。该算法可以生成参数可控的人工合成网络,可以在考虑节点度数和社区规模分布异质性等指标情况下,得到先验已知社区。LFR用于比较不同社区发现算法的性能。)基准网络[39]来进行评测;然后通过公开数据集来与相关模型进行对比分析。Xie综合评测了SLPA②(②SLPA(Speaker-Listener Label Propagation Algorithm)是LPA(Label Propagation Algorithm)标签传播算法的一种变体,能够检测每个节点所属的一个或多个社区。)模型与13种热门的交叠社区发现模型[40-41],发现SLPA模型的评测结果更接近LFR基准网络,并且在公开数据集中具有显著的适应性和稳健性,本文也采用SLPA模型对中国城市网络进行分析。
SLPA模型更新规则如下:
式中:L表示节点或团体的标签;Ck是包含一组连接到节点i且彼此共享同一标号k的节点的子社区;S是定义为的子社区的得分函数。
式中:
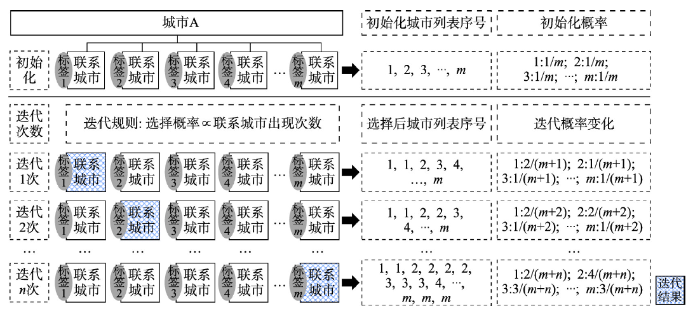
具体算法运行可以抽象理解为以下几个步骤(图2):① 选取某个城市A,把与A城市有联系的城市设置不同标签(例如标签1、标签2等),生成初始化城市列表与初始化与城市A有联系的城市概率;② 根据标签出现的次数来确定A城市与联系城市的概率;③ 根据阈值r来定义社区,进而识别出交叠空间。
图2
交叠模块度计算公式如下:
式中:
2.3.3 引力模型
为了衡量城市群城市间综合联系强度,通过测算两城市之间的中心质量与时间距离来刻画两城市综合联系强度值,公式如下:
式中:Fij为两城市之间综合联系强度;Gi与Pi分别表示城市i的地区生产总值与人口总数;Tij表示城市i与城市j的时间距离。
3 城市群通达格局
3.1 城市群内通达格局特征
通过计算城市群城市到其他城市加权平均通达时间,结合《交通强国建设纲要》中明确提出的“全国123出行交通圈”目标,按照≤ 1 h、≤ 2 h、≤ 3 h来划分,比较评价不同时间成本下城市群通达格局。
总体来看,城市加权平均通达时间上,中国城市群高铁通达格局呈现由中心向外围地区由低向高逐渐扩大的“圈层式”空间格局。加权平均通达时间1 h内的城市偏向城市群中心地带,空间上大多分布在“胡焕庸线”以西,包含天山北坡城市群、兰西城市群、宁夏沿黄城市群、呼包鄂榆城市群等部分城市,“胡焕庸线”以东城市零星分布在华南、西南、中部以及东北地区。加权平均通达时间2 h内的城市分布在中心地带外围,“胡焕庸线”以东城市明显增多,呈现集中连片的空间分布格局。加权平均通达时间3 h内的城市基本分布在2 h内通达城市外围,多分布在东南沿海、中部以及东北地区(图3)。
图3
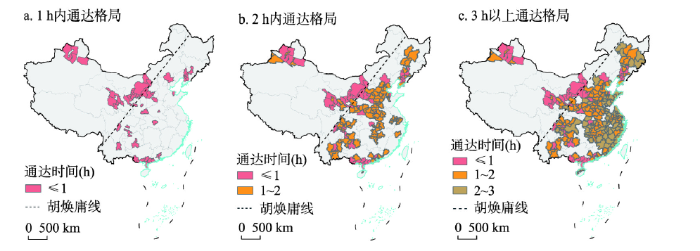
图3
2021年中国城市群高铁通达格局
Fig. 3
High-speed railway access pattern between each pair of central cities in 2021
对城市群内部所有城市进行加权平均,2 h内的城市群有15个,占城市群总量的79%(表1)。加权通达时间在1 h内的城市群有5个,其中兰西城市群(0.54 h)、宁夏沿黄城市群(0.57 h)、呼包鄂榆城市群(0.48 h)、山西中部城市群(0.9 h)位于中国中西部地区,辽中南城市群(0.97 h)位于东北地区。平均通达时间最长的城市群是海峡西岸城市群(2.47 h),与平均通达时间最短的呼包鄂榆城市群相差1.99 h。
表1 2021年中国城市群平均通达时间
Tab. 1
| 序号 | 城市群 | 加权平均通达时间(h) | 序号 | 城市群名称 | 加权平均通达时间(h) |
|---|---|---|---|---|---|
| 1 | 兰西城市群 | 0.54 | 11 | 京津冀城市群 | 1.80 |
| 2 | 宁夏沿黄城市群 | 0.57 | 12 | 长三角城市群 | 2.10 |
| 3 | 呼包鄂榆城市群 | 0.48 | 13 | 长江中游城市群 | 2.18 |
| 4 | 山西中部城市群 | 0.90 | 14 | 海峡西岸城市群 | 2.47 |
| 5 | 关中城市群 | 1.18 | 15 | 珠三角城市群 | 1.17 |
| 6 | 中原城市群 | 1.55 | 16 | 北部湾城市群 | 1.66 |
| 7 | 山东半岛城市群 | 2.15 | 17 | 滇中城市群 | 1.29 |
| 8 | 天山北坡城市群 | 1.11 | 18 | 黔中城市群 | 1.39 |
| 9 | 哈长城市群 | 1.93 | 19 | 成渝城市群 | 1.44 |
| 10 | 辽中南城市群 | 0.97 |
3.2 中心城市通达格局特征
图4
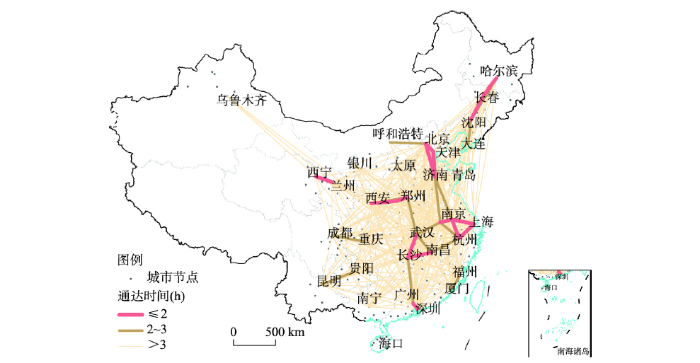
图4
2021年中国中心城市间高铁通达时间格局
Fig. 4
2021 China's central cities between high-speed railway access time pattern
通过分析中心城市间3 h通达时间测算,得出21对中心城市3 h内通达城市组合。具体来看,东北地区的哈长城市群中心城市哈尔滨、长春与辽中南城市群中心城市沈阳、大连顺次结对,哈尔滨—长春(1.4 h),长春—沈阳(1.3 h),沈阳—大连(2 h),形成相对独立的3 h通达轴线。呼包鄂榆城市群中心城市呼和浩特与北京通达时间为2.5 h,依托京包线与京津冀形成3 h通达通道。在京沪通道支撑下,山东半岛城市群中心城市济南向北与京津冀城市群中心城市北京、天津通达时间分别为1.8 h、1.5 h,向南与长三角中心城市南京通达时间为2.8 h。长江中游城市群中心城市,向东与长三角城市群中心城市南京,形成武汉—南京联系通道(3h),同时向北与中原城市群中心城市郑州,形成武汉—郑州联系通道(2.7 h),向南与珠三角城市群广州,形成长沙—广州联系通道(3 h)。关中城市群中心城市西安与中原城市群中心城市郑州通达时间为2 h,滇中城市群中心城市与黔中城市群中心城市通达时间为2.7 h。
通过对3 h通达时间的城市群中心城市进行空间插值以及等值线提取,得到城市群中心城市3 h通达覆盖的空间范围(图5)。整体来看,中心城市3 h通达等值线覆盖圈大多超出城市群范围,表现出“泛城市群”空间特征。哈长城市群与辽中南城市群3 h通达等值线覆盖圈范围向通辽、赤峰延伸,整体覆盖范围还是以东北地区为主。京津冀城市群等时线西至呼包鄂榆城市群,向南延伸至山东半岛城市群,与中原城市群对接。长江中游城市群向北与中原城市群衔接,向南与珠三角城市群有空间交叠,西北方向延伸至关中城市群,向东邻近长三角城市群。关中城市群与兰西城市群以及中原城市群3h通达等值线覆盖圈有空间重叠,并向南延伸至成渝城市群。滇中城市群与黔中城市群等时圈空间范围相互融合,并与成渝城市群对接。珠三角城市群与海峡西岸城市群3h通达等值线覆盖圈在汕头、梅州、汕尾等处有重叠。
图5
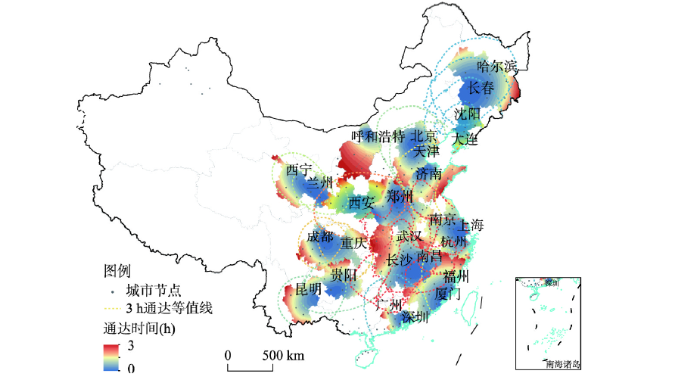
图5
2021年中国城市群空间连接格局
Fig. 5
Spatial connection patterns of China's urban agglomerations in 2021
4 空间交叠格局特征
4.1 社区划分与地理特征
把全国所有开通高铁的城市作为社区划分样本,通过测算城市间综合联系强度,同时考虑空间分布连续性与城市行政区划完整性,使用SLPA模型把全国城市划分为14个“内部联系紧密,彼此联系较少”的社区。与传统“三大地带”“四大板块”的区域布局相比,本文划分的区域范围偏小,而又普遍大于城市群的尺度,一定程度上反映了高铁跨区域联系背景下中国区域空间格局新变化。
从社区划分结果来看,“胡焕庸线”以东社区分布密集,共有11个社区,占比79%,“胡焕庸线”以西仅有3个社区(图6)。城市整体划分格局上,存在大量高铁覆盖空白区域,包括四川西部、内蒙古中部以及青海、西藏、新疆大部分地区。四川西部的川西高原与青藏高原和横断山脉融为一体,组成平均海拔在4000 m以上的高纬度、低寒、冻土地带,人口密度低与自然环境敏感可能是高铁未通达的原因之一。内蒙古中部、青海南部与新疆西南大部分地区由于城市分布稀疏,与其他城市相距较远,交通基础条件差,可能是这些地区高铁布局缺失的原因之一。
图6
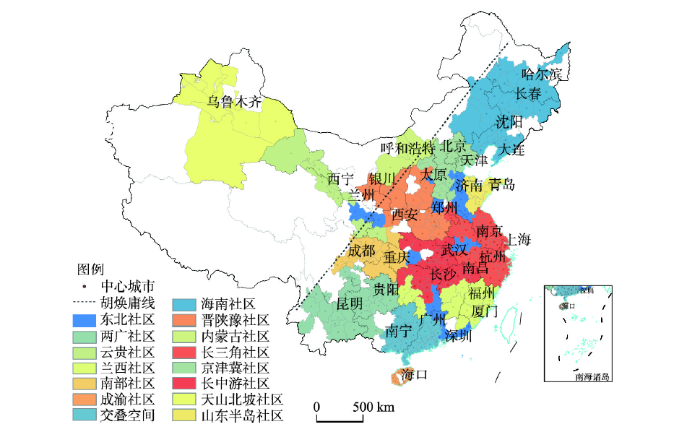
图6
2021年中国城市联系交叠社区划分
Fig. 6
Division of China's urban linkages into overlapping communities in 2021
东北社区以京哈线、哈大线、绥佳线为主体骨架,涉及哈长城市群与辽中南城市群,共有28个城市,对应中国东北地区。社区内部网络密度相对较低,城市之间联系相对较弱。该区域主要以沈阳、长春、哈尔滨、大连等城市为核心节点,以哈尔滨—长春、长春—沈阳、沈阳—大连、沈阳—秦皇岛、延边—长春等线路为联系骨架,联系起铁岭、吉林、营口、锦州、葫芦岛等沿线城市,形成放射性关联格局。
京津冀社区由京石、石武、京津以及京沪线衔接京津冀城市群、山东半岛城市群、中原城市群和晋中城市群的26个城市组成。社区内部以北京、天津为龙头引领区域发展,社区整体向南辐射,形成网络关联格局。山东半岛社区主要位于山东半岛以及长三角城市群、京津冀城市群部分地区,共有16个城市。从社区空间格局来看,京沪线与胶济线构成纵横交错的基本骨架。纵向依托京沪线,串联起济南、沧州、德州、泰安、济宁、枣庄等城市,呈放射性空间联系格局。横向子系统是以横贯山东的胶济线为网络联系轴线,结合烟台、威海、滨州、日照等城市,形成明显省域特色的关联格局。
长三角社区由京沪线、沪蓉线以及沪杭线、宁杭线串联起山东半岛城市群、中原城市群、长江中游城市群部分的49个城市。从综合联系强度来看,高铁车次最多的前3城市为上海、杭州、南京。这些城市以上海为龙头引领区域发展,形成长三角核心区域。
南部社区由25个城市组成,位于中国南方部分地区,以福建省域城市为主体,涉及海峡西岸城市群、长株潭城市群、环鄱阳湖城市群、珠三角城市群。需要一提的是,固有认知里福建省依托东南沿海区位形成较发达的海外贸易,山多地少地形特征影响着与内陆地区的资源要素交换,以此形成相对自我封闭的区域。然而与传统印象相左,南部社区不仅囊括了福建省,还包括湖南省、江西省、广东省等部分城市,反映了高铁推动视角下区域发展新格局。
两广社区涉及珠三角城市群与北部湾城市群,共有32个城市。社区内以武广线、南广线、厦深线、湘桂线以及柳南线为主的高铁线路,联系起广西、湖南以及潮汕地区部分城市,形成网络交织的社区格局。云贵社区主要由云南与贵州省城市构成,涉及四川省部分城市。社区内部以沪昆线、成贵线以及渝黔线为骨架,衔接起24个城市,形成相对封闭的社区关联格局。
长中游社区主要位于中国长江中游地区,由34个城市组成,涉及长三角城市群、长江中游城市群以及成渝城市群,空间整体连续,反映长中游社区承东启西、连南望北的区位特性。成渝社区主要位于中国成渝地区,由15个城市组成,涉及成渝城市群、长江中游城市群,社区内部成渝线、成昆线、成贵线以及汉蓉线相互交织,形成社区网络联系格局。
晋陕豫社区由34个城市构成,涉及中原城市群、兰西城市群、关中城市群以及晋中城市群部分城市。郑西铁路构成社区内主联系轴线,以郑州、西安为引领,串联起洛阳、三门峡、渭南等城市,向北吸纳晋中城市群部分城市,形成社区组团。
兰西社区主要位于河西走廊地区,西北段沿河西走廊大通道延伸至酒泉,东南段至汉中,联系起兰西城市群与陕西南部部分城市,整体呈西北—东南向条带状联系格局,共有12个城市组成。社区整体沿丝绸之路延展并辐射中亚,其特殊的、重要的战略区位,承担着东西合作与双向开放的重要职责。社区内核心枢纽兰州,是内陆与西北联通的重要城市,也是徐兰高铁与兰新高铁的关键节点,在城市网络中表现为强联系、多关联等方面。
海南社区位于海南省内,共由12个城市组成。社区内高铁沿环岛分布,由于琼州海峡形成的天然屏障,从而形成相对独立社区。内蒙古社区由呼和浩特、乌兰察布、包头、鄂尔多斯4个省内相对活跃的城市组成,共同构成了区域联系的骨架,由于地理区位与设施空间的差异成为独立社区。天山北坡社区主要位于新疆维吾尔自治区内,由9个城市组成,形成明显的省内关联格局。
4.2 社区交叠空间识别
表2 交叠空间概况
Tab. 2
| 交叠类型 | 交叠空间内部城市 | 城市数量(个) |
|---|---|---|
| 长中游社区、南部社区 | 韶关、株洲、郴州 | 3 |
| 长中游社区、成渝社区 | 宜昌 | 1 |
| 长中游社区、长三角社区 | 合肥、马鞍山、六安 | 3 |
| 京津冀社区、晋陕豫社区 | 阳泉、安阳、鹤壁、新乡 | 4 |
| 京津冀社区、山东半岛社区、长三角社区 | 济南、枣庄、济宁、泰安、德州、沧州、徐州 | 7 |
| 两广社区、南部社区 | 汕头、惠州、汕尾、东莞、潮州、揭阳 | 6 |
| 晋陕豫社区、兰西社区 | 宝鸡、天水、定西 | 3 |
图7
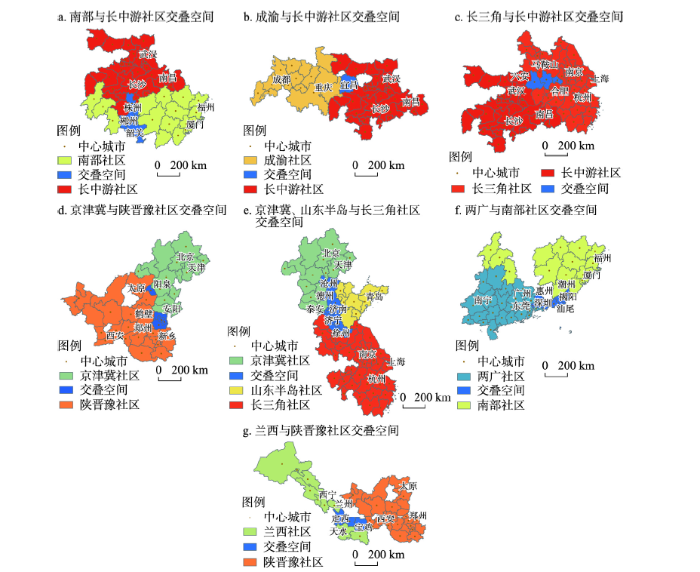
图7
2021年中国城市联系社区交叠空间识别
Fig. 7
Identification of overlapping spaces in China's urban linkages communities in 2021
两广社区与南部社区形成交叠空间汕头、惠州、汕尾等6个城市。空间分布上集中连片,整体呈条带状分布(图7f)。依托厦深高铁,衔接福建与广东之间的联系,反映了沿高铁通道网络联系的廊道效应与距离衰减效应,一定程度上也反映出交叠城市较为集中的分布在单一通道而弱化了社区间可能形成其他通道的特征。
晋陕豫社区与兰西社区形成交叠空间包含宝鸡、天水、定西3个城市,这些交叠空间是中原地区连接西北的关键区域,同时也是区域之间联通的仅有通道,依托郑西高铁形成东西向通道枢纽,反映出中原地区与西北地区之间高铁织网密度低的特点(图7g)。
综上来看,社区间交叠空间从空间形态、区域位置以及城市功能等方面存在诸多共性。在空间形态上,交叠城市呈点状或带状分布。从区域位置来看,交叠城市多位于区域中心城市周边,在行政区划上多处于省间交界地带,特殊的地理区位使得交叠城市承担区域间交流互动,反映一定的高铁廊道效应与距离衰减效应。在城市功能上,交叠城市依托高铁通道,通过过渡与转换功能,表现为社区间联系桥梁,体现了交叠空间在城市联系的尺度效应。
5 结论与讨论
5.1 结论
本文使用2021年高铁客运时刻数据,以《交通强国建设纲要》中提出的建设“全国123出行交通圈”为切入点,对比分析了全国城市群以及中心城市通达格局及差异,基于“泛城市群”通达态势,进一步使用SLPA模型对全国所有城市进行社区划分与交叠空间识别,探究区域空间格局发展新态势以及交叠空间地理特征。研究结论为:① 中国城市群2 h内通达的数量为15个,占城市群总量的79%;城市加权平均通达时间上,整体上呈现由中心向外围由低向高扩大的“圈层式”空间格局。② 中心城市3 h通达等值线覆盖圈大多超出城市群范围,表现出“泛城市群”空间特征。③ 通过交叠社区发现算法将中国城市空间划分为14个社区,“胡焕庸线”以西仅有3个社区。④ 对已划分社区进行交叠空间识别,其中存在交叠的9个社区共有27个交叠城市产生。⑤ 在空间形态上,交叠城市呈点状或带状分布;从空间区位来看,交叠城市多位于区域中心城市周边,在行政区划上多处于省间交界地带;在城市功能上看,交叠城市依托高铁流通道,通过过渡与转换功能,表现为社区间网络联系桥梁。
针对划分社区与交叠空间特点,为了城市和区域更好的发展,可采取措施进行优化与调整。各社区方面:① 尝试推进社区内空白区域的高铁建设,破除欠发达地区的交通瓶颈;② 提升东西向通道运能,以枢纽城市为中心拓宽核心区与边缘区的城市联系,着力填补区域高铁路网空白;③ 尝试加强东北社区、海南社区、内蒙古社区、天山北坡社区高铁轴带建设,尝试实现内成网、外畅通、点线协调的铁路网布局结构。交叠空间方面:① 零星分布的交叠城市可以尝试扩大地理邻近节点区位优势,创造更多跨区域联系可能,为区域发展提供新的路径与动力;② 拓展区域铁路连接线,针对交叠城市宝鸡、天水、定西所在社区,尝试建立城际铁路骨干通道;③ 其他交叠空间所在区域,尝试建立城际铁路网,进一步完善高铁网络,扩大覆盖范围。
5.2 讨论
高铁作为现代交通的重要组分,是推动区域空间重塑的显著力量。《交通强国建设纲要》中指出:“到2035年,要基本形成都市区1 h通勤、城市群2 h通达、全国主要城市3 h覆盖的中国交通格局”。本文通过对城市群内城市通达格局进行对比分析,发现中国19个城市群中达到2 h通达标准的城市群数量已达15个,另有5个城市群在1 h之内,达到了都市区通勤程度,考虑到高铁的时空压缩效应,城市群内部城市有能力且会表现出超越本城市群范围的空间联系与相互作用。中心城市不仅是承载要素发展的主要空间载体,还肩负起引领区域发展的作用。因此,本文进一步通过对中心城市通达格局分析以及3h通达等值线覆盖圈范围提炼,期望能够更清晰地呈现中心城市通达范围超越城市群边界现象以及跨城市群的空间发展态势。
1978年改革开放以来,基于自然人文地理条件、区域发展的地域差异和传统交通联系方式,中国区域空间格局的划分方式主要包括东中西三大经济地带、四大板块、七大经济区以及“十四五”规划提出的19个城市群、现代化都市圈等,南方和北方的经济空间分异也日益受到重视。与一般区划不同,本文研究显示,高铁流视角下的中国区域空间格局呈现跨城市群联系与区域组团发展态势。从空间尺度看,本文识别的社区范围要小于三大经济地带、四大板块、七大经济区,而大于城市群与都市圈空间范围。从各社区来看,传统长中游城市群、中原城市群东侧的部分城市被长三角社区吸纳,或是成为交叠区域,反映了高铁交通视角下东部沿海发达地区区域影响力的扩大;南部社区跨越若干经济区,反映高铁交通作用下南方地区正在形成纵贯东西的联系格局;两广社区包含广东、广西大部分地区,中国历史上传承悠久的“两广地区”似乎在高铁流衔接下重新显现;晋陕豫社区与兰西社区联系紧密,共同搭建起西北至内陆的桥梁;成渝社区、云贵社区、天山北坡社区、东北社区、内蒙古社区、海南社区仍然表现为相对独立、完整的地域单元。
基于空间联系的中国城市交叠空间的网络化、交互式、跨尺度作用特征凸显。① 网络化特征:从城市关系视角来看,交叠空间韶关、宜昌、阳泉等城市不仅垂直依附省会城市,也同时存在与其他城市之间的水平相互影响,对外联系也不再仅限于城市群内部,伴随武长高铁、汉蓉高铁等形成的高铁远程通道,交叠空间超越社区内部联系,呈现垂直关系与水平关系共存的网络联系特征;交叠空间合肥、济南,一方面存在垂直的控制或依附关系,另一方面也存在水平的相互获取关系,在较强的行政影响力作用下,通过京沪、沪蓉等高铁通道,使得长中游社区、长三角社区、京津冀社区、山东半岛社区相互衔接,呈现网络联系特征。综上,“网络范式”下,城市等级隶属职能弱化而节点竞合关系加强,依托高铁通道,城市的外部影响力能够弱化地理邻近与行政边界的约束,交叠空间在长距离网络联系与跨区域网络覆盖下生长。② 交互式特征:从区域交互视角来看,长中游社区与长三角社区、京津冀社区与晋陕豫社区在沪蓉通道、京广通道形成交叠空间并与社区分界吻合,交叠空间呈团块状零散分布,反映沪蓉通道、京广通道与中部部分地区高铁联系较弱的特征;长中游社区与南部社区、兰西社区与晋陕豫社区、京津冀社区与山东半岛社区和长三角社区形成交叠空间,空间分布上集中连片并呈不同走向地条带状连续分布。其余社区之间产生的交叠空间,在空间形态上多呈点状或团块状分布,承担社区间交流互动。由此可见,社区之间相互作用、相互影响,表现出不同形态和特征的空间交互。③ 跨尺度作用特征:从空间尺度视角来看,交叠空间合肥、济南、汕头等城市一方面是行政中心或处于省行政区交汇处,承担不同行政区间的过渡转换,另一方面在高铁通道作用下,还充当长中游社区、长三角社区、京津冀社区、山东半岛社区、两广社区、南部社区空间联系支点,跨越不同空间尺度,发挥空间交互作用。可见,多层级区域综合作用于交叠空间,体现出跨尺度的空间过程。
使用交叠社区发现模型,能够较好的揭示中国城市空间发展格局特征。从SLPA模型性能来看,该模型表现出一定的适应性和稳健性,能够较有效地揭示城市交叠结构;从分析结果来看,SLPA模型能够结合高铁联系特点,反映出不同于传统区划的空间格局,呈现不同社区空间差异,并在此基础上识别出社区间交叠空间,整体来看对中国城市空间交叠的研究具有一定说服力。
在未来研究中本文还有进一步探讨与优化的地方:① 本文使用的是时间截面数据,后续可结合多时间尺度,在空间演化和作用机制方面进一步探究;② 可以尝试以动态数据结合多种交通方式,进一步探讨城市网络交叠空间;③ 高铁站虽然在一些城市没有设点,但仍可享受高铁服务辐射,后续可结合更多地方情况进行探讨。
参考文献
Progress and the future direction of research into urban agglomeration in China
DOI:10.11821/dlxb201408009
[本文引用: 1]

Urban agglomeration has been the inevitable result of China's rapid industrialization and urbanization over the last 30 years. Since the early 2000s, urban agglomeration has become the new regional unit participating in international competition and the division of labor. China has declared urban agglomeration the main spatial component of new types of urbanization over the next decade as clarified at the first Central Urbanization Working Conference and in the National New-type Urbanization Plan (2014?2020). However, research on urban agglomeration remains weak and needs to be strengthened. From 1934 to 2013, only 19 papers published in Acta Geographica Sinica contained the theme of urban agglomeration (0.55% of the total number of articles published) and the first paper on urban agglomeration appeared less than 10 years ago. Despite a small number of divergent studies, this work has contributed to and guided the formation of the overall pattern of urban agglomeration in China. For example, spatial analyses have promoted the formation of the fundamental framework of China's urban agglomeration spatial structure and guided the National New-type Urbanization Plan; spatial identification standards and technical processes have played an important role in identifying the scope and extent of urban agglomeration; serial studies have facilitated pragmatic research; and problems with the formation and development of urban agglomeration have provided a warning for future choices and Chinese development. Future research into urban agglomeration in China should (1) review and examine new problems in China's urban agglomeration options and cultivation; (2) critically consider urban agglomeration when promoting the formation of the 5+9+6 spatial pattern; (3) rely on urban agglomeration to construct new urbanization patterns such as 'stringing the agglomerations with the axis, supporting the axis with the agglomerations'; and (4) deepen national awareness about resources, environment effects and environmental carrying capacity in high density urban agglomerations, management and government coordination innovation, the construction of public finance and fiscal reserve mechanisms, the technical regulation of urban agglomeration planning, and standards for identifying the scope and extent of urban agglomeration.
中国城市群研究取得的重要进展与未来发展方向
DOI:10.11821/dlxb201408009
[本文引用: 1]
中国的城市群是近30年来伴随国家新型工业化和新型城镇化发展到较高阶段的必然产物,自21世纪初期城市群成为国家参与全球竞争与国际分工的全新地域单元之后,中国连续10年把城市群提升为推进国家新型城镇化的空间主体,首次召开的中央城镇化工作会议和《国家新型城镇化规划 (2014-2020年)》进一步明确了城市群作为推进国家新型城镇化的主体地位。然而,城市群在中国的研究目前尚处在亟待加强的薄弱环节。系统总结从1934-2013年的80年间发表在地理学报的城市群主题论文,只有不到19篇,仅占总篇数的0.55%,不仅发表篇数少,而且发表时间短,首次发表城市群研究成果不到10年,研究单位和作者群体集中,研究内容瞄准国家需求但比较发散。即便如此,仅有的城市群研究成果还是对国家城市群总体格局的形成起到了引领作用,做出了重要贡献。具体体现在,提出的城市群空间格局推动国家形成了中国城市群空间结构的基本框架,引导国家新型城镇化规划把城市群作为推进新型城镇化的主体形态,提出的城市群空间范围识别标准与技术流程对界定国家城市群范围起到了重要作用,提出的城市群系列研究领域带动城市群的研究向着纵深与实用方向拓展,提出的中国城市群形成发育中存在的问题对未来城市群的选择与发展起到了警示作用。以这些研究进展和成果为基础,未来中国城市群选择与培育的重点方向为:以问题为导向,深刻反思检讨中国城市群选择与发育中暴露出的新问题;以城市群为主体,重点推动形成“5+9+6”的中国城市群空间结构新格局;以城市群为依托,重点推动形成“以轴串群、以群托轴”的国家城镇化新格局;以国家战略需求为导向,继续深化对城市群形成发育中重大科学问题的新认知,包括深入研究城市群高密度集聚的资源环境效应,科学求解城市群高密度集聚的资源环境承载力,创新城市群形成发育的管理体制和政府协调机制,研究建立城市群公共财政制度与公共财政储备机制,研究制定城市群规划编制技术规程与城市群空间范围界定标准等。
Spatial pattern of 2h travel circle of major urban agglomerations in the Yangtze River Economic Belt
DOI:10.11821/dlyj020210386
[本文引用: 1]
Urban agglomerations are important carriers to promote the regional socio-economic development and participate in the international competition in the advanced stage of urbanization. And the high traffic accessibility is essential for the high-quality development of urban agglomerations. According to the 2h access goal of urban agglomeration proposed in the Outline of Building a Country with a Strong Transportation Network, taking three national urban agglomerations in the Yangtze River Economic Belt as the study area, this paper employs the weighted average travel time as the measurement index and constructs the field model and the gravity model to comparatively analyze the pattern characteristics of 2h travel circle of all cities and central cities in the three urban agglomerations. The results show that: firstly, the weighted average travel time of all the cities in the three urban agglomerations shows the “circle-type” spatial pattern that continuously expands from low (the center) to high (the periphery). Specifically, the 2h travel corridors exhibits the “>” pattern in Yangtze River Delta urban agglomeration and displays the “cross” pattern in Chengdu-Chongqing urban agglomeration; but Yangtze River Middle Reaches urban agglomeration has not formed 2h travel corridors. Secondly, the spatial distribution of the 2h travel circle of the central cities is significantly affected by the geographical location: the closer to the geometric center of the urban agglomeration, the larger the coverage of 2h travel circle. Moreover, the spatial distribution of the hinterland is affected by the comprehensive scale of the central city. And there are large differences in the spatial distribution of the 2h travel circle and the hinterland among the three urban agglomerations. Thirdly, there are significant differences in the connectivity of 2h travel circle among different urban agglomerations, which shows the pattern of multiple circle superposition and economic connection. The Yangtze River Delta urban agglomeration has initially formed the hierarchical network structure of central cities, while the Yangtze River Middle Reaches and Chengdu-Chongqing urban agglomerations stay at the development stage of connection axis. Fourthly, the spatial arrangement of the transport infrastructure has significant influence on the connectivity of 2h travel circle of the central cities. The high-density expressway network plays an important role in improving the connectivity of 2h travel circle in central cities at the scale of urban agglomeration. From the viewpoint of the structure of connectivity, urban agglomerations can be classified into three types: polycentric-network type, polycentric-cluster type and bicentric-radial type.
长江经济带主要城市群2h出行交通圈格局特征
DOI:10.11821/dlyj020210386
[本文引用: 1]
城市群作为城镇化高级阶段区域社会经济发展和参与国际竞争的主要空间载体,良好的交通通达性是其高质量发展的必要条件。以《交通强国建设纲要》提出的城市群2h通达目标为研究视角,以长江经济带3个国家级城市群为研究对象,选取加权平均出行时间作为测度指标并引入场强和引力模型,对比分析3个城市群所有城市与中心城市两个层级2h出行交通圈格局特征。研究发现:① 3个城市群出行交通圈均表现为从中心向外围地区呈现出由低到高连续扩大的“圈层式”空间格局特征,且长三角和成渝城市群分别形成了“>”字型和“十”字型2h出行廊道,但长江中游城市群尚未形成2h出行廊道。② 城市群中心城市2h出行交通圈的空间分布受区位条件影响较大,越接近区域几何中心则2h出行交通圈覆盖范围越大,而影响腹地受中心城市综合规模的作用明显,3个城市群各中心城市2h出行交通圈和影响腹地的空间分异显著。③ 不同城市群中心城市2h出行交通圈衔接联系水平差异显著,表现出多元的圈层叠加的经济联系格局。④ 高密度高速公路路网在提高城市群中心城市2h出行交通圈衔接联系水平中发挥重要作用,按衔接联系模式特征可将各城市群总结为多中心网络型、多中心组团型与双中心轴辐型。
How accessibility shapes land use
DOI:10.1080/01944365908978307 URL [本文引用: 1]
The impact of orbital motorways on intra-metropolitan accessibility: The case of Madrid's M-40
Temporal and spatial evolution of integrated transport accessibility in the Yangtze River Delta: 1986-2005
DOI:10.11820/dlkxjz.2010.05.015
[本文引用: 1]
<p>Based on the integrated transport network in 1986, 1994 and 2005, choosing weighted mean travel time as the indicator, the temporal and spatial evolution of integrated transport network and its accessibility are elaborated, and some conclusions are drawn as follows. (1) The speedy development of integrated transport network results in the continual improvement of accessibility, which is faster in the second period (1994-2005) than that in the first period (1986-1994). The optimal region of integrated accessibility is Shanghai and the zone along the Taihu Lake in three time section. The sub-optimal region of integrated accessibility was“>- shaped” that consisted of the zone along the Shanghai-Nanjing route and the Shanghai-Hangzhou route in 1986 and 1994, but it had the “Z-shaped” pattern that consisted of the zone along the Shanghai-Nanjing route, the Yangtze River and the Shanghai-Hangzhou route, and the Hangzhou-Ningbo route. (2) The benefits from the improvement of accessibility are different among the nodes. The changing extent of weighted mean travel time is related to the initial value, and the nodes with high initial value decrease more. The changing rate is higher in the central region than that in the north and south regions. Both the changing extent and the changing rate have different patterns in the different periods. (3) Shanghai has the best in integrated accessibility, followed by Jiangsu provinces, and Zhejiang province is the worst, but the dominant position of Shanghai is weakening, and the gap between Jiangsu and Zhejiang is narrowing. (4) The standard deviation of integrated accessibility coefficient decreases in the research period, which shows that the integrated transport network in the Yangtze River Delta is improving, but there are different developmental processes among various transport modes.</p>
20世纪80年代以来长三角地区综合交通可达性的时空演化
DOI:10.11820/dlkxjz.2010.05.015
[本文引用: 1]
以1986、1994、2005年为时间断面,加权平均旅行时间为指标,长三角地区20世纪80年代以来综合交通网络及其可达性的时空演化呈现如下特征:①综合交通网络的快速发展带来了综合交通可达性的不断提升,且第二阶段(1994-2005)发展速度明显快于第一阶段(1986-1994);三时间断面上海及环太湖地区均为可达性最优区域,1986及1994年可达性较优区域大致由沪宁沿线和沪杭沿线构成“>”形,而2005则大致由沪宁沿线(含沿江地区)、沪杭沿线及杭甬沿线构成“Z”形;②可达性提升中节点获益具有明显区域差异,加权平均旅行时间初始值越高的节点其值下降幅度越大,加权平均旅行时间的变化率中部地区低于南北边缘地区,但变化值及变化率在不同阶段均呈现不同特征;③从分省市角度,上海可达性最优,江苏板块次之,浙江板块较差,但上海的优势地位逐步下降,浙江板块与江苏板块间的差距正不断缩小;④综合交通可达性系数标准方差逐步下降,表明长三角地区综合交通网络发育日益成熟,但不同交通方式具有不同发展特征.
The road network accessibility and spatial pattern of Guangzhou-Foshan Metropolitan Area
广佛都市圈公路网络通达性及其空间格局
The city network centrality and spatial structure in the Beijing-Tianjin-Hebei Metropolitan Region. Economic Geography
基于交通可达性的京津冀城市网络集中性及空间结构研究
The spatial connection and network feature of Zhongyuan Economic District base on intercity traffic flow
中原经济区城市空间联系及其网络格局分析: 基于城际客运流
Urban agglomerations transportation network space-time evolution in the frontier mountainous area: A case of Urban Agglomerations in the Central Yunnan
DOI:10.2307/142023 URL [本文引用: 1]
边疆山地城市群交通网络的时空演化: 以滇中城市群为例
Functional structure of spatial flow in the Yangtze River Delta: Analysis of passenger based data for the high speed railway
DOI:10.18306/dlkxjz.2016.11.008
[本文引用: 1]
High-speed rail as the infrastructure for material and information exchange is important channels in urban agglomerations that connect urban centers and facilitate urban expansion, and urban agglomeration is a greater metropolitan area whose internal separation is reduced by high-speed rail system. This study used passenger flow data of 380 sites in the Yangtze River Delta high-speed railway system to construct a 20 by 20 matrix for examining connections between cities in the Yangtze River Delta Urban Agglomeration and its spatial structure. The results show that: (1) The density of network connection between the core cities in the Yangtze River Delta—Shanghai, Nanjing, Hangzhou, and Ningbo—is higher than between other cities; (2) Connections between the core cities of the Yangtze River Delta and cities along major transportation axes, such as Shanghai to Zhenjiang and Jiaxing, Nanjing to Danyang and Huzhou, and Suzhou to Changzhou and Kunshan, have been strong; (3) In terms of "spatial flow" stratification, the first level city network mainly consists of Shanghai-Suzhou-Wuxi-Changzhou and cites along the transportation routes between these cities; the second level city network is mainly composed of Shanghai and Ningbo and cities along the route; the third level city network is mainly composed of Shanghai-Hangzhou-Ningbo and cities along the transportation routes between them; the fourth level city network is mainly composed of Shanghai Jinhua and Yiwu and cities along the route.
长三角城市群“空间流”层级功能结构: 基于高铁客运数据的分析
DOI:10.18306/dlkxjz.2016.11.008
[本文引用: 1]
高铁作为城市群内部物质与信息交流的基础设施,是城市扩展和城市间相互联系的重要通道,而城市群则是被高铁系统压缩了空间的众多城市空间。本文通过采集长三角城市群380个高速铁路客运数据建构20×20的矩阵,建立了基于高铁客流的长三角城市群城市间联系的矩阵,并在此基础上对长三角城市群内外空间结构进行深入分析。结果表明:①长三角城市群核心城市上海、南京、杭州、宁波间城市网络联系密度高于其他廊道城市间联系;②长三角城市群核心城市向外延伸的轴线联系加强,主要表现为上海与镇江、嘉兴,南京与丹阳、湖州,苏州与常州、昆山等城市间联系紧凑;③在城市群“空间流”分层方面:第一层级主要分布在长三角地区“沪—苏—锡—常”及其沿线;第二层级城市网络主要由“沪—宁”及其沿线路线构成;第三层级城市网络主要由“沪—杭—甬”及其沿线路线构成;第四层级城市网络主要由上海—金华—义乌及其沿线路线构成。
The spatial pattern and evolution of high-speed railways accessibility of the urban agglomeration in the middle reaches of the Yangtze River
长江中游城市群高速铁路可达性格局及演变
The European high-speed train network: Predicted effects on accessibility patterns
DOI:10.1016/S0966-6923(96)00033-6 URL [本文引用: 1]
Changing rail travel times and time-space adjustments in Europe
Location, economic potential and daily accessibility: An analysis of the accessibility impact of the high-speed line Madrid-Barcelona-French border
DOI:10.1016/S0966-6923(01)00017-5 URL [本文引用: 1]
The high-speed rail challenge for big intermediate cities: A national, regional and local perspective
DOI:10.1016/j.cities.2009.07.001 URL [本文引用: 1]
The wider spatial-economic impacts of high-speed trains: A comparative case study of Manchester and Lille sub-regions
DOI:10.1016/j.jtrangeo.2011.09.002 URL [本文引用: 1]
The intercity space of flow influenced by high-speed rail: A case study for the rail transit passenger behavior between Beijing and Tianjin
DOI:10.11821/xb201302002
[本文引用: 1]
In the perspective of space of flows, the passenger flow of high-speed rail has become an important representation of functional linkage between the city-regions. Based on the interviews and questionnaires from the passengers of high-speed rail of Beijing and Tianjin, this paper analyzes the intercity space of flows and the spatial integration indicated by the individual micro behavior choice. The findings include: (1) Both of the metropolitan areas of Beijing and Tianjin are the dense areas of intercity passenger flow while suburban counties and districts are the sparse areas, which indicates the spatial polarization of HSR in the aspect of passengers' characteristics; The central city of Beijing-Tianjin is the dominant spatial association, while Beijing-Tanggu, Beijing-Wuqing and Tianjin-Wuqing corridors are the secondary spatial association axes, which presents a hub-and-spoke pattern. (2) Leisure activities, such as tourism, shopping, enhance the cross-city flows. Although intercity high-speed rail reduces the temporal and spatial distance to a certain extent, the effects on changing place of housing or work to another city are not obvious. (3) The frequency of cross-city activities is not very high, commuters across cities generally take 7 days as a cycle; Currently, passenger flows of intercity by HSR are mainly business travel and leisure tourism, which reflects HSR as the material foundation for the spaces of flows; the respondents who take the HSR are mostly male, business people with high education and prospective occupation, and the business travelers who have a higher cross-city frequency are more sensitive to travel time, which demonstrates the intercity space of flow has represented some of the elite space characteristics. (4) There is spatial asymmetry in the cross-city space of flow between Beijing and Tianjin, which could be found from the uneven distribution of O-D passenger flows, the differences on the proportion of the business travel flows and the unbalanced function linkage directions.
京津城际高速铁路影响下的跨城流动空间特征
Spatial effects of high- speed rails on interurban economic linkages in China
高速铁路对中国城市空间相互作用强度的影响
DOI:10.11821/dlxb201412009
[本文引用: 1]
高速铁路作为一种新型的交通方式,其快速发展将会带来交通运输史上一次重大的飞跃,且其对区域空间结构、人口流动、经济联系和土地利用等的影响也越来越成为人们关注的焦点。在中国区域经济一体化进程不断加快的背景下,研究高速铁路对城市空间相互作用强度的影响,对加强区域间经济联系、促进区域经济发展和地域空间组织模式的重构具有重要意义。本文基于GIS网络分析工具,构建时间成本矩阵,研究中国333个地级行政单元和4个直辖市对外经济联系总量和城市对间经济联系强度的空间分布特征,构建无高铁、高铁现状和规划高铁三种情景,并对三种情景进行模拟与探讨。结果显示:① 城市空间相互作用呈现出明显的地带性和“廊道效应”,反映了高速交通在重塑区域空间结构中的作用;② 高速铁路建设提升了城市对外经济联系强度总量,且逐渐从追求“效率”转向“公平性”;③ 高速铁路建设缩小了全国城市对外经济联系总量的差异,但却扩大了城市对间经济联系强度的差异;④ 三大城市群成为城市对外经济总量绝对获益量最大的地区,而其毗邻的中小城市成为提升速率最大的城市。
Evolution and geographic effects of high-speed rail in East Asia
DOI:10.11821/dlxb201604004
[本文引用: 1]
East Asia plays an increasingly important role in the world economy in a line with the development of economic integration and accelerated globalization. As one of the influencing factors of economic integration and regional development, HSR will largely influence the regional development, regional structure, commuting, and regional integration. In this paper, we take the high-speed rail in East Asia as a case to explore the evolution of HSR and its impacts on transport circle and accessibility of cities. Results indicate that the evolution of HSR in East Asia firstly follows the "core cities - core cities" mode and then forms a whole network spatially; HSR network has higher service market in population and GDP than in landuse, and the service markets of HSR network in 2012 are mainly located in the eastern and central regions of China, Japan and South Korea, and those of planned HSR network expand to western China and Japan, south part of South Korea; the 1-h transport circle of core cities in East Asia presents a continuous trend along trunk HSR lines, and the 2-h transport circle has formed continuous egions in the Yangtze River Delta, Pearl River Delta, Tokyo, Seoul or along trunk HSR lines, while the court of weighted shortest travel time of cities in China's mainland,Japan and South Korea presents the "core- peripheral structure", taking Zhengzhou in Henan province, Tokyo and Seoul as the core cities; as the development of HSR, the cities located along the trunk HSR lines have a large increase in accessibility, which shows the "corridor effects".
东亚高速铁路网络的发展演化与地理效应评价
DOI:10.11821/dlxb201604004
[本文引用: 1]
经济全球化和区域一体化进程的不断推进,促使东亚在世界经济中的地位不断提升。高速铁路作为促进经济一体化和区域发展的重要手段和基础,其快速发展势必会对东亚地区的区域发展、空间结构、人口流动和一体化产生重大影响。在分析东亚高速铁路网络发展历程及服务水平的基础上,评价与对比了高速铁路建设对城市交通圈和可达性的影响,及一体化高速铁路潜在的空间效应,以期为东亚一体化高速铁路构建提供指导。结果表明:东亚高速铁路网络扩张整体上呈现出“核心—核心”到网络化的发展历程;高速铁路网络在中国东中部、日本和韩国等地区具有较高的人口和产业服务水平,但国土面积覆盖率相对较低;高速铁路的建设促使核心城市交通圈格局不断扩展与强化,可实现当日往返城市对数量明显增加,主要分布在中国长三角、珠三角,日本东京和韩国首尔周边;中国大陆、日本和韩国的加权平均旅行时间分别呈现出以郑州、东京和首尔为中心的“核心—边缘”结构,且圈层结构逐渐向高速铁路沿线延伸;高速铁路的建设促使城市人口服务水平和可达性的空间格局均呈现出明显的“廊道效应”。
A comparative study on network structures of high-speed train and inter-city coach based on the urban agglomerations
DOI:10.13249/j.cnki.sgs.2020.12.002
[本文引用: 1]
High-speed railway and highway are the important components of land transportation and play an important supporting role in the development and integration of the urban agglomerations. At the urban agglomeration level, this article takes high-speed trains and inter-city coaches as the representatives of the two modes, and compares the characteristics of the two networks with the network analysis method. The results show that: 1) The frequency of high-speed trains is generally higher between urban agglomerations, and the frequency of inter-city coaches is mainly concentrated in the city-pairs in urban agglomerations; 2) The inter-city coach network are more mature and complex in many urban agglomerations and have higher values of the network characteristic indicators than high-speed trains. 3) The development of the two modes of transportation varies greatly in different urban agglomerations. The two networks in the Yangtze River Delta and the Pearl River Delta are relatively mature and developed. The inter-city coach network connectivity in the Beijing-Tianjin-Hebei and Chengdu-Chongqing urban agglomerations is obviously superior to that of the high-speed train network. 4) The high-speed train network is with axis structure, while the inter-city coach network shows the ‘core-periphery’ structure. In the specific urban agglomeration, the two networks’ structures hold differences.
基于城市群尺度的高铁列车与长途汽车网络结构比较
DOI:10.13249/j.cnki.sgs.2020.12.002
[本文引用: 1]
基于城市群尺度,以高铁列车和长途汽车作为2种交通方式代表,结合网络分析方法对比2种方式的联系格局和结构属性等。研究发现:① 高铁列车在城市群之间的运输频次普遍较高,长途汽车的频次主要集中于城市群内部的运输线路;② 各城市群的长途汽车网络已拥有一定规模,网络的成环率、结合度和连接率普遍高于高铁列车网络;③ 2种交通方式在不同城市群的发展差异较大,长三角和珠三角等城市群的2种网络都较为成熟发达,京津冀和成渝等城市群的长途汽车网络连通性明显优于高铁,北部湾等城市群的2种网络都有较大的发展空间;④ 高铁列车网络具有轴线结构特征,长途汽车则呈“核心?边缘”的网络结构,在具体城市群中两种网络结构又具有一定差异性。
High-speed rail and office location choices. A stated choice experiment for the Netherlands
DOI:10.1016/j.jtrangeo.2010.09.002 URL [本文引用: 1]
Spatial analysis of the competitiveness of the high-speed train and air transport: The role of access to terminals in the Madrid-Barcelona corridor
DOI:10.1016/j.tra.2014.09.010 URL [本文引用: 1]
A study on the influence of high-speed railways on urban hinterland: The case of north Anhui
高速铁路对沿线地区城市腹地的影响研究: 以皖北地区为例
Potential impact and optimization of intercity high-speed rails on the urban system spatial pattern evolution in Heilongjiang province
城际高铁对未来黑龙江城镇体系空间格局的影响及优化
Assessing the impacts of high-speed rail on regional spatial structure: A study of Yangtze River Delta urban agglomeration
铁路高速化对长三角城市群区域空间联系格局的影响
OverCite: Finding overlapping communities in citation network//2013 IEEE/ACM International Conference on Advances in Social Networks Analysis and Mining (ASONAM 2013)
Extended Clique percolation method to detect overlapping community structure//2014 International Conference on Advances in Computing, Communications and Informatics (ICACCI)
Dynamic social community detection and its applications
Generation of overlapping clusters constructing suitable graph for crime report analysis
Uncovering the overlapping community structure of complex networks in nature and society
DOI:10.1038/nature03607 [本文引用: 1]
The theoretical cognition of the development law of China's urban agglomeration and academic contribution
DOI:10.11821/dlxb201804005
[本文引用: 1]
Urban agglomeration refers to a highly integrated city and town group. It comes into being with the development of industrialization and urbanization to the advanced stage. The formation and development of urban agglomeration is a long natural process, which is transformed from competition to cooperation. China is in a new stage of urbanization transition, and has entered a new era of leading the global urban agglomeration development in the 21st century. The research and experience model of China's urban agglomeration has been accepted by global urban agglomeration construction as reference. In this paper, the natural law of urban agglomeration is proposed, including developmental gradual law, multi-scale transmission law of space intensive utilization, the combination law of spatial crystal structure, the natural growth of the breeding tree, and the gradient upgrade law of sustainable development. Following these laws, Chinese geographers have made great contributions to the research and development of China's urban agglomerations, which focuses on academic theory, technical method, decision support and planning practice. We developed and scientifically defined the concept of urban agglomeration, and first adopted the identification standard of urban agglomeration space. We established the spatial intensive development and layout simulation decision support technology chain in urban agglomeration, and developed related software chain. We laid out the new pattern of 5+9+6 in the spatial organization of China's urban agglomerations, and formulated the first China's urban agglomeration planning technical regulation. We completed the development plan of most urban agglomerations in China, which has become an important basis for decision-making at the national level. In the future, geographers will play a growing role and shoulder the responsibility in the development of Chinese urban agglomerations. We should combine qualitative and quantitative methods, and use big data and intelligent decision support technology to solve a series of problems in the development of this cause. Only in this way can Chinese geographers make greater contributions to the development of urban agglomerations.
中国城市群形成发育规律的理论认知与地理学贡献
DOI:10.11821/dlxb201804005
[本文引用: 1]
城市群是国家工业化和城镇化发展到高级阶段的产物,是高度一体化和同城化的城市群体,城市群形成发育过程是一个各城市之间由竞争变为竞合的漫长自然过程,遵循自然发展规律。中国正处在新型城镇化转型发展的新阶段,已进入21世纪引领全球城市群发展的新时代,中国城市群研究与建设的经验模式正在被全球城市群建设所效仿和借鉴。本文从理论上梳理并提出了城市群形成发育遵循的自然规律,包括城市群形成发育的阶段性规律、城市群多尺度空间集约利用传导规律、城市群空间晶体结构组合规律、城市群自然生长的育树成林规律和城市群可持续发展的梯度爬升规律。地理学家遵循这些发展规律,从学术理论、技术方法、决策支持和规划实践等方面为中国城市群的研究和发展做出了不可替代的重大贡献,主要包括提出并科学界定了城市群概念,提出了城市群空间范围的识别标准,创建了城市群空间集约拓展与布局仿真决策支持技术链,研制了城市群空间集约拓展与布局仿真决策支持系统软件链,提出了中国城市群空间组织的“5+9+6”新格局,研制出国内第一部《城市群规划技术规程》,编制完成了全国多数城市群发展规划,转化为国家决策的重要依据。未来中国城市群的发展与研究中,地理学家发挥作用的空间越来越大,地理学家肩负着不可推卸的责任使命,应责无旁贷地采用定性与定量相结合的研究方法,引用大数据、智能决策支持技术等新手段解决城市群发展面临的一系列问题,一如既往地为城市群发展吸纳众智、献计献策,发挥更大作用,做出更大贡献。
Understanding the city-transport system of urban agglomeration through improved space syntax analysis
DOI:10.1177/01600176211023879
URL
[本文引用: 1]
From the perspective of city-transport system, this article applies space syntax to analyze the physical integration of cities. Traditionally, space syntax is mainly applied to urban areas, buildings, and other scales. However, when space syntax is applied to the configuration analysis of urban agglomeration, the change of scale causes changes in spatial perception and human behavioral patterns. Thus, we present a new method of space syntax. This method defines the lane and track between entrance and exit, and city as node, which represents small-scale space. Infrastructure, such as stations, entrances, and exits, are defined as links. The urban agglomeration is thus transformed into a topological network, and then displayed as a bipartite graph of cities and routes. We take the urban agglomerations in the Yangtze River Middle Reaches (YRMR) as the case study area and analyze its spatial configuration from the perspectives of local and integral, interfaces at different scales, gaps, evolution of the dual foreground and background networks, and evolution of the transport networks. The results reveal the way cities integrate with each other and further reveal the multi-scale spatial structure of urban agglomeration.
The spatial structures and organization patterns of China's city networks based on the highway passenger flows
DOI:10.11821/dlxb201702004
[本文引用: 1]
The multi-level perspective and multi-scalar city network have gradually become the critical pathways to understand spatial interactions and linkages. The road linkages represent distinguished characteristics of spatial dependence and distance decay, which is of great significance in depicting spatial relationships at regional scale. Based on the data of highway passenger flows between prefecture-level administrative units, this paper tries to identify the functional structures and regional impacts of China's city network, and further explores the spatial organization patterns of the existing functional regions, aiming to deepen the understanding of city network structure and provide new cognitive perspectives for the extant research. The empirical results are shown as follows: (1) It is immediately visible that the highway flows are extremely concentrated on the mega-regions of eastern coastal China and major economic zones in central and western China. And city networks based on highway flows demonstrate strong spatial dependence and hierarchical characteristics, which to a large extent has spatial coupling with the distributions of major mega-regions in China. It is a reflection of spatial relationships at regional scale and core-periphery structure. (2) A total of 19 communities that belong to important spatial configurations are identified through community detection algorithm, and we believe that they are urban economic regions within urban China. Their spatial metaphors can be concluded in three aspects. Firstly, many communities have the same boundaries with provincial level administrative units, which reveals that significant administrative region economy still exists in contemporary China. Secondly, trans-provincial linkages can be formed through spatial spillover effects of mega-regions within specific communities. Thirdly, cities located in the marginal areas of provinces and attracted by powerful center cities in neighboring provinces may become increasingly disconnected with their own provinces and be enrolled into communities of neighboring provinces, which make contribution to the formation of the trans-provincial core-periphery structures. (3) Each community, with its distinguished city network system, demonstrates strong spatial dependence and various spatial organization patterns. Regional patterns have emerged with the features of a multi-level, dynamic and networked system. (4) From the morphology perspective, the spatial pattern of regional city networks can be basically divided into monocentric structure, dual-nuclei structure, polycentric structure and low-level equilibration structure, with the monocentric structure as the major type.
基于公路客流的中国城市网络结构与空间组织模式
DOI:10.11821/dlxb201702004
[本文引用: 1]
多视角和多尺度城市网络逐渐成为认识空间关系的主要途径。公路流数据具有显著的空间依赖性和距离衰减特性,对于刻画区域尺度空间关系具有重要意义。基于全国地级行政单元间的公路客运流,论文尝试刻画中国城市网络功能结构和区域效应,并对其空间组织模式进行特征提取和规律挖掘,以期能够为城市网络研究提供新的方法支撑和认知视角。研究结果表明:① 基于公路流的城市网络空间形态表现出强烈的空间依赖性和层级特征,与中国主要城市群分布存在较大程度的空间耦合,更多体现的是区域尺度的空间关系及核心—外围组合关系;② 通过社区发现算法识别出19个城市经济区,其空间内涵主要包括行政区经济、巨型区域溢出效应和核心—边缘结构等;③ 不同地域系统内城市网络自成体系,表现出显著的空间依赖性和多元的空间组织模式,多层次、流动性和网络化的地域系统格局凸显;④ 从空间形态上看,区域城市网络空间结构大致可划分为单中心结构、双核心结构、多中心结构和低水平均势结构等区域关联形态,并以单中心发育模式为主。
Evolutionary characteristics of railway flow network urban agglomerations in the middle reaches of Yangtze River: Based on game overlapping community model
长江中游城市群铁路流网络演化特征: 基于博弈交叠社区模型的分析
Multi-label propagation for overlapping community detection based on contribution degree
基于贡献度的多标签传播重叠社区发现研究
Benchmark graphs for testing community detection algorithms
Overlapping community detection in networks: The state-of-the-art and comparative study
Slpa: Uncovering overlapping communities in social networks via a speaker-listener interaction dynamic process//2011 IEEE 11th International Conference on Data Mining Workshops
Extending the definition of modularity to directed graphs with overlapping communities
Modularity and community structure in networks
DOI:10.1073/pnas.0601602103
PMID:16723398
[本文引用: 1]
Many networks of interest in the sciences, including social networks, computer networks, and metabolic and regulatory networks, are found to divide naturally into communities or modules. The problem of detecting and characterizing this community structure is one of the outstanding issues in the study of networked systems. One highly effective approach is the optimization of the quality function known as "modularity" over the possible divisions of a network. Here I show that the modularity can be expressed in terms of the eigenvectors of a characteristic matrix for the network, which I call the modularity matrix, and that this expression leads to a spectral algorithm for community detection that returns results of demonstrably higher quality than competing methods in shorter running times. I illustrate the method with applications to several published network data sets.
Hierarchical community detection and functional area identification with OSM roads and complex graph theory
DOI:10.1080/13658816.2019.1584806 URL [本文引用: 1]
A distance-based method of community detection in complex networks
DOI:10.3724/SP.J.1047.2013.00338 URL [本文引用: 1]
考虑地理距离的复杂网络社区挖掘算法
DOI:10.3724/SP.J.1047.2013.00338
[本文引用: 1]
复杂网络具有社区结构的性质,即社区内节点的连接比社区间的连接更为紧密。目前,具有复杂网络拓扑结构的社区挖掘算法已有很多,但在很多地理空间的复杂网络中节点间的紧密度,不仅与其连接关系有关,同时与它们之间的距离有关。因此,本文提出将节点间的地理距离考虑到社区挖掘的过程中,修改基于模块度增量矩阵的Newman快速算法(简称CNM算法),将1/d<sub>ij</sub><sup>n</sup>(d为节点i与节点j之间的距离)作为边权,对加权网络进行社区挖掘,从而发现既相互联系紧密又在地理空间上相互接近的社区。最后,本文用国内航线网络作为实例,将算法用于挖掘航线网络中城市的社区结构,得到10个在航线网络中联系紧密且在空间分布上具有一定地域性的城市社区,与我国的主要经济区域分布比较一致。本算法考虑地理相关性和连接紧密性,较好地识别出空间网络的社区结构。
Comparison and optimization of the spatial structure benefits of urban agglomeration: A case study of Changsha-Zhuzhou-Xiangtan urban agglomeration and Dongting Lake urban agglomeration
DOI:10.13249/j.cnki.sgs.2019.10.005
[本文引用: 1]
Urban agglomeration is an important space carrier to promote new urbanization, and the spatial structure is the spatial reflection of the degree, stage and process of urban agglomeration. From the 3 aspects of urban agglomeration benefit, distance benefit and spatial connection benefit, this article use ArcGIS and urban interaction intensity model to compare the spatial structure benefits of the Changsha-Zhuzhou-Xiangtan urban agglomeration and Dongting Lake urban agglomeration in the development stage. The results show that Dongting Lake urban agglomeration has a comparative advantage in external scale including the population scale, land area and the city quantity. However, the compactness of urban agglomerations is low, the advantages of urban scale structure are not obvious enough and the spatial connection between important cities is not tight enough. It shows a more obvious "big and scattered" characteristics, and the quality of development and the degree of development are not good. Changsha-Zhuzhou-Xiangtan urban agglomeration is relatively small in terms of number of cities, population size and land use, but its compactness and scale benefits are relatively high, and the scale structure has a relatively high degree of dominance. On this basis, aiming at maximizing the efficiency of urban agglomeration spatial structure, the spatial structure system of “one heart, two circles and three axes” and “1+5” urban agglomeration with Changsha as the center city is proposed, which to provide references for the optimization and development of the urban agglomeration spatial structure.
城市群空间结构效益评价与优化研究: 以长株潭城市群与环洞庭湖城市群为例
DOI:10.13249/j.cnki.sgs.2019.10.005
[本文引用: 1]
从城市群规模效益、距离效益和空间联系效益3个方面出发,运用ArcGIS和城市相互作用强度模型对长株潭城市群和环洞庭湖城市群空间结构效益进行评价比较分析。结果表明:环洞庭湖城市群在外在规模上具有相对优势,具体表现为人口规模、空间规模以及城市数量较大,但城市群的紧凑度不高,城市规模等级结构优势不够明显,空间可达性较差,重要城市之间的空间联系不够紧密,呈现“大而散”的特征;相对而言,长株潭城市群城市数量、人口规模及用地较小,但其紧凑度及规模效益较高,城市规模等级结构优势度相对较高,可达性较好,重要城市之间的空间联系较为紧密。在此基础上,以实现城市群空间结构效益最大化为目标,构建了以长沙为中心城市的“一心两圈三轴”结构体系。
