

1 引言
1978年改革开放以来,中国经济持续高速发展,逐渐形成了以优质廉价的生产要素为基础、以广阔市场为优势、以要素投入规模扩张拉动为增长方式的经济发展格局。然而,伴随人口老龄化加剧、要素规模驱动力减弱、资源环境约束趋紧等现象的出现,中国经济面临增长减速、收入差距增大、生态“赤字”加剧三重压力,工业化和城镇化进程放缓,原有发展格局难以为继。面对复杂多变的经济形势和外部环境,中国共产党“十九大”报告中明确指出,中国社会主要矛盾发生转变,中国经济已由高速增长阶段转向高质量发展阶段。中国共产党十九届六中全会进一步强调贯彻新发展理念,必须实现高质量发展,这已然成为当前和今后相当长时期中国经济社会发展的新命题。中部地区作为中国新发展格局中的重要一环,在长期积极发挥资源集成、技术支持、跨区域要素自由流动与合理配置、产业梯度转移等关键性作用,正逐步成为全国重要的粮食生产基地、能源原材料基地、现代装备制造及高技术产业基地。同时凭借承东启西、连南接北的区位优势,在区域协调发展格局中也有着举足轻重的战略地位。“十四五”规划纲要文件中将“开创中部地区崛起新局面”作为现阶段深入实施区域协调发展战略的重要任务。2021年7月,中共中央、国务院出台《关于新时代推动中部地区高质量发展的意见》(简称《意见》),明确指出要充分发挥中部地区资源要素、市场潜力等比较优势,推动中部地区加快高质量崛起,在全面建设社会主义现代化国家新征程中作出更大贡献。可见,实现中部地区高质量发展既是全面推动形成东中西区域良性互动协调发展的客观需要,也是整体推进和实施中国高质量发展的必然要求。
自2006年中部崛起战略实施以来,地理学界对中国中部地区的研究在早期主要围绕承接产业转移展开[13⇓-15],同时也有学者就中部地区的资源环境协调[16]、新型城镇化[17-18]进行讨论。在“十四五”的开局之年,中共中央发布的《意见》引起学术界广泛关注,学者们针对中国中部地区高质量发展的诸多方面展开研究。如金凤君等[19]提出中部地区应以绿色发展理念为导向,基于地区发展环境、阶段和需求,积极探索“绿色崛起”的区域特色发展模式。蒋正云等[20]考察了中部地区新型城镇化与农业现代化的耦合协调发展状况,认为各省表现为高度耦合相关且协调关系在不断优化,但双向交互的综合效益相对较低。罗静等[21]构建公共卫生健康保障指标体系,提出中部地区医疗卫生健康水平总体偏低,地区非均衡性明显且均等化程度较低,城乡居民可支配收入差异为主要影响因素。史玉芳等[22]采用SE-SBM模型测度了中部地区37个资源型城市的绿色发展效率并考察其空间关联网络特征,发现资源型城市绿色发展效率整体上升但增速放缓,城际网络关联特征显著且呈多核心发展态势。还有学者针对特定区域(如环长株潭城市群[23]、皖江城市带[24])或城市(如武汉[25]),从旅游业发展、环境承载力等方面探索中部地区高质量发展的特色路径与经验。
已有文献为研究中国中部地区高质量发展提供了有力的理论基础和方法支持,但仍存在两点不足:① 关于中部地区高质量发展的理论逻辑、科学内涵阐释相对不足,实证研究主要从高质量发展的某一侧面展开,缺乏对中部地区高质量发展的多维度、多尺度综合考察;② 已有研究主要就高质量发展的水平测度、空间差异、演进趋势等进行分析,较少对高质量发展时空格局及动态演进的内在驱动因素展开探讨。而中部地区作为承东启西、连南接北的全国战略枢纽,全面考察其高质量发展现状及演进对于推动区域协调发展战略、促进形成高质量发展新格局具有重要的理论与现实意义。
鉴于此,本文基于中国中部地区高质量发展的科学内涵构建评价指标体系,从全国、地区、区域内省际与城市多级空间尺度考察中国中部地区高质量发展的时空格局,分析中国中部地区高质量发展的分布动态演进及长期转移趋势并考虑空间溢出效应,同时还从结构视角对时空格局的形成原因以及动态演进的驱动因素展开讨论。本文旨在通过以上综合探索性研究工作,分析中国中部地区高质量发展的时空格局及动态演进特征,揭示分布动态演进与长期转移趋势的形成机理,从而为协同推动中国中部地区高质量发展提供依据。
2 理论阐释与研究方法
2.1 理论阐释
2.1.1 高质量发展的基本逻辑
习近平总书记强调,高质量发展就是能够更好地满足人民日益增长的美好生活需要的发展,更好地解决发展不平衡不充分问题,实现更高质量、更有效率、更加公平、更可持续、更为安定的发展。因此,“美好生活需要”和“不平衡不充分”两个关键词对于认识高质量发展至关重要[26]。一方面,“美好生活需要”不仅包括人们对教育、工作、社会保障等物质文化更高层次的需要,更涵盖对公平、民主、环境以及获得感、满足感等“软需求”的增长[27];另一方面,伴随生产力的提升,中国高速增长阶段积蓄的不平衡、不充分问题日益凸显[11],其中,“不平衡”主要指城乡、区域间的地区不平衡以及经济与生态、民生等方面的发展不平衡,“不充分”则表现为社会生产力发展不充分、动力转换不充分,发展短板依然明显[26]。因此,随着中国社会主要矛盾的变化,高质量发展不只是经济发展的提质增效,更是对文化、生态、民生等各领域的多方面总体提升;不只是地区发展的总体要求,更是地区间相互支撑优势互补、推进区域协调发展必须贯彻落实的战略要求。
2.1.2 中国中部地区高质量发展的科学内涵
中部崛起战略提出和实施后,依托独特的区位优势和丰富的资源要素,中国中部地区加快构建现代化产业体系,在增强城乡发展协调性、推动绿色可持续、加强基础设施建设等方面取得重大成就,经济综合实力迈上新台阶。但是,中部地区经济社会发展的现实病症依然存在,不平衡不充分问题日益突出。首先,过去长期以承接劳动密集型、资本密集型产业为主的经济发展模式导致中部地区低端生产要素不断聚集,生产效率距离高质量发展仍有较大差距。其次,在科技创新方面,《中国区域科技创新评价报告2021》显示,中部6省综合科技创新水平均低于全国平均水平,特别是制造业创新能力有待增强。再次,在绿色发展方面,中部地区废水排放总量、工业废弃物产生量逐年上升,雾霾污染形势严峻[19],绿色发展格局有待巩固。《2020中国民生发展报告》显示,2020年地级市民生发展前100名中部地区占比不足25%,民生发展短板显著。此外,受新型冠状病毒肺炎感染影响,中部地区应对重大突发事件的能力有待提升[21]。由此,立足于新发展理念,本文认为中部地区高质量发展必须同“满足人民美好生活需要”紧密结合,着力解决发展不平衡不充分问题,实现各领域“共同进化”,其科学内涵应从有效性、协调性、创新性、持续性、共享性以及稳定性6个方面展开:① 作为中国重要的现代装备制造及高技术产业基地,中部地区的高质量发展必须满足有效性,即新旧动能加速转换,资源配置效率不断提高,全要素生产率持续优化;② 作为长江经济带发展的中心区域,中部地区的高质量发展必须满足协调性,即在积极承接新兴产业转移、推动优势产业协同发展的同时,加快调整金融结构、消费结构的合理程度,推动先进制造业和现代服务业的深融合;③ 中国共产党“十九大”报告指出,创新是引领发展的第一动力,过去的资源要素驱动型经济增长模式难以为继,中部地区的高质量发展必须满足创新性,即加快创新能力建设,提高科技创新能力,营造良好创新环境,不断缩小与东部地区在关键领域的技术差距;④ 作为黄河流域生态保护和高质量发展的重要承载区及能源原材料基地,中部地区高质量发展必须满足持续性,即秉持可持续发展理念,转变经济发展方式,加强污染物治理,完善资源循环利用机制,推动形成绿色生产生活方式;⑤ 高质量发展必须满足人民美好生活需要,实现发展成果共享,中部地区的高质量发展必须满足共享性,即推进基本公共服务均等化,提高公共卫生服务、农村养老服务的保障能力,切实增进民生福祉,提高人民生活质量;⑥ 国民经济平稳运行是高质量发展的重要保障,中部地区的高质量发展必须满足稳定性,即保持经济平稳健康发展,避免经济长期波动,多角度纾解就业压力,经济运行稳定在合理区间。
2.2 中国中部地区高质量发展评价指标体系构建
表1 中国中部地区高质量发展评价指标体系
Tab. 1
| 维度 | 二级指标 | 三级指标 | 测算标准 | 单位 | 指标属性 |
|---|---|---|---|---|---|
| 有效性 | 技术效率 | 全要素生产率 | 非期望产出SBM模型 | - | 正 |
| 劳动效率 | 劳动生产率 | GDP/社会从业人员 | 元/人 | 正 | |
| 资本效率 | 资本生产率 | GDP/资本存量 | % | 正 | |
| 协调性 | 产业结构 | 产业结构优化程度 | 产业结构高级化指数 | - | 正 |
| 金融结构 | 存款率 | 存款额/GDP | % | 正 | |
| 贷款率 | 贷款额/GDP | % | 正 | ||
| 消费结构 | 消费率 | 社会消费品零售总额/GDP | % | 正 | |
| 创新性 | 创新投入 | 科技投入 | 科技支出/地方一般公共预算支出 | % | 正 |
| 教育投入 | 教育支出/地方一般公共预算支出 | % | 正 | ||
| 创新产出 | 发明专利授权比 | 发明专利授权数/专利授权总数 | % | 正 | |
| 创新环境 | 城市高校比 | 城市高校数/全国高校总数 | % | 正 | |
| 高校学生数 | 普通高等学校在校学生数/总人口 | % | 正 | ||
| 开放环境 | 外商直接投资额/GDP | % | 正 | ||
| 持续性 | 资源利用 | 单位GDP电耗 | 全社会用电量/GDP | kW·h/元 | 负 |
| 单位GDP水耗 | 全年供水量/GDP | t/元 | 负 | ||
| 环境代价 | 单位GDP废水排放量 | 工业废水排放量/GDP | t/元 | 负 | |
| 单位GDP废气排放量 | 工业二氧化硫排放量/GDP | t/万元 | 负 | ||
| 环境规制 | 环境治理水平 | 一般工业固体废物综合利用率 | % | 正 | |
| 共享性 | 人民生活 | 生活水平 | 人均GDP | 元/人 | 正 |
| 城市道路 | 人均道路面积 | m2/人 | 正 | ||
| 公共服务 | 公共交通 | 每万人拥有公交汽车数 | 辆/万人 | 正 | |
| 医疗水平 | 每万人医疗床位数 | 张/万人 | 正 | ||
| 城市绿化 | 人均公园绿地面积 | m2/万人 | 正 | ||
| 教育水平 | 每万人拥有小学教师数 | 人/万人 | 正 | ||
| 文化水平 | 每万人拥有公共图书馆藏书量 | 千册/万人 | 正 | ||
| 稳定性 | 经济波动 | 经济波动率 | |(当年GDP增长率-去年GDP增长率)/去年GDP增长率| | % | 负 |
| 就业波动 | 失业率 | 城镇登记失业率 | % | 负 |
注:全要素生产率由非期望产出的SBM模型计算得出,其中投入指标为资本存量、劳动人数、全社会用水量、全社会用电量,资本存量计算依据单豪杰[
2.3 研究方法
2.3.1 熵权法
熵权法作为一种客观赋权方法,可以有效解决嵌入准则间的内在冲突,平衡各评价准则间的关系,利用数据的离散程度客观衡量指标权重,从而得到更加准确合理的评价结果。该方法不仅避免了专家打分法的主观依赖性,具有较高的精确度和可信度,也克服了主成分分析法易受异常值干扰等局限。具体计算步骤如下:
① 根据指标属性确定处理方向,并用极差法对各个指标进行标准化处理。
式中:i为城市;j为测度指标;Yij和Xij为分别为原始与标准化后的指标值;
② 计算j指标的信息熵ej,计算公式为:
式中:pij为j指标下i城市占该指标的比重;ej为信息熵。
③ 确定指标权重,合成各维度发展指数
式中:gj为j指标权重;
2.3.2 传统Kernel密度估计
传统Kernel密度估计作为一种非参数方法,主要用于研究空间分布非均衡。该方法用连续密度曲线刻画随机变量的分布态势,从而反映变量分布的位置、形态等信息。Kernel密度函数包含三角核、四角核、高斯核和Epanechnikov核等形式,本文选择高斯核函数研究高质量发展水平的分布动态演进[30],计算公式为:
式中:f(x)为随机变量x的密度函数;N为观测值个数;xi为独立同分布的观测值;
2.3.3 空间Kernel密度估计
空间Kernel密度估计方法在传统Kernel密度估计基础上加入空间因素,可以估计样本期内随机变量发生变换的概率密度函数[31],以动态分布图像准确判断其变化规律,从而揭示城市在一段时期后的长期转移趋势。在随机估计中,本文仍选择高斯核函数进行计算,具体公式为:
式中:
2.3.4 地理探测器
式中:Q为探测力指标,取值[0,1],Q越大说明该因素对指标空间差异影响越大;N为样本个数;h (h = 1, 2, …, H)为分区;
2.4 数据来源
根据国务院《关于促进中部地区崛起的若干意见》《关于西部大开发若干政策措施的实施意见》等文件,本文选取2006—2019年中国263个城市为考察对象,东部地区81个城市,中部地区78个城市,西部地区78个城市,东北地区26个城市。对于中部地区,山西的临汾、运城,河南的济源,湖北的恩施、仙桃、潜江、天门以及湖南的湘西自治州由于数据可得性问题均被剔除。数据主要来源于2006—2020年的《中国城市统计年鉴》、各省市统计年鉴以及环亚经济数据有限公司(CEIC)全球经济数据库。对于个别年份和城市的数据缺失,本文已通过插值法补全。
3 中国中部地区高质量发展的时空格局
3.1 全国尺度下中国中部地区高质量发展的时空格局
中国中部地区与全国高质量发展指数均值的变化趋势较为一致,均呈现逐年递增态势,但在样本期内中部地区始终低于全国平均水平(图1)。中部地区传统制造产业较多、专精特新企业缺乏、创新能力偏低等问题在一定程度制约着高质量发展。中部地区高质量发展指数年均增速为2.48%,而全国年均增速为2.42%,说明在中部崛起政策背景下,中部地区正在积极探寻符合自身特色的高质量发展道路。
图1
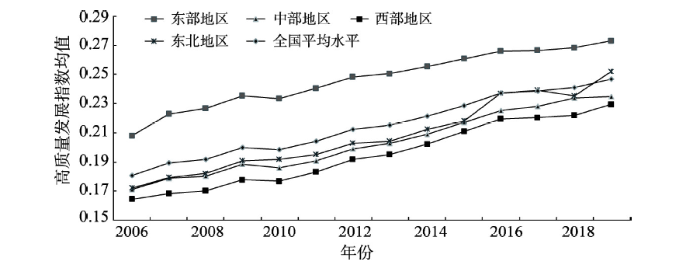
图1
2006—2019年中国及各地区高质量发展指数均值
Fig. 1
National and regional average of high-quality development index, 2006-2019
3.2 地区尺度下中国中部地区高质量发展的时空格局
在时间维度上,中国中部与东部、西部及东北地区在样本期内均呈平稳上升态势,年均增长率分别为2.48%、2.12%、2.62%、3.00%①(①东北地区高质量发展指数在2018年出现小幅下降,这是因为2018年东北地区全要素生产率、产业结构高级化指数、消费率、教育投入、发明专利等指标出现不同程度下降。)(图1)。在空间维度上,参照已有研究的分类标准[4],基于样本期内高质量发展指数均值将全国所有城市划为先进型(0.249~0.474)、平庸型(0.180~0.249)和落后型(0.136~0.180)3种类型。中部地区高质量发展水平与西部、东北地区相接近,且仅有省会和个别非省会城市跻身于先进型,多数城市处于平庸型和落后型;而东部地区整体水平明显高于其他地区,且城市集中分布在先进型和平庸型。具体来说,中部地区除武汉、太原、南昌、长沙、郑州、合肥、芜湖外,其他城市均为平庸型和落后型城市;西部和东北地区除省会城市外,仅有大连为先进型城市;而在东部地区的先进型城市中,非省会城市占比为63%,远高于其他地区。东部地区凭借地理与政策优势,其省会和非省会城市在经济社会发展上均取得巨大进步,产业实力、创新能力以及社会福利水平大幅提高;中部地区在城际经济联系、区域内合作以及差异化发展格局等方面与东部发达地区相比依然存在较大差距。此外,中部地区作为粮食生产基地和能源原材料基地,经济发展模式相对粗放,多数非省会城市存在经济结构层次较低、产业发展滞后等问题[35]。
3.3 省际及城市尺度下中国中部地区高质量发展的时空格局
省际尺度下,中部地区各省高质量发展水平均呈平稳上升态势,但具有较为明显的空间非均衡性(图2),山西、安徽处于第一梯队;江西、湖北其次;湖南、河南水平相对较低。山西作为全国第一个能源革命综合改革试点,在产业转型与升级方面取得重要进展,“一群两区三圈”发展格局推进省内互联互通;安徽凭借地理区位优势以及长三角一体化、长江经济带建设、中部地区高质量发展的叠加政策,其高质量发展水平取得明显提升;河南高质量发展水平最低但增速最快,虽然河南存在老工业基地与资源型城市转型困难、生态环境治理形势严峻、民生发展具有明显短板等问题,但近年来政府给予的政策、资金等支持有效提升全省可持续发展能力与综合竞争力;湖北高质量发展水平的增速最低,湖北省内产业层次偏低、新旧动能转换困难、创新驱动乏力等问题在一定程度上制约了高质量发展。
图2
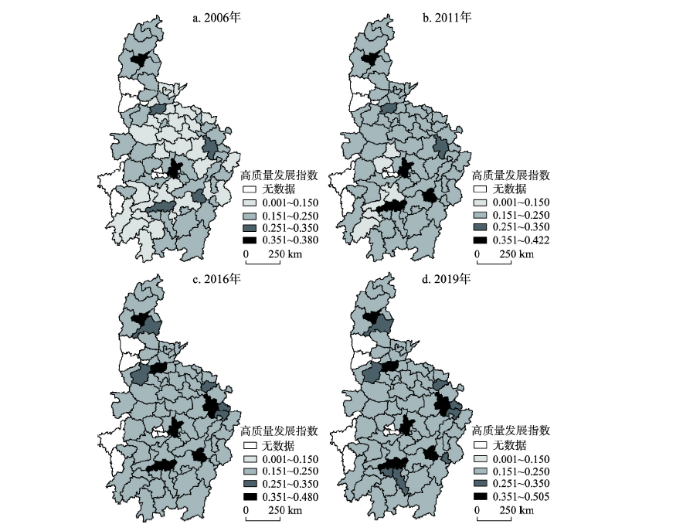
图2
2006—2019年中国中部地区高质量发展的时空格局
Fig. 2
Spatiotemporal pattern of high-quality development in Central China, 2006-2019
城市尺度下,中国中部地区各城市高质量发展水平在样本期内均有提升,省会城市明显优于非省会城市②(②武汉、太原、南昌、长沙、郑州、合肥、芜湖均位于高质量发展水平与人均GDP样本期均值的前7位;而部分高质量发展水平较低的城市诸如宿州、怀化、驻马店、周口、商丘、邵阳等,其经济发展水平也相对较低。因此,城市尺度下中国中部地区高质量发展格局与经济发展格局存在相似之处。)。安徽位于长江中下游地区,部分城市属于长三角城市群,多数城市发展水平较高,其中合肥、芜湖、马鞍山、蚌埠和铜陵排名靠前;对于山西而言,太原的高质量发展水平较高,晋中、大同、阳泉、长治、晋城和忻州较为平庸,吕梁、朔州水平最低;武汉和黄石高质量发展指数均值分别位于湖北的第1、2位,但在中部地区分别位于第1、17位,说明湖北内部空间非均衡性较为明显;江西和河南的总体水平得到较大提升,但仍存在较多水平偏低的城市;湖南多数城市处于中等偏下水平,其中衡阳、永州、常德、怀化、娄底、岳阳、益阳和昭阳均为落后型城市,占湖南城市数量的62%。可见,中国中部地区高质量发展存在较为明显的空间异质性,一方面,大多省会城市对人才、科技、金融资源等要素的集聚效应明显,但对非省会城市的辐射作用有限;另一方面,非省会城市较多属于资源型城市且仍处于转型阶段,环境污染、资源枯竭、发展动力不足等问题难以解决[12],导致其高质量发展水平与省会城市存在较大差距。
4 中国中部地区高质量发展的动态演进
4.1 中国中部地区高质量发展的分布动态演进
从分布位置来看(图3),区域整体的高质量发展水平呈右移态势,幅度相对较小。各省基本保持右移态势,但幅度各有不同,其中湖北和山西右移幅度较小。而安徽、河南右移幅度较大,说明这些省份的高质量发展水平提升明显,这与前文省际视角下各省变化趋势的分析基本一致。近些年来安徽、河南逐步走出适合自身特色的高质量发展道路。安徽正逐步融入长三角一体化,科技创新实现跨越式发展,科技成果转化、新兴产业发展速度不断加快;河南依靠其工业基础和区位优势,在传统产业提质转型基础上重点发展新兴产业,积极推进沿黄生态廊道建设,高质量发展水平得到显著提升。
图3
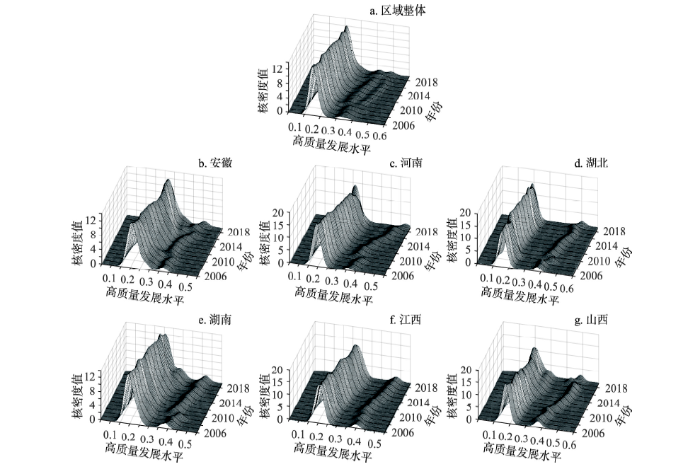
图3
中国中部地区高质量发展分布的传统Kernel密度图
Fig. 3
Traditional kernel density of high-quality development distribution in Central China
从极化特征来看(图3),区域整体的高质量发展分布由一个主峰和两个侧峰构成,存在多极分化趋势。安徽、河南、湖北和江西的高质量发展分布基本一致,均由一个主峰和一个侧峰构成,呈现出两极分化态势,其中安徽两峰分布较为紧密,极化趋势较弱;湖南和山西在2017年前存在两极分化趋势,而在2017年后基本呈多极分化态势。值得注意的是,安徽、湖南和江西的主峰与侧峰的移动方向较为一致,而河南与湖北的侧峰右移幅度大于主峰,这意味着河南、湖北省内的极化现象存在加剧趋势。
4.2 中国中部地区高质量发展的长期转移趋势
传统Kernel密度估计描述了区域整体及各省的演变态势,而空间Kernel密度估计可以反映城市在不同发展水平下的转移状况。其中,无条件Kernel密度考察的是不考虑邻域影响下本城市的转移趋势;空间条件动态Kernel密度则考察城市间的空间交互影响和溢出效应。根据中部地区高质量发展水平分布特征,将本城市与相邻城市划分为3种类型:本城市或相邻城市与中部地区最高水平城市之比低于25%的城市属于低水平,在25%~75%的城市为中间水平,大于75%的城市属于高水平。
4.2.1 无条件Kernel密度估计
图4
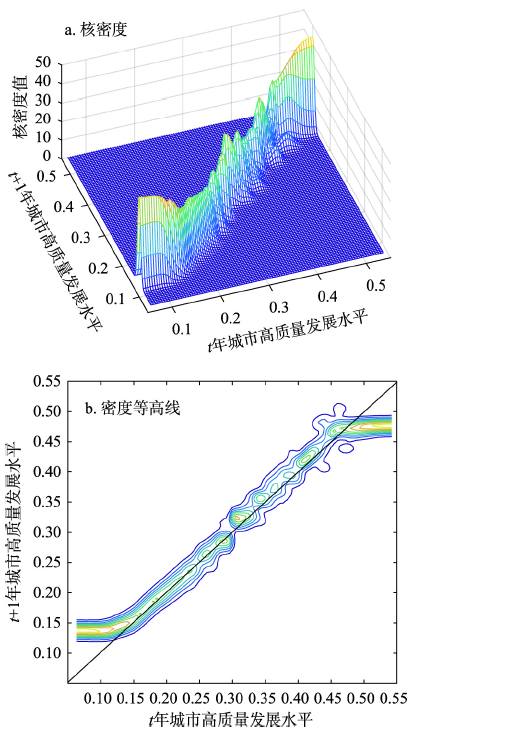
图4
中国中部地区高质量发展的无条件Kernel密度及密度等高线
Fig. 4
Unconditional kernel density and density contours for high-quality development in Central China
表2 中国中部地区高质量发展的长期转移特征
Tab. 2
| 无条件核密度 | 空间条件动态核密度 | ||||||||
|---|---|---|---|---|---|---|---|---|---|
| 低水平 | 中间水平 | 高水平 | 总体特征 | 相邻低水平 | 相邻中间水平 | 相邻高水平 | 总体特征 | ||
| 区域整体 | 向上转移 | 低流动性 | 向下转移 | 俱乐部趋同 | 无明显变化 | 向上转移 | 向上转移 | 正向溢出 | |
| 安徽 | 向上转移 | 低流动性 | 向下转移 | 俱乐部趋同 | 无明显变化 | 向上转移 | 向上转移 | 正向溢出 | |
| 河南 | 向上转移 | 低流动性 | 向上转移 | 向上转移 | 无明显变化 | 向上转移 | 向上转移 | 正向溢出 | |
| 湖北 | 向上转移 | 低流动性 | 向下转移 | 俱乐部趋同 | 无明显变化 | 无明显变化 | 无明显变化 | 无显著影响 | |
| 湖南 | 向上转移 | 低流动性 | 向下转移 | 俱乐部趋同 | 无明显变化 | 向上转移 | 向上转移 | 正向溢出 | |
| 江西 | 向上转移 | 低流动性 | 向下转移 | 俱乐部趋同 | 无明显变化 | 向上转移 | 向上转移 | 正向溢出 | |
| 山西 | 向上转移 | 低流动性 | 向下转移 | 俱乐部趋同 | 无明显变化 | 无明显变化 | 无明显变化 | 无显著影响 | |
4.2.2 空间条件动态Kernel密度估计
总体来看,区域整体呈现正向的空间溢出效应(图5)。当相邻城市t年为低水平城市时,条件概率主体大致与X轴保持平行,说明此时不存在明显空间效应;当相邻城市t年为中间水平城市时,概率主体向正45°对角线偏移,说明其高质量发展表现为正向空间溢出效应;当相邻城市t年为高水平城市时,相邻城市对本城市存在正向溢出但溢出程度相对偏低。中高水平城市之所以存在正向溢出,是因为随着中部崛起战略的实施,区域内城市跨界投资、产业协同、资源共享程度逐步加深,中高水平城市在统筹承接东部转移产业过程中向低水平城市输送技术、人才等资源要素;而欠发达城市利用便利的城际交通网络提高自身产业承接能力,进而强化中高水平城市的正向溢出效应。
图5
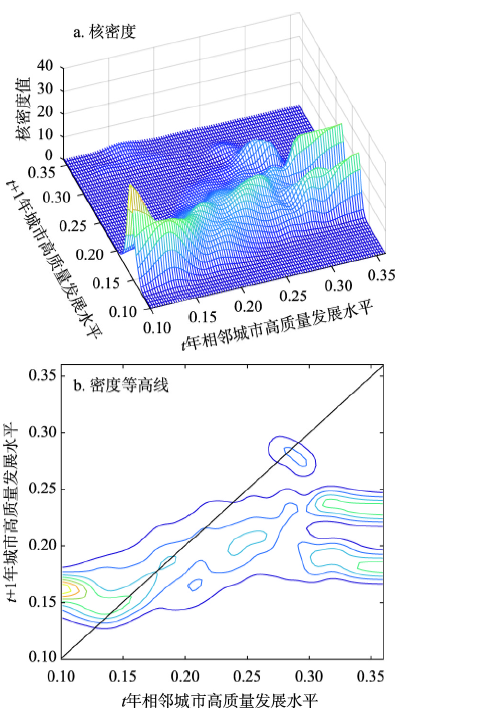
图5
中国中部地区高质量发展的空间条件动态Kernel密度及密度等高线
Fig. 5
Spatial dynamic kernel density and density contours of high-quality development in Central China
安徽、河南、湖南和江西与区域整体的高质量发展空间条件动态Kernel密度特征基本一致(表2),中高水平相邻城市都表现出明显的正向溢出,原因与区域整体基本相似;而湖北和山西的概率主体均平行于X轴,说明两省城市间的空间溢出效应较弱。湖北内部城市间可能存在要素资源、产业经济、投资资金与市场化水平不相匹配等问题,无法有效承接其他城市的功能转移,导致空间无明显溢出效应。而山西长期以来都是能源密集型大省,生产技术、基础设备以及人力资本在省内流转有利于经济效率正向溢出,但这种溢出也伴随着环境治理、基础设施建设与维护的费用支出以及制造业和能源产业高能耗、高污染的负向溢出,从而表现为空间溢出效应不明显。
5 中国中部地区高质量发展格局及演进的形成机理
该部分基于有效性、协调性、创新性、持续性、共享性和稳定性六大维度,从结构视角对中国中部地区高质量发展时空格局、分布动态演进以及长期转移趋势进行解释。
5.1 中国中部地区高质量发展格局的形成机理
就中部地区与全国均值比较而言,共享性发展差异的影响系数最大,为0.919;持续性、协调性、稳定性和创新性发展差异也均存在较大影响(表3)。因此,缩小中部地区与全国平均水平间的差距应从民生发展、生态环境、经济结构、社会稳定以及科技创新等方面入手。
表3 多级空间尺度下中国中部地区高质量发展差异的地理探测结果
Tab. 3
| 有效性 | 协调性 | 创新性 | 持续性 | 共享性 | 稳定性 | ||
|---|---|---|---|---|---|---|---|
| 全国尺度 | 全国与中部地区差异 | 0.009 | 0.906*** | 0.826*** | 0.913*** | 0.919*** | 0.891*** |
| 地区尺度 | 四大地区间差异 | 0.410*** | 0.817*** | 0.579*** | 0.828*** | 0.803*** | 0.628*** |
| 省际尺度 | 区域内省际差异 | 0.256*** | 0.810*** | 0.440*** | 0.442*** | 0.795*** | 0.552*** |
| 城市尺度 | 区域内城市差异 | 0.008* | 0.492*** | 0.565*** | 0.117*** | 0.384*** | 0.035*** |
| 安徽城市差异 | 0.044* | 0.513*** | 0.724*** | 0.224*** | 0.480*** | 0.016 | |
| 河南城市差异 | 0.022 | 0.553*** | 0.540*** | 0.170*** | 0.340*** | 0.072*** | |
| 湖北城市差异 | 0.090*** | 0.472*** | 0.400*** | 0.055* | 0.305*** | 0.094*** | |
| 湖南城市差异 | 0.063** | 0.534*** | 0.620*** | 0.232*** | 0.518*** | 0.197*** | |
| 江西城市差异 | 0.120*** | 0.547*** | 0.597*** | 0.261*** | 0.265*** | 0.082** | |
| 山西城市差异 | 0.046 | 0.605*** | 0.652*** | 0.169*** | 0.586*** | 0.160*** |
注:*、**、***分别表示在10%、5%、1%水平下显著。
就地区尺度而言,持续性发展差异为地区间高质量发展差异的主要因素,而协调性和共享性发展差异为次要因素。可持续发展能力强、经济结构协调、民生共建共享水平高的先进地区,资源利用效率相对较高,产业结构、金融结构以及消费结构一般更加协调,人民生活质量较高,从而吸引更多人才、技术以及资源要素流入,进而促进高质量发展水平提升;反之亦然,其结果是生态建设、经济结构以及民生发展差异对地区间高质量发展差异产生较大影响。
就区域内部省际尺度而言,协调性发展差异成为中部地区省际差异的主要影响因素。这是因为中部地区各省在经济结构调整过程中,产业结构转型、金融结构优化以及消费结构升级的具体措施不尽相同,产业竞争力、资本流动性以及市场活力方面存在差异,较大程度影响了中部地区省际时空格局。就城市尺度而言,创新性发展差异对城市间高质量发展空间差异的影响最大,原因在于城市间的创新差异会对不同城市企业的生产方式、经营管理模式、产品研发以及产品服务质量等产生巨大影响,城际创新水平与创新能力不同不仅决定城市综合竞争力的差别,还会影响其高质量发展进程。对于各省,除创新性外,协调性发展差异也是城市高质量发展差异的主要成因,这是因为经济结构包含的产业结构、贸易结构和消费结构等都会对省内城市的经济效益与经济质量产生影响,随着现代制造业和服务业等高附加值产业的差异化发展日益明显,产业结构优化升级的差异对省内城市间高质量发展的影响也越来越大。
5.2 中国中部地区高质量发展分布动态演进的形成机理
从分布位置来看,区域整体协调性、创新性、持续性和共享性发展水平均向右移动(表4),这与区域整体高质量发展的演进特征相一致。各省各维度发展的分布位置特征与各省高质量发展基本一致,且各省与区域整体高质量发展演进特征的形成机理相同。具体而言,创新性、持续性和稳定性发展右移幅度较小,而协调性和共享性发展右移幅度较大,对区域整体及各省高质量发展向右移动具有决定作用,因此协调性和共享性发展是中部地区高质量发展的重要动力。一方面,中部地区经济结构协调进程正在持续加快,合理的生产力空间布局与有效的产业分工体系正逐渐形成,有利于加快承接地经济发展与产业优化升级[37],推动高质量发展;另一方面,中部地区仍属欠发达地区,经济社会发展相对滞后,而民生福祉提升的动态过程是社会综合发展状态向高水平升级的跃迁过程,能够极大提升中部地区人们的物质生活条件,满足基本需求并实现人的全面发展,进而提升高质量发展水平。
表4 结构视角下中国中部地区高质量发展的分布动态特征
Tab. 4
| 高质量发展 | 有效性 | 协调性 | 创新性 | 持续性 | 共享性 | 稳定性 | |
|---|---|---|---|---|---|---|---|
| 区域整体 | 向右移动 多极分化 | 向左移动 多极分化 | 向右移动 多极分化 | 向右移动 多极分化 | 向右移动 无极化 | 向右移动 多极分化 | 无明显移动 无极化 |
| 安徽 | 向右移动 多极分化 | 向左移动 多极分化 | 向右移动 多极分化 | 向右移动 多极分化 | 向右移动 无极化 | 向右移动 多极分化 | 无明显移动 无极化 |
| 河南 | 向右移动 两极分化 | 向左移动 多极分化 | 向右移动 两极分化 | 向右移动 两极分化 | 向右移动 无极化 | 向右移动 多极分化 | 无明显移动 无极化 |
| 湖北 | 向右移动 两极分化 | 向左移动 多极分化 | 向右移动 多极分化 | 向右移动 两极分化 | 向右移动 无极化 | 向右移动 多极分化 | 向右移动 无极化 |
| 湖南 | 向右移动 多极分化 | 向左移动 多极分化 | 向右移动 两极分化 | 向右移动 多极分化 | 向右移动 无极化 | 向右移动 多极分化 | 向右移动 多极分化 |
| 江西 | 向右移动 两极分化 | 向左移动 多极分化 | 向右移动 两极分化 | 向右移动 多极分化 | 向右移动 无极化 | 向右移动 多极分化 | 无明显移动 无极化 |
| 山西 | 向右移动 多极分化 | 向左移动 多极分化 | 向右移动 多极分化 | 向右移动 多极分化 | 向右移动 无极化 | 向右移动 多极分化 | 无明显移动 无极化 |
从极化特征来看,有效性、协调性和创新性发展呈多极分化趋势,这与中部地区高质量发展极化特征相一致,这意味着区域整体高质量发展主要受有效性、协调性和创新性发展的多极分化影响。就各省而言,协调性和创新性发展的两极分化对河南、湖北和江西影响较大;而安徽、湖南和山西的多极分化由有效性、协调性、创新性、共享性和稳定性发展的极化特征共同影响造成。中部地区城际市场化进程差异较大,较发达城市的产品与要素市场相对自由,产权制度较为完善,而欠发达城市的现代化交通基础设施体系尚未形成,资源配置效率与企业生产效率有待提升,导致中部地区城市高质量发展呈极化趋势;多数非省会城市仍以重工业为主且产业趋同现象严重,不利于高质量协调发展;各省会城市不断加大科技创新投入力度,汇集省内优秀的科技创新资源,具有较好的科技金融与创新孵化环境且可以集聚更多科技创新产出,进一步扩大了高质量发展的极化效应。对于湖北,武汉在科技创新和结构协调方面远超其他城市,对非省会城市表现出“虹吸”影响,此外在武汉获批国家知识产权强市创建市、国家首个科技金融改革创新试验区后,湖北进一步加强了对武汉的资源投入,这在一定程度上解释了湖北内部的极化现象。对于河南,郑州经济实力较强、产业基础雄厚、高新技术集中,而欠发达城市在吸引人才、资本、高新技术等要素上处于劣势地位,高质量发展受到制约,造成河南省内高质量发展两极分化现象愈加严重。
5.3 中国中部地区高质量发展长期转移趋势的形成机理
无条件Kernel密度估计结果表明,区域整体有效性、协调性、创新性、持续性和共享性发展均表现为“低水平城市向上转移、中间水平城市流动性较低、高水平城市向下转移”,总体呈现出“俱乐部趋同”的转移分布特征(表5),这与其高质量发展指数的转移特征基本一致。而各省则表现出明显的空间异质性,安徽的协调性、创新性和共享性发展均表现为“俱乐部趋同”,是其高质量发展长期趋势的主要成因;河南高质量发展的总体“向上转移”趋势主要由协调性与稳定性发展的转移特征决定;湖北和山西高质量发展的转移分布主要受协调性、创新性、持续性和共享性发展共同作用;湖南、江西的高质量发展长期趋势主要取决于创新性与持续性发展的转移特征。
表5 结构视角下中国中部地区高质量发展的长期转移特征
Tab. 5
| 有效性 | 协调性 | 创新性 | 持续性 | 共享性 | 稳定性 | |
|---|---|---|---|---|---|---|
| 区域整体 | 俱乐部趋同 | 俱乐部趋同 | 俱乐部趋同 | 俱乐部趋同 | 俱乐部趋同 | 呈现收敛态势 |
| 无显著空间溢出 | 正向空间溢出 | 无显著空间溢出 | 正向空间溢出 | 正向空间溢出 | 无显著空间溢出 | |
| 安徽 | 呈现收敛态势 | 俱乐部趋同 | 俱乐部趋同 | 呈现收敛态势 | 俱乐部趋同 | 呈现收敛态势 |
| 无显著空间溢出 | 正向空间溢出 | 正向空间溢出 | 无显著空间溢出 | 正向空间溢出 | 无显著空间溢出 | |
| 河南 | 俱乐部趋同 | 俱乐部趋同 | 俱乐部趋同 | 向上转移 | 俱乐部趋同 | 向上转移 |
| 无显著空间溢出 | 正向空间溢出 | 无显著空间溢出 | 正向空间溢出 | 正向空间溢出 | 正向空间溢出 | |
| 湖北 | 俱乐部趋同 | 俱乐部趋同 | 俱乐部趋同 | 俱乐部趋同 | 俱乐部趋同 | 呈现收敛态势 |
| 正向空间溢出 | 正向空间溢出 | 无显著空间溢出 | 正向空间溢出 | 正向空间溢出 | 正向空间溢出 | |
| 湖南 | 俱乐部趋同 | 呈现收敛态势 | 俱乐部趋同 | 俱乐部趋同 | 呈现收敛态势 | 呈现收敛态势 |
| 无显著空间溢出 | 无显著空间溢出 | 无显著空间溢出 | 正向空间溢出 | 正向空间溢出 | 正向空间溢出 | |
| 江西 | 呈现收敛态势 | 俱乐部趋同 | 俱乐部趋同 | 俱乐部趋同 | 呈现收敛态势 | 呈现收敛态势 |
| 负向空间溢出 | 正向空间溢出 | 无显著空间溢出 | 正向空间溢出 | 正向空间溢出 | 无显著空间溢出 | |
| 山西 | 呈现收敛态势 | 俱乐部趋同 | 俱乐部趋同 | 俱乐部趋同 | 俱乐部趋同 | 呈现收敛态势 |
| 正向空间溢出 | 正向空间溢出 | 无显著空间溢出 | 正向空间溢出 | 正向空间溢出 | 无显著空间溢出 |
注:若转移分布概率主体集中于Y轴某一刻度附近且几乎平行于X轴,此时高质量发展呈现收敛态势[
空间条件动态Kernel密度估计结果表明,区域整体的协调性、持续性和共享性发展正向溢出较强,其相邻中高水平城市对本城市高质量发展具有促进作用,是区域整体高质量发展转移的主要驱动因素。① 中高水平城市承接东部地区产业转移后,依靠管理、技术、金融等要素逐渐向周边低水平城市溢出[38],承接地获得更先进的管理能力、更高的技术水平以及资金支持,从而提高发展质量与水平。② 生态环境保护具有公共物品属性,中高水平城市生态环境改善可提升周边城市的生态质量。此外,中高水平城市为提升政绩水平也会积极寻求与周边可持续发展能力较高的城市合作[39],强化生态协同发展的正向空间溢出,从而增强高质量发展的空间溢出效应。③ 中高水平城市基础设施的完善与优化能够辐射带动周边城市综合发展功能增强、互联互通水平提升,较高的社会福利与保障水平也能为其他城市提供借鉴,实现高质量发展的正向溢出和区域性共建共享。对于各省而言,安徽的协调性、创新性和共享性发展均表现为正向空间溢出,对高质量发展长期转移趋势影响较大。由于安徽地处长江三角洲腹地且创新要素具有较高流动性,外围城市通过学习模仿机制能快速获取核心城市的知识技术,产生创新溢出与知识扩散[40],进而提升全省高质量发展协同水平。河南高质量发展的转移特征主要源于协调性、持续性和共享性发展,与区域整体高质量发展空间溢出特征基本一致。湖北与山西的创新性发展表现为无明显空间溢出,由于中心城市与多数欠发达地区创新关联程度不高,科技创新发展的涓滴效应小于极化效应,而欠发达城市间往往相互联系并产生集聚效应,导致省内创新发展与高质量发展无明显溢出。湖南持续性发展存在正向空间溢出效应,是高质量发展空间溢出效应的主要成因,近年来在湘江、长江保护以及洞庭湖流域生态环境修复方面取得重大进展,城际协作增强,城市可持续发展能力有序提升,对城市高质量发展正向溢出具有重要贡献。江西高质量发展的正向空间溢出特征主要受协调性和持续性发展影响,作为内陆省份,江西利用长江沿江优势打造现代立体交通网络,极大促进城际产业分工与生态合作,进而推动城际高质量发展的正向空间溢出。
6 结论与讨论
本文基于中国中部地区高质量发展评价指标体系,在多级空间尺度下考察2006—2019年中部地区高质量发展的时空格局,并借助传统和空间Kernel密度估计方法对分布动态演进和长期趋势展开分析,从结构视角探究其形成机理。主要研究结论为:① 中国中部地区高质量发展水平低于全国均值但增速较快;与东部地区差距明显,与西部、东北地区接近;中部地区呈现“省会城市优于非省会城市”的分布格局。中部地区与外部差异主要源于经济结构、生态环境与民生发展差异,而内部差异来自协调与创新差异。② 中国中部地区高质量发展总体向好但存在空间极化趋势,其中河南、湖北两极分化现象相对突出。结构优化、民生发展是中部地区高质量发展的主要动力,各省极化特征的形成机理各不相同,其中河南、湖北的两极分化趋势主要由结构协调与科技创新的极化特征决定。③ 中国中部地区高质量发展普遍具有“俱乐部趋同”特征;区域整体及多数省份中高水平邻域城市的正向溢出效应显著,而湖北、山西的空间溢出效应均不明显。产业要素溢出、生态合作发展与民生共建共享是区域整体高质量发展转移的主要驱动因素,而各省份转移的形成机理存在明显的空间异质性。
以上结论对协同推进中国中部地区高质量发展具有重要的政策启示:① 持续增强发展动力,有效提升高质量发展水平。以比较优势为基础,统筹新兴产业发展,深入推进产业结构高级化与产业链供应链现代化;强化民生发展,推进现代化基础设施体系、现代流通体系建设,为居民生活与公共服务高质量发展提供保障。② 合理优化空间布局,缩小高质量发展地区差距。增强资源整合能力与公共服务质量,搭建高质量、高水平的资源共享平台,巩固脱贫攻坚成果并深化乡村振兴战略;坚持绿色发展,构筑生态安全屏障,加强生态合作共治并向东部先进地区看齐,形成绿色生产生活方式;建立健全省际城际协同合作机制,加快跨区融合发展,联合区域创新资源,构建中部地区协同创新共同体。③ 准确把握演进特征,弱化高质量发展极化趋势。积极发挥政府引导、规划与引领作用,鼓励人才、技术、资本等资源要素向中小城市倾斜,在适当控制大城市发展规模的同时兼顾中小城市持续发展,防止极化效应扩大。④ 强化城市正向溢出,持续推进高质量平衡发展。推动基本公共服务均等化发展,构建“主溢出中心—次溢出中心—重要节点城市”多核心、多辐射的民生共享扁平网络,扩大基本公共服务的空间扩散;综合分析承载地的生态、资源以及社会承载能力,低水平城市应选择性承接适宜产业转移,坚持走可持续发展之路,积极引进新兴产业转移以吸收技术溢出,确保产业链条与产业体系完整。
中国特色区域高质量发展是新时代地理学与经济学研究的重要内容,是经济—社会—文化融合发展的综合性学术议题,也是中国特色社会主义现代化道路的理论探索与实践。从基本逻辑看,中国特色区域高质量发展本质上是解决区域发展“不平衡不充分”与“美好生活需要”之间的矛盾,实现各地区高质、高效、公平、可持续的发展。从科学内涵看,中国特色区域高质量发展不只是经济层面的区域发展问题,还包括人们对生活质量、主观幸福等物质与精神的共同追求,以及不同地区对高质量经济社会活动有差别的认知实践。基于经济地理学视角研究中国特色区域高质量发展需要解决以下两个关键问题:① 考察区域高质量发展的时空特征及其对应关系,以揭示区域发展格局与演进规律;② 多尺度、多维度阐明区域高质量发展时空格局及动态演进的形成机理,以探寻区域高质量发展提升路径。中部地区高质量发展不仅是中部崛起战略的全面升级,也是国家区域协调高质量发展的重要支撑。以中部地区作为区域协调发展新增长中心地带,协同推动西部大开发、东北再振兴、东部现代化,在高质量发展过程中满足各地区人民日益增长的多样化需求,贯彻落实区域协调发展战略。推动生产效率提升,优化经济结构,坚持创新驱动发展,注重生态可持续,促进民生共建共享,保障经济稳定运行既是中部地区高质量发展的深刻内涵,也为其他地区高质量发展研究提供借鉴与参考。在当前和今后相当长的一段时期,中国特色区域高质量发展都是经济地理学研究的焦点,如何将国家战略蓝图与特定区域高质量发展路径规划恰当结合,为国家重大方针政策提供理论支撑,将成为学界关注的热点问题。
关联数据信息:本文关联实体数据集已在《全球变化数据仓储电子杂志(中英文)》出版,获取地址:
参考文献
Study on the "high-quality development" economics
关于“高质量发展”的经济学研究
The criteria, determinants and ways to achieve high quality development in China in the new era
新时代中国高质量发展的判断标准、决定因素与实现途径
The goals and strategy path of high-quality development
高质量发展的目标要求和战略路径
Study on the measurement of economic high-quality development level in China in the new era
新时代中国经济高质量发展水平的测度研究
Study of evaluating high-quality economic development in Chinese regions
中国区域经济高质量发展评价指标体系及测度研究
Measurement and analysis of high-quality economic development of China's cities at prefecture level and above
全国地级以上城市经济高质量发展测度与分析
Spatial-temporal evolution and regional disparity of economic high-quality development in the Yangtze River Economic Belt
长江经济带经济高质量发展的时空演变与区域差距
High-quality development level and its spatiotemporal changes in the Yellow River Basin
DOI:10.18402/resci.2020.01.12
[本文引用: 1]

To promote the high-quality development of the Yellow River Basin, it is necessary to construct an evaluation index system for a scientific assessment of such development. Based on the two areas of economic and social development and ecological security, and considering five dimensions of economic development, innovation, improvement of people’s livelihood, environmental conditions, and ecological conditions, this study constructed a high-quality development evaluation index system for the Yellow River Basin. Using the data of nine provinces (autonomous regions) in the Yellow River Basin during 2008-2017, the entropy weight method was used in calculation. The results are as follows: The high-quality development level of the Yellow River Basin basically showed the spatial distribution of “high on both sides and low in the central area,” but the gap was decreasing year by year; The high-quality development level in each province (autonomous region) remained stable in 2008-2010, and continued to grow in 2011-2017, with a high growth rate in 2016; The overall high-quality development level of the basin showed an upward trend, with small fluctuations during 2008-2010 and a significantly increase from 2011. Over the last decade, all five dimensions improved. Accordingly, the study put forward specific suggestions and the directions for further research: (1) Strengthen regional linkages and expand the overall opening-up level of the Yellow River Basin. (2) On the basis of protecting the ecological environment, the provinces (autonomous regions) in western China should develop characteristic industries, combining with their factor endowments. (3) Shandong and Henan Provinces should strengthen the protection of the ecological environment while developing the economy. Shanxi and Gansu Provinces should improve people’s living standards urgently. Qinghai Province and Inner Mongolia Autonomous Region need to increase investments in innovation and improve innovation capacity. Finally,the study proposed the further research directions.
黄河流域高质量发展水平测度及其时空演变
DOI:10.18402/resci.2020.01.12
[本文引用: 1]
推动黄河流域高质量发展,有必要构建黄河流域高质量发展评价指标体系以对黄河流域高质量发展水平进行科学测度。本文从经济社会发展和生态安全两大方面,包含经济发展、创新驱动、民生改善、环境状况和生态状况5个维度,构建了黄河流域高质量发展评价指标体系,并基于黄河流域9省区2008—2017年的数据,运用熵权法进行了测度。结果表明:黄河流域高质量发展水平基本呈现“两边高、中间低”的空间分布,但差距逐年变小;各省区高质量发展水平在2008—2010年基本保持平稳,2011—2017年持续增长,且在2016年增速明显;黄河流域整体高质量发展水平呈现上升趋势,在2008—2010年小幅波动,2011年起上升明显;10年间5个维度均有不同程度的改善。据此,本文对提升黄河流域高质量发展水平给出了具体建议:①借助政策红利叠加效应,进一步加强区域联动,扩大黄河流域整体对外开放水平。②西部各省区在重点保护生态环境的基础上,结合要素禀赋,发展特色产业。③山东省和河南省在发展经济的同时,要加大对生态环境的保护力度;山西省和甘肃省民生改善工作亟待加强;青海省和内蒙古自治区要加大创新投入力度,提高创新能力。
Evaluation and spatial differentiation of high-quality development in Northeast China
DOI:10.13249/j.cnki.sgs.2020.11.004
[本文引用: 1]
High-quality development is the basic feature of China’s economy and society in the new era, and is the only way for the development of Northeast China under the new normal. Based on the specific connotation of high-quality development and the regional characteristics of Northeast China, we constructed an index system of 34 specific indicators form six dimensions: Effectiveness, stability, coordination, innovation, sustainability and sharing. Then we measured the high-quality development status, explored their spatial differences and shortcomings of development in various regions, and finally put forward the promotion path for different types of regions. In this article, we found that the level of high-quality development in Northeast China is lower than the national average, and only seven cities are above the average, they are Dalian, Shenyang, Changchun, Harbin, Daqing, Panjin and Benxi. On the whole, the effectiveness and stability of economic development in Northeast China are good, but the coordination, innovation and sharing are poor. Specifically, the shortcomings of development mainly include the proportion of the tertiary industry, the degree of dependence on foreign trade, the proportion of research and development investment in GDP, the number of patent grants per 10 000 people, and the growth rate of urban and rural residents' income. Therefore, the key to promote high-quality development in the future is to develop the tertiary industry and foreign trade, increase R & D investment, encourage invention patents, and increase the income of urban and rural residents. The high-quality development level of sub-provincial cities such as Dalian, Shenyang, Changchun, and Harbin are in the forefront. The overall pattern of high-quality development is ‘high in the south and low in the north’ and ‘uplift belt’ is formed along the Harbin-Dalian Railway. Cities with higher levels of coordination and sustainability are concentrated in central and southern Liaoning and Harbin-Changsha economic zone; Cities with high effectiveness and innovation level are mainly distributed along the Harbin-Dalian traffic corridor, while cities with high stability and sharing level are mainly distributed in the western and central parts of Northeast China. According to the score value of each dimension, all cities can be divided into seven types, and each type has different development shortcomings and upgrade path. For example, Dalian and Shenyang should improve the stability and sustainability, while Chaoyang, Suihua, Liaoyuan, Songyuan and Mudanjiang should improve the innovation and sharing. This research can help to enrich the theoretical research of high-quality development evaluation and provide reference for the high-quality development of Northeast China and other regions.
东北地区高质量发展评价及其空间特征
DOI:10.13249/j.cnki.sgs.2020.11.004
[本文引用: 1]
从高质量发展的内涵出发,结合东北地区的区域特色,构建有效性、稳定性、协调性、创新性、持续性和分享性6个维度的34项具体指标,测度其发展现状及空间差异。研究发现:大连市、沈阳市、长春市、哈尔滨市等副省级市的高质量发展水平位居前列;高质量发展整体呈“南高北低”且沿哈大线形成“隆起带”的基本格局;协调性和持续性水平较高的地市集聚于辽中南和哈长经济区,有效性和创新性水平较高的地市主要分布于哈大交通走廊沿线,稳定性和分享性水平高的地市则主要分布于东北地区西部和中部;将各地市划分为7种类型,对应不同的发展短板和提升重点。
Measurement of high-quality development level in Sichuan-Chongqing economic circle and its spatio-temporal convergence
成渝地区双城经济圈高质量发展水平测度及其时空收敛性
Paths of high-quality development in China's coastal areas
DOI:10.11821/dlxb202102003
[本文引用: 2]
High-quality development is the key measure to overcome the middle-income trap and join the advanced economy. With the deepening of reform and opening up, coastal areas have increasingly become the ballast of the economic growth, the center of national manufacturing, the frontier zone for building an innovative country, the pacesetter for constructing an open economy, and the demonstration window for green development. With typical characteristics of high-quality development, coastal areas will effectively drive the hinterland areas to the right track of high-quality development in order to form a strong support for the country's high-quality development, shaping a new pattern of coordinated regional development. According to the status quo and characteristics of high-quality development in coastal areas, this paper focuses on exploring outstanding problems of coastal areas as a whole and the northern, central and southern coastal areas in the process of high-quality development from five aspects of economic growth, industrial strength, innovation ability, opening up and green development. By analyzing realistic reasons for these problems, valuable references for the design of targeted high-quality development paths are designed. In the new era, coastal areas should grasp the historical opportunity of Beijing-Tianjin-Hebei coordinated development, Yangtze river delta integration, Guangdong-Hong Kong-Macao Greater Bay Area construction, follow to improve industry core competitiveness, mobilize the vitality of innovation, build high-standard open economy, deepen ecological conservation by combining strategies of industrial upgrading, independent innovation, opening up and ecological civilization. By the method of working in concert to promote high-quality development in the northern, central and southern coastal areas, the leading role of coastal areas can be consolidated.
中国沿海地区高质量发展的路径
DOI:10.11821/dlxb202102003
[本文引用: 2]
高质量发展是跨越中等收入陷阱、跻身发达经济体的关键举措。随着改革开放的深入,沿海地区正日益成为经济增长的压舱石、国家制造业中心、打造创新型国家的前沿地带、开放型经济建设的排头兵、绿色发展的示范窗口,具备高质量发展的典型特征,将有效带动内陆地区步入高质量发展的正轨,形成对整个国家高质量发展的有力支撑,塑造区域协调发展新格局。结合沿海地区高质量发展的现状与特征,本文从经济增长、产业实力、创新能力、对外开放、绿色发展五方面入手,重点探究沿海地区整体以及沿海北部、中部、南部地区在高质量发展进程中的突出问题,分析其背后的现实原因,为设计具有针对性的高质量发展路径提供价值参考。新时代背景下,沿海地区高质量发展需把握京津冀协同发展、长三角一体化、粤港澳大湾区建设的历史性机遇,产业升级战略、自主创新战略、对外开放战略、生态文明战略并济,遵循提升产业核心竞争力、激发创新活力、发展高水平开放型经济、深化生态文明建设等路径,协同推进沿海北部、中部、南部地区高质量发展,巩固沿海地区的引领地位。
Comprehensive evaluation and impact mechanism of high-quality development of China's resource-based cities
DOI:10.11821/dlxb202110011
[本文引用: 2]
Promoting the transformation, upgrading, and high-quality development of resource-based cities is a key point to achieve high-quality development in China. The comprehensive evaluation of the high-quality development of resource-based cities and the analysis of its influence mechanism can not only enrich the relevant theoretical research, but also have important practical significance. Based on Marxist political economy, this paper reviews and analyzes the theoretical framework of high-quality development in the new era, and systematically constructs the index system of high-quality development of resource-based cities. On this basis, the high-quality development level of 117 resource-based cities is comprehensively estimated, and its influence mechanism is analyzed. The results show the following. (1) From 2005 to 2017, the high-quality development level of resource-based cities continued to grow, showing a significant spatial distribution pattern of "relatively high in the east, but relatively low in the west and northeast". (2) The cities with higher and lower high-quality development levels have obvious regional agglomeration characteristics, but the local imbalance of high-quality development level intensifies, and the phenomenon of spatial polarization continues to expand. (3) The high-quality development level of cities in different growth stages is quite different. Among them, the high-quality development level of regenerative cities is the highest, while that of declining cities is the lowest. (4) The distance between resource-based cities and provincial capital cities or municipalities directly under the central government, natural factors (such as location, and altitude of cities), and the open time of cities have an important impact on the high-quality development level of resource-based cities.
中国资源型城市高质量发展综合评估及影响机理
DOI:10.11821/dlxb202110011
[本文引用: 2]
促进资源型城市转型升级与高质量发展,是中国全面实现高质量发展的难点和重点。对资源型城市高质量发展水平进行综合评估并分析其影响机理既能丰富相关理论研究,也具有重要的实践意义。基于马克思主义政治经济学,梳理和分析了新时代高质量发展的理论框架,系统构建了资源型城市高质量发展的指标体系,在此基础上综合测算了中国117个资源型城市的高质量发展水平,并深入分析了其影响机理。结果表明:① 2005—2017年资源型城市高质量发展水平持续增长,整体呈现显著的“东部相对较高、西部相对较低”的分布格局。② 高质量发展水平较高和较低的城市具有明显的区域集聚特征,但高质量发展水平局部不平衡性加剧,空间极化现象持续扩大。③ 不同成长阶段的城市高质量发展水平存在较大差别,其中,再生型城市高质量发展水平最高,而衰退型城市高质量发展水平最低。④ 资源型城市与省会城市或直辖市的距离、区位和海拔、城市的开放时间等均对资源型城市高质量发展水平有重要影响。
Integration and innovation: Two approaches to foster regional industries of advantage: A case study of regional industries of advantage in Central China
集成型和创新型: 区域优势产业培育的两种思路: 中部地区优势产业培育的案例研究
Research on choices of undertaking industrial transfer in Central China
中国中部地区承接产业转移的行业选择
An analysis and comparison of response pattern of coal cities in the central of China
中部地区典型煤炭城市接续产业响应模式分析及比较
Quantitative evaluation and comparative analysis for coordinated development of resource, environment, economy and society in Central China
DOI:10.2307/142564 URL [本文引用: 1]
中部地区资源—环境—经济—社会协调发展的定量评价与比较分析
Spatial-temporal variation and formation mechanism of neo-urbanization development coordination in Central China
中部地区新型城镇化发展协调度时空变化及形成机制
Study on the resource environment, economy and urbanization situation and green rise strategy in Central China
DOI:10.18402/resci.2019.01.04
[本文引用: 1]
Central China has the geographical advantages of locating at the transition point of the east and the west of China, and connecting the south and north of China, which is a key development zone for the regional harmonious development of the country. The central region is the Yangtze River Economic Belt and the Yellow River Economic Belt crossing the driving region. It is the regional development strategy of the country's overall development strategy. It is the rising and radiating region of the central urban agglomerations. It is an important industrial transfer bearing area and a regional coordinated development of China. In recent years, the level of urbanization in the central region has been continuously improved and the economic strength has been greatly improved. It has entered a new stage of accelerating development and comprehensive rise. A series of serious environmental problems have emerged. It is urgent to seek a green road to rise. Based on the judgment of the basic situation of economic and social development and urbanization in the central region, this study conducts a comparative analysis of the typical resource and environmental problems. We further identify that its pollution situation is aggravating. Based on the environmental Kuznets curve and the system dynamics model, the analysis shows that the economic growth and environmental pollution in the central region continue the trend of traditional “first pollution after treatment” model. The main pollutant emission reduction input path is refined. In the future, the central region should actively respond to the green rising strategy, establish and improve the ecological compensation and pollution joint prevention and control mechanism, promote the optimization of industrial structure, and explore a new mechanism for coordinated and sustainable development of the economy, society and resources.
中部地区资源环境、经济和城镇化形势与绿色崛起战略研究
DOI:10.18402/resci.2019.01.04
[本文引用: 1]
中部地区具有承东启西、连南通北的区位优势,是国家区域协调发展战略的重点区。近年来中部地区城镇化水平不断提高、经济实力大幅提升,已经步入了加快发展、全面崛起的新阶段。随之出现了一系列严峻的环境问题,亟待迈入绿色崛起之路。本文在对中部地区经济社会发展与城镇化基本态势判断的基础上,对其出现的典型资源环境问题等进行对比分析,发现其污染状况呈现加重趋势。基于环境库兹涅茨曲线及系统动力学模型,分析得到中部地区经济增长和环境污染依旧延续了传统“先污染后治理”的老路,提出了主要污染物减排投入路径。未来中部地区应积极响应绿色崛起战略,建立健全生态补偿及污染联防联控机制,推动产业结构绿色转型和优化升级,探索经济社会与资源环境协调可持续发展新机制。
The direction and path of green rise of central region of China in the new era
新时代中部地区绿色崛起的方向与路径
Coupling and coordination between new urbanization and agricultural modernization in Central China
DOI:10.31497/zrzyxb.20210313
[本文引用: 1]
Based on the perspective of urban-rural integration and regional coordinated development, a new evaluation index system for the coupling and development of urbanization and agricultural modernization was constructed. The coupling and coordination relationship between the two regions in the central region of China from 2007 to 2017 was analyzed by using the global principal component analysis and the coupling coordination degree model. The temporal and spatial evolution characteristics were systematically studied. The results show that: (1) During the research period, the new urbanization and agricultural modernization of the provinces continued to grow with a certain degree of fluctuation, but the overall benefits under the two-way interaction were generally low, and economic development was the main force driving the improvement of the two levels. (2) The new urbanization and agricultural modernization in the central region were highly coupled. In 2007-2017, the two systems experienced a transition from "mild imbalance-primary coordination". The coupling and coordination relationship tended to be continuously optimized, and the coordination level presented a spatial pattern of "high in the south and low in the north". (3) The coupling and coordination of new urbanization and agricultural modernization in the central region had some shortcomings. In contrast, the development of new urbanization was slightly lagging behind. Since 2012, under the regulation and guidance of macroeconomic policies, the imbalance of the development of the two systems has gradually weakened, and most provinces have successively achieved simultaneous development at different coordination levels. Mastering the coupling and coordination characteristics of new urbanization and agricultural modernization and the spatio-temporal evolution trend have positive and practical significance for the realization of the rise of the central region and the goal of modernization in the New Era.
中部地区新型城镇化与农业现代化耦合协调机制及优化路径
DOI:10.31497/zrzyxb.20210313
[本文引用: 1]
基于城乡统筹和区域协调发展的视角,构建了新型城镇化与农业现代化耦合协调发展评价指标体系,采用全局主成分分析、耦合协调度模型对2007—2017年中部地区两化的耦合协调机制及时空演化特征进行了系统研究。结果表明:(1)研究期间各省份新型城镇化与农业现代化以一定幅度的波动持续增长,但双向交互下的综合效益总体偏低,经济发展是驱动二者水平提升的主要动力;(2)中部地区新型城镇化与农业现代化表现为高度的耦合相关,2007—2017年两系统经历了“轻度失调—初级协调”的转变,耦合协调关系总体趋于不断优化,协调水平在空间格局上呈现“南高北低”的分异特征;(3)中部地区新型城镇化与农业现代化的耦合协调存在一定短板,相比之下新型城镇化的发展稍显滞后。2012年以来,在宏观政策的调控和引导下两系统发展的不平衡趋势逐步减弱,多数省份已先后实现不同协调等级的同步发展。掌握新型城镇化与农业现代化的耦合协调特征和时空演化趋势,对新时期中部地区崛起和现代化建设目标的实现有着积极的现实意义。
High-quality development of public health in Central China
中部地区公共卫生健康高质量发展研究
Research on spatial network structure of green development efficiency of resource based cities in Central China
中部地区资源型城市绿色发展效率的空间网络结构研究
Spatio-temporal evolution and influencing factors of high-quality tourism industry development around Changsha-Zhuzhou-Xiangtan urban agglomeration
DOI:10.1080/00130095.1966.11729846 URL [本文引用: 1]
环长株潭城市群旅游业高质量发展水平变化及其影响因素
Dynamic comprehensive evaluation of environmental carrying capacity of industrial transferee in Central China: In case of Wanjiang urban belt
中部地区产业转移承接地的环境承载力动态综合评价研究: 以皖江城市带为例
Analyzing spatial characteristics of urban resource and environment carrying capacity based on Covert-Resilient-Overt: A case study of Wuhan city
DOI:10.11821/dlxb202110008
[本文引用: 1]
The resources and environment carrying capacity (RECC) is a barometer of the development of urban territory space, so exploring the spatial characteristics of RECC is greatly significant for optimizing the territory spatial pattern. In this context, this paper uses new urban geographic information data, such as night-time lights and atmospheric remote sensing, points of interest, historical traffic situation and social media, on the basis of relevant procedures and guidelines. Furthermore, a theoretical framework based on the covert-resilient-overt analysis of the spatial characteristics of urban RECC is proposed, and a method combining spatial autocorrelation and fractal geometry is developed for spatial characteristics mining of RECC. Taking Wuhan as an example to carry out research, the results show that: (1) The distribution of RECC in Wuhan has significant spatial heterogeneity. Areas with higher covert carrying capacity are concentrated in the Huangpi District and Xinzhou District with superior ecological environment in the northern periphery of the city, areas with high resilient carrying capacity are concentrated in the central urban area with strong comprehensive risk response capabilities, and areas with high overt carrying capacity are located in the sub-center of the city with sound basic functions. (2) The RECC in Wuhan has positive spatial aggregation, and it shows significant radius-centripetal fractal and circle characteristics. The areas of high covert carrying capacity spread radially around, and the areas with high resilient carrying capacity are concentrated in the core of the city in a centripetal shape, the areas with high overt carrying capacity are between the areas with high values of covert and resilient carrying capacity. In conclusion, the spatial characteristics analysis and mining method system of urban RECC constructed in this paper make up for the shortcomings of the low dynamics of traditional data by introducing multi-source spatial temporal data, and improves the theoretical and technical paradigm of urban RECC research. The research provides a new way of thinking for the carrying capacity of urban resources and environment.
基于隐性—韧性—显性的武汉城市资源环境承载力空间特征
DOI:10.11821/dlxb202110008
[本文引用: 1]
资源环境承载力是衡量城市国土空间发展状况的晴雨表,深入揭示资源环境承载力系统要素的相互作用机理对城市国土空间格局优化具有重大意义。本文在双评价指南的基础上引入夜光/大气遥感、兴趣点、交通态势、社交媒体等多源时空数据,建立了基于隐性—韧性—显性的城市资源环境承载力空间特征分析理论框架,提出了空间自相关和分形几何相结合的承载力空间特征挖掘方法。以武汉市为例开展研究,结果表明:① 武汉市资源环境承载力呈显著空间异质性,隐性承载力指数高值区分布于城市外围生态环境优越的区域,韧性承载力指数高值区集中于综合风险应对能力较强的中心城区,显性承载力指数高值区位于各项基础功能均较为健全的城市次中心一带;② 武汉市资源环境承载力存在正向空间聚集性,并呈显著半径向心分形特征,隐性承载力指数高值区呈放射状向四周扩散,韧性承载力指数高值区呈向心状聚集在城市核心圈层,显性承载力指数高值区分布于则介于二者之间。本文构建的城市资源环境承载力空间特征分析与挖掘方法体系,通过引入多源时空数据弥补了传统数据现势性的不足,完善了城市资源环境承载力研究的理论和技术范式,可为新时期城市资源环境承载力研究提供一种新思路。
Comprehending, grasping, and promoting high-quality economic development
理解、把握和推动经济高质量发展
Correctly understanding and guiding people's need for a beautiful life
正确理解和引导人民的美好生活需要
Probe into the assessment indicator system on high-quality development
高质量发展评价指标体系探讨
Reestimating the capital stock of China: 1952-2006
中国资本存量K的再估算: 1952—2006年
The world distribution of income: Falling poverty and convergence, period
DOI:10.1162/qjec.2006.121.2.351 URL [本文引用: 1]
Spatial distribution dynamics of provincial economic growth in China
中国省区经济增长空间分布动态
Spatial differentiation patterns and influencing mechanism of housing prices in China: Based on data of 2872 counties
DOI:10.11821/dlxb201608004
[本文引用: 1]
In contemporary China, housing price has become the vital issue, which attracted considerable attention from the governments and inhabitants. However, there are relatively few studies on spatial differentiation of housing prices in China at the county level. In addition, there is no unanimous conclusion on the main factors influencing spatial differentiation of housing price. To meet this deficiency, using spatial autocorrelation and kernel density function, this study examines the spatial differentiation pattern, spatial correlation characteristics and the distribution shape of housing prices in China, and constructs the 'Pyramid of Housing Price Grade' based on the average housing prices of China's counties in 2014. Furthermore, a housing price model is established according to the demand-supply-market theory in order to explore the impact factors, and intensity differences of the influencing factors are also analyzed. The main conclusions are as follows: (1) There exists significant spatial correlation and agglomeration of housing prices in China's counties, and the differentiation patterns are featured by the administrative grade and the spatial agglomeration simultaneously; (2) The housing prices present pyramid-ranked distribution in China. This finding indicates that the higher the housing price, the less the urban population. (3) The proportion of rental households, scale of the floating population, housing affordability, housing market activity and the cost of land are five core influencing factors of housing prices in China's counties. The intensities of these influencing factors vary across administrative grade sub-markets.
中国县域住宅价格的空间差异特征与影响机制
DOI:10.11821/dlxb201608004
[本文引用: 1]
以2014年中国2872个县级单元的住宅平均单价为基本数据,通过空间自相关和核密度函数分析中国住宅价格的差异格局、空间关联特征和分布形态,构建“住宅价格等级金字塔”;根据“需求+供给+市场”的三维理论视角建立包括5大住宅价格差异影响因素在内的价格模型,采用地理探测器分析全国及其区域子市场的影响因素强度差异,并探索其影响机制。结果表明:① 中国区域住宅价格呈现以行政等级性为主、空间集聚性为辅的双重差异格局,其空间关联与集聚性显著;② 中国住宅价格呈现出房价越高,区域越少,所居住城镇人口越少的“金字塔式”等级分布特征。③ 租房户比例、流动人口规模、住房支付能力、住房市场活跃度、土地成本是中国住宅价格差异的5个核心影响因素,不同行政等级子市场的影响因素作用强度各异。
Geographic detection and optimizing decision of the differentiation mechanism of rural poverty in China
DOI:10.11821/dlxb201701013
[本文引用: 1]
Rural poverty has long aroused attention from countries around the world, and eliminating poverty and achieving realize common prosperity is an important mission to build the well-off society in an all-round way. Scientifically revealing the regional differentiation mechanism of rural poverty has become an important issue of implementation of national poverty alleviation strategy. This paper, taking Fuping County of Hebei Province as a typical case, diagnoses the dominant factors of differentiation of rural poverty and reveals the dynamic mechanism of rural poverty differentiation by using the Geodetector model and multiple linear regressions, and puts forward the poverty alleviation policies and models for different poverty regions. The result shows that the dominant factors affecting rural poverty differentiation include slope, elevation, per capita arable land resources, distance to the main roads and distance to the center of county, and their power determinant value to poverty incidence differentiation are 0.14, 0.15, 0.15, and 0.17. These factors affect the occurrence of poverty from different aspects and their dynamic mechanism is also different. Among various factors, the slope and per capita arable land resources affect the structure and mode of agricultural production, while distance to the main roads and distance to the center of county have influence on the relationship between the interior and exterior of the region. There are significant differences in the four types identified of regional rural poverty, namely, environment constrained region mainly affected by slope (seven towns), resource oriented region mainly affected by per capita arable land (seven towns), area dominated by traffic location affected by distance to the main roads (three towns), and economic development leading area mainly affected by distance to the center of county (four towns). Then, Fuping County is divided into single core, dual core and multi-core area according to the number of core elements of the township. The county has shown a multi differentiation of rural poverty with a horizontal center of dual core area, and both sides have a single core and multi-core, which are affected by different dominant factors. Finally, this paper suggests that policy of targeted poverty alleviation should take science and technology as the foundation and form innovation of targeted poverty alleviation according to the core dominant factors of the differentiation mechanism of rural poverty. The county's poverty alleviation and development under different driving mechanisms need orderly promotion of poverty alleviation and integration of urban and rural development strategy with adjusting measures to local conditions, respecting for science, and stressing practical results.
中国县域农村贫困化分异机制的地理探测与优化决策
DOI:10.11821/dlxb201701013
[本文引用: 1]
农村贫困化是长期以来备受世界各国关注的焦点问题,消除贫困,实现共同富裕是中国全面建设小康社会的重大任务,科学揭示农村贫困化地域分异机制,成为实施国家精准扶贫战略的重要课题。论文以河北省阜平县为典型案例,运用地理探测器、多元线性回归等模型方法,诊断出县域农村贫困化分异的主导因素,揭示了农村贫困化分异的动力机制,提出了不同贫困化地域类型的扶贫政策与模式。结果表明:① 影响农村贫困化分异的主导因素包括地面坡度、人均耕地资源、到主要干道距离、到县城中心距离等,各因素对贫困发生率分异的决定力分别为0.14、0.15、0.15、0.17;② 不同类型区域农村贫困化的分异机制存在明显差异,可归纳为自然环境约束型、资源丰度约束型、交通区位约束型、经济区位约束型等四大类型;③ 根据阜平县各乡镇核心主导因素,进一步划分出单因素、双因素和多因素影响区域,县域整体呈现出以横向中心为双因素影响区,两侧为单因素与多因素并存的多极核心主导因素影响的农村贫困发生分异区;④ 不同驱动机制下的县域扶贫开发亟需因地制宜、尊重科学、讲求实效,有序推进精准扶贫与城乡发展一体化战略。
Spatio-temporal differentiation characteristics and influencing factors of green development in the eco-economic corridor of the Yellow River Basin
DOI:10.11821/dlxb202103016
[本文引用: 1]
Based on the scientific connotation of green development, a comprehensive evaluation index system for green development in the Yellow River Basin was constructed, and various measurement methods such as entropy method, spatial autocorrelation analysis, and geographical detector model were used to study the spatio-temporal differentiation characteristics and the influencing factors of the green development in the eco-economic corridor of the Yellow River Basin. The results are obtained as follows: (1) The green development in the Yellow River Basin mainly originates from the external driving effects of large-scale expansion and the growth of total volume. Focusing only on pursuing the speed and scale of development but ignoring the connotative improvement of quality and efficiency will inevitably lead to the insufficiency of internal driving effects and unsustainability. (2) The number of areas with lower level of green development in the study area decreased continuously while that with a higher-level of green development rose slightly during the limited study period. However, the proportion of the numbers of areas with the lower level and medium-low level of green development remained above 65% for a long time, indicating that the level of green development needs further improvement. (3) From 2005 to 2017, the 61 prefecture-level cities in the Yellow River Basin generally showed relatively obvious spatial dependencies, and the green development level displayed a relatively obvious characteristic of spatial club convergence. The phenomenon of polarization in the study area was obvious. (4) The economic development level, science and technology level and government regulation are still the leading factors influencing the green development, and the explanatory power of interactions between factors for the green development far exceeds that of a single factor. This reflects the driving factors for green development in the Yellow River Basin are complex.
黄河流域生态经济走廊绿色发展时空分异特征与影响因素识别
DOI:10.11821/dlxb202103016
[本文引用: 1]
基于绿色发展科学内涵,综合构建了黄河流域绿色发展的评价指标体系,并采用熵值法、空间自相关分析、地理探测器模型等多种计量方法研究了2005—2017年黄河流域生态经济走廊绿色发展时空分异特征与驱动因素,结果如下:① 黄河流域绿色发展主要来源于规模化扩张与总量增长的外部驱动作用,热衷于发展速度与规模,忽视质量与效率的内涵式提升势必导致内生驱动作用不足与不可持续性;② 研究时限内黄河流域绿色发展低水平区不断减少,较高水平区稍有增加,但低水平与中低水平区占比长期稳定在65%以上,说明黄河流域绿色发展质量有待于进一步提升;③ 2005—2017年间黄河流域61地级市整体存在较为明显的空间依存关系,且绿色发展水平具有相对明显的空间俱乐部收敛特征,流域内两极分化现象较为明显;④ 经济发展水平、科学技术与政府调控始终是黄河流域绿色发展的高作用力影响因子,因子交互作用后对黄河流域绿色发展解释力远超单因子,反映出黄河流域绿色发展的驱动因素具有复杂性特征。
Some considers of rising strategy in central region
中部崛起战略的若干思考
Hypothesis testing and interpretation on regional economic growth club convergence
DOI:10.13249/j.cnki.sgs.2018.02.012
[本文引用: 1]
Since the reform and open trade policy was enacted in 1978, China’s economy has achieved sustained and rapid growth for more than 30 years, becoming the world’s second largest economy. But in recent years, China’s economic growth continued to decline from 14.2% in 2007 fell to 6.9% in 2015. Nowadays, China’s economy has entered a “new normal” period. Economic growth in developed regions is slowing down and some underdeveloped regions’ economic growth has been accelerating. There are indications that China seems to be ushering in the golden age of developing regions catching up to developed areas. Shall the developing regions overtake the developed regions? And how shall the developing regions catch up with the developed areas? Furthermore, which areas will become the dominant forces of China’s economic growth in the future? These are the real problems that need to be solved at present. And these issues are precisely classified in the main areas of club convergence research. In the real world, the phenomenon of coexistence of poor and affluent regions is very common. As a result, it has triggered to a prominent theme of club convergence in the existing literature. The related research can be more accurate when observing the spatial pattern of regional economic growth and analyzing the impact factors of different types of regional economic growth. This will undoubtedly provide important theoretical enlightenment and decision-making reference value for the promotion of the whole of economic growth. However, the current research on convergence club is still in the stage of testing whether there is the phenomenon of the club convergence, and the empirical research work is limited. This article reviews the existing literature from the aspects of testing the club convergence hypothesis, explaining the formation of convergence clubs, and relevant research about China. Then this article puts forwards some expanding directions as follows: 1) The research on the development of club convergence requires the combination of time dimension and space dimension, which can be extended to time and space coupling club convergence. 2) The study of club convergence needs to integrate into the heterogeneity of technology. 3) The test of the club convergence hypothesis needs to combine regional grouping and convergence test to improve the robustness of results. 4) The research on the formation mechanism of club convergence needs to consider the interaction of factors. 5) It is necessary to analyze the evolution mechanism of club convergence. 6) It is important to study club convergence among prefectures and counties in China.
区域经济增长俱乐部趋同: 假说检验及解释
DOI:10.13249/j.cnki.sgs.2018.02.012
[本文引用: 1]
研究俱乐部趋同可以更加准确地观察区域经济增长的空间格局,针对性地分析不同类型区域经济增长的影响因素,这对于缩小区域经济差异具有重要意义。从俱乐部趋同假说的检验、解释及中国的相关研究等方面对现有国内外文献进行综述,并指出有待进一步拓展的研究方向,以期为国内该领域的深入研究提供借鉴。
Evaluation of industry transfer comprehensive undertaking ability of six major urban agglomerations in the central region
DOI:10.13249/j.cnki.sgs.2016.05.005
[本文引用: 1]
Industrial transfer is an effective method to promote economic development of the undertaking regions. Since 1930s research on industrial transfer had formed the flying-geese model, product life cycle theory, marginal industry expansion theory, the eclectic theory of international production,overlapping industry theory, and the theory of gradient and so on. Early empirical research is mainly about the transfer of industry between developed countries. China's research on industrial transfer started in 1990s. The research content is mainly about the motive, the mode and the mechanism of the industry transfer, study on the ability of undertaking industry is still insufficient. As an important carrier of regional development, six central urban agglomeration plays an important role in transfering the industries of the eastern region, So, what are the differences of the undertaking capacity of the six major urban agglomerations in the central region? What are the strengths and weaknesses of different urban agglomeration to undertake industry? This is very important for different regions to make best use of the advantages and by pass the disadvantages to improve industry utilization efficiency. These are also topics worthy to discuss.Thus,from the perspective of industry’s undertaking place, this article takes six central urban agglomerations as the research object and selects 7 secondary indicators and 27 tertiary indicators to establish evaluation index system, using the principal component analysis (PCA) to evaluate the comprehensive undertaking industry transfer ability of six major urban agglomerations in the central region, and finally draws the following conclusions: Firstly, from the perspective of urban agglomeration, the undertake ability between urban agglomeration varied greatly and the level gap of each subsystem is large. These differences are reflected in the seven subsystems. Secondly, from the perspective of cities, the undertake ability of central city is outstanding, but the overall level is yet to be improved. The number of high and low gradient cities is "polarization". Thirdly, the comprehensive undertaking ability of the urban agglomeration is not only related to the strong undertaking ability of the regional central city, but also closely related to the undertaking ability of non-central cities in the urban agglomeration. Finally, based on relevant research conclusions, this article gives some suggestions to improve the industry capacity of the six major urban agglomeration from seven aspects, including factor of cost, the degree of opening cooperation, the attraction of the market, the ability of technological innovation, the industry matching ability, the level of economic development and the industrial structure level.
中部六大城市群产业转移综合承接能力评价研究
DOI:10.13249/j.cnki.sgs.2016.05.005
[本文引用: 1]
从产业承接地角度出发,以中部六大城市群为研究对象,基于前人研究的基础上选取7个2级指标和27个3级指标建立评价指标体系,运用主成分分析法对中部六大城市群产业转移综合承接能力进行评价,得出:① 从城市群层面看,城市群之间承接能力悬殊,各子系统水平差距大;② 从城市层面看,中心城市承接产业能力突出,但整体水平有待提高, 高低梯度城市数量呈“两极分化”状态;③ 从总体看,城市群综合承接能力不仅受中心城市承接能力影响,也与城市群内非中心城市承接能力密切相关。基于相关的研究结论,有针对性地从成本因素、对外开放合作程度、市场吸引力、技术创新能力、产业配套能力、经济发展水平和产业结构水平7个方面给出了提高中部六大城市群产业承接能力的建议措施。
Research progress and prospect of technology spillover effect of industrial transfer
DOI:10.11820/dlkxjz.2015.05.010
[本文引用: 1]
Technology spillover of industrial transfer is an important form of technology flow and diffusion. This article reviews the evolution of research on technology spillover of industrial transfer and summarizes the main debates in recent years on technology spillover effect of industrial transfer. The view of "significant positive effect" mainly originated from the observation of positive knowledge transfer from developed countries or regions to less developed countries or regions, while the view of "non-significant effect or negative effect"mainly originated from the recognition of obstacles of technology spillover, especially the will of technology spillover of the transferred enterprises. Based on the influence of factors such as technology, donor and receptor, circulation network, distance, and external environment on the technology spillover effect of industrial transfer, this article provides explanations on these debates. The article holds that technology spillover effect of industrial transfer has strong spatiotemporal characteristics. Heterogeneity of technology, space, and agents determines that technology spillover of industrial transfer is not an inevitable economic phenomenon, but a contingent effect deeply influenced by industrial characteristics, regional conditions, and external environment. The main reason for the academic debates is the difference in influencing factors of different regions of empirical research. Moreover, some of the studies did not fully consider the influence of related factors. Future study on technology spillover of industrial transfer should fully consider the characteristics of case study regions and set strict constraints. Finally, this article puts forward five research directions that need to be focused on in future research: (1) contingency of technology spillover of industrial transfer; (2) the influence of technology circulation network; (3) the influence of distance; (4) the control mechanism of transferred enterprises to technology spillover; and (5) the difference of technology spillover mechanisms between international and interregional industrial transfer.
产业转移技术溢出效应研究进展与展望
DOI:10.11820/dlkxjz.2015.05.010
[本文引用: 1]
产业转移技术溢出是技术流动和扩散的重要形式。本文梳理了产业转移技术溢出研究的演进脉络;总结了近年学界对产业转移技术溢出效应的主要论争,并基于技术、供体、受体、流通网络、距离条件、外部环境等影响因素对上述论争进行了解释。认为产业转移技术溢出具有很强的时空情景性和权变性,技术、空间与行为主体的异质性决定了产业转移技术溢出并非一种必然的经济现象,而是一种深受产业特征、区域条件、外部环境影响的或有效应。目前学界对产业转移技术溢出效应存在论争主要是由于不同实证区域的因素条件存在差异,今后应充分考虑案例区特质并设定严格的约束条件。最后提出了5个需要重点研究的方向:一是产业转移技术溢出或有性;二是技术流通网络影响;三是距离因素影响;四是转移企业对技术溢出的控制机制;五是国际、国内产业转移技术溢出机制的差异。
Regional difference of ecological efficiency and its interactive spatial spillover effect with industrial structure upgrading
DOI:10.13249/j.cnki.sgs.2020.08.006
[本文引用: 1]
This article measured the ecological efficiency of 30 provinces (Excluding Tibet, Hong Kong, Macao and Taiwan regions) in China based on the Super-SBM model considering the undesirable output, and analyzed the differences of different regional ecological efficiencies by using GINI, GE0 and GE1. On this basis, the Spatial Simultaneous Equation was introduced to explore the interaction effect and space spillover effect between industrial structure upgrading and ecological efficiency. The results showed that: 1) The overall level of ecological efficiency in China is relatively low and the development of it is unbalanced among regions. The ecological efficiency of the eastern region is higher than that of the central and the western regions, while the ecological efficiency of the western region is higher than that of the central region. 2) The three indicators of GINI, GE0 and GE1 show that there is a great differences in the inter-provincial ecological efficiency in the eastern region, and the degree of the difference has not been significantly improved, the difference of inter-provincial ecological efficiency in the central region is small, and the difference of inter-provincial ecological efficiency in the western region shows a trend of decreasing firstly, then increasing, and then decreasing. 3) There is a mutual promoting effect mechanism, a positive spillover effect and a positive interactive spatial spillover effect between industrial structure upgrading and ecological efficiency.
生态效率区域差异及其与产业结构升级交互空间溢出效应
DOI:10.13249/j.cnki.sgs.2020.08.006
[本文引用: 1]
基于包含非期望产出的超效率SBM模型测度中国30个省际地区生态效率,采用基尼系数、对数离差均值及泰尔指数分析不同地区生态效率差异情况,运用空间联立方程模型探讨产业结构升级与生态效率间的交互效应与空间效应。主要结论为:① 中国生态效率整体水平较低且发展不均衡,东部地区高于中西部地区,西部地区高于中部地区;② 基尼系数、对数离差均值及泰尔指数3个指标显示,东部地区省际间生态效率存在较大差异,且差异变化程度并没有显著改善,中部地区省际间生态效率差异较小,西部地区省际间生态效率差异呈现先下降,后上升,再下降的趋势。③ 产业结构升级与生态效率存在双向互促作用,产业结构升级与生态效率均存在正向溢出效应,并且产业结构升级与生态效率存在正向交互空间溢出效应。
Regional innovation pole and its location knowledge spillovers in China from the perspective of "agglomeration-diffusion"
“集聚—扩散”视角下中国区域创新极及其知识溢出区位
