

1 引言
基尼系数目前已成为全球通用的衡量居民收入均衡程度的指标,被世界银行等国际组织广泛使用[7]。目前全球各国普遍使用的基尼系数需要GDP、人均收入和消费能力等若干关键经济指标进行计算[8⇓-10]。然而这类数据大多是基于传统的统计手段获得,存在滞后性强、获取成本高和易受人为因素影响等诸多问题[11]。鉴于此,近年来涌现出一系列基于DMSP-OLS、NPP-VIIRS等夜间灯光遥感数据分析社会经济发展[12]、城市活力[13]、能源消耗[14]、人类消费行为变化[15]的研究。夜间灯光数据具有获取成本低、更新周期有保障、时间序列长、有效避免行政区边界变更和人为因素干扰等优点[16],同时被大量研究证实可在某种程度上作为传统经济指标的替代数据[17-18]。
Elvidge等创新性地提出使用夜间灯光遥感数据代替收入数据计算基尼系数,即夜间灯光基尼系数,又叫做空间基尼系数或基于夜间灯光的发展指数[19]。夜间灯光数据是区域经济水平和公共服务的良好代理,因此灯光基尼系数可表示公众在享有区域财富和公共服务等方面的均衡情况,可用于空间显性地衡量全球的发展均衡性[19]。此后,国内外学者将该指标进一步拓展,应用于不同空间尺度的研究中。全球及区域尺度上,该指标应用于考察全球经济不平等的空间分异规律[20]、评估非洲国家的经济不平等[21];同时对灯光基尼系数是否可反映全球发展不平等进行了验证[22];也用于判别撒哈拉以南地区电气化计划的有效性[23]。国家及次级尺度上,灯光基尼系数在罗马尼亚的应用证明了该指标在衡量区域不平等上的有效性[24];在意大利的研究证实了灯光基尼系数可作为居民点分散或紧凑空间分布的代理变量[25]。国内学者将该指标作为一种简便、快捷、实用的方法,衡量中国各民族经济福祉的差异[26]、测算新疆维吾尔自治区的发展均衡性[27]、评估不同时期青藏高原地区的人类发展水平[28];同时深入挖掘该指数内涵,证明了其与公共服务水平不平等程度密切相关[29];证实了该指标在估算区域经济社会不平等研究中具有较高应用潜力[30]。但目前研究中,缺乏针对中国全域、长时间序列的灯光基尼系数的测算,同时相关文献大多忽略了在判断区域发展路径中,发展活力也是重要维度之一,只对灯光基尼系数进行单维度分析,限制了结果的丰富涵义和可借鉴性。
2 数据来源及研究方法
2.1 研究区及数据来源
本文以中国2900个县域为测算单元。同时考虑到2020年全面脱贫后,原贫困地区的县域经济基础与发达县域经济水平仍有一定的差距,因此,依据全国各县是否曾为贫困县,将2900个评价单元区分为832个相对经济欠发达地区和2068个相对经济发达地区分别进行探讨。
目前普遍使用的夜间灯光遥感数据有DMSP-OLS及NPP-VIIRS两套。1992—2013年的DMSP-OLS夜间灯光数据由美国国家海洋和大气管理局发布,是美国国防气象卫星计划DMSP搭载的线性扫描业务系统OLS生成的年度夜间灯光数据,具有较高的研究价值,但该数据存在亮度“过饱和”、缺乏在轨辐射定标、高亮度值区域灯光溢出等问题。为了弥补DMSP-OLS灯光数据集的相关问题,2012年美国国家极轨业务环境卫星系统NPP搭载的可见光红外成像辐射仪VIIRS提供了新一代高质量夜间灯光数据。NPP-VIIRS与DMSP-OLS数据相比,在空间、时间分辨率等方面得到了提升,进一步扩展了夜间灯光遥感的应用领域[16]。然而,两类灯光数据因传感器差异,同一时空位置的灯光像元值相差较大,无法直接衔接[33]。本文使用的灯光数据为利用基于自编码器模型的跨传感器校正方案进行修正的2002—2020年类NPP-VIIRS年度合成数据集[34],经数据生产者对全球15万个随机像元点和4万个城市区域的验证表明,该套数据具有较高的衔接质量以支撑长时间序列的拓展应用。本研究在数据使用前也进行了校正后类NPP-VIIRS影像和NPP-VIIRS影像的亮值像元总数量、灯光亮度值总和的一致性验证,两者衔接较为准确。
2.2 研究方法
基尼系数一般通过评估家庭或个人收入分配偏离完全平均分配的程度来表征居民收入的不均衡。基尼系数是一个比例数值,其值在0至1之间,基尼系数数值为0表示完全均等,数值为1表示完全不均等,越接近0表明收入分配越均等,越接近1表明收入分配越不均等。
基于夜间灯光数据的基尼系数与居民收入基尼系数计算原理相似,将夜间灯光强度代替居民收入,以考察夜间灯光明暗与人口密度的匹配程度。将具有相同投影坐标和空间分辨率的夜间灯光数据与人口数据集作为输入数据,生成涵盖所有人口和灯光强度栅格单元的列表。其中,将该区域内各栅格的灯光亮度值从小到大排序,并对应得到同一灯光亮度值的栅格上的人口总和。由以上两组数据分别计算区域内累计灯光百分比和累计人口百分比,从而绘制洛伦兹曲线(图1)。对角线S0为绝对均衡线,S1为洛伦兹曲线,该曲线与S0围成的面积为A,S1右下方的面积为B,灯光基尼系数则可表示为
图1
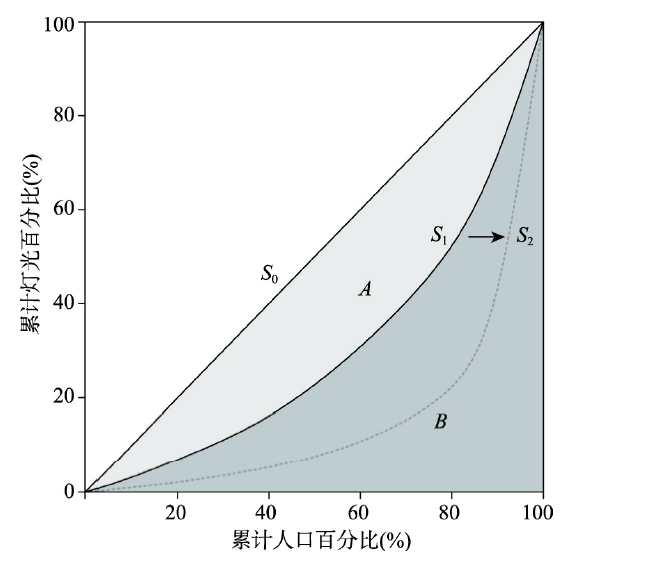
图1
灯光基尼系数原理图
Fig. 1
Principle of the Gini coefficient based on nighttime lights
洛伦兹曲线S1向S2移动过程中,曲线更加远离绝对均衡线,使得A区域的面积增大,灯光基尼系数也由0趋于1,意味着夜间灯光与人口分布的不均衡现象逐渐加剧。灯光基尼系数为0时,洛伦兹曲线与绝对均衡线重合,即A区域面积为0,表示该区域人口与灯光强度值的分配完全均等。反之,灯光基尼系数为1时,洛伦兹曲线离绝对均衡线最远,此时人口分布与灯光亮值区域完全分离,夜间灯光与人口分布极不均衡。
除灯光基尼系数外,本文引入了区县平均灯光值(像元灯光亮度值总和与灯光非零区域面积的比值)作为县域发展活力的表征指标,探讨了全国区县的发展活力与均衡性两个维度之间的关系,而这一双维度下的县域分析尚未见研究报道。同时,以2020年全国区县平均灯光值和灯光基尼系数的中位数作为高低分类的临界值,识别出经济相对欠发达地区和经济发达地区县域发展活力与灯光基尼系数之间4种不同的高低组合关系,这使得组合关系相似的县域可相互借鉴发展经验与提升路径,从而在实践应用层面上为实现县域全面高质量发展提供参考。
3 结果分析
3.1 中国县域平均灯光值与灯光基尼系数时空特征
2002—2020年间中国各区县的灯光基尼系数均值从2002年的0.82逐步下降至2020年的0.60,县域发展均衡性逐渐提升,而各区县的平均灯光值均值整体趋势上无明显变化(图2a)。从平均灯光值分布直方图(图2c)上看,灯光亮度值在0~5之间的县域数量明显下降,说明贫困程度较高的县域脱贫有一定成效,而这些县域平均灯光值大部分提升至5~20的区间内,因而对全国整体的县域平均灯光均值的影响不大。灯光基尼系数的直方图(图2b)显示,在0.1~0.7区间内的县域个数分布较为平稳,在0.9~1区间内的县域数量最多,说明仍有相当数量的县域虽然已经脱贫,但在县域内发展均衡性方面依然有较大提升潜力。2005年有74%的区县灯光基尼系数值分布在0.7~1的范围内,说明2005年县域内夜间灯光和人口密度分布较不平衡,发展均衡性较差。然而,近年来灯光基尼系数高值的区县数量明显减少,而灯光基尼系数低于0.3的区县个数在稳步增加,其中0~0.1区间的县域数量从2005年的92个增长至2020年的228个,足以说明县域不断向趋于均衡方向发展。
图2
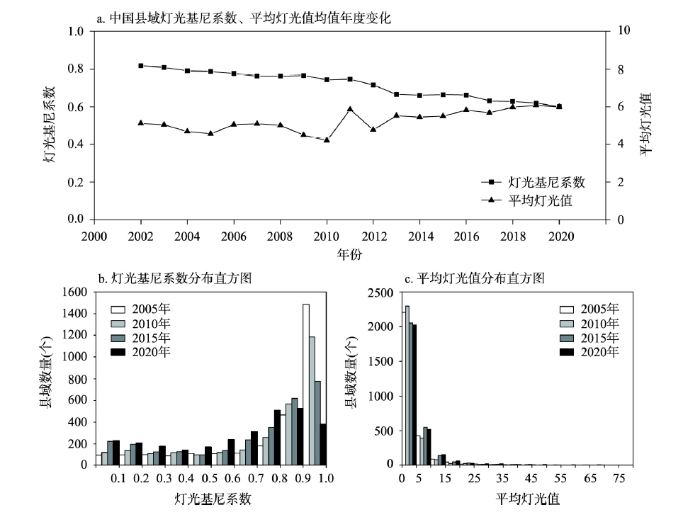
图2
中国县域灯光基尼系数与平均灯光值统计信息
Fig. 2
Statistics of the Gini coefficient based on nighttime lights and the average digital number of nighttime lights of Chinese counties
测算结果还表明,中国县域均衡性时空差异较大。时间上,各区县基尼系数整体下降明显,这说明人口分布与灯光亮度的空间匹配程度明显提升,县域尺度发展趋于均衡。2002—2020年间中国96%的区县灯光基尼系数均有不同程度的降低,近30%的区县灯光基尼系数下降幅度超过0.3,这与近年来随着中国经济的迅速发展、人口流动加快、道路等基础设施覆盖区域增加,使得区域发展活力与人口分布在空间上更加匹配的关系密切。特别是在东部沿海地区和新疆等地变化幅度更为明显[37]。空间上,中国县域灯光基尼系数总体呈现东低西高的特征,各区县间均衡性水平差异显著(图3)。东部和华南沿海地区数值普遍较低,其次为新疆、内蒙古等西北地区,东北、华北的灯光基尼系数居中,而中部偏南和西南地区的灯光基尼系数最高。灯光基尼系数的空间分布整体特征与中国经济发展地理分布规律有一定相似之处[38]。
图3
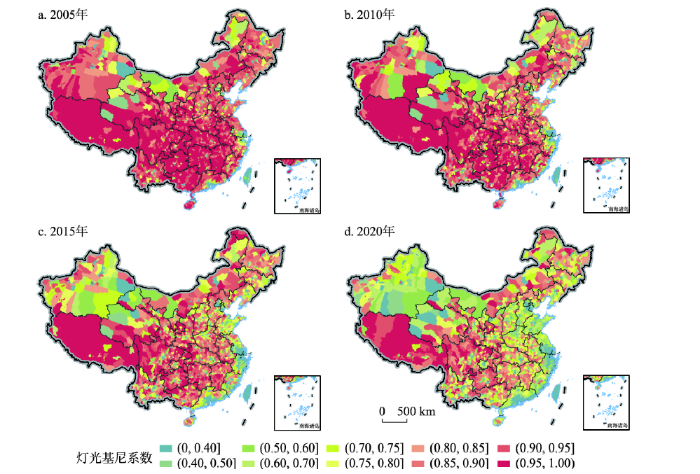
图3
2005—2020年中国各区县灯光基尼系数
注:基于自然资源部标准地图服务网站GS(2016)1594号标准地图制作,底图边界无修改,下文同。
Fig. 3
The Gini coefficient based on nighttime lights of Chinese counties, 2005-2020
从南北方、东中西部的统计与对比分析来看(图4),东部平均灯光值一直明显高于中西部地区,突显了中国东部地区在经济迅猛发展中积累的较大经济优势。但随着西部大开发国家战略实施、产业转移和结构升级、脱贫攻坚力度增强,激发了中西部地区的区域发展活力,东部与中西部平均灯光值的差值从2005年的2.36降至2020年的0.96,表明发展活力的差距不断缩小。反观南北方,2002—2012年期间多数年份北方平均灯光值高于南方,而2013年至今南方平均灯光值则稳定高于北方,南北方区域发展活力的差距发生逆转式变化,且在不断拉大[39]。这种反差与北方地区近年来面临东北经济衰退与人才流失严重等问题,而南方各省因科学技术创新、对外开放活跃,资本积累速度加快等多种原因有关。
图4
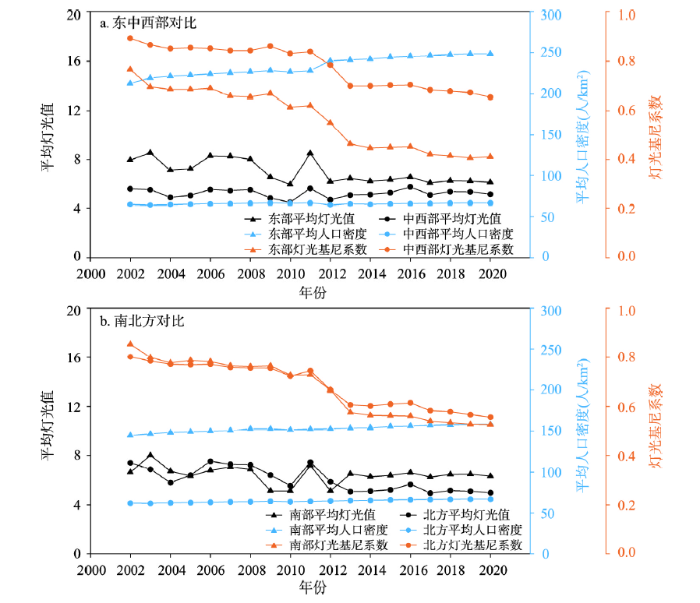
图4
2002—2020年中国分区域平均灯光值、人口密度及灯光基尼系数统计
Fig. 4
Statistics of the Gini coefficient based on nighttime lights, the average digital number of nighttime lights, and population density of Chinese regions, 2002-2020
在发展均衡性方面,不管是南北方还是东中西部,中国各区域的灯光基尼系数在2002—2020年间均显著降低,说明区域发展活力与人口分布愈加匹配、发展愈加均衡成为中国县域发展的普遍特征。其中,东部的均衡性一直优于中西部,但中西部的均衡性也明显提升。从两者的差异来看,东部与中西部灯光基尼系数的差值从0.13逐步提升至0.24,说明中西部的均衡性提升幅度较东部小。同时东部人口密度的增幅也明显高于中西部。东部长期积累的经济基础,较为完善的公共服务和基础设施配备,长三角、珠三角、京津冀三大城市群的辐射带动和人口吸引能力等使其灯光强度与人口分布更加协调,因而表现为灯光基尼系数更为快速地减小。南方的灯光基尼系数从2002年高于北方(+0.05),到2003—2012年之间的相差无几,直至2013年后的普遍低于北方(-0.04)的演变过程,显示出南方地区更为均衡的发展趋势。通过南方平均灯光值和人口密度折线均有提升可知,南方地区是经济增长与人口流入导致的人口在灯光亮度高值区域的集聚形成的发展均衡性向好。而北方的人口密度变化不大,但是基尼系数在稳步下降,究其原因,推测为北方地区内部通过人口的动态流动(如人口向城市区域的聚集),使得夜间灯光与人口的空间分布更加匹配而导致发展均衡性指标逐步向好。这一点由相关统计年鉴中北方各省城镇人口比重均值从2011年的54%提升至2020年的65%也可以得到佐证。值得一提的是,通过对比县域的分析结果与区域的统计结果,进一步印证了灯光基尼系数具有一定的尺度依赖特征[30],即区域上的明显特征无法通过县级尺度数据的变化规律直观地归纳表达,这也说明不同尺度的分析需相互辅助,以更加全面地诠释中国区域发展活力与均衡性的时空特征。
3.2 中国县域灯光基尼系数的空间集聚特征
本文采用2020年中国各区县平均灯光值和灯光基尼系数数据,利用全局Moran's I指数和局部G统计量Gi,判断平均灯光值和灯光基尼系数结果的空间自相关性、局部集聚及依赖性特征[40]。其中平均灯光值和灯光基尼系数的全局莫兰指数分别为0.129和0.215,两者均通过了显著性检验,说明平均灯光值和灯光基尼系数均表现出较好的空间集聚性。
灯光基尼系数局部G统计图中,Gi值显著为正,表示灯光基尼系数高的区县趋于集聚(热点地区),主要集中在中国西南部和中部偏南地区,及部分东北地区,包括滇西边境山区、乌蒙山区、滇桂黔石漠化区等多个曾经的连片特困地区,这些县域及其周边区域均显示出了较高的不均衡性(图5a)。Gi值显著为负,表示灯光基尼系数低的区县亦趋于集聚(冷点地区),主要集中在东部和南部沿海经济发展较快的地区,以及新疆的部分地区。热点区和冷点区显示出县域均衡性的高度空间依赖,也致使在中部地区形成了一条无显著空间依赖性的“过渡带”。这也与该地区高山纵横,河流众多,地质地貌原因关联性很大,因为这些自然因素削弱了相邻区县之间的空间相关性,呈现出各区县灯光基尼系数波动较大,因而未出现显著的空间依赖性。
图5
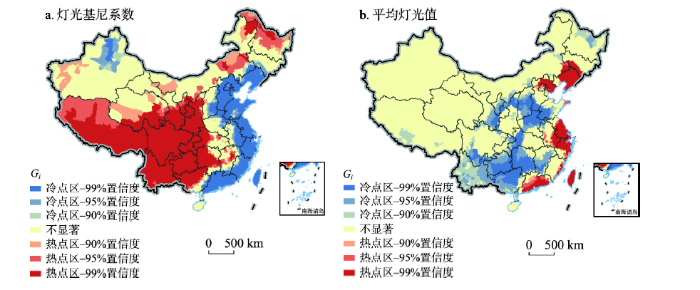
图5
2020年中国县域灯光基尼系数和平均灯光值热点区域图
Fig. 5
Hot spot maps of the Gini coefficient based on nighttime lights and the average digital number of nighttime lightsof Chinese counties in 2020
与灯光基尼系数局部G统计图相比,平均灯光值局部G统计图的热点地区和冷点地区分布较分散。热点区域主要分布在长江三角洲、珠江三角洲、京津及辽宁地区;而冷点区域主要分布在中部地区。其中,在川渝城市群、关中平原城市群及武汉城市圈地区因其区域发展活力相对较高,未被包括进冷点区域,形成三个被冷点区域包围的圆形区域。需要注意的是,本文平均灯光值数据计算范围为有灯光亮度的地区,而西藏、云南、青海等地有较大面积灯光值均为0,因而未被包括在计算范围内,故未在西部地区出现明显的冷点区域,平均灯光值局部G统计图中不显著地区占比较大(图5b)。对比可以发现,灯光基尼系数较低(发展较均衡)的地区,既包括东南部沿海地区等平均灯光值较高、发展活力强的集聚区,也有平均灯光值较低、发展活力弱的区域,例如曾经的环京津贫困带,这也体现了发展活力与均衡性之间并非一一对应的关系。
3.3 经济发达/欠发达地区灯光基尼系数对比
将中国各区县分为经济发达和相对欠发达地区,对灯光基尼系数进一步分区统计分析。经济欠发达地区县域的灯光基尼系数普遍较高,其中2005年灯光基尼系数集中分布于0.85~1的区间,2020年均衡性则有所提升,灯光基尼系数分布于0.54~1的区间。而发达地区县域的灯光基尼系数在0~1区间内分布较均匀,没有明显规律(图6)。对比4个年份的灯光基尼系数箱线图可知,经济发达和欠发达地区的灯光基尼系数均在稳步下降,均衡性逐渐提升。经济发达地区2005年的县域灯光基尼系数平均值为0.72,2020年的平均值减少为0.56,灯光基尼系数降低了0.16(22%)。而经济欠发达地区县域的灯光基尼系数平均值也从2005年的0.98下降至2020年的0.86,降幅为0.12(12%)。这说明随着经济社会的全面发展以及国家近年来大力推行的精准扶贫战略,不同发展水平的区县均衡性均有所提升,但经济发达地区县域因其经济基础较好、基础设施完备、发展经验成熟,其均衡变化提升程度略高于欠发达地区县域。
图6
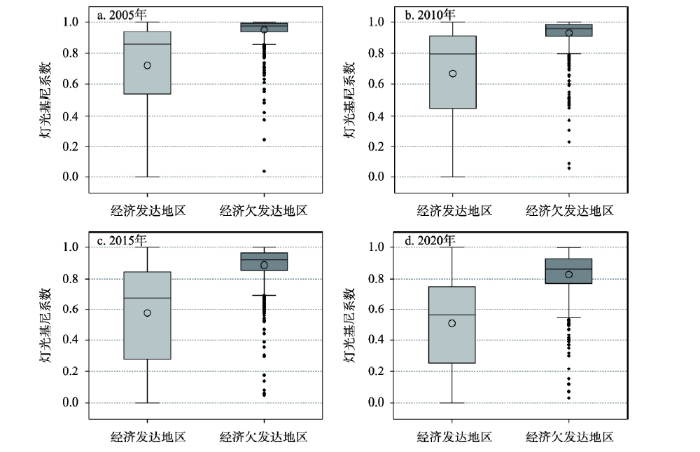
图6
2005—2020年中国经济发达/欠发达地区灯光基尼系数箱线图
Fig. 6
Boxplots of the Gini coefficient based on nighttime lights in China's economically developed/underdeveloped regions
平均灯光值—灯光基尼系数的散点图(图7)显示,经济欠发达地区的县域多集中在灯光基尼系数高于0.5而平均灯光值小于5的范围内,即处于灯光基尼系数相对较高且平均灯光值低的区域,说明这些县域发展活力较低,且人口在灯光中的分布较不均衡,两个维度上的不足成为经济欠发达地区的一个典型特征。散点图中另一明显特点是灯光基尼系数大于0.5而平均灯光值大于10的范围几乎没有点分布,这说明平均灯光值相对较高的区县较少出现发展不均衡的现象。同时,平均灯光值大于10的区县大部分灯光基尼系数小于0.2,说明发展活力相对较高的区县,其发展均衡性同样较好。根据相关学者对灯光基尼系数的探索,夜间灯光遥感数据可反映地区电力设备等基础设施、公共服务、商业和工业区的运行情况[23,29],与此对应,经济发达区域中,经济活跃地区和人口聚集区空间上较为匹配,公共服务基础设施配备更加完善,呈现发展较均衡的态势。然而,从原理上说,灯光基尼系数低(发展较均衡)可能是发展活力高、人口密度也大的均衡,也可能是二者均低的均衡,这也可以解释为何不是所有灯光基尼系数低的区县都处于较高的灯光值。同时,夜间灯光基尼系数与反映人类福祉和综合发展情况的指标(人类发展指数、贫困率等)有较高的相关性[19],本文中经济发达与欠发达县域的灯光基尼系数结果也与这一研究结果相一致。
图7
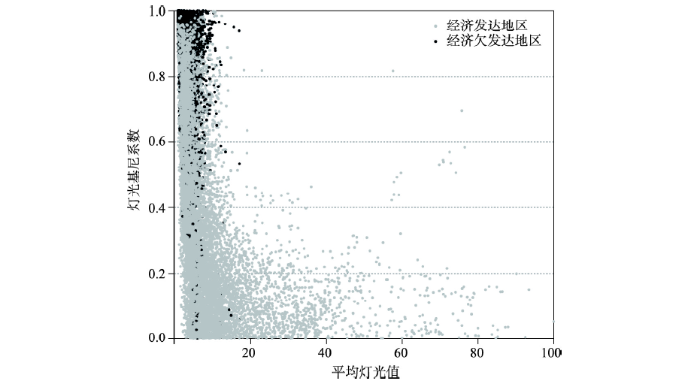
图7
2012—2020年中国经济发达/欠发达地区灯光基尼系数—平均灯光值散点图
Fig. 7
Scatter plot of the Gini coefficient based on nighttime lights and the average digital number of nightlights for China's economically developed/underdeveloped regions, 2012-2020
3.4 中国县域灯光强度—基尼系数关系
在经济相对欠发达地区,2020年中国有556个县为低夜间灯光活力—高灯光基尼系数模式(图8),即区域发展活力和均衡性均有待提升的区域,占贫困县的67%,广泛分布于西藏、青海等地;有近20%的县属于高夜间灯光活力—高灯光基尼系数模式,即通过脱贫经济已实现了较好的发展,但在发展中仍要关注均衡性的提升,主要分布在云贵川地区,如四川省的甘孜县和稻城县。值得关注的是,在经济相对欠发达地区中,高基尼系数的县域数量超过700个,这说明中国经济欠发达地区同时也多为发展不均衡区域,县域内的人口分布与经济活动旺盛、基础设施配备相对完善的区域不相匹配,有一定程度的资源错配或经济活动带动发展不充分的问题。
图8
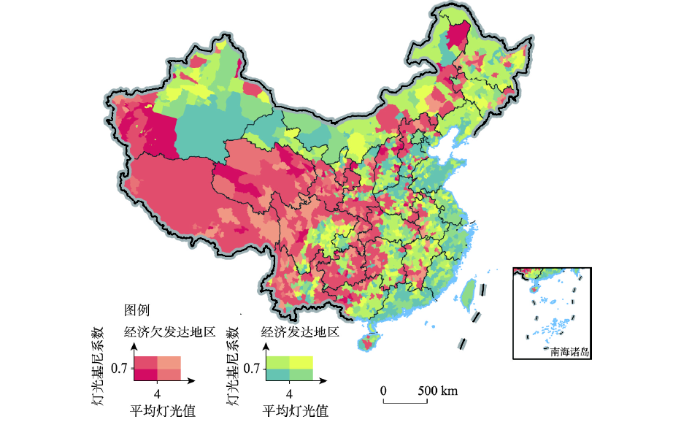
图8
2020年中国经济发达/欠发达地区灯光基尼系数与平均灯光值分布关系
Fig. 8
Typology map of the Gini coefficients based on nighttime lights and the average digital number of nightlights for China's economically developed/underdeveloped regions in 2020
与经济相对欠发达地区的主要类型不同,经济发达地区以高夜间灯光活力—低灯光基尼系数的发展模式为主(图8),该类型县域所占比例超过40%,主要集中于东部沿海地区及部分西北地区,典型代表为北京、上海市的城区。高夜间灯光活力—高灯光基尼系数模式占比8%,在四川及中国中南部出现频率较高,这部分区域经济发展强劲,但人口分布与灯光强度的分布存在某种程度的不匹配,部分与这些区域的山区地形阻碍导致无法适宜大面积聚居有一定关系。经济发达地区中的低夜间灯光活力的县域,低基尼系数和高基尼系数的县域数量相近,发展较为均衡的主要分布在山东、新疆等地,均衡性较差的主要分布内蒙古和部分中部区域(图8)。本文基于夜间灯光数据探索发现的县域发展与空间均衡间关系的研究结果与从空间政治经济学视角下探讨中国发展与平衡的研究结论不谋而合[35],但更多对发展模式的空间分布特征进行了诠释。将中国县域进行发展活力与均衡性双维度下的类型区分有利于巩固脱贫成效,诊断县域发展方向,找寻实现共同富裕的有效路径。
4 结论与讨论
4.1 结论
本文利用基于夜间灯光的基尼系数测算并分析了2002—2020年中国县域发展均衡性的时空动态特征,并探究了县域尺度上以灯光强度表征的区域发展水平和以灯光基尼系数表征的均衡性之间的关系,为缓解中国县域发展不均衡提供了定量化的决策信息。研究结果显示,时间动态上,2002—2020年中国有96%的区县灯光基尼系数呈下降趋势,表明这些县域的发展趋向均衡,其中东部沿海地区和新疆等地变化幅度明显。空间分布上,中国县域发展均衡性总体呈现东高西低的特征,且呈现出较强的空间集聚性,东部沿海县域的发展均衡性较好,中部及西南部县域的发展均衡性普遍较差。分区统计上,南北方发展活力差距正在逐步取代东西差距,而东西部的发展均衡性差异比南北方更加明显。研究结果还表明,中国经济发达县域的灯光基尼系数分布较分散,欠发达县域的灯光基尼系数普遍位于高值区间,直至2020年仍集中在0.54以上,说明均衡性仍需大幅提升。区域发展活力和均衡性两个维度来看,超过40%的经济发达县域表现为经济与均衡性协同增长的发展趋势,而65%的相对经济欠发达县域表现为发展活力和均衡性均处于较低的水平。这说明欠发达县域在发展社会经济的同时,也要注意发展的均衡性。
利用灯光基尼系数测度区域发展均衡性具有一定的理论探讨和应用价值。一方面,灯光基尼系数提供了测度区域均衡的新视角,不同于对收入、GDP等常规指标的考量,灯光基尼系数除了能表征区域的经济发展水平之外,同时更加突出了公众对基础设施、公共服务、社会共有财富享有上的均衡,丰富了基尼系数的内涵,拓展了其在共同富裕路径探索方面的应用。另一方面,灯光基尼系数所使用的数据均为遥感数据,具有更新速度快、获取便捷、客观性强、空间分辨率高、不受行政边界限制等突出优势,可高效地测度和动态反映区域发展的均衡水平,并可推广应用至不同地理区域和空间尺度,尤其是因发展落后而无法提供相关统计数据的国家和地区。
4.2 讨论
构造灯光基尼系数的夜间灯光遥感数据和空间化人口数据均为公里格网数据,不受行政边界和传统统计数据的限制。因此,灯光基尼系数具有反映不同尺度区域的发展均衡性的优势,具有较高的应用前景。然而根据基尼系数的计算原理,相等的灯光基尼系数也可能存在不同的洛伦兹曲线形态,即两区域的总灯光基尼系数相同,但是区域中相同灯光强度地区的均衡性却有所差异。因此接下来应进行区域内部不同亮度值的基尼系数的均衡性测度,探究导致不同地区发展不均衡的深层次原因。
同时,灯光基尼系数的结果与夜间灯光遥感数据的质量有较大关系。目前NPP-VIIRS数据与DMSP-OLS数据相比,在空间、时间分辨率等方面均得到了实质性提升,但依然存在云污染像元、月光污染像元、夏季高纬度灯光数据出现季节性杂散光等问题。未来应探究更为精准的夜间灯光数据校准方法,从而构建长时序、高质量的夜间灯光数据集,为发展均衡性等研究提供更加可靠的数据支撑。
参考文献
Linking economic complexity, institutions, and income inequality
DOI:10.1016/j.worlddev.2016.12.020 URL [本文引用: 1]
Demography, growth, and global income inequality
DOI:10.1016/j.worlddev.2015.05.013 URL [本文引用: 1]
Chinese balanced regional development strategy from the perspective of development geography
DOI:10.11821/dlxb202102002
[本文引用: 1]

Large regional differences and uneven regional development is fundamental of China. Regional balanced development is an important topic in the field of development geography. This study reviews the course of regional balanced development in China and summarize the characteristics of regional balanced development in each period. This study suggests that inter- regional development of China shows a state of succession between balanced development and non-balanced development. Each succession brings the quality of social development to a new level and gradually make social development move towards the state of high- quality development and balanced regional development. Then, this study discusses the scientific connotation of regional balanced development. Under the guidance of sustainable development theory, we should pay attention to the resource endowment difference in different area, solve the problem among economy, human and nature and promote spatial balance of regional development and green development of ecological economic coordination. The balanced promotion of regional people's well-being is the ultimate goal of regional balanced development. In the end, based on the thinking of development geography, this study discusses the path of regional balanced development in China from three aspects of society, economy and ecology. Suggestions are put forward for the balanced development of China's regions and the improvement of people's well-being.
发展地理学视角下中国区域均衡发展
DOI:10.11821/dlxb202102002
[本文引用: 1]
区域差异大、发展不平衡是中国的基本国情,研究区域均衡发展问题是发展地理学领域的重大课题。本文首先回顾了中国的区域均衡发展历程,总结了各时期区域均衡发展的特征,研究指出,中国区域间发展呈现出均衡发展与非均衡发展演替的状态,每次演进使得社会的发展质量迈进新的台阶,逐渐走向高质量发展与区域均衡发展的状态。其次,本文探讨了当前区域均衡发展的科学内涵,强调要以可持续发展理论为指引,关注不同地区资源禀赋差异,解决经济、人、自然三者间的矛盾,促进区域发展的空间均衡与生态经济协调的绿色发展,最终落脚到区域人民生活福祉的均衡提升为区域均衡发展的最终目标。最后,本文以发展地理学的思维从社会、经济、生态三个方面探讨中国区域均衡发展的路径,为中国区域均衡发展和国民福祉的提升提出若干建议。
Regional inequality measurement: Methods and evaluations
区域差异测度方法与评价
The Gini coefficient structure and its application for the evaluation of regional balance development in China
DOI:10.1016/j.jclepro.2018.07.224 URL [本文引用: 1]
Inequality as experienced difference: A reformulation of the Gini coefficient
Getting to a feasible income equality
Review and prospect of application of nighttime light remote sensing data
DOI:10.18306/dlkxjz.2019.02.005
[本文引用: 1]
In remote sensing research, night light remote sensing as an important branch of active development has attracted increasingly more attention from the fields of natural and social science research in recent decades. Different from traditional daytime optical satellite remote sensing that obtains ground object radiation information, nighttime light remote sensing is the acquisition of visible-near-infrared electromagnetic information transmitted from the Earth's surface under cloud-free conditions at night. Compared to the ordinary satellite remote sensing images, ground light intensity information recorded by the night light images directly reflects the difference of human activity. Therefore, it is widely used in urbanization research, extraction of impervious surfaces, estimation of socioeconomic indicators, major events assessment, ecological environment assessment, and other fields. At present, although research results based on nighttime light data are continuously accumulating, there is a general lack of systematic review of these results and the current reviews suffer from incomplete coverage and poor timeliness. Therefore, this article summarizes the research results of nighttime light data in recent decades and examines them from the aspects of data processing and technical approaches, urbanization application research, and parameterization. Finally, we identify the following three research hotspots: multi-source data fusion, application expansion, and short-period surface light monitoring.
夜间灯光遥感数据应用综述和展望
DOI:10.18306/dlkxjz.2019.02.005
[本文引用: 1]
在遥感应用研究中,夜间灯光遥感作为发展活跃的一个重要分支,近年来受到越来越多来自自然科学领域和社会经济领域的关注。与传统的光学遥感卫星获取地物辐射信息不同,夜间灯光遥感是获取夜间无云条件下地表发射的可见光-近红外电磁波信息。相比于普通的遥感卫星影像,夜间灯光遥感所使用的夜间灯光影像记录的地表灯光强度信息更直接反映人类活动差异,因而被广泛应用于城市化进程研究、不透水面提取、社会经济指标空间化估算、重大事件评估、生态环境评估等领域。目前,虽然基于夜间灯光数据的应用研究成果正在不断积累,但对成果的系统性总结、整理的研究目前存在着覆盖面不全、时效性不强等不足。基于此,论文通过对近几十年来有关夜间灯光数据的研究成果的详细梳理,从数据处理与技术方法、应用研究等方面进行归纳总结。最后,文章从多源数据融合、应用领域拓展和短周期地表灯光监测3个方面指出了未来的研究热点。
The truth of China economic growth: Evidence from global night-time light data
中国经济增长的真实性: 基于全球夜间灯光数据的检验
Artificially lit surface of Earth at night increasing in radiance and extent
Earth’s artificially lit area is expanding at 2.2% per year, with existing lit areas brightening by 2.2% per year.
Advances in using multitemporal night-time lights satellite imagery to detect, estimate, and monitor socioeconomic dynamics
DOI:10.1016/j.rse.2017.01.005 URL [本文引用: 1]
Remote sensing of night lights: A review and an outlook for the future
Nighttime light remote sensing and urban studies: Data, methods, applications, and prospects
夜间灯光遥感与城市问题研究: 数据、方法、应用和展望
Night-time light data: A good proxy measure for economic activity?
Using luminosity data as a proxy for economic statistics
DOI:10.1073/pnas.1017031108
PMID:21576474
[本文引用: 1]
A pervasive issue in social and environmental research has been how to improve the quality of socioeconomic data in developing countries. Given the shortcomings of standard sources, the present study examines luminosity (measures of nighttime lights visible from space) as a proxy for standard measures of output (gross domestic product). We compare output and luminosity at the country level and at the 1° latitude × 1° longitude grid-cell level for the period 1992-2008. We find that luminosity has informational value for countries with low-quality statistical systems, particularly for those countries with no recent population or economic censuses.
The night light development index (NLDI): A spatially explicit measure of human development from satellite data
DOI:10.5194/sg-7-23-2012 URL [本文引用: 3]
Spatial inequality, geography and economic activity
Estimating local inequality from nighttime lights
Economic inequality at the local level has been shown to be an important predictor of people’s political perceptions and preferences. However, research on these questions is hampered by the fact that local inequality is difficult to measure and systematic data collections are rare, in particular in countries of the Global South. We propose a new measure of local inequality derived from nighttime light (NTL) emissions data. Our measure corresponds to the local inequality in per capita nighttime light emissions, using VIIRS-derived nighttime light emissions data and spatial population data from WorldPop. We validate our estimates using local inequality estimates from the Demographic and Health Surveys (DHS) for a sample of African countries. Our results show that nightlight-based inequality estimates correspond well to those derived from survey data, and that the relationship is not due to structural factors such as differences between urban and rural regions. We also present predictive results, where we approximate the (survey-based) level of local inequality with our nighttime light indicator. This illustrates how our approach can be used for new cases where no other data are available.
Global inequality remotely sensed
Reliable data on economic inequality are largely limited to North America and Western Europe. As a result, we know the least about areas where inequality presents the most serious developmental policy challenge. We demonstrate that spatial variation in night-light emitted per person can reflect the distribution of income. This allows us to map global patterns and trends in economic inequality using remote sensing.
Satellite observations reveal inequalities in the progress and effectiveness of recent electrification in Sub-Saharan Africa
DOI:10.1016/j.oneear.2020.03.007 URL [本文引用: 2]
Potential of night-time lights to measure regional inequality
Night-time lights satellite images provide a new opportunity to measure regional inequality in real-time by developing the Night Light Development Index (NLDI). The NLDI was extracted using the Gini coefficient approach based on population and night light spatial distribution in Romania. Night-time light data were calculated using a grid with a 0.15 km2 area, based on Defense Meteorological Satellite Program (DMSP) /Operational Linescan System (OLS satellite imagery for the 1992–2013 period and based on the National Polar-orbiting Partnership–Visible Infrared Imaging Radiometer Suite (NPP-VIIRS) satellite imagery for the 2014–2018 period. Two population density grids were created at the level of equal cells (0.15 km2) using ArcGIS and PostgreSQL software, and census data from 1992 and 2011. Subsequently, based on this data and using the Gini index approach, the Night Light Development Index (NLDI) was calculated within the MATLAB software. The NLDI was obtained for 42 administrative counties (nomenclature of territorial units for statistics level 3 (NUTS-3 units)) for the 1992–2018 period. The statistical relationship between the NLDI and the socio-economic, demographic, and geographic variables highlighted a strong indirect relationship with local tax income and gross domestic product (GDP) per capita. The polynomial model proved to be better in estimating income based on the NLDI and R2 coefficients showed a significant improvement in total variation explained compared to the linear regression model. The NLDI calculated on the basis of night-time lights satellite images proved to be a good proxy for measuring regional inequalities. Therefore, it can play a crucial role in monitoring the progress made in the implementation of Sustainable Development Goal 10 (reduced inequalities).
An empirical assessment of human development through remote sensing: Evidences from Italy
DOI:10.1016/j.ecolind.2017.03.014 URL [本文引用: 1]
A nighttime light imagery estimation of ethnic disparity in economic well-being in mainland and Taiwan (2001-2013)
DOI:10.1080/15387216.2015.1041147 URL [本文引用: 1]
Estimating dynamics of development balance in Xinjiang autonomous region: Evidence from the nighttime lighting dataset
夜间灯光视角下的新疆发展均衡性动态研究
Human development assessment and evolution analysis on the Qinghai-Tibet Plateau
DOI:10.13249/j.cnki.sgs.2021.06.018
[本文引用: 1]
Through specific analysis of the three dimensions of night light development index (NLDI), cultural diversity and the rank-size rule, the human development level of the Qinghai-Tibet Plateau in different periods is evaluated. The results show that: 1) Since the 21st century, human development in the Qinghai-Tibetan Plateau has been improved year by year, but the overall level of human development is still below average level. There are some spatial differences in the level of human development within the region. The night light intensity in the southeast is relatively high, showing the concentrated population distribution. 2) The areas with high ethnic diversity in the Qinghai-Tibetan Plateau mainly extend and expand along the Tibetan-Yi Corridor and Hexi Corridor. The night light intensity in the multicultural blending area is high, and the overall level of human development is on the rise. 3) The rank-size rule is used to analyze the urban scale constructed by night light intensity. A prominent problem in the urban system of the Qinghai-Tibet Plateau lies is that the maximum urban scale is still too small.
青藏高原地区人类发展水平评估及其演变分析
DOI:10.13249/j.cnki.sgs.2021.06.018
[本文引用: 1]
通过夜光发展指数(NLDI)、文化多样性和城市位序规模法则3个维度进行分析,评估不同时期青藏高原地区的人类发展水平。研究表明:① 21世纪以来,青藏高原地区人类发展水平在逐年提升,但是人类发展水平整体上还处于中等偏下水平,区域内部人类发展水平存在一定的空间差异,东南部夜间灯光强度比较高,人口分布集中;② 青藏高原民族多样性较高区域主要沿着藏彝走廊和河西走廊延伸和扩展,多元文化交融地区的夜间灯光强度高,人类发展水平总体呈上升趋势;③ 采用位序规模法则分析由夜光强度构建的城市规模,最大城市规模太小仍然是青藏高原地区城镇体系的突出问题。
Multi-scale measurement of regional inequality in mainland of China during 2005-2010 using DMSP/OLS night light imagery and population density grid data
DOI:10.3390/su71013469 URL [本文引用: 2]
Nighttime light derived assessment of regional inequality of socioeconomic development in China
DOI:10.3390/rs70201242 URL [本文引用: 2]
Research on the urban-rural integration and rural revitalization in the new era in China
DOI:10.11821/dlxb201804004
[本文引用: 1]
Cities and villages are components of a specific organism. Only the sustainable development of two parts can support the prosperous development as a whole. According to the theory of man-earth areal system, urban-rural integrated system and rural regional system are the theoretical bases for entirely recognizing and understanding urban-rural relationship. To handle the increasingly severe problems of "rural disease" in rapid urbanization, accelerating rural revitalization in an all-round way is not only a major strategic plan for promoting the urban-rural integration and rural sustainable development, but also a necessary requirement for solving the issues related to agriculture, rural areas, and rural people in the new era and securing a decisive victory in building a moderately prosperous society in all respects. This study explores the basic theories of urban-rural integration and rural revitalization and analyzes the main problems and causes of rural development in the new era, proposing problem-oriented scientific approaches and frontier research fields of urban-rural integration and rural revitalization in China. Results show that the objects of urban-rural integration and rural revitalization is a regional multi-body system, which mainly includes urban-rural integration, rural complex, village-town organism, and housing-industry symbiosis. Rural revitalization focuses on promoting the reconstruction of urban-rural integration system and constructs a multi-level goal system including urban-rural infrastructure networks, zones of rural development, fields of village-town space and poles of rural revitalization. Currently, the rural development is facing the five problems: high-speed non-agricultural transformation of agriculture production factors, over-fast aging and weakening of rural subjects, increasingly hollowing and abandoning of rural construction land, severe fouling of rural soil and water environment and deep pauperization of rural poverty-stricken areas. The countryside is an important basis for the socioeconomic development in China, and the strategies of urban-rural integration and rural revitalization are complementary. The rural revitalization focuses on establishing the institutional mechanism for integrated urban-rural development and constructs the comprehensive development system of rural regional system, which includes transformation, reconstruction and innovation in accordance with the requirements of thriving businesses, pleasant living environments, social etiquette and civility, effective governance, and prosperity. Geographical research on rural revitalization should focus on the complexity and dynamics of rural regional system and explore new schemes, models and scientific approaches for the construction of villages and towns, which are guided by radical cure of "rural disease", implement the strategy of rural revitalization polarization, construct the evaluation index system and planning system of rural revitalization, thus providing advanced theoretical references for realizing the revitalization of China's rural areas in the new era.
中国新时代城乡融合与乡村振兴
DOI:10.11821/dlxb201804004
[本文引用: 1]
城市与乡村是一个有机体,只有二者可持续发展,才能相互支撑。依据人地关系地域系统学说,城乡融合系统、乡村地域系统是全新认知和理解城乡关系的理论依据。针对日益严峻的“乡村病”问题,全面实施乡村振兴,既是推进城乡融合与乡村持续发展的重大战略,也是破解“三农”问题,决胜全面建成小康社会的必然要求。本文探讨了新时代城乡融合与乡村振兴的基础理论,剖析了乡村发展面临的主要问题,提出了问题导向的中国城乡融合与乡村振兴科学途径及研究前沿领域。结果表明:① 城乡融合与乡村振兴的对象是一个乡村地域多体系统,包括城乡融合体、乡村综合体、村镇有机体、居业协同体,乡村振兴重在推进城乡融合系统优化重构,加快建设城乡基础网、乡村发展区、村镇空间场、乡村振兴极等所构成的多级目标体系。② 中国“三农”问题本质上是一个乡村地域系统可持续发展问题,当前乡村发展正面临主要农业生产要素高速非农化、农村社会主体过快老弱化、村庄建设用地日益空废化、农村水土环境严重污损化和乡村贫困片区深度贫困化等“五化”难题。③ 乡村是经济社会发展的重要基础,城乡融合与乡村振兴战略相辅相成,乡村振兴应致力于创建城乡融合体制机制,推进乡村极化发展,按照产业兴旺、生态宜居、乡风文明、治理有效、生活富裕的要求,构建乡村地域系统转型—重构—创新发展综合体系。④ 乡村振兴地理学研究应着眼于乡村地域系统的复杂性、综合性、动态性,探究以根治“乡村病”为导向的新型村镇建设方案、模式和科学途径,为实现新时代中国乡村振兴战略提供理论参考。
Correction of DMSP/OLS night-time light images and its application in China
DMSP/OLS夜间灯光影像中国区域的校正及应用
DOI:10.3724/SP.J.1047.2015.01092
[本文引用: 1]
美国国防气象卫星搭载的业务型线扫描传感器(DMSP/OLS)获取的夜间灯光影像,可客观地反映人类开发建设活动强度,其广泛应用于城市遥感的多个领域。但该数据缺少星上的辐射校正,下载的原始影像数据集不能直接用于研究,需进行区域校正。长时间序列的DMSP/OLS夜间灯光影像数据集主要存在2个问题需在校正过程中解决:(1)原始影像数据集中的影像是非连续性的;(2)数据集中的每一期影像都存在着像元DN值饱和的现象。针对这2个问题,本文提出了一种不变目标区域法的影像校正方法,对提取出来的每一期中国区域的夜间灯光影像进行了校正,该校正方法包括相互校正、饱和校正和影像间的连续性校正。最后,为了检验校正方法的合理性与可靠性,本文将校正前后中国夜间灯光影像与GDP和电力消耗值,分别进行回归分析评价表明,校正后的影像更客观合理地反映区域经济发展的差异。
An extended time series (2000-2018) of global NPP-VIIRS-like nighttime light data from a cross-sensor calibration
DOI:10.5194/essd-13-889-2021
URL
[本文引用: 1]
. The nighttime light (NTL) satellite data have been widely\nused to investigate the urbanization process. The Defense Meteorological\nSatellite Program Operational Linescan System (DMSP-OLS) stable nighttime\nlight data and Suomi National Polar-orbiting Partnership Visible Infrared\nImaging Radiometer Suite (NPP-VIIRS) nighttime light data are two widely\nused NTL datasets. However, the difference in their spatial resolutions and\nsensor design requires a cross-sensor calibration of these two datasets for\nanalyzing a long-term urbanization process. Different from the traditional\ncross-sensor calibration of NTL data by converting NPP-VIIRS to\nDMSP-OLS-like NTL data, this study built an extended time series (2000–2018)\nof NPP-VIIRS-like NTL data through a new cross-sensor calibration from\nDMSP-OLS NTL data (2000–2012) and a composition of monthly NPP-VIIRS NTL\ndata (2013–2018). The proposed cross-sensor calibration is unique due to the\nimage enhancement by using a vegetation index and an auto-encoder model.\nCompared with the annual composited NPP-VIIRS NTL data in 2012, our product\nof extended NPP-VIIRS-like NTL data shows a good consistency at the pixel\nand city levels with R2 of 0.87 and 0.95, respectively. We also found\nthat our product has great accuracy by comparing it with DMSP-OLS radiance-calibrated NTL (RNTL) data in 2000, 2004, 2006, and 2010. Generally, our\nextended NPP-VIIRS-like NTL data (2000–2018) have an excellent spatial\npattern and temporal consistency which are similar to the composited\nNPP-VIIRS NTL data. In addition, the resulting product could be easily\nupdated and provide a useful proxy to monitor the dynamics of demographic\nand socioeconomic activities for a longer time period compared to existing\nproducts. The extended time series (2000–2018) of nighttime light data is\nfreely accessible at https://doi.org/10.7910/DVN/YGIVCD (Chen et\nal., 2020).\n
Research progress in spatialization of population data
DOI:10.11820/dlkxjz.2013.11.012
[本文引用: 2]
Readily available and accurate data on spatial population distribution is essential for understanding, and responding to, many social, political, economical and environmental issues, such as humanitarian relief, disaster response planning, environment impact assessment, and development assistance. Research on spatialization of demographic data plays an important role in grid transformation of social-economical data. Furthermore, as gridded population data can be effectively interoperate with geospatial data and remote sensing images, it is a useful supplement to census data. This paper reviewed spatialization methodologies, predictive modeling factors and typical datasets in the literature of population data spatialization research. Shortcomings of demographic data and advantages of spatial population distribution data are compared and summarized firstly. The spatialization methodologies are grouped into three categories, i.e., population distribution models from urban geography, areal interpolation methods and spatialization methods based on remote sensing and GIS. Population models from urban geography include the Clark's model and allometric growth model. The areal interpolation methods had been distinguished by point based method and area based method. Spatialization methods based on remote sensing and GIS are most widely used in nowadays, which can be further grouped into three categories for two reasons: one is the relationship between population and land use, urban area, traffic network, settlement density, image pixel characteristics, or other physical or socioeconomic characteristics, and the other is the calculation strategy. Various methods mentioned above have their own application environment and limitations. We reviewed the principles and applicability of every method in detail. After that, we generalized the frequently used factors in the spatialization process, involving land use/land cover, traffic network, topography, settlements density, night light, texture variable, and spectral reflectance. In the meantime, some typical research cases about the factors also were exemplified and analyzed. In addition, we introduced a few widely used spatial population distribution datasets or influential population spatialization projects. They consisted of China km grid population datasets, UNEP/GRID, GPW/GRUMP, LandScan, AfriPop & AsiaPop & AmriPop. The producers, resolution, characterization year and generation method of each one were presented exhaustively. Based on the above review, we discussed the current research problems and outlined research priorities in the future. The problems include the temporal inconsistency of input data, coarse resolution of demographic data, lack of in-depth study on scale effect, the scarcity of time series products and few validation works. To deal with these issues, more studies should be conducted to the following aspects: comprehension of population distribution mechanism, calculation of consistency and validation of existing datasets, application of multi-sources remote sensing data and volunteered geographic information, continuous space-time simulation of population distribution in the typical areas, sub-block-level population estimation, self-adaptive spatialization method which integrates multiple elements and multiple models. In summary, the research on spatialization of demographic data has made breakthroughs in the past two decades. Meanwhile, there are a few problems that need to be solved immediately. Since these two aspects had been reviewed as comprehensively as possible, we hope issues discussed in this paper could enlighten and promote the future study in this field.
人口数据空间化研究综述
DOI:10.11820/dlkxjz.2013.11.012
[本文引用: 2]
人口数据空间化研究旨在发掘和展现人口统计数据中隐含的空间信息,并以地理格网或其他区域划分的形式再现客观世界的人口分布,具有重要的科学意义。人口空间分布数据有助于从不同地理尺度和地理维度对人口统计数据形成有益补充,其应用广泛,相关研究方兴未艾。主要从以下3 个方面对人口数据空间化研究进行综述:① 主要空间化方法的原理及其适用性;② 空间化中用到的建模参考因素,并结合具体应用案例分析其作用机理;③ 典型人口空间化数据集。在此基础上,分析了现阶段人口数据空间化所运用的输入数据的质量和详细程度、尺度效应及时空分辨率、长时间序列数据集和精度检验等方面存在的问题;并探讨了人口数据空间化未来的研究方向。
LandScan: A global population database for estimating populations at risk
The evolution process and regulation of China's regional development pattern
DOI:10.11821/dlxb201912002
[本文引用: 1]
China's per capita GDP has reached 64520 yuan (about 10,000 US dollars). The development process of countries around the world and the inverted U-shaped curve of regional development gaps indicate that the evolution of China's regional development pattern will step into an inflection point segment and that the development gap between regions has witnessed a switch from continuing widening to narrowing. In this paper, we discuss the evolution process of China's regional development pattern over the 40 years since 1978 before the inflection point: (1) The gap in per capita GDP between the upstream areas (the top 9 most developed provinces) and the downstream (the last 8 underdeveloped provinces) increased from 407 yuan in 1978 to 53817 yuan in 2018. (2) Under the pull of export-oriented economy and non-state-owned economy, the mean center of urbanization and economic development rotates in a clockwise direction. Southeast China has become an area with accelerated economic agglomeration. (3) China's regional development pattern has presented a diamond structure with the four core regions of Beijing-Tianjin-Hebei, the Yangtze River Delta, the Pearl River Delta and Chengdu-Chongqing as the apex and the connection of adjacent regions as the boundary. The GDP in these regions accounts for about 75% of the national total. In 2020, China's regional development pattern will enter an inflection point of evolution. The form is characterized by the narrowing of the regional economic gap, which is essentially a transition from non-high-quality regional development to high-quality regional development. The high-quality development of the region is a process of growth in which the ecological and social benefits will be basically synchronized in the process of sustained economic growth, and a regional high-quality development model that is differentiated by geographical functions is presented. In the next 30 years, the regulation and optimization of China's regional development pattern should focus on three types of regions: key urbanization regions, relatively underdeveloped regions, and key areas for security, as well as inter-regional interactions according to the dual objectives of promoting regional balanced (coordinated) development and high-quality development. Establishing a space governance system with the major function zoning-strategy-planning-system as the mainstay will become the basic guarantee for regulating and optimizing the regional development pattern.
中国区域发展格局演变过程与调控
DOI:10.11821/dlxb201912002
[本文引用: 1]
2018年底中国人均GDP达到64520元(将近10000美元)。世界各国发展历程和区域发展差距倒“U”字型曲线表明,中国区域发展格局演变将步入从区域间经济发展差距持续扩大转向缩小的拐点区段。本文讨论了1978年以来拐点发生前40年间中国区域发展格局演变过程,① 处于发展上游(前8位最发达的省区)和下游(后8位欠发达省区)省区人均GDP的差距从1978年的407元增加到2018年的53817元;② 城市化和经济发展的重心在外向型经济、非公有经济的拉动下,呈顺时针方向发生旋转,中国东南地区成为经济加速集聚的区域;③ 中国区域发展格局形成以京津冀、长三角、珠三角、成渝地区四大核心区域为顶点、相邻区域的连线为边界合围成的菱形结构,其GDP占全国比重稳定在75%左右。2020年中国区域发展格局应进入演变的拐点,一方面表现为区域经济差距的缩小,另一方面则是从非高质量的区域发展向高质量区域发展的转变。区域高质量发展是在经济效益持续增长过程中,生态效益和社会效益将相向基本同步的增长过程,并呈现出因地域功能不同而分异的区域高质量发展模式。未来30年,按照促进区域均衡(协调)发展和高质量发展的双重目标要求,应把重点城市化地区、相对欠发达地区、重要安全保障区等三类区域以及区域间互动关系等为调控和优化中国区域发展格局的重点,而建立以主体功能区划—战略—规划—制度为统领的空间治理体系,将成为调控和优化区域发展格局的基本保障。
China's economic development stage and its patio-temporal evolution: A prefectural-level analysis
中国经济发展阶段及其时空格局演变特征
The new trend and coping strategies of regional development gap in China
DOI:10.1080/00130095.1966.11729834 URL [本文引用: 1]
我国区域发展差距变化的新趋势与应对策略
Evaluation of regional disparity in China based on spatial analysis
DOI:10.13249/j.cnki.sgs.2005.04.393
[本文引用: 1]
Based on the social-economic data from 1952 to 2000 in China, the question of regional disparity in China was reconsidered by using spatial analysis methods. Spatial analysis needed in social and economic science for the observed spatial values are not independent each other, i.e., (or) they don't follow the same distribution, and (or) there is a trend along different directions. In this paper, the centrographic statistic was used to estimate basic parameters about the spatial distribution. The geometric center of Chinese Mainland with the centers of arable land area, population and GDP based on provincial level data were compared. The results show that the center of population and GDP had a significant offset with the center of geometry and land use. These are the key to understand the spatial disparity in China. The centers of population have an obviously trend of shift from the east to the west of China Mainland. This may be caused by the family planning and the other polices. But the shifts of the population center will help to improve the development of the west of China. As comparison with population, the shifts of the center of GDP had a different direction. It moved to south since the 1978 while the opening-up policy was adopt in china. In other words, the south of China had more rapid increase than north since 1978. This is not consistent with the opinion that the disparity of regional economic is great from east to west in China. The different shifts of centers of population and GDP also indicates that the economy of west did not increase with the increasing of population. The shifts of population and GDP centers indicate the change of the social and economic pattern in China. The difference of them also indicates that the imbalance of development in China. The Exploratory Spatial Data Analysis (ESDA), which based on the computing spatial autocorelation and spatial heterogeneity, was also used to detect the geographical dynamics of Chinese regional disparity patterns. There are significant positive spatial autocorrelation (Moran's I)of per capita GDP in China. That is, the relatively high (low) developed province tends to be located nearby other high (low) developed provinces more often than expected due to random chance, and then each province should not be viewed as an independent observation. The econometric estimations based on geographical data (i.e. localized data) have to take into account the fact that economic phenomena do not be randomly spatially distributed. We also compared the temporal change of the spatial autocorrelation in China, and found that there is an obviously temporal increase of Moran's I since 1952 to 1995. This means that the disparity is increased in the same periods. But this trend does not keep on since 1990s because we found that the Moran's I soothed with a little fluctuating. Moran's I Scatterplots and LISA (Local Indicators of Spatial Association, LISA) cluster maps were used to test the local pattern of the Chinese economic development. The results of local statistic show that the two types of clusters (High-High and Low-Low) are increasing which means that the heterogeneous is increasing too. And this is the other indicator of the regional disparity in China.
基于空间分析方法的中国区域差异研究
