

1 引言
城市是以人为中心的“社会—经济—自然”复合生态系统,城市扩张和人口膨胀造成两方面的普遍现象:一是城市绿地系统被不断压缩和碎片化,城市居民与自然环境严重脱离;二是城市居民对城市绿地休闲服务的需求数量、质量和多样性明显增强[1]。以上现象导致城市绿地休闲服务供给能力与城市居民需求水平之间的供需失配严重。这种供需失配涉及地域平等、社会公平和环境正义等深层社会问题,需要高度重视并进行合理优化[2]。城市绿地是保障城市生态系统稳定性的关键基底,是城市居民亲近自然、参与户外休闲活动的主要场所。城市绿地所产生的休闲服务功能作为与城市居民关系最为紧密的城市生态系统服务类型之一,被视为自然环境对人类社会享有的各种休闲、娱乐和体验机会的贡献[4]。大量研究表明,城市绿地休闲服务对改善居民身心健康、促进邻里互动、提升幸福感及提高生活品质等方面具有积极作用[5-6]。因此,评价识别城市绿地休闲服务供需失衡关键区,在矛盾最突出、问题最显著、干预最迫切的区域进行精准规划,对于有效提升城市人居环境品质和可持续发展水平具有重要意义。
早在20世纪60年代初,Jacobs[7]、Seymour[8]、Wilkinson[9]等社会活动家和规划师就开始思考城市绿地资源分配对城市可持续发展的重要意义。经过长期的理论和实践积淀,现已形成较为丰富的成果,可总体概括为两个层面:① 在研究视角层面,大量研究调查了城市绿地的可达性[10]、服务半径[3]、内部条件(如面积[11]、植被质量[12]、休闲设施[13])等方面的内容;也有研究讨论了城市绿地的用户体验[14]、便捷性、舒适性、满意度[15]及休闲活力[16];② 在研究方法层面:部分研究基于遥感数据和GIS平台评价绿地休闲服务的空间绩效[3],部分学者使用公众参与地理信息系统(PPGIS)绘制城市绿地休闲服务的空间分布,弥补了以主观认知为驱动的休闲服务映射方法的局限[17];部分研究使用货币化经济模型[18]或生物物理指标来衡量城市居民对城市绿地休闲服务的需求期望,尤其在局部空间尺度[19]。总体而言,既有研究提高了数据获取及评价结果的效率,但尚不能精准反映不同社会群体及社会功能主导的人群分布对城市绿地休闲服务的实际需求[20];单方面考虑城市绿地休闲服务的“供给能力”或“需求水平”的研究较多,但对于供需体系间的互动关系论证不足;有限的休闲服务供给能力与日益增长的需求水平之间的矛盾现实尚未得到根本解决。生态文明战略引领下,“以人为本”新型城镇化更加重视人本需求,强调人与自然的互利共生,以及城市绿地休闲服务的质量提升与分配正义。因此,探究城市绿地休闲服务的供需关系,是提升城市休闲服务供给能力、满足城市居民多元需求的重要突破口。
厦门岛是闽南金三角经济区的中心城市,城市发展建设成熟,具有高密度城区的典型特征;同时,厦门岛城市绿地资源趋紧,休闲服务供需矛盾典型。鉴于此,本文以厦门岛为例,重点探讨休闲服务供给和人本需求之间的空间匹配关系,旨在精准识别城市绿地休闲服务供需失衡关键区,并明确规划干预优先级,为有效提升城市绿地休闲服务供给效率提供科学依据。研究结果在指导城市绿地系统规划、促进“以人为本”新型城镇化目标方面具有重要实用价值。
2 研究方法与数据来源
2.1 研究区概况
厦门岛位于闽三角城市群的核心地带,是厦门市的政治、经济、文化、商业中心。国土面积157.76 km2,四周环海,是典型的岛屿型城市。同时,厦门岛位于亚热带河口海湾区域,具有丰富的城市绿地资源。近年来,城市发展带来的高密度人口和高强度活动已严重影响到城市绿地休闲服务供给能力,人本需求和生态供给之间的矛盾不断凸显,亟需借助科学方法进行优化调控。
2.2 数据来源与处理
研究数据主要涵盖栅格数据、普查数据和网络数据3种类型。① Landsat8 OLI/TIRS遥感影像数据源自地理空间数据云(
表1 基于土地利用类型的POI分类及数量特征
Tab. 1
| 用地分类 | Ⅰ级POI | Ⅱ级POI | POI数(个) |
|---|---|---|---|
| 公共管理与公共服务设施用地 | 文化设施 | 博物馆、展览馆、会展中心等 | 39 |
| 教育科研 | 高等院校、中学、小学、幼儿园、科研单位等 | 554 | |
| 医疗卫生 | 综合医院、专科医院等 | 89 | |
| 商业服务业设施用地 | 商务商业 | 大型写字楼、办公楼、购物中心等 | 155 |
| 绿地与交通设施用地 | 交通枢纽 | 火车站、长途汽车站、港口码头等 | 19 |
| 绿地与广场用地 | 绿地广场 | 公园广场、植物园、风景区等 | 577 |
2.3 指标体系与技术路线
城市绿地的丰富水平及空间分布合理性,直接关系到城市休闲服务分配的公平正义问题。本文构建了城市绿地休闲服务供需评价指标体系与研究框架(图1),主要分为4个步骤:① 从供给韧性维度和供给潜力维度两个层面,构建城市绿地休闲服务的供给能力评价指标,具体包括:生境质量指数和归一化植被指数两项指标;② 从静态需求、动态需求,以及特殊社会群体的需求偏好3个层面,构建城市绿地休闲服务的需求水平评价指标,具体包括:常住人口密度、POI核密度和特殊人群人均绿地区位熵3项关键指标;③ 基于各项指标评价结果及权重,确定供需综合指数;使用象限划分和优先级指数,识别供需失衡关键区,划分规划干预优先级。
图1
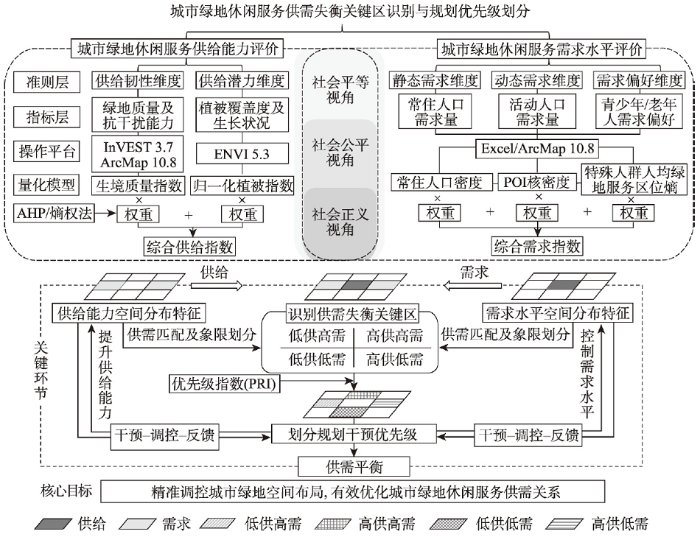
图1
城市绿地休闲服务供需评价指标体系与技术路线
Fig. 1
Supply and demand evaluation index system and technical route of urban green space recreational service
本文的基本研究单元为城市路网划分而成的街区地块,主要基于两方面的背景支撑。首先,街区是城市形态结构、城市功能、城市管理的基本组织单元,以街区地块为研究单元可与规划体系无缝衔接,是城市规划领域的重要分析尺度。其次,街区地块是重要的人文地理单元,也是地理学空间单元划分的重要类型之一[21],从街区尺度探究城市绿地休闲服务供需机理,是对地理学范畴研究尺度的细化和推进落实。综上,基于街区尺度解决城市绿地休闲服务失衡问题具有重要的理论基础和现实意义。
2.4 城市绿地休闲服务供给能力评估
2.4.1 生境质量指数
式中:Dxj为土地利用类型j中栅格单元x的生境退化度;R为生境胁迫因子数量,根据厦门岛的实际情况,本文选取机场、港口、铁路、主干道、次干道、城市建设用地作为生境胁迫因子;Yr是生境胁迫因子
生境质量指数计算公式如下[23]:
式中:Qxj为土地利用类型j中栅格x的生境质量,Qxj取值范围为[0,1],其值越大表明生境质量越好;Hj为土地利用类型
2.4.2 归一化植被指数
2.5 城市绿地休闲服务需求水平评价
2.5.1 常住人口密度
2.5.2 POI核密度
式中:fx为x处要素的密度估计值;h为带宽,x-xi为第
2.5.3 特殊人群人均绿地区位熵
本文借鉴区位熵方法[33],使用青少年/老年人人均绿地区位熵(
式中:Tds为空间单元内的公园绿地面积;Pdw为空间单元内的特殊人口数量;Tqs为研究区域内的公园绿地总面积;Pqw为研究区域内的特殊人口总数。如果一个空间单元的LQz小于1,则表明该空间单元内的特殊人群人均城市绿地休闲服务需求水平高于研究区域内的特殊人群人均城市绿地休闲服务需求水平;反之亦然。
2.6 供需失衡关键区识别与干预优先级划分
2.6.1 城市绿地休闲服务供需综合评价
基于单项指标因子,构建城市绿地休闲服务供/需综合指数(
式中:a、b、c为休闲服务供/需指标因子,采用标准化处理以消除不同指标之间的量纲差异。β1、β2、β3为各指标因子所对应的权重系数,权重由层次分析法(AHP)和熵权法确定(表2)。
表2 指标含义及权重
Tab. 2
| 指标类型 | 指标含义 | 属性 | 权重 | |
|---|---|---|---|---|
| 供给指标 | 生境质量指数 | 绿地系统对外部胁迫因子的敏感程度 | 正向 | 0.53 |
| NDVI指数 | 绿地系统自身植物的生长状况 | 正向 | 0.47 | |
| 需求指标 | 常住人口密度 | 以居住功能主导的休闲服务静态需求 | 正向 | 0.34 |
| POI核密度 | 以商业功能主导的人口集聚所产生的休闲服务动态需求 | 正向 | 0.34 | |
| 特殊人群人均绿地服务区位熵 | 特殊社会群体对城市绿地休闲服务的需求偏好 | 负向 | 0.32 | |
2.6.2 城市绿地休闲服务供需空间集聚特征识别
局部空间自相关模型可反映某一空间单元的属性值同其邻接空间单元上同一属性值的相关性和空间聚集程度,有助于识别属性值的显著性热点和冷点[35]。本文使用单变量局部空间自相关模型,识别城市绿地休闲服务综合供/需指数的空间集聚特征。具体操作过程通过GeoDA软件实现。
2.6.3 城市绿地休闲服务供需失衡关键区识别
2.6.4 规划干预优先级划分
为进一步指导规划实践,引入优先级指数(Priority Index, PRI)[38]对“供需失衡”关键区进行优先级划分,计算公式如下:
式中:Dp为常住人口密度;fx为POI核密度指数;LQz为特殊人群人均绿地区位熵,三者共同反映城市绿地休闲服务综合需求水平。Qxj为生境质量指数;N为NDVI指数,二者共同反映城市绿地休闲服务综合供给能力。当需求越大,供给越小时,PRI越大,表明该地区的规划干预优先级越高。
3 结果分析
3.1 城市绿地休闲服务供给能力及空间分布特征
3.1.1 单项供给指标及空间分布特征
将生境质量划分为5个等级,结果显示,在外部胁迫因子影响下,厦门岛的生境质量总体呈现出“南优北差,点状分布”的空间特征,“良好”级别以上的生境面积占21.57%。同时,NDVI高值区与生境质量高值区主要分布在厦门园林植物园、御屏山、厦门大学、狐尾山公园、五缘湾湿地公园等地,表明这些区域不仅具有良好的生境基础条件和适应外部环境胁迫因子的能力,而且具有较高的植被覆盖度和较好的植物生长状况。综合生境质量和NDVI指数结果发现,厦门岛南部和西部片区具有较好的城市绿地休闲服务供给基础,而中部、北部和东部片区的供给基础整体较为薄弱(图2)。
图2
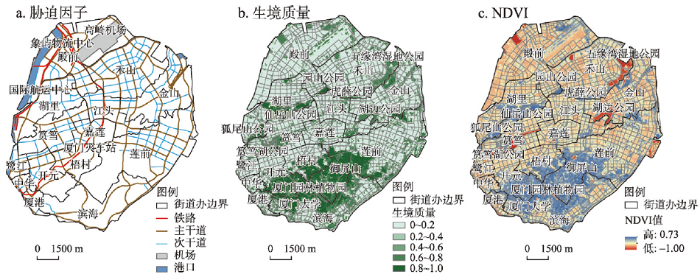
图2
厦门岛胁迫因子、生境质量及NDVI空间分布
Fig. 2
Spatial distribution of impact factors, habitat quality and NDVI
3.1.2 综合供给能力及空间分布特征
图3
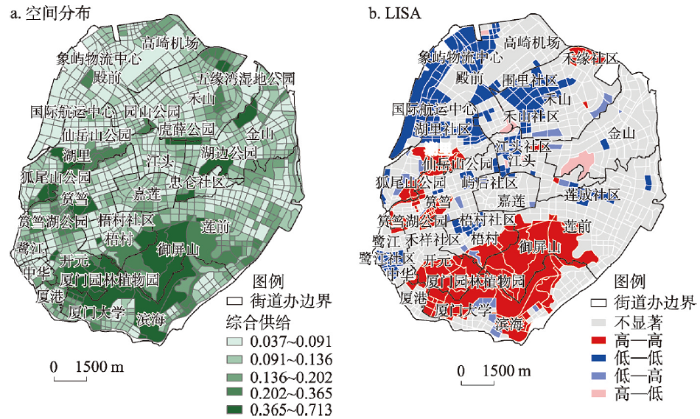
图3
厦门岛城市绿地休闲服务供给能力空间分布及LISA
Fig. 3
Spatial distribution of urban green space recreational service supply and distribution map of LISA
3.2 城市绿地休闲服务需求水平及空间分布特征
3.2.1 单项需求指标及空间分布特征
单项需求指标结果显示,厦门岛常住人口密度在空间分布上差异较大,呈现出由城市中心向周边地区梯度递减的空间分布趋势(图4a)。高密度区(Dr>500人/hm2)主要分布于中部及西南部片区,包括塘边社区、江村社区、屿后社区及鹭江社区等片区;低密度区(Dr<200人/hm2)主要分布于北部、南部及环岛片区。POI核密度与常住人口密度具有空间分布差异,呈现“总体均质、片区集中”的空间集聚特征(图4b)。高密度(fx>15)地区主要分布于北部的殿前社区、围里社区、马垅社区,中部的屿后社区、龙山社区,以及西南部的禾祥社区、思南社区及厦门大学片区;低值区(fx<10)主要分布于高崎国际机场、湖边水库、御屏山及厦门园林植物园片区。特殊人群人均绿地服务区位熵空间分布结果显示(图4c),高需求区(LQz<1.000)相对分散,点状分布于厦门岛中部、东部及西部片区,表明以上片区中,青少年和老年人等特殊社会群体的人均城市绿地休闲服务需求水平高于研究区总体需求水平。
图4
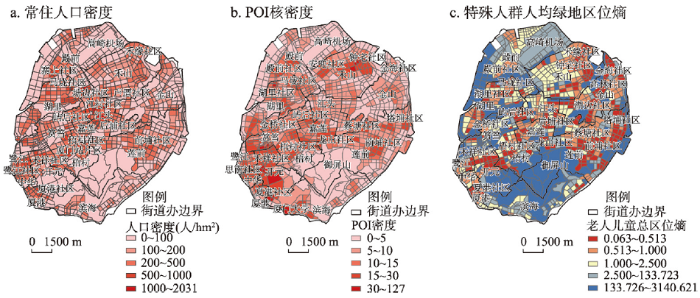
图4
厦门岛常住人口密度、POI核密度及特殊人群人均绿地服务区位熵空间分布
Fig. 4
Spatial distribution of permanent population density, POI kernel density and per capita green space location entropy for special populations
3.2.2 综合需求水平及空间分布特征
基于单项需求指标评价结果及权重,得到厦门岛城市绿地休闲服务综合需求水平(图5a)。结果显示,厦门岛城市绿地休闲服务需求水平的空间分布不均,高值区(BId>0.188)主要集中在北部的殿前社区、寨上社区、马垅社区和钟宅社区,中部的屿后社区、蔡塘社区、龙山社区、梧村社区,及西南部的思南社区和夏港社区。表明以上片区中居民对城市绿地休闲服务的需求水平较高。同时,LISA结果显示(图5b),在95%的置信区间内,城市绿地休闲服务综合需求的Moran's I指数为0.335,表明在街区尺度的城市绿地休闲服务需求水平具有明显的局部空间集聚特征。高—高热点区主要分散于西南部及中部片区,以上片区中城市居民对城市绿地休闲服务的需求水平整体偏高,需要重点优化调控;低—低冷点区主要集中在南部山区、北部机场、港口及东部湿地片区。
图5
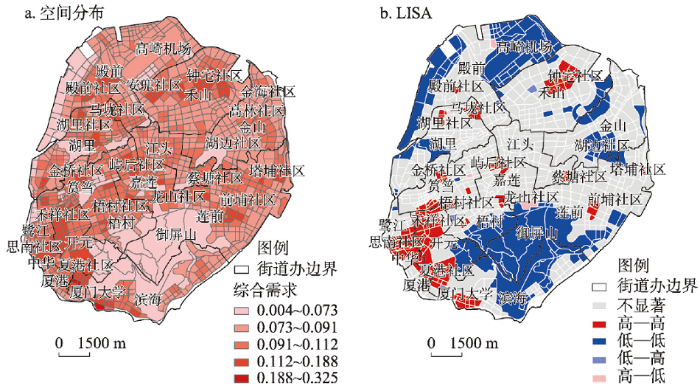
图5
厦门岛城市绿地休闲服务需求水平空间分布及LISA
Fig. 5
Spatial distribution of urban green space recreational service demand and distribution map of LISA
3.3 供需失衡关键区识别
基于Z-score标准化后的城市绿地休闲服务供需象限分布结果表明(图6),有387个研究单元处于低供—高需状态(第Ⅱ象限),90个研究单元处于高供—低需状态(第Ⅳ象限)。同时,城市绿地休闲服务供需空间匹配结果显示,低供—高需失衡关键区主要分布于北部的殿前社区、马垅社区、安兜社区、围里社区;中部的屿后社区、金桥社区、梧村社区;西南部的鹭江社区、思南社区、夏港社区;以及东部的蔡塘社区、何厝社区、前埔社区,这些区域面临城市绿地休闲服务供不应求的严峻挑战,是需要重点进行城市绿地修复与优化的关键区。高供—低需失衡关键区主要分布于南部的御屏山,中部的筼筜湖、狐尾山公园、仙岳公园、湖边公园及五缘湾湿地公园片区,这些区域是需要重点进行城市绿地保护与维持的关键区。
图6
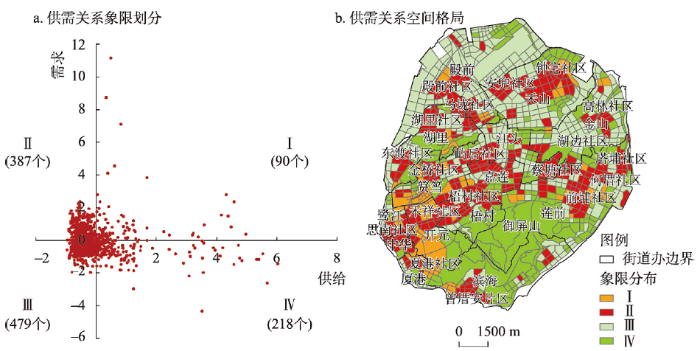
图6
厦门岛城市绿地休闲服务供需失衡关键区空间分布
Fig. 6
Spatial distribution of key areas of urban green space recreational service supply and demand imbalance
3.4 规划干预优先级划分
图7
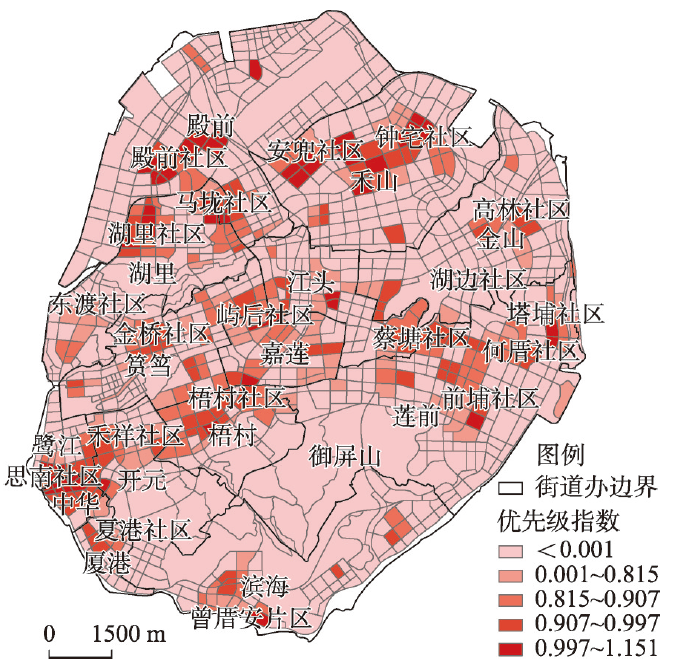
图7
厦门岛城市绿地规划干预优先级空间分布
Fig. 7
Spatial distribution of urban green space planning intervention priorities
4. 结论与讨论
4.1 结论
本文以厦门岛为例,从供需视角出发,构建了城市绿地休闲服务供需评价指标体系与研究框架。基于多源数据,应用ArcGIS、ENVI、GeoDA和InVEST等分析工具,评价了城市绿地休闲服务的供需空间特征,识别了供需失衡关键区并划分了规划干预优先级,并得出以下主要结论:
(1)受城市建设等外部胁迫因子影响,厦门岛绿地生境质量和植被生长状态均呈现“南优北差,点状分布”的空间分布特征;城市绿地休闲服务综合供给能力存在明显的局部空间集聚特征,高—高热点区集中于南部和西部片区,低—低冷点区集中于北部、中部和西南部片区。
(2)厦门岛常住人口密度呈现由城市中心向周边地区梯度递减的空间分布趋势。POI核密度与常住人口密度存在重叠、互补或错位关系,表明二者共同表征需求水平具有一定的必要性。特殊人群人均绿地服务区位熵呈现“大分散、小集中”的空间分布特征,局部片区的特殊人群人均绿地休闲服务享有率有待提高,社会正义尚需加强。城市绿地休闲服务综合需求水平与供给能力存在“空间失配”现象,需求水平高—高热点区主要分散于西南部及中部片区;低—低冷点区主要集中在南部山区、北部机场、港口及东部湿地片区。
(3)基于供需空间匹配及象限划分,可将城市绿地休闲服务供需关系划分为“高供—高需”“低供—高需”“低供—低需”和“高供—低需”4种类型。共识别出387个“低供-高需”失衡关键区,占厦门岛国土面积的25.78%,主要分布于厦门岛北部、中部、及西南部的部分社区,这些区域面临城市绿地休闲服务供不应求的严峻挑战,是需要重点关注和优化的对象。
(4)使用优先级指数(PRI)将城市绿地休闲服务供需失衡关键区划分为5个规划干预优先级,有44个单元处于Ⅳ~Ⅴ级优先区,主要分布在围里社区、殿前社区、鹭江道社区、思南社区等片区,这些区域是需要优先规划干预以缓解城市绿地休闲服务供需矛盾的重点区域。
4.2 讨论
人居福祉与城市绿地休闲服务之间的关系不仅取决于绿地生境的供给能力,而且取决于人们的需求水平。目前,专注于高密度城区范围内的城市绿地休闲服务研究尚不成熟,并且多聚焦于供给侧的量化评估;如何构建供需两侧的评价指标体系,并对供需关系进行空间耦合是当前研究的难点。本文从供需视角出发,通过梳理城市绿地休闲服务供给能力与需求水平的内在逻辑,耦合城市生态系统与社会人文系统,构建了城市绿地休闲服务供需评价指标体系与研究框架,是在已有研究基础上的进一步深化和完善。
研究发现,城市绿地休闲服务综合需求水平与单项需求指标因子的空间分布特征存在局部差异,表明综合考虑常住人口静态需求、人口聚集动态需求及特殊人群需求偏好所产生的城市绿地休闲服务综合需求,相较于传统研究中单纯以常住人口人均指标确定需求量的方式更具客观性和全面性。同时,研究发现,并非所有高需求区域都面临低供给挑战;也并非所有低需求区域都面临高供给盈余。因此,统筹供需关系,识别供需失衡关键区的进步意义在于,可以准确定位“低供—高需”街区地块,在供需矛盾最突出、问题最显著、干预最迫切的地块进行重点调控,以大幅度提升高密度城区的土地利用效率,并缓解城市绿地休闲服务供需矛盾。此外,同处于“低供—高需”状态的地块数量较多、分布较广,但其失衡状态的程度存在较大差异,规划干预优先级进一步明确了规划干预次序,从城乡规划的实施过程来讲,更具目标性、精准性和可操作性。同时,本文所构建的城市绿地休闲服务供需评价指标体系和测度方法,是对高密度城区普遍存在的生态资源分配不均问题的探索性应对,因此适用于探究其他地区的城市绿地休闲服务供需状态和优化路径。
生态系统服务的供给与需求关系,是对自然生态系统和社会人文系统间复杂联动状态的表征。受限于社会经济类数据的获取难度,本文对城市绿地休闲服务需求侧的指标选择仅考虑了常住人口密度产生的静态需求,人口集聚活动产生的动态需求,及特殊人群分布所产生的需求偏好,尚未考虑建筑功能(如医院、疗养院、学校、商业)所承载的不同人群类型对城市绿地休闲服务的多元化需求差异,势必会影响需求端评价结果的全面性。同时,本文探索性的构建了城市绿地休闲服务供需评价指标体系,尚未关注各指标因子对供需水平的驱动机制和内在机理,后续研究可在该方面一步拓展延伸,通过精准控制供需变量,有效优化供需失衡状态。此外,本文重点探究了城市绿地休闲服务的供需关系及其空间分布规律,拓展了生态系统服务研究的深度,未来研究还可进一步探究其它典型城市生态系统服务类型的供需评价指标体系,以及各项服务类型间的权衡协同关系,并制定具有针对性的规划实施策略。从而为优化城市绿地空间布局、提升城市生态系统服务效率提供科学决策依据。
参考文献
Structural diversity: A multi-dimensional approach to assess recreational services in urban parks
DOI:10.1007/s13280-014-0508-9 URL [本文引用: 3]
An assessment of urban park access in Shanghai: Implications for the social equity in urban China
DOI:10.1016/j.landurbplan.2016.08.007 URL [本文引用: 1]
Assessment and valuation of recreational ecosystem services of landscapes
DOI:10.1016/j.ecoser.2018.04.011
PMID:31019877
[本文引用: 1]

Recreational ecosystem services (RES), understood as the numerous benefits people obtain from landscapes and the natural environment, are a topical area of policy, research and society. This Editorial introduces the current state of RES research, provides an overview of the 21 contributions comprising this Special Issue of Ecosystem Services, and outlines opportunities for further research. This issue's publications employ diverse methods for assessing and valuing RES at different scales in Europe and beyond. The papers present advancements in mapping and valuation, provide evidence for the contributions of biodiversity and landscapes to the generation of RES and human well-being, and shed light on distributional effects across different beneficiaries. Taken together, contributions emphasize that RES may be a prime vehicle for reconnecting people with nature with positive effects on societal well-being. The diversity of approaches currently applied in RES research reflects much creativity and new insights, for example by harnessing georeferenced social media data. Future research should aim towards harmonizing datasets and methods to enhance comparability without compromising the need for context-specific adaptations. Finally, more research is needed on options for integrating RES information in decision making, planning and management in order to enhance actual uptake in public and private decisions.
Nature and mental health: An ecosystem service perspective
Factor components and differences of the park-based recreational happiness for urban residents: A case study of Hangzhou
DOI:10.13249/j.cnki.sgs.2013.09.1074
[本文引用: 1]
In the process of rapid urbanization, the outdoor recreational resources are becoming scarcely. Although the construction of parks can promote recreational welfare and happiness for urban dwellers, few studies have focused on the recreational happiness of park users and its inherent differences, which carried great significance for urban governments to allocate the recreational facilities and services. Thus, this study, taking Hangzhou as a case, carried out a questionnaire survey on the dwellers in urban parks so as to explore the components, spatial disparities and social differences of recreational happiness for urban residents by using the methods of Principal Component Regression and Multivariate Analysis of Variance. The results show that: firstly, the park-based recreational happiness of urban residents exists three dimensions with emotional happiness as the first principal component which can be interpreted by the variables of enjoyment, relaxation and fullness, perceptional happiness as the second component which can be explained by the variables of ‘increasing efficiency at work’, ‘promoting family harmony’ and ‘enhancing personal health’, and social happiness as the third component which can be illustrated by the variables of ‘making new or old friends’, ‘developing interpersonal relationship’ and ‘improving life quality’; secondly, there exist spatial disparities for the recreational happiness of park users,with the large urban parks mainly undertaking the functions of improving the emotional and perceptional happiness and the community parks raising the social happiness for urban residents; thirdly, the four demographic variables, including income, age, education and occupation have significance influences on park-based recreational happiness, which can be further illustrated by the impact of income on the emotional happiness variable, education on social happiness, age on emotional and social happiness, and occupation on the whole components of recreational happiness. Hence the urban governances should allocate the recreational facilities in parks according to the components of recreational happiness and the characteristics of its social and spatial differences.
城市居民公园游憩幸福感的因素构成与差异分析: 以杭州市为例
DOI:10.13249/j.cnki.sgs.2013.09.1074
[本文引用: 1]
以杭州市为例,对公园游憩者进行问卷调查,运用主成分回归和方差分析法揭示游憩幸福感的因素构成、空间分异与社会差异。研究发现:城市居民的游憩幸福感主要由情感幸福感、认知幸福感和社会幸福感构成,是具有层次性的主观幸福感;公园游憩幸福感存在空间分异性,居民主要通过城市大公园游憩获取情感幸福感和认知幸福感、通过社区小公园游憩获取社会幸福感;公园游憩幸福感存在社会差异性,收入、年龄、文化程度、职业4个变量对游憩幸福感有显著影响。为此,城市政府应以游憩幸福感为核心,根据居民游憩幸福感的感知现状及其空间、社会差异特征进行公园游憩空间的建构与游憩设施配置。
The death and life of great American cities
Urban recreation planning
The golden fleece: The search for standards
DOI:10.1080/02614368500390141 URL [本文引用: 1]
A complex landscape of inequity in access to urban parks: A literature review
DOI:10.1016/j.landurbplan.2016.05.017 URL [本文引用: 1]
Increasing walking: How important is distance to, attractiveness, and size of public open space?
Factors affecting the use of urban green spaces for physical activities: Views of young urban residents in Beijing
Accessibility and usability: Green space preferences, perceptions, and barriers in a rapidly urbanizing city in Latin America
DOI:10.1016/j.landurbplan.2012.06.003 URL [本文引用: 1]
How to provide recreational services in local parks: A case study in Shanghai, China
基于分层需求的社区公园游憩服务构建: 上海实例研究
Public satisfaction of urban parks and influencing factors based on online comments data
基于网络点评数据的城市公园公众满意度及其影响因素研究
Vitality of urban parks and its influencing factors from the perspective of recreational service supply, demand, and spatial links
Urban parks provide multiple non-material benefits to human health and well-being; measuring these “intangible” benefits mainly co-produced by the spatial interactivity between dwellers and urban parks is vital for urban green space management. This paper introduced “vitality” to measure the intangible benefits of urban parks and constructed a straightforward and spatially explicit approach to assess the park vitality based on visiting intensity and recreational satisfaction rate. Freely available data of check-in comments on parks, points-of-interest (POIs), and other multi-source data from Beijing were used to assess the urban park vitality and explore the factors influencing it from the perspectives of recreational service supply, demand, and spatial linking characteristics. We found that the urban park vitalities decreased along the urban–rural gradient. The presence of water and facility density in the parks have significant positive impacts on park vitality, and high population density nearby was a positive factor. Moreover, the external higher levels of the POI-based urban function mix and density, as well as developed public transportation, were strongly associated with greater park vitality. Our research proposed a feasible and effective method to assess the park vitality, and the findings from this study have significant implications for optimizing the spatial configuration of urban parks.
Empirical PPGIS/PGIS mapping of ecosystem services: A review and evaluation
DOI:10.1016/j.ecoser.2014.10.007 URL [本文引用: 1]
Landscape, facilities and visitors: An integrated model of recreational ecosystem services
DOI:10.1016/j.ecoser.2018.02.016 URL [本文引用: 1]
Integrating supply and social demand in ecosystem services assessment: A review
DOI:10.1016/j.ecoser.2017.03.017 URL [本文引用: 1]
Mapping recreation as an ecosystem service: Considering scale, interregional differences and the influence of physical attributes
DOI:10.1016/j.landurbplan.2018.03.011 URL [本文引用: 1]
Influence of the choice of geographic unit on the response of urban thermal environment: Taking Beijing as an example
DOI:10.18306/dlkxjz.2021.06.013
[本文引用: 1]
The scale effect and spatial heterogeneity determine that the effect of the same influencing factor on ecological processes varies in different geographic units. In this study, urban thermal environmental effect, a typical urban ecological process, was examined. In view of the current situation that the thermal environmental response pattern of different geographic units has rarely been studied, four geographic units—land use type, grid, city block, and local climate area, were selected. Normalized Difference Vegetation Index (NDVI), Impervious Surface Area (ISA), and Modified Normalized Difference Water Index (MNDWI)—the commonly used indices for landscape components, were used as the impact factors of thermal environment to explore the differences in the response pattern of urban thermal environment in different geographic units. The urban area of Beijing Municipality as redefined by point of interest (POI) data was chosen as the study area. The results show that: 1) The Pearson correlation analysis of single factor and land surface temperature shows that the block and grid are the division units, and the influence factors have a high correlation with land surface temperature. 2) The multi-factor regression method is more suitable for explaining the spatial variability of land surface temperature (LST). The combination of vegetation and impervious factors is in the 4-km grid unit, while the combination of vegetation and water and the combination of vegetation, water and impervious factors is the strongest in explaining the spatial variability of LST in the local climate zone unit. This paper provides a basis for the selection of the influencing factors of heat island in big cities in northern China, enriches the case study on the response law of thermal environmental effects at different scales, and provides a basis for the selection of appropriate research units for urban ecological environmental effects.
地理单元划分对城市热环境响应规律的影响: 以北京为例
DOI:10.18306/dlkxjz.2021.06.013
[本文引用: 1]
尺度效应及空间异质性决定了同一种影响因子在不同地理单元中对生态过程的作用程度存在差异。论文选择城市热环境效应这一典型城市生态过程为研究对象,针对地理单元划分对热环境效应响应规律研究较少的现状,选择土地利用分类、网格、街区、局地气候区4种地理单元,选取常用景观组分指标——归一化差值植被指数(normalized difference vegetation index, NDVI)、不透水面比例(impervious surface area, ISA)和改进的归一化差值水体指数(modified normalized difference water index, MNDWI)为热环境影响因子,探究不同地理单元中城市热环境对景观组分响应规律的差异。以POI数据重新定义的北京市城区为研究区,结果表明:① 单因子与地表温度Pearson相关性分析得出街区和网格作为划分单元,各影响因子与地表温度相关性较高;② 利用多因子回归方法更适合于地表温度空间分异的解释,植被和不透水面比例因子的组合在4 km网格单元,植被、水体组合及植被、水体、不透水面比例的因子组合在局地气候区单元对地表温度空间分异的解释力度最强。论文为北方大城市热岛影响因素选择提供依据,充实了不同尺度热环境效应响应规律的案例研究,并为城市生态环境效应选择适当研究单元提供依据。
Analysis on spatial and temporal changes of regional habitat quality based on the spatial pattern reconstruction of land use
DOI:10.11821/dlxb202001012
[本文引用: 2]
Habitat quality determines the status of regional biodiversity which is an important reflection of ecosystem service function and health. Research on the habitat quality change is of great significance for regional ecological security. The reconstruction of regional spatial pattern of habitat quality can restore the background of ecological environment in historical periods and provide scientific support for revealing the evolution law of regional ecological environment quality. This study selected ten driving factors (elevation, slope, aspect, GDP, population, temperature, rainfall, river distance, urban distance and coastline distance) to build CA-Markov model parameters and simulate the historical land use data. The spatial pattern of habitat quality was rebuilt by InVEST model, and the classification and statistics of habitat degradation and habitat quality were examined. The results showed that: (1) The Kappa coefficient is 0.88, which proves that the land use spatial pattern reconstruction method is feasible. On this basis, the simulation of habitat quality is valid. (2) During 1975-2010, the degree of habitat degradation increased gradually and the spatial distribution of it showed a regular pattern of circle layer change. The habitat quality decreased steadily. The high-value areas were mainly distributed in mountainous areas, while the low-value areas were mostly distributed across built-up areas. In this period, the low-value areas gradually engulfed the high-value areas around, and the habitats of the high-value areas tended to be fragmented. (3) In 1975-2010, the spatio-temporal variations of habitat quality indicated that the region with the worst habitat quality were difficult to recover; the regions with the poor habitat quality accounted for 6.40% of the total area, which were prone to deteriorate and occur around the built-up areas; the areas with the best or better habitat quality grades accounted for 5.68% of the total area, which could be easily transformed into the poor and worst habitat grades, making the habitat more scattered. (4) There was a marked change with land use of study areas during 1975-2010, which had a huge impact on the quality of the habitat. The above results show that the habitat quality of the study area decreases gradually. More than 60% of the regions have poor or even worst habitat quality. Construction land is the biggest factor threatening the habitat quality.
基于土地利用格局重建的区域生境质量时空变化分析
DOI:10.11821/dlxb202001012
[本文引用: 2]
区域生境质量决定了区域内生物多样性状况,是生态系统服务功能和生态系统健康程度的重要体现,生境质量变化研究对区域生态安全具有重要的意义,重建区域生境质量空间格局可以还原历史时期的生态环境本底,为揭示区域生态环境质量演变规律提供科学支撑。选取高程、坡度、坡向、GDP、人口、温度、降雨量、河流距离、城市距离和海岸线距离10个土地利用变化驱动因子,构建CA-Markov模型参数,模拟得到历史土地利用空间数据。在此基础上,运用InVEST模型重建泛长三角地区生境质量空间格局,并对计算得到的生境退化度指数和生境质量指数进行等级划分与统计分析。结果表明:① 土地利用模拟精度验证结果显示Kappa系数为0.88,土地利用空间格局重建方法可行,可以在此基础上开展生境质量模拟研究。② 泛长三角地区1975—2010年生境退化度逐期上升,生境退化等级在空间分布上呈圈层递变分布规律。生境质量则表现为逐期下降,高值区主要分布于山区,低值区大部分位于建成区;1975—2010年期间,低值区逐渐向周边高值区域演变,生境高值区域趋于破碎化。③ 1975—2010年生境质量时空变化特征表明:生境质量差等级区域,其生境难以修复,维持原状居多;生境质量较差等级区域易继续恶化,且易发生在建成区周边区域,占比为研究区总面积的6.40%;生境等级为良好和优等的区域,其生境等级易转换为差等和较差等级,使得该区域的生境破碎化,该类型的面积占比为研究区总面积的5.68%。④ 1975—2010年期间,研究区土地利用变化显著,对生境质量造成了巨大的影响;研究区生境质量逐期变差,其生境质量等级位于较差及以下区域面积占比均达到了60%以上,建设用地为生境质量最大的威胁因子。
Spatiotemporal change of landscape biodiversity based on InVEST model and remote sensing technology in the Bailong River watershed
DOI:10.13249/j.cnki.sgs.2018.06.018
[本文引用: 2]
Biodiversity is the material foundation and the environment guarantee that people are taken for their survival and development, and has four levels: molecular, species, ecosystem and landscape. The identification and understanding of the spatiotemporal variation of biodiversity in the landscape level are not just an important part of regional biodiversity monitoring and assessment, but also the first step in the formulation and implementation of the protection scheme. The Bailong River Watershed of the Gansu Province (BRWGP), one of the most abundant biodiversity regions in China, locating in the transitional ecotone along the Tibetan Plateau, Loess Plateau, and Qinba Mountains. The BRWGP served as a case to analyze the spatiotemporal heterogeneity of biodiversity. Based on the data integration analysis platforms of RS, GIS technology and InVEST 2.5.6, a comprehensive index system of biodiversity spatial patterns constructed with the incorporation of habitat quality, vegetation net primary productivity, and landscape state index by considering the difference of three assessment indicators intensity and influence degree. Meanwhile, AHP was used to determine the weights of index and GIS spatial technology apply to analyze the spatial distribution and differentiation of biodiversity under the landscape geography perspective. Our goal went to revise the biodiversity evaluation module of the InVEST model and demonstrate biodiversity spatial patterns on a grid cell. The results indicated that biodiversity was high and had obvious spatial pattern variations in the BRWGP. Areas with higher biodiversity mainly distribute in the national nature reserve and forest, while the relatively poor biodiversity areas distribute in the valleys of the BRWGP between Zhouqu-Wudu-Wenxian, the valley of Minjiang in Tanchang County, alpine mountain snow regions, and bare rock zones. Moderate biodiversity areas appeared in agroforestry ecosystem, shrub and grassland, which a vegetation cover, species richness and habitat quality were general. In 1990-2010, biodiversity was high and increasing, the area proportion of higher biodiversity (critical areas) increased from 16.74% to 26.02%. Meanwhile, the high growth area of biodiversity change was concentrated in the ecological engineering zone and forest districts (Such as these forest districts of Duoer, Axia, the Minshan Mountain, Baishuijiang Nature Reserve), while biodiversity reduction area locates in the region of human activities intensively and frequently, such as cultivated area, urban and rural areas.
基于遥感和InVEST模型的白龙江流域景观生物多样性时空格局研究
DOI:10.13249/j.cnki.sgs.2018.06.018
[本文引用: 2]
以甘肃白龙江流域为例,结合遥感、GIS技术和InVEST模型,从景观地理学角度选取区域生境质量、植物净初级生产力和景观状态指数为评价指标,构建区域景观尺度上生物多样性空间格局综合评估方法,并在栅格像元尺度上开展白龙江流域景观生物多样性时空变化特征分析。结果表明:白龙江流域景观生物多样性空间格局差异显著,其生物多样性高值区主要集中在自然保护区和林业管护区,低值区主要分布在舟曲-武都-文县的白龙江两岸及其以北区域、宕昌县岷江沿岸、高寒稀疏植被区和高山积雪-裸岩区。1990~2010年,流域景观生物多样性较为丰富,整体呈现不断增长的趋势,个别局部区域减弱,其增长区主要体现在生态工程实施区和林业管护区,减少区多分布在人类活动频繁的城乡农耕区和灾害多发区。
Using GIS-linked Bayesian Belief Networks as a tool for modelling urban biodiversity
DOI:10.1016/j.landurbplan.2019.05.012
[本文引用: 1]
The ability to predict spatial variation in biodiversity is a long-standing but elusive objective of landscape ecology. It depends on a detailed understanding of relationships between landscape and patch structure and taxonomic richness, and accurate spatial modelling. Complex heterogeneous environments such as cities pose particular challenges, as well as heightened relevance, given the increasing rate of urbanisation globally. Here we use a GIS-linked Bayesian Belief Network approach to test whether landscape and patch structural characteristics (including vegetation height, green-space patch size and their connectivity) drive measured taxonomic richness of numerous invertebrate, plant, and avian groups. We find that modelled richness is typically higher in larger and better-connected green-spaces with taller vegetation, indicative of more complex vegetation structure and consistent with the principle of 'bigger, better, and more joined up'. Assessing the relative importance of these variables indicates that vegetation height is the most influential in determining richness for a majority of taxa. There is variation, however, between taxonomic groups in the relationships between richness and landscape structural characteristics, and the sensitivity of these relationships to particular predictors. Consequently, despite some broad commonalities, there will be trade-offs between different taxonomic groups when designing urban landscapes to maximise biodiversity. This research demonstrates the feasibility of using a GIS-coupled Bayesian Belief Network approach to model biodiversity at fine spatial scales in complex landscapes where current data and appropriate modelling approaches are lacking, and our findings have important implications for ecologists, conservationists and planners.
Modeling aboveground biomass using MODIS images and climatic data in grasslands on the tibetan plateau
DOI:10.5814/j.issn.1674-764x.2017.01.006
[本文引用: 1]
Accurate quantification of aboveground biomass of grasslands in alpine regions plays an important role in accurate quantification of global carbon cycling. The monthly normalized difference vegetation index (NDVI), enhanced vegetation index (EVI), mean air temperature (Ta), ≥5℃ accumulated air temperature (AccT), total precipitation (TP), and the ratio of TP to AccT (TP/AccT) were used to model aboveground biomass (AGB) in grasslands on the Tibetan Plateau. Three stepwise multiple regression methods, including stepwise multiple regression of AGB with NDVI and EVI, stepwise multiple regression of AGB with Ta, AccT, TP and TP/AccT, and stepwise multiple regression of AGB with NDVI, EVI, Ta, AccT, TP and TP/AccT were compared. The mean absolute error (MAE) and root mean squared error (RMSE) values between estimated AGB by the NDVI and measured AGB were 31.05 g m<sup>-2</sup> and 44.12 g m<sup>-2</sup>, and 95.43 g m<sup>-2</sup> and 131.58 g m<sup>-2</sup> in the meadow and steppe, respectively. The MAE and RMSE values between estimated AGB by the AccT and measured AGB were 33.61g m<sup>-2</sup> and 48.04 g m<sup>-2</sup> in the steppe, respectively. The MAE and RMSE values between estimated AGB by the vegetation index and climatic data and measured AGB were 28.09 g m<sup>-2</sup> and 42.71 g m<sup>-2</sup>, and 35.86 g m<sup>-2</sup> and 47.94 g m<sup>-2</sup>, in the meadow and steppe, respectively. The study finds that a combination of vegetation index and climatic data can improve the accuracy of estimates of AGB that are arrived at using the vegetation index or climatic data. The accuracy of estimates varied depending on the type of grassland.
Evaluation of regional eco-environmental quality before and after earthquake in Jiuzhaigou county, Sichuan province
四川省九寨沟县地震前后区域生态环境质量评价
Characteristics of jobs-housing spatial distribution in Beijing based on mobile phone signaling data
DOI:10.18306/dlkxjz.2020.12.006
[本文引用: 1]
As the most important parts of urban systems, jobs and housing spaces and their balance directly affect the spatial structure of cities, the behavior and experience of the residents, and the harmony and livability of the society. This study used more than 100 million records of mobile phone signaling data, covering the whole city of Beijing and over a period of one month, to identify the jobs-housing spaces by targeting the origin-destination (OD) oriented connections applying the density-based spatial clustering of applications with noise (DBSCAN) method. Furthermore, this study explored the spatial distribution pattern and matching characteristics of Beijing's jobs and housing spaces from different spatial scales by using various measurement methods of jobs-housing balance. The spatial scales for analysis cover the whole city, ring roads, districts, and residential community and town and townships, and the methods applied include the spatial mismatch index, deviation degree, commuting flow rate, and so on. The results show that: 1) Mainly influenced by the spatial layout of the Beijing Master Plan, Beijing's housing space is characterized by dispersion at the large scale and agglomeration at the small scale, showing a pattern of scattered groupings. In contrast, its working space presents features of agglomeration at the large scale and dispersion at the small scale, retaining a significant single-centered layout. 2) Although working in local areas is the first choice for people at both the ring road scale and the district scale, there are still a great number of people works outside their residential areas. The degree of jobs-housing mismatch gradually decreases from the central city to the periphery no matter which method was adopted or at which scale. At the residential community and town and township scale, however, a more detailed feature of three-zones, with job agglomeration inside, housing agglomeration in between, and balanced distribution outside, was observed. 3) Both the general lack of jobs in certain areas caused by the high concentration of working space and the two-way commuting phenomenon in the majority of the areas caused by the high spatial concentration of jobs indicate the necessity of spatial reorganization of residential function and employment function. Specifically, for the regions with a high proportion of two-way commuting flow between them, such as Chaoyang-Changping, Tongzhou-Daxing, Haidian-Changping, Mentougou-Shijingshan, and Chaoyang-Tongzhou, further in-depth investigation should be conducted to find out the reasons for its formation and then possible industrial adjustment or functional reconstruction from the city level should be coordinated. Relying on big data, on the one hand, the job preference and demand of local residents can be identified, so the types and number of jobs in each region could be adjusted accordingly; on the other hand, the proper locations for new job and residential centers may be identified to help rearrange the land use of the whole city.
基于手机信令数据的北京市职住空间分布格局及匹配特征
DOI:10.18306/dlkxjz.2020.12.006
[本文引用: 1]
职住空间作为城市系统最重要的组成部分,直接影响了城市的形态结构、居民的行为体验以及社会的和谐宜居,长期以来受到城市研究者的关注和重视。论文利用覆盖北京全市域并持续1个月的1亿多条手机信令数据,基于DBSCAN的聚类方法,通过OD定向联系,识别出同时具备居住—就业关系特征的职住空间。在此基础上,针对北京市辖区、环路、街道乡镇等不同空间尺度,综合运用空间错位指数、职住偏离度、职住分离率、通勤流动率等计算方法,研究北京职住空间分布格局及匹配特征。研究发现:① 北京市居住空间呈现大分散、小集聚特征,就业空间呈现大集聚、小分散特征;② 基于各个空间尺度、不同测度方法的分析结果均表明,职住空间的不匹配程度呈现出由中心城区向外围逐渐降低的态势,但基于街道乡镇尺度呈现出由内向外更细化的就业集聚—居住集聚—二者均衡的三段式变化特征;③ 无论是就业空间高度集聚导致的非集聚区就业岗位数量不足,还是包括就业高集聚区在内大量区域出现的双向通勤现象,均说明居住功能和就业功能空间重组的必要性。
Heat health risk assessment in Philippine cities using remotely sensed data and social-ecological indicators
More than half of the world's population currently live in urban areas and are particularly at risk from the combined effects of the urban heat island phenomenon and heat increases due to climate change. Here, by using remotely sensed surface temperature data and social-ecological indicators, focusing on the hot dry season, and applying the risk framework of the Intergovernmental Panel on Climate Change, we assessed the current heat health risk in 139 Philippine cities, which account for about 40% of the country's total population. The cities at high or very high risk are found in Metro Manila, where levels of heat hazard and exposure are high. The most vulnerable cities are, however, found mainly outside the national capital region, where sensitivity is higher and capacity to cope and adapt is lower. Cities with high levels of heat vulnerability and exposure must be prioritized for adaptation. Our results will contribute to risk profiling in the Philippines and to the understanding of city-level heat health risks in developing regions of the Asia-Pacific.
An analysis of urban spatial structure based on POI: A case study of Beijing
基于POI的城市空间结构分析: 以北京市为例
Identifying commuting pattern of Beijing using bus smart card data
DOI:10.11821/xb201210005
[本文引用: 1]
This paper combines the one-week bus smart card data (SCD) and one-day household travel survey as well as the parcel-level land use map for identifying jobs-housing places and commuting trips in the Beijing Metropolitan Area with an area of 16,410 square kilometers. The identification result is aggregated in the bus stop and traffic analysis zone (TAZ) levels, respectively. In particular, commuting trips with commuting time and distance attached from three typical residence communities and those to five typical business zones are mapped and compared with each other to analyze commuting patterns of Beijing. The identified commuting trips are compared with those in the household travel survey in terms of commuting time and distance, indicating that our results are coincident with the survey significantly. Our approach is proved to have its potential in identifying more solid identification result based on rules extracted from existing surveys or censuses.
利用公交刷卡数据分析北京职住关系和通勤出行
Study on urban vitality based on LBS data: A case of Beijing within 6th ring road
基于位置服务数据的城市活力研究: 以北京市六环内区域为例
Applications of pointgroup density cartography based on kernel density estimation
基于核密度估计的点群密度制图应用研究
Supply and demand analysis of urban park distribution based on social equity and justice: A case study of Xuhui District
基于社会公平正义的城市公园绿地空间配置供需关系: 以上海徐汇区为例
Assessment and spatial variation of biodiversity in the Bailong River Watershed of the Gansu Province
基于综合指数法的白龙江流域生物多样性空间分异特征研究
The short-term impact of COVID-19 epidemic on the migration of Chinese urban population and the evaluation of Chinese urban resilience
DOI:10.11821/dlxb202011017
[本文引用: 1]
The COVID-19 epidemic in 2020 has a severe impact on China's national economic and social development. Evaluating the short-term impact of the COVID-19 epidemic and the recovery of China's economy and society, as well as revealing its spatiotemporal characteristics, can provide a strong support for the economic situation research and urban restoration of the normalized epidemic prevention and control stage. Based on Baidu migration big data from January 13 to April 8 in 2020 and that of the same period in history, this paper constructs the Relative Recovery Index (RRI) and Recovery Gap Index (RGI). Furthermore, it reveals the daily characteristics, stage characteristics, and spatiotemporal patterns of the short-term impact of the COVID-19 epidemic at multiple scales. The results are as follows: (1) The outbreak did not affect the travel rush before the Spring Festival. The process after the Spring Festival experienced a recovery stagnation period, a rapid recovery period, and a slow recovery period. The overall degree of recovery nationwide rose from less than 20% during the stagnation period to about 60% at the end of the rapid recovery period. The slow recovery period began on March 3, with a recovery index of over 70%. It will take a long time to fully recover to the historical level. (2) The intercity activities on weekends and in holidays were significantly weakened, especially in the central and northeastern regions. (3) The impact of the epidemic on each region is significantly different, in terms of the RRI, the western region > eastern region > central region > northeastern region. (4) The degree of recovery varies significantly between cities. From the Spring Festival to April 8th, the spatial pattern was high in the south and low in the north. According to the severity of the epidemic, Guangzhou, Shenzhen and Chongqing are in the cluster of High confirmed case-High recovery; Hebei, Tianjin, Heilongjiang, Henan, Anhui and Hunan are in the cluster of Low confirmed case-Low recovery. (5) With the effective control of the epidemic, the recovery gap has shifted from the large-scale insufficiency of labor force in the urban agglomerations such as Beijing-Tianjin-Hebei, the Yangtze River Delta, and the Pearl River Delta into the insufficiency in the central cities and some provincial capital cities. The results of this paper show that the use of spatiotemporal big data for real-time impact assessment of major public health emergencies have good application prospects.
COVID-19疫情对中国城市人口迁徙的短期影响及城市恢复力评价
DOI:10.11821/dlxb202011017
[本文引用: 1]
新型冠状病毒肺炎(COVID-19)疫情对中国国民经济和社会发展产生剧烈冲击。科学评价中国受新冠疫情短期影响及恢复情况并揭示其时空特征,可为常态化疫情防控阶段的经济形势研判和城市恢复提供有力支撑。基于2020年1月13日—4月8日百度迁徙大数据,通过构建恢复指数(RRI)和恢复缺口(RGI)等指标,从多尺度揭示中国受COVID-19疫情短期影响的逐日特征、阶段特征以及时空格局。结果发现:① 疫情未影响春节前返乡迁徙,节后恢复经历恢复停滞期、快速恢复期、平稳恢复期,全国总体恢复程度由恢复停滞期不足20%上升至快速恢复期末60%左右,3月3日开始进入平稳恢复期,恢复指数达70%以上,完全恢复至历史同期水平仍需较长时间。② 疫情对周末和节假日城市间交往活动影响显著,中部和东北地区尤为明显。③ 疫情影响的区域差异性明显,相对恢复程度西部>东部>中部>东北地区。④ 城市间恢复程度差异显著,节后至4月8日呈现南高北低空间格局。结合疫情程度,广州、深圳、重庆处于高确诊高恢复聚类,河北、天津、黑龙江、河南、安徽、湖南处于低确诊低恢复聚类。⑤ 随着疫情有效控制,城市层面恢复缺口由京津冀、长三角、珠三角等城市群的大规模成片劳动力迁入缺口,转变为国家中心城市和部分省会城市的点状缺口。本文研究结果表明时空大数据在重大突发公共卫生事件实时影响评价方面具有较好应用前景。
Dynamic analysis of an ecological security pattern relying on the relationship between ecosystem service supply and demand: A case study on the Xiamen-Zhangzhou-Quanzhou city cluster
耦合生态系统服务供求关系的生态安全格局动态分析: 以闽三角城市群为例
Identify key areas and priority levels of urban waterlogging regulation service supply and demand
城市内涝调节服务供需关键区识别与优先级划分
Fine-scale analysis of urban flooding reduction from green infrastructure: An ecosystem services approach for the management of water flows
DOI:10.1016/j.ecolmodel.2018.08.002 URL [本文引用: 2]
