

1 引言
卫星技术的发展实现了对植被动态进行大规模和连续的监测,在全球长期植被动态研究中,归一化植被指数(Normalized Difference Vegetation Index, NDVI)是使用最为广泛的光学植被指数,它基于红色和近红外反射比,提供了地球表面叶绿素丰度的度量[6]。NDVI常被用来当作植被生产力的近似指标。然而,生物量与植物结构和植被物种组成密切相关,植被“绿度”只能解释植物生物量变化的小部分[7-8]。有学者研究发现全球45.6%的植被面积在植被绿度、覆盖度和生产力方面存在不一致的趋势[9]。Ding等[9]基于NDVI和增强植被指数(Enhanced Vegetation Index, EVI)发现植被在变绿,而基于植被初级生产力(Gross/Net Primary Production, GPP/NPP)的研究发现生产力没有明显提高,特别在常绿阔叶林。Cui等[10]基于NPP的结果发现南美洲北部地区显著下降,而基于EVI、NDVI和叶面积指数(Leaf Area Index, LAI)指标均未发现。此外,以往的研究表明在估计全球绿化时,NDVI指标估计的绿化面积高于其他植被指标[11-12]。基于传统光学遥感观测的植被动态监测通常局限于绿色冠层,且易受到云和气溶胶等大气因素影响,在评估茂密的植被冠层时易饱和[13-14]。
植被光学厚度(Vegetation Optical Depth, VOD)作为被动微波遥感反演陆地上植被生物量中木本组分和叶组分含水量的指标,与传统光学遥感指标有着不同的特征[15]。VOD与地上生物量的总植被含水量成正比,包括叶状和木质成分,因此,对光合和非光合地上生物量都敏感[16]。此外,由于微波波长特性,对大气、云和光照条件的影响不敏感,尤其是在低频率(L、C和X波段)下[17]。与NDVI或EVI等表征植被绿色冠层的指标相比,VOD能够透射树冠,感知冠层以下植被组分,不同的层次和深度取决于观测频率的穿透能力,频率越低穿透能力越强[18-19]。不同VOD指数已用于监视物候[20]、干旱[21]、木本/森林覆盖[22]、植物水力学[23]以及碳储量动态[24⇓-26]。然而,目前中国仅对内蒙古[27]、南方喀斯特[24-25]和北方地区[28]的植被VOD动态变化进行了研究,对全国尺度VOD的研究仍十分缺乏。因此,开展全国植被VOD动态变化,并定量化、空间化分析气候变化和人类活动对VOD变化的影响,对于植被管理和生态环境保护具有重要意义。
自1998年以来,中国先后实施了三北防护林工程、退耕还林还草等全国范围的生态恢复工程,生态系统结构和功能发生了明显变化。目前,针对生态工程的环境效应已开展了广泛的研究,主要基于NDVI[3]、EVI[29-30]或者初级生产力[31-32]。然而,由于光学遥感植被指标自身的限制,导致基于不同指标的研究结果存在一定的偏差。鉴于此,本文基于不同频率的植被VOD数据,即AMSRU X-VOD、VODCA C-VOD、X-VOD和Ku-VOD,分析了2000—2018年间全国、不同区域及不同植被类型VOD的时空动态变化特征,并利用残差分析法,定量化、空间化区分了气候变化和人类活动的相对贡献,以期为科学评估气候和人为因素对中国植被变化的影响提供数据支持,并为未来生态工程合理调整及生态系统管理提供科学依据。
2 数据与方法
2.1 数据来源
2.1.1 植被类型数据
图1
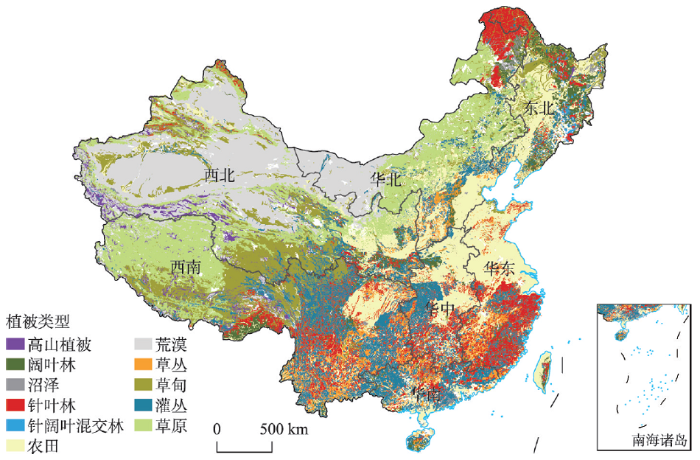
图1
中国不同植被类型的空间分布
注:基于自然资源部标准地图服务网站审图号为GS(2016)1569号标准地图制作,底图边界无修改。
Fig. 1
Spatial pattern of vegetation types in China
2.1.2 气象数据
本文使用了2000—2018年期间的气象数据,包括月平均温度、月降水量。这些数据来源于国家科技基础条件平台—国家地球系统科学数据中心黄土高原分中心(
2.1.3 VOD数据
VOD Climate Archive(VODCA)数据由维也纳工业大学提供[19](
AMSRU(Advanced Microwave Scanning Radiometer for EOS/2(AMSR-E/2))X-VOD由蒙大拿大学根据LPDR(Land parameter data record)算法设计,在美国国家冰雪数据中心(NSIDC)网站获取(
2.2 研究方法
2.2.1 Theil-Sen Median法
式中:i和j为时间序列数据;β大于0表示时间序列呈现上升趋势,β小于0表示时间序列呈现下降趋势[38]。本文使用Sen斜率来估计VOD和气候因子(辐射、降水和气温)的空间变化趋势。
2.2.2 Mann-Kendall(MK)法
一种非参数方法(不要求服从任何分布),具有较强规律性和稳定性,可以较准确地得到研究目标在一定时间尺度内的变化趋势[37]。MK的统计计算如下:
2.2.3 偏相关分析
式中:rxy为变量x与y之间的相关系数;i为样本数;
式中:rxy、rxz、ryz分别为要素x与y、x与z、y与z之间的相关系数;rxy,z为将要素z固定后要素x与y的偏相关系数。
2.2.4 各驱动因子对VOD变化的贡献
式中:θslope是VOD(x)和n之间的一元线性回归的斜率;n是年数;i是时间变量;tem、pre和rad分别表示平均气温,累计降水量和平均辐射;slope(tem)、slope(pre)和slope(rad)是tem、pre和rad对VOD年际变化的影响;slope(tem)可以由∂x/∂tem和∂tem/∂n计算而得,∂x/∂tem即VOD与tem之间线性回归的斜率,∂tem/∂n是tem和n之间线性回归的斜率,slope(pre)和slope(rad)的计算方法相同;UF是VOD实际变化与气候因子引起VOD变化之间的残差,表示未知因素对VOD变化的影响,UF中既包含人为因素,也包含一些不确定的自然因素(如自然灾害、风等),本文假设人为因素占主导地位;C(factor)表示各因子对VOD的相对贡献率。
3 结果与分析
3.1 中国植被VOD的时空动态特征
2000—2018年不同数据集均表明中国植被VOD呈极显著增加趋势(p < 0.01)(图2),其中AMSRU X-VOD上升速率最快,速率为0.062/10a,其次为VODCA X-VOD、Ku-VOD和C-VOD,增加速率分别为0.022/10a,0.014/10a和0.013/10a。华东地区VOD上升趋势最为显著(p < 0.01),其次为华南、华中、华北、西南、西北和东北地区(图3)。相比于其他VOD数据,AMSRU X-VOD在华东、华南、华中和华北地区增加幅度最大,在西北地区呈不显著下降趋势(p > 0.05)。VODCA X-VOD在华东地区增速最快,其次为西南和华中。VODCA Ku-VOD的结果表明华中地区上升趋势最快,其次为西南和西北地区,西北地区的增速高于其他VOD。与其他VOD数据相比,VODCA C-VOD变化幅度最小,其结果发现西南地区增速最高,其次为西北地区。
图2
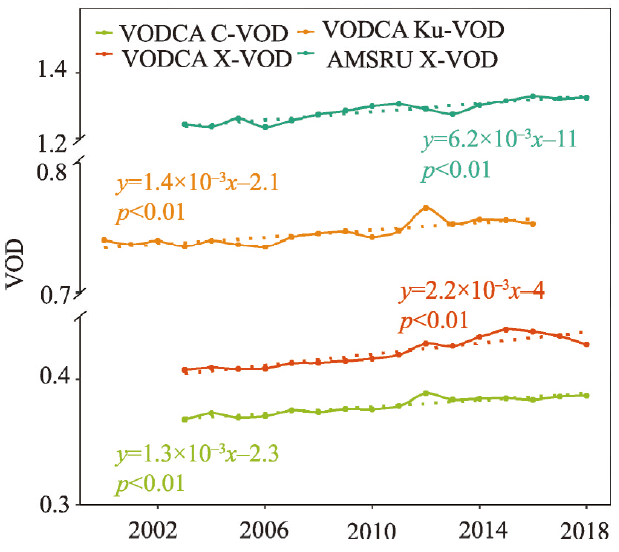
图2
2000—2018年中国植被VOD年际变化
Fig. 2
Inter-annual variation of VOD in China from 2000 to 2018
图3
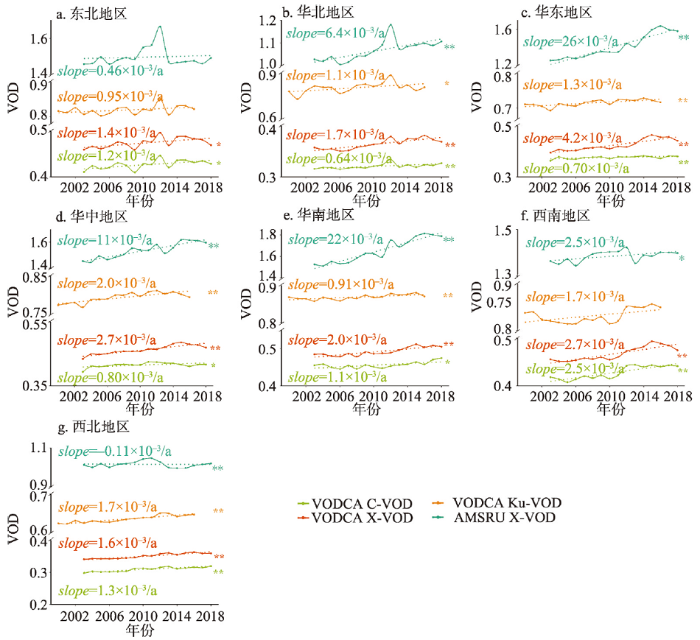
图3
2000—2018年中国不同区域植被VOD年际变化
注:*表示p<0.05,**表示p<0.01。
Fig. 3
Temporal trend of VOD in different regions of China from 2000 to 2018
不同自然植被类型VOD的趋势分析发现,草丛的增速最快,其次为针叶林、灌丛、阔叶林、草原、高山植被、草甸和针阔混合林(图4),AMSRU X-VOD在草丛、针叶林、灌丛、阔叶林、草原的增速依次降低,在草甸、高山植被和针阔混合林中呈下降趋势,而其他VOD数据集均发现草甸和高山植被呈上升趋势。VODCA X-VOD的结果发现草丛和针叶林的增速最高,其次为高山植被和灌丛,仅在针阔混合林呈不显著下降趋势(p > 0.05)。VODCA Ku-VOD和C-VOD的结果表明高山植被上升趋势最高,其次为草丛。在针阔混合林,VODCA C-VOD的结果呈不显著上升趋势(p > 0.05),而其余VOD的结果均呈不显著下降趋势(p > 0.05)。
图4
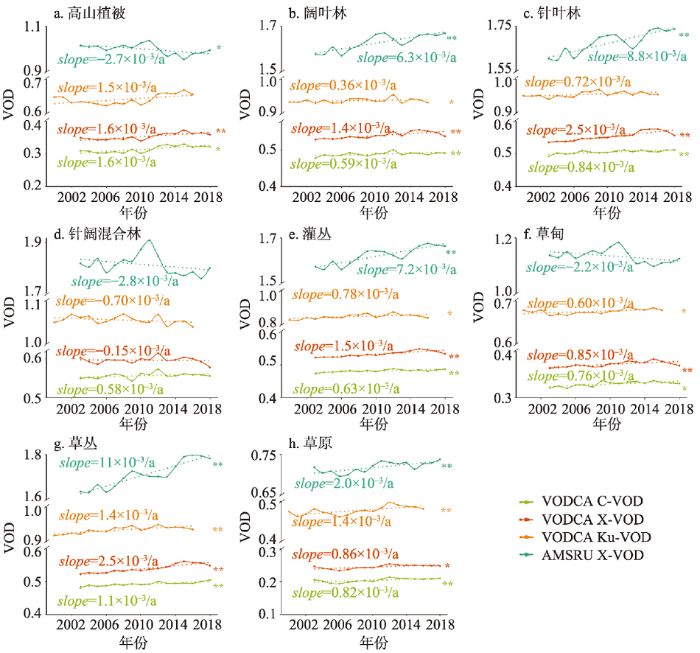
图4
2000—2018年中国不同植被类型VOD年际变化
注:*表示p<0.05,**表示p<0.01。
Fig. 4
Temporal trend of VOD for different vegetation types in China from 2000 to 2018
VOD的变化趋势均呈现一定的空间异质性,总体呈逐渐增加趋势(图5)。VODCA C-VOD、Ku-VOD、X-VOD和AMSRU X-VOD中,植被VOD增加的区域分别占中国总面积的69.03%、69.11%、80.10%和70.17%,其中显著增加的面积分别占36.19%、35.26%、49.09%和45.68%。这些地区主要集中在黄土高原、东北平原、四川盆地和华南地区。此外,基于X-VOD的结果还发现在华中和华东地区显著改善区域较多。VODCA C-VOD、Ku-VOD、X-VOD和AMSRU X-VOD中,VOD呈现显著下降的面积分别占中国总面积的8.46%、7.26%、4.04%和7.66%,在VODCA C-VOD、Ku-VOD和X-VOD中主要分布在内蒙古中东部,而在AMSRU X-VOD中主要分布在新疆西北部、青藏高原东部和大小兴安岭-长白山区。此外,VODCA C-VOD还在华东中部呈现下降趋势。
图5
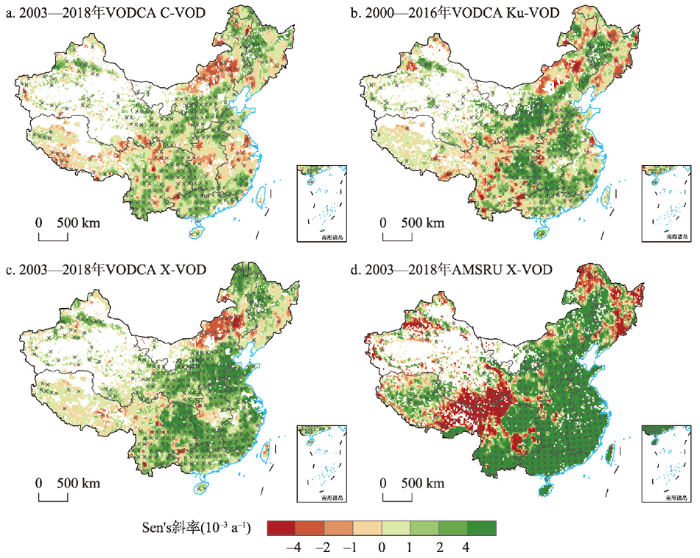
图5
中国植被VOD空间变化趋势
注:基于自然资源部标准地图服务网站审图号为GS(2016)1569号标准地图制作,底图边界无修改;图中×表示趋势显著(p<0.05)。
Fig. 5
Spatial trend of VOD in China
3.2 VOD与气候变化的偏相关分析
偏相关分析结果表明VODCA C-VOD与降水的相关性最高,辐射次之,温度最低(图6a、6e、6i)。VODCA Ku-VOD、X-VOD和AMSRU X-VOD与辐射的相关性最高(图6j~6l),降水次之(图6b~6d),温度最低(图6f~6h)。具体而言,VODCA C-VOD、Ku-VOD、X-VOD和AMSRU X-VOD中,与降水显著正相关区域分别占中国总面积的9.34%、5.17%、8.41%和10.67%,主要分布在华北地区、新疆西北部和四川盆地(图6a~6d);同时,18.11%、14.84%、16.71%和4.22%的地区与降水呈现显著负相关,主要集中在青藏高原东部、东北平原和华中地区(图6a~6d)。VODCA C-VOD、Ku-VOD、X-VOD和AMSRU X-VOD中,与温度呈显著正相关区域分别占总面积的6.34%、1.90%、7.16%和3.13%,主要分布在华南和华东地区(图6e~6h);同时,8.02%,5.84%、9.51%和9.35%的区域与温度呈显著负相关,主要集中在内蒙古中东部和华东中部(图6e~6h)。VODCA C-VOD、Ku-VOD、X-VOD和AMSRU X-VOD中,与辐射呈显著正相关的区域分别为4.14%、17.03%、23.77%和32.28%(图6i~6l),VODCA C-VOD与辐射呈显著正相关区域最少且分布较为分散(图6i),其余VOD均发现黄土高原地区与辐射相关性较高(图6j~6l),AMSRU X-VOD与辐射显著正相关区域最多,主要分布在青藏高原西部、华南、华东和华北地区(图6l);相比之下,4.48%、4.12%、6.67%和5.10%的区域与辐射呈显著负相关,主要分布在四川盆地和内蒙古中部(图6i~6l)。
图6
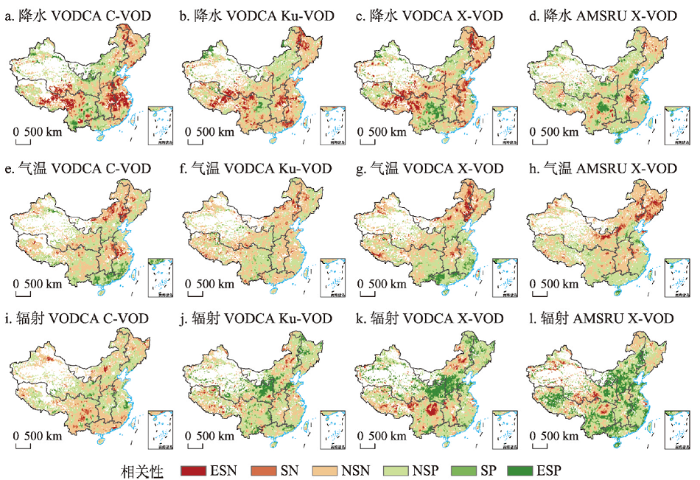
图6
VOD与降水、气温和太阳辐射之间偏相关系数的空间分布
注:基于自然资源部标准地图服务网站审图号为GS(2016)1569号标准地图制作,底图边界无修改;ESN:极显著负相关;SN:显著负相关;NSN:不显著负相关;NSP:不显著正相关;SP:显著正相关;ESP:极显著正相关。
Fig. 6
Spatial distributions of partial correlation coefficients between VOD with precipitation, temperature, and solar radiation from 2000 to 2018 in China
区域尺度上,整体上VOD与降水的平均偏相关系数在华北和西北地区为正,在华东、东北、华中和西南地区整体上为负,且相关程度依次降低;VOD与气温相关性为正的区域在西南、华东和华南地区依次增加,在东北、华北,华中和西北地区整体为负相关,且相关程度依次降低。VOD各区域均与辐射呈正相关,其中华东地区相关程度最高,其次为西北和华北地区。
3.3 人类活动和气候变化对植被活动的贡献
利用残差分析方法量化了气候因素(降水、温度和辐射)和人类活动对植被VOD变化的相对贡献(图7)。降水对全国大部分区域VOD的变化为正贡献,即降水的增加促进了VOD的增加(图7a~7d)。具体而言,降水对VODCA C-VOD、Ku-VOD、X-VOD和AMSRU X-VOD为正向贡献的面积分别占中国总面积的57.65%、56.48%、65.69%、70.21%,主要分布在华北地区和四川盆地,降水的增加还促进了中国南部地区AMSRU X-VOD的增加(图7a~7d)。气温对中国VOD的变化贡献率相对较低(图7e~7h),对VODCA C-VOD、Ku-VOD、X-VOD和AMSRU X-VOD为正向贡献的面积分别占中国总面积的51.03%、51.05%、60.65%和50.73%,增温主要促进了华南和沿海一带地区X-VOD的增加(图7e~7h)。辐射的增强对VODCA Ku-VOD、X-VOD和AMSRU X-VOD的增加起促进作用的区域面积分别占中国总面积的62.89%、70.78%和71.32%,主要集中在黄土高原和华东地区(图7i~7l)。辐射还对华南和华北地区AMSRU X-VOD呈显著正贡献,同时辐射的减弱抑制了青藏高原东部AMSRU X-VOD的增加。此外,辐射对华东、华中和青藏高原大部分地区VODCA C-VOD亦表现为负向作用。基于VODCA C-VOD、Ku-VOD、X-VOD和AMSRU X-VOD的结果发现人类活动促进全国尺度VOD增加的区域分别占中国总面积的74.31%、64.04%、72.13%和58.49%,主要分布在黄土高原、东北平原、四川盆地以东的中国东部和华南地区(图7m~7p)。同时,人类活动对内蒙古中东部的VOD(图7m~7p)、华东中部的VODCA C-VOD、Ku-VOD(图7m~7n)和新疆西北部、青藏高原东部和大小兴安岭—长白山区的AMSRU X-VOD(图7p)变化呈负向贡献。
图7
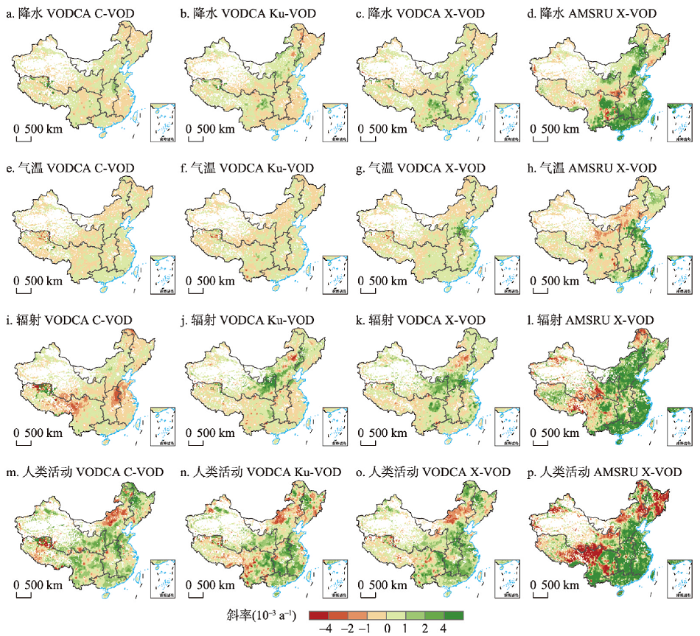
图7
2000—2018年气候因素和人类活动对VOD趋势变化的影响
注:基于自然资源部标准地图服务网站审图号为GS(2016)1569号标准地图制作,底图边界无修改。
Fig. 7
Effect of climate factors (precipitation, temperature, temperature, and solar radiation) and human activities on VOD changes from 2000 to 2018
根据中国VOD实际变化趋势以及分别受气候变化和人类活动影响的VOD变化趋势,计算得到降水对全国VODCA C-VOD、Ku-VOD、X-VOD和AMSRU X-VOD的贡献率分别为19%、14%、17%和26%,气温对VOD的贡献率相对最小,分别为5%、1%、8%和8%,辐射对VODCA Ku-VOD、X-VOD和AMSRU X-VOD为正贡献,贡献率分别为36%、32%和37%,而对VODCA C-VOD为负向贡献(95%),人类活动对VODCA C-VOD、Ku-VOD、X-VOD和AMSRU X-VOD的变化贡献率相对较大,分别为171%、48%、43%和30%(图8)。
图8
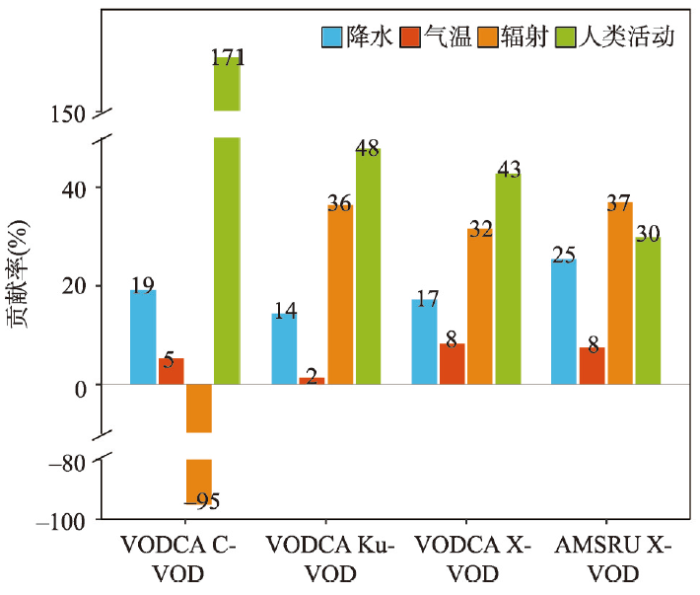
图8
2000—2018年中国气候因素和人类活动对中国VOD变化的相对贡献
Fig. 8
Relative contributions of climate factors and human activities on VOD changes in China from 2000 to 2018
在区域尺度上,VODCA C-VOD的结果表明人类活动是所有区域VOD增加的主导因素,其中对东北、华中、华东和西南地区的贡献超过了100%(图9);VODCA Ku-VOD和X-VOD的结果发现人类活动主导了中国东北、华南和华中地区VOD的增加。相比之下,AMSRU X-VOD的结果表明,人类活动仅主导了华中地区VOD的增加,而对东北和西北地区的VOD为负向贡献。气候变化主导除华中地区以外AMSRU X-VOD的增加,还主导了东北、华北、华南、西北、西南地区VODCA Ku-VOD、X-VOD以及华东地区VODCA Ku-VOD的增加。总体上,在西南地区降水相比于其他气候因子相对贡献最高,而辐射对其他区域的相对贡献最高。具体而言,辐射对东北、华中、华东和西南地区VODCA C-VOD为负贡献,降水对东北、华南地区的VODCA Ku-VOD以及华东地区的VODCA C-VOD、Ku-VOD为负贡献,气温相对贡献最低,仅对华南地区的VODCA Ku-VOD以及东北、华北、西北VODCA C-VOD、Ku-VOD为负向贡献。
图9
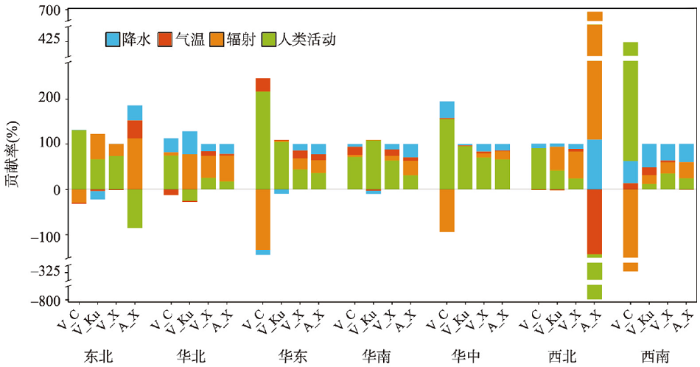
图9
2000—2018年中国气候因素和人类活动对中国七大区域VOD变化的相对贡献
注:V_C、V_Ku、V_X分别代表VODCA C-VOD、Ku-VOD、X-VOD;A_X代表AMSRU X-VOD。
Fig. 9
Relative contributions of climate factors and human activities to VOD change in seven regions of China from 2000 to 2018
4 讨论
4.1 气候因子对VOD变化的影响
本文研究表明,气候因子主导了Ku-VOD和X-VOD的增加,其中辐射贡献最大,这可能因为绿色植被冠层对光照更为敏感[41]。Ge等[31]的研究也表明辐射对全国大部分地区NPP为正贡献。2000—2018年间,华北和西北地区辐射和降水的持续增加有效地促进了植被VOD的增加(图7、图10)。中国北方植被生长主要受到水分的限制,降水的增加更有利于植被的生长[31]。北方地区气温上升会加剧水资源短缺,不利于植被生长,而对华东和华南地区植被生长具有一定的积极影响,这与基于NDVI的研究结果一致[25,42 -43]。以往研究表明温度是影响中国西南湿润区NDVI最主要的气候因素[37,44],而本文表明降水对西南地区VOD增加的贡献相对较大,尤其在四川盆地。VOD表征地上生物量中的植被含水量,足够的降水使植被能够充分利用土壤水分,而降水的增加同时会导致太阳辐射和温度下降,NDVI对辐射和温度的变化更为敏感[6,19]。以往研究表明,草原、灌丛等低密度植被群落中VOD可以与NDVI以类似的方式捕捉植被的季节周期和年际变化[17,20]。因为高频率的观测对绿色植被成分(草本植被的叶和茎、森林树木的冠和叶部分)更为敏感,二者呈现一定的一致性[18,45],例如在中国西北地区。相比之下,在中等到高度密林上,低频VOD穿透能力较强,对植物木本成分(树干,茎生物量)更为敏感,而NDVI由于饱和效应的限制无法真实反映植被变化特征,因此二者的结果呈现出一定的差异[18,45],例如在中国东北和西南地区。由此可以看出,NDVI与VOD的关系在很大程度上受植被类型和气候条件的影响。
图10
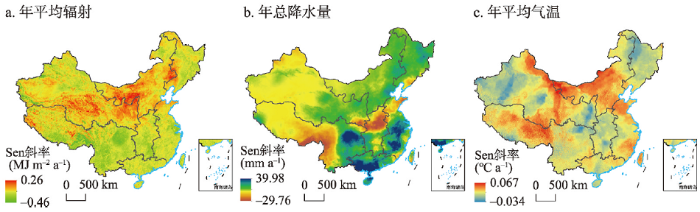
图10
2000—2018年中国辐射、降水和气温空间变化趋势
注:基于自然资源部标准地图服务网站审图号为GS(2016)1569号标准地图制作,底图边界无修改。
Fig. 10
Spatial trends of radiation, precipitation, and temperature in China from 2000 to 2018
4.2 人类活动对VOD变化的影响
人类活动是中国植被变化的主要驱动因素。由于低频C-VOD对更深层的植被(如茎生物质)更敏感,其与林下植被和地面植被总生物量关系更为密切。C-VOD的长期变化与地上植被生物量的年际波动直接相关,更能够表征植被群落的整体特征[15,18]。因此,在黄土高原、西南地区和东北平原,C-VOD的显著增加更能反映退耕还林(草)等生态工程的生态环境效益。同时,对绿色植被冠层敏感的X-VOD和Ku-VOD在这些区域也明显呈增加趋势。尽管以往的研究同样表明人类活动促进了2000年后大部分地区植被的生长,尤其在中国西南和黄土高原地区[3,20,31],但低频C-VOD更能反映植被的整体恢复状况。与C-VOD相比,人类活动对X-VOD、Ku-VOD的作用相对较弱,对华南、华中和华东有着积极作用。同时,过度放牧及快速城市化等人类活动对植被生长也产生了一定的负面影响[5],如内蒙古中东部、华东中部VODCA C-VOD、Ku-VOD和青藏高原东部、大小兴安岭—长白山区AMSRU X-VOD的退化主要是受人类活动的影响。而耿庆玲等[46]基于2000—2015年NDVI的结果显示,这些地区的植被绿色度呈增加趋势。Ge等[31]也发现人类活动导致青藏高原NPP的下降。过度放牧导致草地植被群落结构发生变化,内蒙古和青藏高原的优势草种被其他草种取代,草地生物量的下降被绿化所掩盖[27]。对于东北的大小兴安岭—长白山区的VOD下降,这可能与该地区森林火灾的频繁发生有关[47]。
本文研究表明人类活动对全国C-VOD的增加贡献超过了100%,尤其在东北、华中、华东和西南地区。基于Ku-VOD和X-VOD的结果表明人类活动对VOD变化的贡献约为30%~48%,气候变化对中国西南、西北和华北地区植被冠层的影响更为明显。涂又等[43]认为气温和太阳辐射是西南地区NDVI绿化的主要驱动因素;Chen等[32]结果表明气候因素主导了北方地区GPP的增长;Ge等[31]基于光能利用率模型MODIS NPP估算的人类活动贡献为39.94%。这些研究结果说明植被冠层更易受到气候变化的影响,而人类活动对土地利用类型的改变是大规模生物量变化的主要因素。此外,光学遥感指标只能检测冠层植被变化,并且有时会受到大气以及饱和效应的影响[13-14],而微波遥感指标VOD穿透能力强,不易被干扰,不同频率之间也存在差异[18]。由此可见,由于研究时间、数据和研究方法的不同,导致估算的结果之间存在一定的偏差,但以上研究结果均表明人类活动对区域植被变化的积极作用。
4.3 不同频率VOD结果之间的差异
本文研究结果表明2000—2018年X-VOD增速最高,C-VOD增速最低,这可能是由于更高频率获得的微波数据(X-VOD和Ku-VOD)对植被的光合活性成分(树冠和叶片)更敏感,而较低频率的C-VOD对植被的木质成分更敏感,更能够表征植被群落的整体特征[18]。由于树木生物量积累缓慢,而冠层植被变化较快,本文结果表明植被冠层的增长趋势高于植被整体生物量。冠层叶片通过对光合有效辐射的截获,吸收和透射而影响植被生长[41]。太阳光在经过冠层自上而下照射时,光强(光通量)逐渐减弱。此外,本文研究发现X-VOD更容易受到辐射的影响,有研究表明X-VOD比C-VOD和Ku-VOD能更好的估计GPP[48],而光合有效辐射则是影响光合作用过程的重要因素[41]。本文研究表明AMSRU X-VOD比VODCA X-VOD对辐射更敏感,这可能与传感器本身之间的差异和VOD计算方法的不同有关[19,36]。更低频的L-VOD比C-VOD或Ku-VOD对地上总生物量的估计更可靠,但L-VOD在中国的使用时间较短,且受到相对严重的射频干扰[18,45]。此外,微波辐射的低能量监测需要直径为几公里的更大足迹,因此与光学和热学技术相比,空间分辨率相对较低。在未来的研究中同时考虑NDVI、VOD以及其他植被指标可以更全面地描述植被动态。
5 结论
本文基于不同频率的VOD数据分析了2000—2018年中国不同区域及不同植被类型VOD的时空动态,并定量区分了气候变化和人类活动对植被VOD变化的相对贡献。主要结论如下:
(1)2000—2018年间中国植被VOD显著增加,尤其是在黄土高原、东北平原、四川盆地和华南地区。不同自然植被类型中草丛的增速最快,其次为针叶林、灌丛。不同频率VOD的结果表明植被冠层的增长速度高于植被整体生物量。
(2)VODCA C-VOD与降水的相关性最高,显著正相关和负相关区域分别占中国总面积的9.34%和18.11%,而VODCA Ku-VOD和X-VOD及AMSRU X-VOD与辐射的相关性最高,显著正相关区域分别占17.03%、23.77%和32.28%,显著负相关区域分别占4.12%、6.67%和5.10%。
(3)降水和辐射的增加促进了中国华北和西北地区VOD的增加,气温的贡献主要分布在华南和沿海地区,辐射对表征植被冠层的Ku-VOD和X-VOD的贡献较高,而对C-VOD负向贡献较高。
(4)人类活动对全国Ku-VOD和X-VOD增加的贡献率在30%~48%之间,对C-VOD变化贡献最大,尤其是黄土高原、西南地区和东北平原。由于其自身优势,VOD在植被覆盖度较高的区域更能反映植被的时空动态变化,因此,未来植被动态监测中,综合使用传统光学遥感和被动微波遥感植被指标可以有效提高评估的准确性。
参考文献
The responses of ecosystems to global warming
生态系统对全球变暖的响应
Response and adaptation of terrestrial ecosystem processes to climate warming
DOI:10.17521/cjpe.2019.0323
[本文引用: 1]

Terrestrial ecosystem consists of a series of spatiotemporal continuous, multiple scaled, and mutually connected processes. Since most of these ecological processes are regulated by temperature, climate warming will profoundly impact terrestrial ecosystems at the global scale. Recently, how key processes in terrestrial ecosystems respond and/or adapt to climate warming has become a fundamental question in global change ecology. Here, we reviewed the recent research progresses related to such question. This review focuses on those key ecosystem processes, such as plant ecophysiolgical processes, phenology, community dynamics, producitity and carbon allocation, decomposition of litter and soil organic carbon, nutrient cycling, and carbon-nitrogen coupling. Based on a literature review, we formed perspectives for future researches to tackle the fundamental question, such as the predictability of plant traits on ecosystem processes, coupling between biogochemical cycles, mechanisms driving ecosystem responses to extreme climate and asymmetric warming, and ecological forecasting with models. Based on these progresses, we finally suggest more research efforts on warming adaptation rather than response, on China’s specific ecosystems, and on the integration of experiments, observations and models for coordinating studies across scales.
陆地生态系统过程对气候变暖的响应与适应
DOI:10.17521/cjpe.2019.0323
[本文引用: 1]
陆地生态系统包含一系列时空连续、尺度多元且互相联系的生态学过程。由于大部分生态学过程都受到温度调控,因此气候变暖会对全球陆地生态系统产生深远的影响。近年来,全球变化生态学的基本科学问题之一是陆地生态系统的关键过程如何响应与适应全球气候变暖。围绕该问题,本文梳理了近年来的研究进展,重点关注植物生理生态过程、物候期、群落动态、生产力及其分配、凋落物与土壤有机质分解、养分循环等过程对温度升高的响应与适应机理。通过定量分析近二十年来发表于主流期刊的相关论文,展望了该领域的前沿方向,包括物种性状对生态系统过程的预测能力、生物地球化学循环的耦合过程、极端高温与低温事件的响应与适应机理、不对称气候变暖的影响机理和基于过程的生态系统模拟预测等。基于这些研究进展,本文建议进一步研究陆地生态系统如何适应气候变暖,更多关注我国的特色生态系统类型,并整合实验、观测或模型等研究手段开展跨尺度的合作研究。
Contribution of climatic change and human activities to vegetation NDVI change over China during 1982-2015
DOI:10.11821/dlxb202005006
[本文引用: 3]
Based on the observed daily temperature and precipitation of the land surface of 603 meteorological stations in China, the Global Inventory Modeling and Mapping Studies (GIMMS) Normalized Difference Vegetation Index (NDVI) 3rd generation dataset, the changing patterns of NDVI in China during 1982-2015 were investigated and the corresponding contributions of the main driving forces, climatic change and human activities, to these changes were distinguished using the methods of trend analysis and multiple regression residuals analysis. The results showed that vegetation recovered in whole China in research period significantly. Shanghai was the single case with a decrease in growing season NDVI in the selected 32 provincial-level administrative regions, while the growing season NDVI in Shanxi, Shaanxi, and Chongqing increased much faster compared with other regions. The climatic change and human activities drove the NDVI change jointly as main forces in China and induced both a rapid increasing trend on the whole and a huge spatial difference. The impacts of climatic change on NDVI change in the growing-season ranged from -0.01×10 -3 a -1 to 1.05×10 -3 a -1, while the impacts of human activities changed from -0.32×10 -3 a -1 to 1.77×10 -3 a -1. The contributions of climatic change and human activities accounted for 40% and 60%, respectively, to the increase of NDVI in China in the past 34 years. The regions where the contribution rates of human activities were more than 80% were mainly distributed in the central part of the Loess Plateau, the North China Plain, and the northeast and the southwest of China. There were 22 provincial-level regions where the contributions of human activities were more than 50%, and the shares of contribution induced by human activities in Shanghai, Heilongjiang, and Yunnan were much greater than those of any other regions. The results suggest that we should focus more on the role of human activities in vegetation restoration in the whole country.
1982—2015年中国气候变化和人类活动对植被NDVI变化的影响
DOI:10.11821/dlxb202005006
[本文引用: 3]
基于中国603个气象站的地表气温和降水观测资料以及GIMMS NDVI3g数据,采用变化趋势分析和多元回归残差分析等方法研究了1982—2015年中国植被NDVI变化特征及其主要驱动因素(即气候变化和人类活动)的相应贡献。结果表明:① 1982—2015年中国植被恢复明显,在选择的32个省级行政区中,山西、陕西和重庆的生长季NDVI增加最快,仅上海生长季NDVI呈减小趋势。② 气候变化和人类活动的共同作用是中国植被NDVI呈现整体快速增加和巨大空间差异的主要原因,其中气候变化对各省生长季NDVI变化的影响在-0.01×10 <sup>-3</sup>~1.05×10 <sup>-3</sup> a <sup>-1</sup>之间,而人类活动的影响在-0.32×10 <sup>-3</sup>~1.77×10 <sup>-3</sup> a <sup>-1</sup>之间。③ 气候变化和人类活动分别对中国近34年来植被NDVI的增加贡献了40%和60%;人类活动贡献率超过80%的区域主要集中在黄土高原中部、华北平原以及中国东北和西南等地;人类活动贡献率大于50%的省份有22个,其中贡献率最大的3个地区为上海、黑龙江和云南。研究结果建议应更加重视人类活动在植被恢复中的作用。
Effects of extreme drought on terrestrial ecosystems: Review and prospects
DOI:10.17521/cjpe.2019.0317
[本文引用: 1]
As an important compartment of the Earth's surface, terrestrial ecosystems act as a vital harbor for human survival and development. Climate change significantly increased the frequency, intensity and duration of drought since the 21st century, which have marked impact on ecosystems, leading to serious restriction or even threat on the sustainable development of human beings. Therefore, developing integrative research on effects of drought on terrestrial ecosystems and assessing the associated ecological risk are impressive in global change field. This study reviewed the effects of drought on plant physiological and ecological processes, biogeochemical cycles, biodiversity, and ecosystem structure and functions in terrestrial ecosystems, and discussed current hotspot issues in this field as well as deeply analyzing the existing problems and the potential development direction. This study aims to provide some suggestions for the future observation, manipulative experiments, and modeling prediction on effects of drought on terrestrial ecosystems, and offer new insights to enhance risk assessment and management under drought.
极端干旱对陆地生态系统的影响: 进展与展望
DOI:10.17521/cjpe.2019.0317
[本文引用: 1]
作为地球表层重要的组成部分, 陆地生态系统是人类生存和发展的重要场所。21世纪以来, 气候变化导致干旱事件发生的强度、频度和持续时间显著增加, 对陆地生态系统带来深远的影响, 严重制约甚至威胁人类社会的可持续发展。因此, 开展极端干旱对陆地生态系统影响的研究并评估其生态风险效应, 是当前全球变化领域的重点问题。该文从植物生理生态过程、生物地球化学循环、生物多样性、以及生态系统结构和功能四个方面综述了极端干旱对陆地生态系统的影响, 并对当前的研究热点进行探讨, 深度剖析当前研究中存在的难点问题和未来可能的发展方向。该文以期为未来开展干旱对陆地生态系统影响的观测与预测研究提供参考依据, 同时为在未来干旱影响下加强陆地生态系统风险评估和管理提供新思路。
How does urbanization affect vegetation productivity in the coastal cities of eastern China?
Analysis of the vegetation cover change and the relationship between NDVI and environmental factors by using NOAA time series data
中国地表植被覆盖变化及其与气候因子关系: 基于 NOAA 时间序列数据分析
Can vegetation productivity be derived from greenness in a semi-arid environment? Evidence from ground-based measurements
DOI:10.1016/j.jaridenv.2013.05.011 URL [本文引用: 1]
Aboveground biomass corresponds strongly with drone-derived canopy height but weakly with greenness (NDVI) in a shrub tundra landscape
Arctic landscapes are changing rapidly in response to warming, but future predictions are hindered by difficulties in scaling ecological relationships from plots to biomes. Unmanned aerial systems (hereafter ‘drones’) are increasingly used to observe Arctic ecosystems over broader extents than can be measured using ground-based approaches and are facilitating the interpretation of coarse-grained remotely sensed data. However, more information is needed about how drone-acquired remote sensing observations correspond with ecosystem attributes such as aboveground biomass. Working across a willow shrub-dominated alluvial fan at a focal study site in the Canadian Arctic, we conducted peak growing season drone surveys with an RGB camera and a multispectral multi-camera array. We derived photogrammetric reconstructions of canopy height and normalised difference vegetation index (NDVI) maps along with in situ point-intercept measurements and aboveground vascular biomass harvests from 36, 0.25 m2 plots. We found high correspondence between canopy height measured using in situ point-intercept methods compared to drone-photogrammetry (concordance correlation coefficient = 0.808), although the photogrammetry heights were positively biased by 0.14 m relative to point-intercept heights. Canopy height was strongly and linearly related to aboveground biomass, with similar coefficients of determination for point-intercept (R\n 2 = 0.92) and drone-based methods (R\n 2 = 0.90). NDVI was positively related to aboveground biomass, phytomass and leaf biomass. However, NDVI only explained a small proportion of the variance in biomass (R\n 2 between 0.14 and 0.23 for logged total biomass) and we found moss cover influenced the NDVI-phytomass relationship. Vascular plant biomass is challenging to infer from drone-derived NDVI, particularly in ecosystems where bryophytes cover a large proportion of the land surface. Our findings suggest caution with broadly attributing change in fine-grained NDVI to biomass differences across biologically and topographically complex tundra landscapes. By comparing structural, spectral and on-the-ground ecological measurements, we can improve understanding of tundra vegetation change as inferred from remote sensing.
Nearly half of global vegetated area experienced inconsistent vegetation growth in terms of greenness, cover, and productivity
A new global land productivity dynamic product based on the consistency of various vegetation biophysical indicators
DOI:10.1080/20964471.2021.2018789 URL [本文引用: 1]
The impact of indicator selection on assessment of global greening
Dense canopies browning overshadowed by global greening dominant in sparse canopies
Overview of the radiometric and biophysical performance of the MODIS vegetation indices
DOI:10.1016/S0034-4257(02)00096-2 URL [本文引用: 2]
Global monitoring of the vegetation dynamics from the vegetation optical depth (VOD): A review
Vegetation is a key element in the energy, water and carbon balances over the land surfaces and is strongly impacted by climate change and anthropogenic effects. Remotely sensed observations are commonly used for the monitoring of vegetation dynamics and its temporal changes from regional to global scales. Among the different indices derived from Earth observation satellites to study the vegetation, the vegetation optical depth (VOD), which is related to the intensity of extinction effects within the vegetation canopy layer in the microwave domain and which can be derived from both passive and active microwave observations, is increasingly used for monitoring a wide range of ecological vegetation variables. Based on different frequency bands used to derive VOD, from L- to Ka-bands, these variables include, among others, the vegetation water content/status and the above ground biomass. In this review, the theoretical bases of VOD estimates for both the passive and active microwave domains are presented and the global long-term VOD products computed from various groups in the world are described. Then, major findings obtained using VOD are reviewed and the perspectives offered by methodological improvements and by new sensors onboard satellite missions recently launched or to be launched in a close future are presented.
Satellite passive microwave remote sensing for monitoring global land surface phenology
DOI:10.1016/j.rse.2010.12.015 URL [本文引用: 3]
Global vegetation biomass change (1988-2008) and attribution to environmental and human drivers
DOI:10.1111/geb.12024 URL [本文引用: 2]
The global long-term microwave vegetation optical depth climate archive (VODCA)
DOI:10.5194/essd-12-177-2020
URL
[本文引用: 4]
. Since the late 1970s, space-borne microwave radiometers have been providing measurements of radiation emitted by the Earth’s surface. From these measurements it is possible to derive vegetation optical depth (VOD), a model-based indicator related to the density, biomass, and water content of vegetation. Because of its high temporal resolution and long availability, VOD can be used to monitor short- to long-term changes in vegetation. However, studying long-term VOD dynamics is generally hampered by the relatively short time span covered by the individual microwave sensors. This can potentially be overcome by merging multiple VOD products into a single climate data record. However, combining multiple sensors into a single product is challenging as systematic differences between input products like biases, different temporal and spatial resolutions, and coverage need to be overcome. Here, we present a new series of long-term VOD products, the VOD Climate Archive (VODCA). VODCA combines VOD retrievals that have been derived from multiple sensors (SSM/I, TMI, AMSR-E, WindSat, and AMSR2) using the Land Parameter Retrieval Model. We produce separate VOD products for microwave observations in different spectral bands, namely the Ku-band (period 1987–2017), X-band (1997–2018), and C-band (2002–2018). In this way, our multi-band VOD products preserve the unique characteristics of each frequency with respect to the structural elements of the canopy. Our merging approach builds on an existing approach that is used to merge satellite products of surface soil moisture: first, the data sets are co-calibrated via cumulative distribution function matching using AMSR-E as the scaling reference. To do so, we apply a new matching technique that scales outliers more robustly than ordinary piecewise linear interpolation. Second, we aggregate the data sets by taking the arithmetic mean between temporally overlapping observations of the scaled data. The characteristics of VODCA are assessed for self-consistency and against other products. Using an autocorrelation analysis, we show that the merging of the multiple data sets successfully reduces the random error compared to the input data sets. Spatio-temporal patterns and anomalies of the merged products show consistency between frequencies and with leaf area index observations from the MODIS instrument as well as with Vegetation Continuous Fields from the AVHRR instruments. Long-term trends in Ku-band VODCA show that since 1987 there has been a decline in VOD in the tropics and in large parts of east-central and north Asia, while a substantial increase is observed in India, large parts of Australia, southern Africa, southeastern China, and central North America. In summary, VODCA shows vast potential for monitoring spatial–temporal ecosystem changes as it is sensitive to vegetation water content and unaffected by cloud cover or high sun zenith angles. As such, it complements existing long-term optical indices of greenness and leaf area. The VODCA products (Moesinger et al., 2019) are open access and available under Attribution 4.0 International at https://doi.org/10.5281/zenodo.2575599.\n
Trends of land surface phenology derived from passive microwave and optical remote sensing systems and associated drivers across the dry tropics 1992-2012
Exploring the use of satellite observations of soil moisture, solar-induced chlorophyll fluorescence and vegetation optical depth to monitor droughts across India
Human population growth offsets climate-driven increase in woody vegetation in sub-Saharan Africa
L-band vegetation optical depth as an indicator of plant water potential in a temperate deciduous forest stand
DOI:10.5194/bg-18-739-2021 URL [本文引用: 1]
Satellite-observed major greening and biomass increase in south China karst during recent decade
DOI:10.1029/2018EF000890 URL [本文引用: 2]
Increased vegetation growth and carbon stock in China karst via ecological engineering
DOI:10.1038/s41893-017-0004-x [本文引用: 3]
Remote sensing of vegetation dynamics in drylands: Evaluating vegetation optical depth (VOD) using AVHRR NDVI and in situ green biomass data over West African Sahel
DOI:10.1016/j.rse.2016.02.056 URL [本文引用: 1]
Distinguishing the vegetation dynamics induced by anthropogenic factors using vegetation optical depth and AVHRR NDVI: A cross-border study on the Mongolian Plateau
Ecological engineering projects increased vegetation cover, production, and biomass in semiarid and subhumid northern China
DOI:10.1002/ldr.v30.13 URL [本文引用: 1]
Changes of NDVI and EVI and their responses to climatic variables in the Yellow River Basin during the growing season of 2000-2018
2000—2018年黄河流域生长季NDVI、EVI变化及其对气候因子的响应
Spatio-temporal dynamics of fractional vegetation coverage based on MODIS-EVI and its driving factors in Southwest China
基于MODIS-EVI的西南地区植被覆盖时空变化及驱动因素研究
Quantifying the contributions of human activities and climate change to vegetation net primary productivity dynamics in China from 2001 to 2016
Accelerated increase in vegetation carbon sequestration in China after 2010: A turning point resulting from climate and human interaction
DOI:10.1111/gcb.15854
PMID:34416063
[本文引用: 2]
China has increased its vegetation coverage and enhanced its terrestrial carbon sink through ecological restoration since the end of the 20th century. However, the temporal variation in vegetation carbon sequestration remains unclear, and the relative effects of climate change and ecological restoration efforts are under debate. By integrating remote sensing and machine learning with a modelling approach, we explored the biological and physical pathways by which both climate change and human activities (e.g., ecological restoration, cropland expansion, and urbanization) have altered Chinese terrestrial ecosystem structures and functions, including vegetation cover, surface heat fluxes, water flux and vegetation carbon sequestration (defined by gross and net primary production, GPP and NPP). Our study indicated that during 2001~2018, GPP in China increased significantly at a rate of 49.1~53.1 TgC/yr, and the climatic and anthropogenic contributions to GPP gains were comparable (48%~56% and 44%~52%, respectively). Spatially, afforestation was the dominant mechanism behind forest cover expansions in the farming-pastoral ecotone in northern China, on the Loess Plateau and in the southwest karst region, while climate change promoted vegetation cover in most parts of southeastern China. At the same time, the increasing trend in NPP (22.4~24.9 TgC/yr ) during 2001~2018 was highly attributed to human activities (71%~81%), particularly in southern, eastern and northeastern China. Both GPP and NPP showed accelerated increases after 2010 because the anthropogenic NPP gains during 2001~2010 were generally offset by the climate-induced NPP losses in southern China. However, after 2010, the climatic influence reversed, thus highlighting the vegetation carbon sequestration that occurs with ecological restoration.This article is protected by copyright. All rights reserved.
The nation's 1 km of the country's surface net radiating data set during 2000-2018
[DB/OL].
2000—2018年全国1k m每8天陆地表面净辐射数据集
[DB/OL].
A methodology for surface soil moisture and vegetation optical depth retrieval using the microwave polarization difference index
DOI:10.1109/36.942542 URL [本文引用: 1]
A global satellite environmental data record derived from AMSR-E and AMSR2 microwave Earth observations
DOI:10.5194/essd-9-791-2017
URL
[本文引用: 3]
. Spaceborne microwave remote sensing is widely used to monitor global environmental changes for understanding hydrological, ecological, and climate processes. A new global land parameter data record (LPDR) was generated using similar calibrated, multifrequency brightness temperature (Tb) retrievals from the Advanced Microwave Scanning Radiometer for EOS (AMSR-E) and the Advanced Microwave Scanning Radiometer 2 (AMSR2). The resulting LPDR provides a long-term (June 2002–December 2015) global record of key environmental observations at a 25 km grid cell resolution, including surface fractional open water (FW) cover, atmosphere precipitable water vapor (PWV), daily maximum and minimum surface air temperatures (Tmx and Tmn), vegetation optical depth (VOD), and surface volumetric soil moisture (VSM). Global mapping of the land parameter climatology means and seasonal variability over the full-year records from AMSR-E (2003–2010) and AMSR2 (2013–2015) observation periods is consistent with characteristic global climate and vegetation patterns. Quantitative comparisons with independent observations indicated favorable LPDR performance for FW (R ≥ 0.75; RMSE ≤ 0.06), PWV (R ≥ 0.91; RMSE ≤ 4.94 mm), Tmx and Tmn (R ≥ 0.90; RMSE ≤ 3.48 °C), and VSM (0.63 ≤ R ≤ 0.84; bias-corrected RMSE ≤ 0.06 cm3 cm−3). The LPDR-derived global VOD record is also proportional to satellite-observed NDVI (GIMMS3g) seasonality (R ≥ 0.88) due to the synergy between canopy biomass structure and photosynthetic greenness. Statistical analysis shows overall LPDR consistency but with small biases between AMSR-E and AMSR2 retrievals that should be considered when evaluating long-term environmental trends. The resulting LPDR and potential updates from continuing AMSR2 operations provide for effective global monitoring of environmental parameters related to vegetation activity, terrestrial water storage, and mobility and are suitable for climate and ecosystem studies. The LPDR dataset is publicly available at http://files.ntsg.umt.edu/data/LPDR_v2/.\n
Responding mechanism of vegetation cover to climate change and human activities in Southwest China from 2000 to 2020
2000—2020年西南地区植被NDVI对气候变化和人类活动响应特征
Rank correlation methods
Nonparametric tests against trend
DOI:10.2307/1907187 URL [本文引用: 1]
Review on forest canopy structure, radiation transfer and canopy photosynthesis
林冠结构, 辐射传输与冠层光合作用研究综述
Revealing the climatic impacts on spatial heterogeneity of NDVI in China during 1982-2013
DOI:10.11821/dlxb201903010
[本文引用: 1]
Climate change is a major driver of vegetation activity, and thus its complex processes become a frontier and difficulty in global change research. To understand the complex relationship between climate change and vegetation activity, the spatial distribution and dynamic characteristics of the response of NDVI to climate change from 1982 to 2013 in China were investigated by the geographically weighted regression (GWR) model. The GWR was run based on the combined datasets of satellite vegetation index (GIMMS NDVI) and climate observation (temperature and moisture) from meteorological stations nationwide. The results noted that the spatial non-stationary relationship between NDVI and surface temperature has appeared in China. The significant negative temperature-vegetation relationship was distributed in northeast, northwest and southeast parts of the country, while the positive correlation was more concentrated from southwest to northeast. And then, by comparing the normalized regression coefficients for different climate factors, regions with moisture dominants for NDVI were observed in North China and the Tibetan Plateau, and regions with temperature dominants for NDVI were distributed in the East, Central and Southwest China, where the annual mean maximum temperature accounts for the largest areas. In addition, regression coefficients between NDVI dynamics and climate variability indicated that the higher warming rate could result in the weakened vegetation activity through some mechanisms such as enhanced drought, while the moisture variability could mediate the hydrothermal conditions for the variation of vegetation activity. When the increasing rate of photosynthesis exceeded that of respiration, there was a positive correlation between vegetation dynamics and climate variability. However, the continuous and dynamic responding process of vegetation activity to climate change will be determined by spatially heterogeneous conditions in climate change and vegetation cover. Furthermore, the description of climate-induced vegetation activity from its rise to decline in different regions is expected to provide a scientific basis for initiating ecosystem-based adaptation strategies in response to global climate change.
1982—2013年中国植被NDVI空间异质性的气候影响分析
DOI:10.11821/dlxb201903010
[本文引用: 1]
为研究气候变化与植被活动之间的复杂关系,采用1982-2013年GIMMS NDVI与气象站点温度与水分的监测资料,应用基于像元的地理加权回归方法,探究了中国植被NDVI及其动态特征对气候变化响应的空间格局。中国植被NDVI与地表温度呈空间非平稳关系,在空间上的负相关关系主要集中在东北、西北及东南部分地区,空间正相关则更为集中和连片;针对不同气候指标的标准化系数对比可知,植被NDVI受水分控制作用较为显著的区域主要集中在北方地区以及青藏高原,温度的主导作用区域则分布在华东、华中及西南地区,其中年均最高气温对NDVI的主导区域范围最广;植被NDVI动态与气候变率的回归结果表明,增温速率的升高会通过加剧干旱等机制对植被活动产生抑制作用,水分变率对植被活动的强弱起到了重要的调节作用。
Spatiotemporal changes of vegetation NDVI and its driving forces in China during 1982-2015
1982—2015年中国植被NDVI时空变化特征及其驱动分析
Study on vegetation changes and climate factors in a karst region of Southwest China
西南喀斯特地区植被变化及其与气候因子关系研究
DOI:10.16258/j.cnki.1674-5906.2019.06.002
[本文引用: 1]
可下载PDF全文。
Global-scale assessment and inter-comparison of recently developed/reprocessed microwave satellite vegetation optical depth products
Vegetation dynamics and its response to climate change and human activities based on different vegetation types in China
中国不同植被类型NDVI对气候变化和人类活动的响应
Vegetation productivity dynamics in response to climate change and human activities under different topography and land cover in Northeast China
A carbon sink-driven approach to estimate gross primary production from microwave satellite observations
DOI:10.1016/j.rse.2019.04.022
[本文引用: 1]
Global estimation of Gross Primary Production (GPP) - the uptake of atmospheric carbon dioxide by plants through photosynthesis - is commonly based on optical satellite remote sensing data. This presents a source driven approach since it uses the amount of absorbed light, the main driver of photosynthesis, as a proxy for GPP. Vegetation Optical Depth (VOD) estimates obtained from microwave sensors provide an alternative and independent data source to estimate GPP on a global scale, which may complement existing GPP products. Recent studies have shown that VOD is related to aboveground biomass, and that both VOD and temporal changes in VOD relate to GPP. In this study, we build upon this concept and propose a model for estimating GPP from VOD. Since the model is driven by vegetation biomass, as observed through VOD, it presents a carbon sink driven approach to quantify GPP and, therefore, is conceptually different from common source-driven approaches. The model developed in this study uses single frequencies from active or passive microwave VOD retrievals from C-, X- and Ku-band (Advanced Scatterometer (ASCAT) and Advanced Microwave Scanning Radiometer for Earth Observation (AMSR-E)) to estimate GPP at the global scale. We assessed the ability for temporal and spatial extrapolation of the model using global GPP from FLUXCOM and in situ GPP from FLUXNET. We further performed upscaling of in situ GPP based on different VOD data sets and compared these estimates with the FLUXCOM and MODerate-resolution Imaging Spectroradiometer (MODIS) GPP products. Our results show that the model developed for individual grid cells using VOD and change in VOD as input performs well in predicting temporal patterns in GPP for all VOD data sets. For spatial extrapolation of the model, however, additional input variables are needed to represent the spatial variability of the VOD-GPP relationship due to differences in vegetation type. As additional input variable, we included the grid cell median VOD (as a proxy for vegetation cover), which increased the model performance during cross validation. Mean annual GPP obtained for AMSR-E X-band data tends to overestimate mean annual GPP for FLUXCOM and MODIS but shows comparable latitudinal patterns. Overall, our findings demonstrate the potential of VOD for estimating GPP. The sink-driven approach provides additional information about GPP independent of optical data, which may contribute to our knowledge about the carbon source-sink balance in different ecosystems.
