

1 引言
植被净初级生产力(NPP)被定义为单位时间和单位面积绿色植物通过光合作用积累的有机物质[1],是研究全球陆地生态系统对气候变化响应的基础,对加强全球变暖下陆地生态系统碳固定至关重要[2]。由于全球地表气温持续升高,大多数气候模型预测全球大部分区域的NPP将增加[3],但NPP波动很大[4];最近的研究表明连续的湿润和干旱对生产力以及碳固定有重要影响[5-6],生产力的波动会影响碳固定的大小[6],而驱动碳汇变化的气候等主要因素却在时空上呈现巨大差异,并且气候变化的影响范围和程度在不断升高[7]。除气温升高外,降水格局在时空尺度上也发生了变化[8]。气候变化的改变正在通过直接和间接的方式影响陆地生态系统生产力,需要更好地了解气候变化可能给生态系统带来的不利影响,对开展有效的适应性管理等具有重要意义[9]。
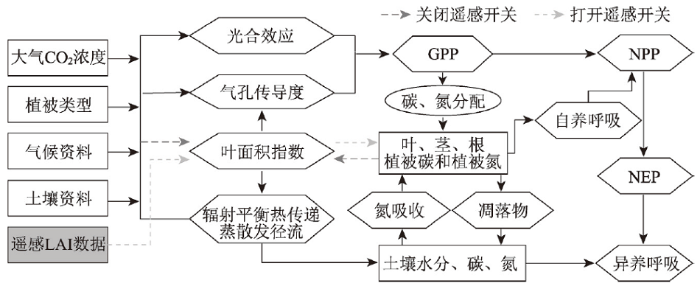
生态系统模型模拟是研究区域气候变化对生态系统影响的重要方法之一[15-16]。估算NPP的模型通常分为气候统计模型、遥感参数模型和生态过程模型[17-18]。气候统计模型是依赖于有限观测数据的经验方法;遥感参数模型以时空连续的卫星遥感数据为输入,能够反映同一植被类型内部的空间异质性,但对碳循环过程和机理的刻画存在不足;而建立在小尺度精细试验分析基础上的生态过程模型,被认为具有较好的机理诊断和未来变化预测能力,如CEVSA(Carbon Exchange between Vegetation, Soil, and Atmosphere)、CEVSA 2[19]、BEPS(Boreal Ecosystem Productivity Simulator)等[20-21]。结合遥感参数模型和生态过程模型,通过尺度融合实现更高精度模拟生态系统碳动态[22⇓⇓-25]。然而生态系统未来变化的预测,仍然依赖于生态过程模型。
CMIP5基于不同温室气体排放情景模拟了全球未来气候变化,为研究气候变化对陆地生态系统生产力的未来影响提供了数据基础。RCP2.6情景是最理想最严格的低排放情景,现实发生的可能性相对较低,而RCP4.5和RCP8.5情景发生的可能性相对较高[33-34],并且RCP4.5模拟的温室气体排放与经济均衡发展模式,是优先发展的模式[35],而RCP8.5作为在不实施有效气候变化减缓措施的情况下,人类活动导致气温气体浓度达到的最高情景,代表人类在本世纪面对的最恶劣气候情景,可以作为气候变化的“底线”与RCP4.5进行对比[36]。基于此,本文仅选择了这两种情景数据,进行了模拟分析。应用CEVSA-RS模型模拟了未来气候情景下2006—2099年全国植被NPP,分析了NPP的大小、变化趋势和稳定性,探究两种气候情景下中国陆地生态系统NPP及其稳定性的变化和影响因素,以期为全国陆地生态系统的碳汇管理,生态恢复措施实施及生态系统管理策略制定等提供科学基础。
2 研究方法与数据来源
2.1 数据
2.1.1 气候情景数据
表1 模型输入输出数据
Tab. 1
| 类型 | 名称 | 描述 | 时间分辨率 | 空间分辨率 | 单位 |
|---|---|---|---|---|---|
| 驱动变量 | Tas | 气温 | 旬均值 | 0.1° | ℃ |
| Prc | 降水 | 旬均值 | 0.1° | mm | |
| Hum | 相对湿度 | 旬均值 | 0.1° | % | |
| Clo | 云量 | 旬均值 | 0.1° | % | |
| Chinacover2010 | 土地覆盖数据 | 年值(2010年) | 0.1° | 无 | |
| 输出变量 | NPP | 净初级生产力 | 年值 | 0.1° | g C m-2 a-1 |
2.1.2 土地利用数据
表2 Chinacover2010数据分类体系
Tab. 2
| 一级类型编号 | 一级类型名称 |
|---|---|
| 1 | 常绿针叶林 |
| 2 | 落叶针叶林 |
| 3 | 针阔混交林 |
| 4 | 常绿阔叶林 |
| 5 | 落叶阔叶林 |
| 6 | 草地 |
| 7 | 灌丛 |
| 8 | 其他 |
| 9 | 农作物 |
| 10 | 人工表体 |
| 11 | 水体 |
2.2 模型
图1
2.3 数据分析方法
2.3.1 饱和水汽压差
饱和水汽压差(Vapor Pressure Deficit, VPD)被用来分析大气水分对植被NPP的影响。采用基于修正的Tetens的经验公式,以气温计算未来气候情景下VPD[41]。具体计算方程如下:
式中:TAS为气温(℃),在-35~30 ℃范围内该公式与Tentens公式的误差小于0.3%;E为饱和水汽压(hPa);HUM为空气相对湿度,用百分数表示;VPD为饱和水汽压差(hPa),即表征实际空气距离水汽饱和状态的程度[42]。
2.3.2 干旱指数
式中:AIi为第i年的干旱指数;PRCi为第i年的平均降水;TASi为第i年的平均气温。AI越大,代表当年的气候湿润程度越高,反之越干旱;AI小于15表示干旱,15~30间表示半干旱,大于30表示湿润。
2.3.3 稳定性系数
稳定性可以表示一个系统保持不变或者规律性变动的稳定程度,变异系数本身表达波动性[45],通常采用变异系数倒数的绝对值量化稳定性,计算公式如下:
式中:SX、MX和STDX分别表示给定时间范围内生态系统生产力、气候系统中气温和降水等量的稳定性、均值和标准偏差,取绝对值以消除气温均值可能出现的负值的影响;i代表第i年;j代表第j个像元点。
为了分析稳定性年代际变化及其变化趋势,本文使用滑动窗口法计算稳定性系数。其中窗口大小设定为11 a,逐年滑动分别计算均值和标准差,得到稳定系数时间序列数据。具体计算公式如下:
式中:Xk代表第k年的NPP或气温等气候要素;STDk表示第k年前后5 a共11 a期间X时间序列的标准差;Sk是第k年前后5 a期间的稳定性系数。
2.3.4 趋势分析
一元线性回归的斜率广泛应用于年际变化趋势及影响因素分析的量化指标,其计算公式如下[46]:
式中:Slope为像元尺度线性回归方程的斜率;Xi为第i年的NPP及TAS、PRC、AI、VPD等气候要素;n为研究的时间长度,i为研究时段内的第i年。当Slope > 0且显著性水平p < 0.05时,为显著增加趋势;当Slope < 0且p < 0.05时,为显著下降趋势;无论Slope取值多少,当p ≥ 0.05时,无显著变化趋势[47]。
2.3.5 多元线性回归
采用多元线性回归分析气象因子对NPP的影响。公式如下:
式中:X1和X2分别表示标准化后的气温和降水量;a、b为回归系数;c为截距。
2.3.6 转折点
为了确定时间序列数据的年际变化是否存在趋势转折,采用分段线性回归方法估计出现转折的年份[48],公式如下:
式中:
3 结果
3.1 净初级生产力空间格局
图2

图2
RCP4.5和RCP8.5气候情景下不同时段中国陆地生态系统NPP均值及距平
注:基于自然资源部标准地图服务网站审图号为GS(2016)1594号的标准地图制作,底图边界无修改;图a、e分别为RCP4.5和RCP8.5情景的2010—2099年均NPP空间分布图,图b、c、d和f、g、h分别为RCP4.5和RCP8.5情景的2010—2039年、2040—2069年和2070—2099年NPP距平空间分布图;Ⅰ代表青藏高原气候区,Ⅱ代表热带—亚热带季风区,Ⅲ代表温带季风区,Ⅳ温带大陆气候区。
Fig. 2
Mean and anomaly of NPP in Chinese terrestrial ecosystems at different time periods in RCP4.5 and RCP8.5 climate scenarios
表3 两个气候情景下分区年均NPP值(Pg C a-1)
Tab. 3
| 青藏高原气候区 | 热带—亚热带季风区 | 温带季风区 | 温带大陆区 | 全国 | ||||||||||||||
|---|---|---|---|---|---|---|---|---|---|---|---|---|---|---|---|---|---|---|
| RCP4.5 | RCP8.5 | RCP4.5 | RCP8.5 | RCP4.5 | RCP8.5 | RCP4.5 | RCP8.5 | RCP4.5 | RCP8.5 | |||||||||
| 2006—2039年 | 0.57 | 0.56 | 2.11 | 2.11 | 1.14 | 1.13 | 0.64 | 0.63 | 4.47 | 4.43 | ||||||||
| 2040—2069年 | 0.59 | 0.60 | 2.17 | 2.19 | 1.18 | 1.17 | 0.65 | 0.62 | 4.59 | 4.59 | ||||||||
| 2070—2099年 | 0.56 | 0.61 | 1.97 | 2.05 | 1.05 | 1.03 | 0.58 | 0.48 | 4.16 | 4.16 | ||||||||
| 2006—2099年 | 0.57 | 0.59 | 2.09 | 2.12 | 1.12 | 1.11 | 0.63 | 0.58 | 4.41 | 4.40 | ||||||||
热带—亚热带季风区对全国NPP的贡献最高,在RCP4.5情景下年均NPP总量为2.09 Pg C a-1,占全国NPP总量47.32%,而RCP8.5情景下的贡献量略高于RCP4.5,为2.12 Pg C a-1,占比48.18%。温带季风区次之,RCP4.5情景下年均NPP总量1.12 Pg C a-1,贡献率为25.48%,RCP8.5情景下略低,为1.11 Pg C a-1,贡献率为25.23%。季风区对全国NPP的总贡献分别高达72.80%(RCP4.5)和73.41%(RCP8.5)。温带大陆区在RCP4.5情景下NPP总量为0.63 Pg C a-1,贡献率为14.22%,但在RCP8.5情景下只有0.58 Pg C a-1,贡献率仅为13.18%。青藏高原区在RCP4.5情景下年均NPP总量为0.57 Pg C a-1,贡献率只有12.99%,但在RCP8.5情景下超过温带大陆区,达到0.59 Pg C a-1,贡献率达13.41%。虽然RCP8.5情景下季风区对NPP总量的贡献比RCP4.5情景高,并且高排放情景下青藏高原区NPP高于中等排放情景,但温带大陆气候区NPP总量在RCP8.5情景下低于RCP4.5,导致RCP8.5情景下全国NPP总值低于RCP4.5情景。
比较近期(2010—2039年)、中期(2040—2069年)和远期(2070—2099年)NPP大小变化(图2),全国RCP4.5情景下近、中、远期的变化分别是整个时段的2.17%、4.05%和-5.56%,而RCP8.5情景的3个时期变化分别是0.76%、4.41%和-5.28%。青藏高原区近期较整个时段低0.56%(RCP4.5)、4.27%(RCP8.5),中期较整个时段分别高2.38%和2.44%,但远期有较大不同,RCP4.5下远期比整个时段低1.47%,RCP8.5情景下却比整个时段高2.56%,青藏高原表现出其独特性。热带—亚热带季风区、温带季风区和温带大陆气候区表现出相似的距平变化,近期和中期的距平较整个时段高,但远期的距平却较整个时段下降幅度较大;尤其是温带大陆气候区在RCP8.5情景下远期较整个时段下降高达17.25%,RCP4.5情景是其相对优势的情景。
3.2 净初级生产力年际趋势
2006—2099年间,NPP在不同气候情景和气候区中普遍呈现出先上升再下降的趋势(图3)。RCP4.5情景下的转折点年份普遍在2060—2070年之间,RCP8.5情景NPP的下降趋势出现的转折年份比中排放情景早,说明较于高排放情景下,中等排放情景下的NPP增长会持续的更久。全国陆地区域在RCP4.5和RCP8.5情景下的转折点分别为2062年和2055年,转折点之前分别以5.3 g C m-2 10a-1和6.5 g C m-2 10a-1速率显著增加(p < 0.01),而转折点之后则呈显著下降趋势,下降速率分别为22.7 g C m-2 10a-1和16.7 g C m-2 10a-1,分别是转折点前的4.28倍和2.57倍,即NPP呈现加速下降的趋势。
图3
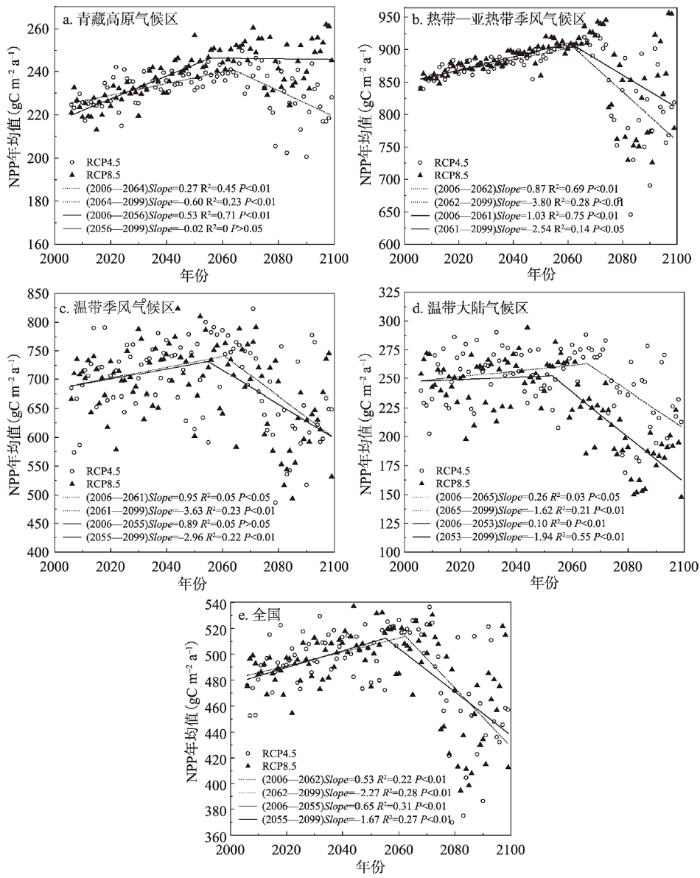
图3
两种气候情景下4个气候区及全国的NPP年际变化
Fig. 3
Interannual variability of NPP in four climate zones and nationally in two climate scenarios
不同气候情景下,不同气候区NPP年际变化转折点前后的变化速率有差异(图3)。青藏高原区的NPP分段年际变化趋势变化为,RCP4.5情景下2064年之前以2.7 g C m-2 10a-1速率增加,而RCP8.5情景下,2056年之前上升速率是RCP4.5的1.96倍,RCP4.5后期以6.0 g C m-2 10a-1速率加速下降,而RCP8.5后期下降趋势不显著。
热带—亚热带季风区在RCP4.5情景下2062年以前以8.7 g C m-2 10a-1的速率显著上升,而RCP8.5情景下,2061年之前上升速率达到了10.3 g C m-2 10a-1,是RCP4.5情景的1.18倍,RCP4.5情景下后期以38.0 g C m-2 10a-1的速率显著下降,是RCP8.5情景后期下降速率的1.50倍。
温带季风区在RCP4.5情景下2061年以前以9.5 g C m-2 10a-1的速率显著上升,但RCP8.5情景下2055年之前以8.9 g C m-2 10a-1速率不显著上升,RCP4.5情景后期以36.3 g C m-2 10a-1的速率加速下降,下降速率是RCP8.5同期的1.23倍。
温带大陆气候区在RCP4.5情景下2065年之前以2.6 g C m-2 10a-1速率上升,是RCP8.5情景下2053年之前的2.6倍,RCP8.5后期以19.4 g C m-2 10a-1的速率下降,为RCP4.5情景下同期的1.20倍。
总体表现为青藏高原区和热带—亚热带季风区在RCP4.5情景下前期NPP增长速率要低于RCP8.5情景,后期的下降速率却高于RCP8.5情景,温带季风区后期RCP4.5下降速率高于RCP8.5;温带大陆气候区较为特殊,RCP4.5情景前期NPP上升速率高于RCP8.5,RCP4.5情景后期NPP下降速率却缓于RCP8.5,与前3个气候区对不同未来气候情景的响应相反。
总之,4个气候区都表现为高排放下的NPP下降转折点的出现普遍早于中等排放情景,但不同气候区下NPP年际变化速率对不同气候情景的响应不同,RCP4.5情景下前期NPP上升速率最快的是温带季风区,后期下降最快的是热带—亚热带季风气候区;RCP8.5情景下前期上升最快的是热带—亚热带季风气候区,后期下降最快的是温带季风气候区。季风区NPP变化趋势较大的原因是季风区NPP总量对全国的贡献大,导致变化幅度大。NPP变化趋势可以提供未来陆地生态系统碳固定的发展方向和速度,由未来气候情景下NPP在21世纪中叶出现转折点的研究结果可知,转折点应该受到更多的关注[49]。
3.3 净初级生产力的稳定性时空变化
NPP稳定性的空间分布显示两种情景后期的NPP稳定性普遍呈现下降的趋势,但青藏高原区的NPP稳定性在两种情景后期的下降程度不同(图4)。总体上,青藏高原气候区和热带—亚热带季风区的NPP稳定性较好,温带季风区和温带大陆气候区的大部分地区的稳定性较差。在NPP稳定性整体较好的青藏高原区和热带—亚热带季风区中,四川盆地和部分长江中下游平原区域以及西藏西部的NPP稳定性相对较差;而稳定性较差的温带季风气候区以及温带大陆气候区的大兴安岭、小兴安岭以及长白山脉的稳定性相对较好,全国陆地生态系统NPP稳定性呈现明显的空间异质性。
图4
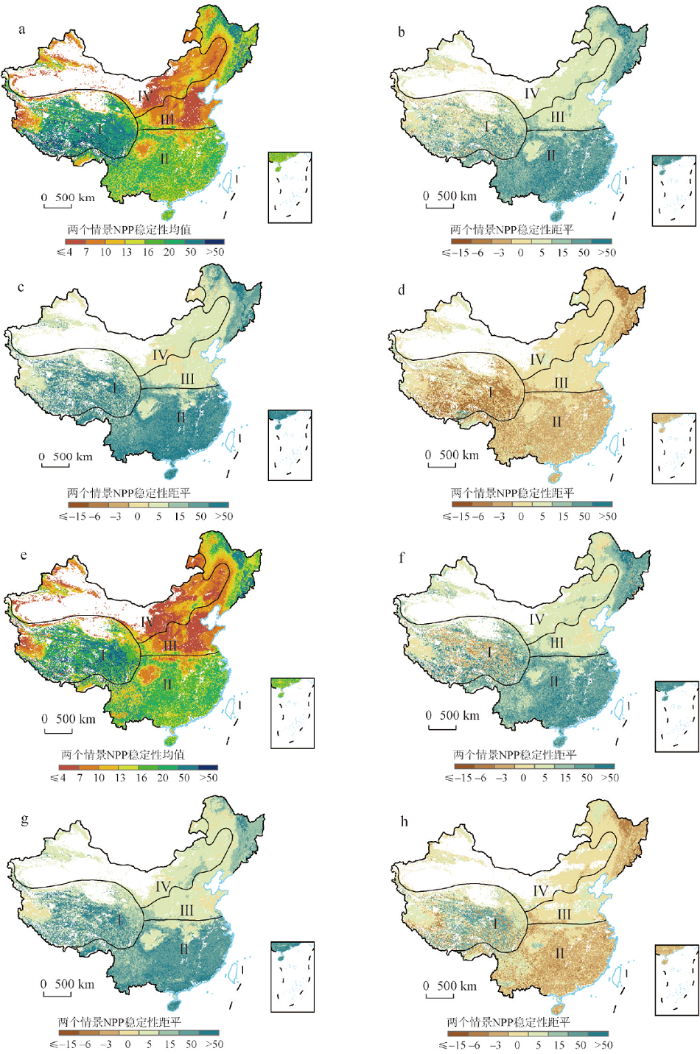
图4
RCP4.5和RCP8.5气候情景下不同时段中国陆地生态系统NPP稳定性均值及距平
注:基于自然资源部标准地图服务网站审图号为GS(2016)1594号的标准地图制作,底图边界无修改;Ⅰ代表青藏高原气候区,Ⅱ代表热带—亚热带季风区,Ⅲ代表温带季风区,Ⅳ温带大陆性气候区;a、b、c、d和e、f、g、h分别代表RCP4.5和RCP8.5情景的整个时段NPP稳定性空间分布和2010—2039年、2040—2069年和2070—2099年的NPP稳定性距平空间分布。
Fig. 4
Mean and anomaly of NPP stability in Chinese terrestrial ecosystems at different time periods in RCP4.5 and RCP8.5 climate scenarios
总体来看,全国区域内两气候情景下每11 a滑动窗口计算NPP稳定性的结果显示(图5),NPP稳定性有明显降低的趋势,分别以每年-2.9%(RCP4.5)和-4.3%(RCP8.5)速率显著下降,RCP4.5情景下,NPP转折点后期相较于前期NPP稳定性下降至68.33%,而RCP8.5情景下转折点后期相较于前期下降至54.57%,高排放情景下NPP稳定性下降更多。RCP4.5情景下,全国的NPP稳定性年均值为31.86,略高于RCP8.5情景下的30.32。稳定性最差的气候区为温带大陆区,分别为13.69(RCP4.5)和12.91(RCP8.5),温带季风区略高于温带大陆区,稳定性年均值最高的是热带—亚热带季风区,分别为83.09(RCP4.5)和78.98(RCP8.5)。全国范围内RCP4.5情景下的NPP稳定性普遍高于RCP8.5,并且高排放相较中等排放情景下NPP稳定性下降的速率更快。
图5
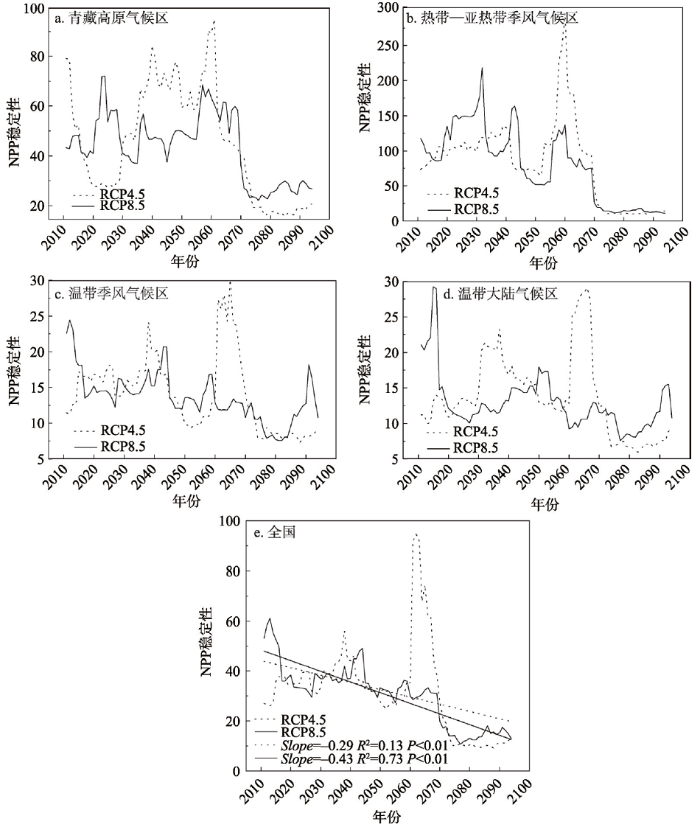
图5
两种气候情景下不同气候区及全国的NPP稳定性年际变化
Fig. 5
Interannual variability of NPP stability in different climate zones and nationally in two climate scenarios
4 讨论
4.1 不同气候情景下净初级生产力及其影响因素
水热气候指标在不同的气候情景下和不同气候区中存在差异(图6)。各气候区气温均显著变暖,且RCP8.5情景下气温变暖的速率普遍高于RCP4.5,全国范围内高排放情景升温速率是中排放情景的2.52倍(表4)。表征干旱程度的AI和VPD均显示出全国范围气候变干。其中,两个情景下全国陆地范围内AI呈现显著下降趋势,分别为-0.51 10a-1(RCP4.5)和1.20 10a-1(RCP8.5),表示全国陆地气候有显著变干的趋势;同时VPD表现为显著上升趋势,RCP8.5情景下的VPD(0.078 hPa 10a-1)普遍高于RCP4.5情景的对应值(0.029 hPa 10a-1),同样表现出全国尺度的气候显著变干趋势。
图6
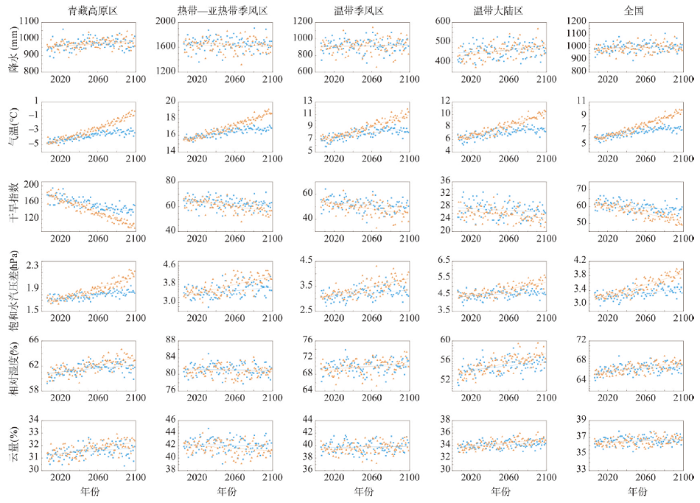
图6
两个气候情景下4个气候区及全国的气候因子年际变化
注:蓝色代表RCP4.5情景,橙色代表RCP8.5情景。
Fig. 6
Interannual variation of meteorological factors in four climate zones and nationally in two climate scenarios
表4 气象因素的年际变化趋势
Tab. 4
| 气温 | 降水 | 相对湿度 | 云量 | 干旱指数 | 饱和水汽压差 | |||||||
|---|---|---|---|---|---|---|---|---|---|---|---|---|
| RCP4.5 | RCP8.5 | RCP4.5 | RCP8.5 | RCP4.5 | RCP8.5 | RCP4.5 | RCP8.5 | RCP4.5 | RCP8.5 | RCP4.5 | RCP8.5 | |
| 青藏高原区 | 0.02*** | 0.05*** | 0.28* | 0.40*** | 0.01*** | 0.03*** | 0.01** | 0.01*** | -0.40*** | -0.83*** | 0.002*** | 0.005*** |
| 热带—亚热带季风区 | 0.01*** | 0.04*** | 0.02 | -0.19 | -0.002 | -0.002 | -0.002 | -0.01* | -0.03* | -0.09*** | 0.004*** | 0.01*** |
| 温带季风区 | 0.02*** | 0.04*** | 0.17 | 0.26 | 0.01 | 0.02*** | 0.001 | 0.01 | -0.05* | -0.10*** | 0.003*** | 0.01*** |
| 温带大陆区 | 0.02*** | 0.04*** | 0.22 | 0.65*** | 0.02*** | 0.05*** | 0.01* | 0.02*** | -0.02 | -0.03*** | 0.003*** | 0.01*** |
| 全国 | 0.02*** | 0.04*** | 0.18 | 0.29* | 0.01** | 0.02*** | 0.003 | 0.01*** | -0.05*** | -0.12*** | 0.003*** | 0.01*** |
注:*代表P<0.05,**代表P<0.01,***代表P<0.001。
有研究表明不同情景下气温、降水等气候因子对NPP的影响不同[50]。尽管全国陆地区域气温与降水对NPP年际变化的解释度高达71%(RCP4.5)和63%(RCP8.5)(表5),但根据单因素线性回归分析,较之于气温和降水间相关性,NPP分别与AI和VPD间具有更显著的线性关系(表6),因此,在未来气候AI降低,VPD显著升高的暖干化趋势,是导致未来NPP出现下降的主要因素。针对NPP与气温和降水的多元线性回归分析中,可能存在的气温与降水间共线性问题,分析表明回归方程膨胀因子都小于3,说明自变量气温和降水间共线性特征不显著,这也与文献分析结果较为一致,即气候变暖和降水增加的交互效应低于单因素的效应[51]。随着气候持续变暖,降水增加不显著情况下,地表蒸散将显著增加而产生水分胁迫,而干旱通过增加自养呼吸,减少光合作用的机制[52],导致NPP的增长受限[53],并且这种风险面积可能扩大[54],生态系统的稳定性下降会导致干旱的影响将更大[55]。
表5 两个气候情景下NPP与气温、降水二元线性拟合结果
Tab. 5
| 气温回归系数 | 降水回归系数 | 二元回归决定系数 | 共线性检验VIF | |||||||||||
|---|---|---|---|---|---|---|---|---|---|---|---|---|---|---|
| RCP4.5 | RCP8.5 | RCP4.5 | RCP8.5 | RCP4.5 | RCP8.5 | RCP4.5 | RCP8.5 | |||||||
| 青藏高原区 | 0.02*** | 0.15*** | 0.06*** | 0.34*** | 0.59 | 0.83 | 1.04 | 1.12 | ||||||
| 热带—亚热带季风区 | 0.004*** | -0.04*** | 0.16*** | 0.12*** | 0.56 | 0.56 | 1.02 | 1.01 | ||||||
| 温带季风区 | -0.07*** | 0.04*** | 0.26*** | 0.27*** | 0.52 | 0.49 | 1.01 | 1.00 | ||||||
| 温带大陆区 | 0.004*** | -0.06*** | 0.23*** | -0.16*** | 0.50 | 0.71 | 1.00 | 1.22 | ||||||
| 全国 | 0.02*** | 0.03*** | 0.22*** | 0.12*** | 0.71 | 0.63 | 1.00 | 1.04 | ||||||
注:*代表P<0.05,**代表P<0.01,***代表P<0.001。
表6 NPP与气候因素的一元线性拟合的回归系数
Tab. 6
| 气温 | 降水 | 干旱指数 | VPD | 相对湿度 | 云量 | |||||||
|---|---|---|---|---|---|---|---|---|---|---|---|---|
| RCP4.5 | RCP8.5 | RCP4.5 | RCP8.5 | RCP4.5 | RCP8.5 | RCP4.5 | RCP8.5 | RCP4.5 | RCP8.5 | RCP4.5 | RCP8.5 | |
| 青藏高原区 | 0.20* | 0.66*** | 0.13 | 0.30** | -0.18 | -0.69*** | 0.09 | 0.59*** | 0.24* | 0.55*** | 0.08 | 0.46*** |
| 热带—亚热带季风区 | -0.17 | -0.17 | 0.10 | 0.07 | 0.14 | 0.14 | -0.32** | -0.22* | 0.27** | 0.14 | 0.21* | 0.18 |
| 温带季风区 | -0.22* | -0.40*** | 0.63*** | 0.59*** | 0.62*** | 0.70*** | -0.46*** | -0.63*** | 0.45*** | 0.38*** | 0.39*** | 0.39*** |
| 温带大陆区 | -0.26* | -0.72*** | 0.61*** | 0.0002 | 0.65*** | 0.65*** | -0.43*** | -0.76*** | 0.36*** | -0.25* | 0.32** | -0.23* |
| 全国 | -0.21* | -0.39*** | 0.35*** | 0.20 | 0.38*** | 0.47*** | -0.38*** | -0.51*** | 0.29** | 0.07 | 0.26* | 0.17 |
注:*代表P<0.05,**代表P<0.01,***代表P<0.001。
4.2 不同气候区净初级生产力的差异
气候因子对净初级生产力的影响具有明显的空间异质性,这种区域差异性也得到其他研究的证实[56]。其中差异性较为突出的是青藏高原高寒气候区,随气候变暖NPP呈增加趋势。青藏高原区的降水呈显著上升趋势,上升速率在4个气候区中最高,气温同样也呈显著上升趋势;但AI在中、高排放情景下是4个气候区中下降速率最快,分别为4.02 10a-1和8.27 10a-1(表4),即气候将加速变干,但其值较之其他4个区均较高,即持续为湿润气候。因此,至少在21世纪前叶,暖干化的RCP8.5情景相比于RCP4.5情景更利于青藏高原NPP增长,但青藏高原区加速变干,将导致NPP稳定性在2060年之后迅速下降。这种NPP稳定性的变化,主要是因为气温的波动对青藏高原NPP稳定性的影响要大于降水(表7),气温的稳定性相对其他气象因子较低,RCP4.5气候情景下的气温稳定性相比于RCP8.5更高(图7),RCP4.5情景NPP稳定性对气温稳定性的敏感性高于RCP8.5情景(图8a)。前人研究也表明青藏高原的生产力的气候驱动因素具有与其他区域的差异较为突出[57],并且有研究也发现在SRES的B2情境下1961—2100年中国平均NPP随着预测气温的上升而下降,但青藏高原是唯一随着变暖NPP增加的区域[58]。
表7 两个气候情景下4个气候区及全国NPP变异系数与气象因子变异系数偏相关结果
Tab. 7
| 偏相关系数 | 决定系数 | ||||||||
|---|---|---|---|---|---|---|---|---|---|
| RCP4.5 PRC | RCP4.5 TAS | RCP8.5 PRC | RCP8.5 TAS | RCP4.5 PRC | RCP4.5 TAS | RCP8.5 PRC | RCP8.5 TAS | ||
| 青藏高原区 | 0.43*** | -0.75*** | 0.32** | -0.55*** | 0.19 | 0.56 | 0.11 | 0.30 | |
| 热带—亚热带季风区 | -0.03 | -0.09 | -0.08 | 0.22* | 0.001 | 0.01 | 0.01 | 0.05 | |
| 温带季风区 | 0.30** | -0.30** | 0.47*** | 0.24* | 0.09 | 0.09 | 0.22 | 0.06 | |
| 温带大陆区 | 0.20 | -0.20 | -0.11 | -0.03 | 0.04 | 0.04 | 0.01 | 0.001 | |
| 全国 | 0.21 | -0.41*** | 0.06 | 0.17 | 0.04 | 0.17 | 0.00 | 0.03 | |
注:*代表P<0.05,**代表P<0.01,***代表P<0.001。
图7
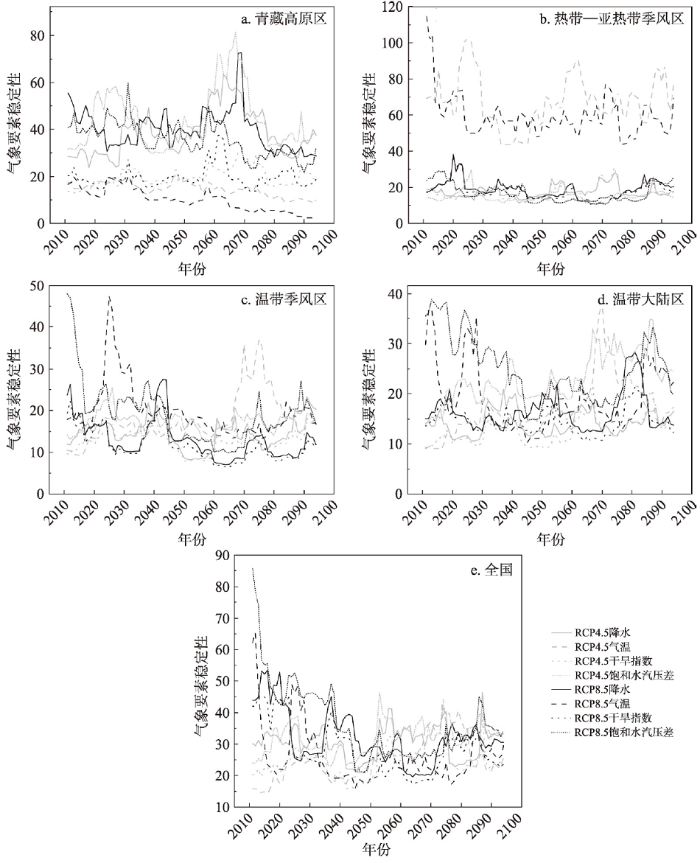
图7
两个气候情景下4个气候区及全国气象要素稳定性年际变化
Fig. 7
Interannual variability of meteorological factors' stability in the two climate scenarios in the four climate zones and nationally
图8
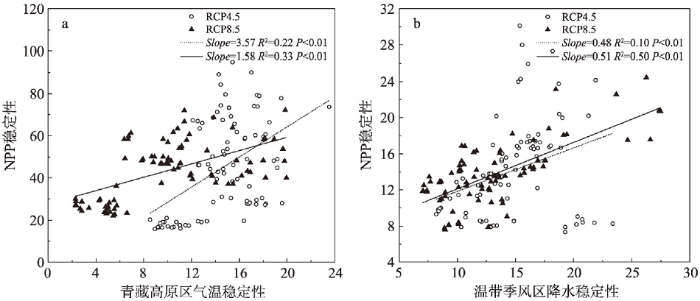
图8
部分气候区NPP稳定性与主要气候因子稳定性一元线性拟合结果
Fig. 8
Results of unary linear correlation of NPP stability and the stability of major climate factors in selected climatic zones
与青藏高原相反,总体为半干旱气候的温带大陆气候区,气候变化将导致NPP早在2053年(RCP4.5)和2065年(RCP8.5)出现下降趋势,稳定性也将降低。两个气候情景下,暖干化的RCP8.5情景对温带大陆气候区的NPP增长更加不利,同时气候因子越不稳定,NPP稳定性也变得更低。由于温带大陆气候区的VPD下降速率较高,温带大陆气候区正在显著的变干,并且NPP与AI、VPD的一元线性关系显著,持续的变干会导致温带大陆气候区NPP的显著下降(图9)。
图9
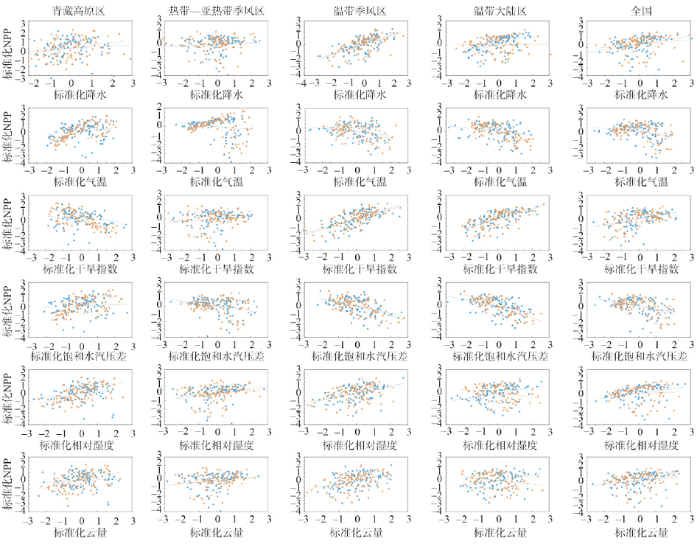
图9
NPP与气象因子的一元线性关系
注:蓝色代表RCP4.5情景,橙色代表RCP8.5情景。
Fig. 9
Unary linear correlation of NPP and meteorological factors
4.3 不足与展望
气候变化和人类活动的影响使生态系统结构和功能处于动态变化中,人类活动影响主导的区域可能更广泛而深远[31];但人类活动对NPP的影响复杂,并认为人类活动增加了全球碳循环系统的不确定性[60]。人类活动通过影响土地利用和土地覆盖来影响自然环境,如耕地开垦、植树造林、刈割等,尤其是草地放牧被认为是导致荒漠化乃至草地退化的主要因素[61]。有研究通过估算潜在和现实生产力区分人类活动和气候变化影响的碳固定水平[62-63]。此外,二氧化碳和氮沉降等环境变化也是影响NPP的重要因素[64]。研究表明氮沉降的正效应与较强碳增汇潜力的幼龄林,使中国亚热带陆地碳汇在全球碳汇中占有重要贡献[65];21世纪初中国氮沉降速率的增高致使NPP增加,超过了LUCC对氮沉降的间接影响[66]。有研究认为CO2增加还会抵消气候变化对NPP的消极影响[67],但若不做任何缓解措施,这种遏制气候变暖的作用可能会削弱[68]。另外,在模型模拟的过程中应该考虑未来植被、土地利用及土地覆盖动态变化未来情景[69]。如未来气候变化将导致植被带变化进而影响陆地碳循环[70];20世纪70年代实施的生态恢复工程,在全国碳汇中的贡献可能超过了一半[63],随着社会经济的发展,如生态恢复工程、城市化等政策的实施远多于过去,因此这种影响还会不断扩大。本文考虑了气候变化对NPP的影响机制以及暖干化对NPP稳定性带来的不利影响。然而综合对二氧化碳施肥效应、氮沉降、动态植被、生态系统管理以及土地利用与覆被变化等方面的考虑是未来生态系统模型改进的发展方向。
5 结论
本文通过发展的生态系统过程模型,模拟了不同未来气候情景下的NPP大小、年际变化趋势及稳定性以及气候影响机制。结果表明,中国植被NPP在RCP4.5和RCP8.5两种气候情景下的总量分别为4.41 Pg C a-1和4.40 Pg C a-1,季风区分别贡献了全国NPP总量的72.8%(RCP4.5)和73.4%(RCP8.5)。两种气候情景下NPP均表现为前期增加,后期降低的年际变化趋势。两气候情景下每11年滑动窗口计算的NPP稳定性表现出明显降低的趋势,并且RCP8.5情景下NPP的稳定性降低更多。分析影响NPP的气象因子以及表征干旱的指标,发现AI显著下降(p < 0.01),全国陆地趋向暖干化,导致了全国NPP在2050年代之后出现下降趋势,高排放情景下干旱导致更为严重的下降。不同气候区对气候变化存在不同的响应,暖干化对温带大陆气候区的负面影响最显著。影响NPP稳定性的气候因子在不同气候区也有差别,温带季风气候区NPP稳定性主要是降水波动主导,青藏高原区的NPP稳定性主要是气温波动主导;NPP下降转折点的出现表现为NPP稳定性发生剧烈变化。未来研究需进一步考虑氮沉降、土地覆被与利用变化等人类活动等因素。本文研究气候变化情景下植被生产力的变化,可为考虑区域差异开展诸如生态保护与修复及双碳行动等减缓和适应气候变化的举措等提供科学参考。
参考文献
Modeling net primary productivity of terrestrial ecosystems in the semi-arid climate of the Mongolian Plateau using LSWI-based CASA ecosystem model
DOI:10.1016/j.jag.2015.12.001 URL [本文引用: 1]
Spatiotemporal dynamics of vegetation net primary productivity and its response to climate change in Inner Mongolia from 2002 to 2019
Potential future changes of the terrestrial ecosystem based on climate projections by eight general circulation models
Remotely sensed interannual variations and trends in terrestrial net primary productivity 1981-2000
How precipitation legacies affect broad-scale patterns of primary productivity: Evidence from the Inner Mongolia grassland
Interannual variability of terrestrial net ecosystem productivity over China: Regional contributions and climate attribution
Three centuries of dual pressure from land use and climate change on the biosphere
Analysis of global climate change in the next one hundred years
未来百年全球气候变化分析
Climate change adaptation strategies for resource management and conservation planning
The carbon budget of terrestrial ecosystems in East Asia over the last two decades
DOI:10.5194/bg-9-3571-2012
URL
[本文引用: 1]

. This REgional Carbon Cycle Assessment and Processes regional study provides a synthesis of the carbon balance of terrestrial ecosystems in East Asia, a region comprised of China, Japan, North and South Korea, and Mongolia. We estimate the current terrestrial carbon balance of East Asia and its driving mechanisms during 1990–2009 using three different approaches: inventories combined with satellite greenness measurements, terrestrial ecosystem carbon cycle models and atmospheric inversion models. The magnitudes of East Asia's terrestrial carbon sink from these three approaches are comparable: −0.293±0.033 PgC yr−1 from inventory–remote sensing model–data fusion approach, −0.413±0.141 PgC yr−1 (not considering biofuel emissions) or −0.224±0.141 PgC yr−1 (considering biofuel emissions) for carbon cycle models, and −0.270±0.507 PgC yr−1 for atmospheric inverse models. Here and in the following, the numbers behind ± signs are standard deviations. The ensemble of ecosystem modeling based analyses further suggests that at the regional scale, climate change and rising atmospheric CO2 together resulted in a carbon sink of −0.289±0.135 PgC yr−1, while land-use change and nitrogen deposition had a contribution of −0.013±0.029 PgC yr−1 and −0.107±0.025 PgC yr−1, respectively. Although the magnitude of climate change effects on the carbon balance varies among different models, all models agree that in response to climate change alone, southern China experienced an increase in carbon storage from 1990 to 2009, while northern East Asia including Mongolia and north China showed a decrease in carbon storage. Overall, our results suggest that about 13–27% of East Asia's CO2 emissions from fossil fuel burning have been offset by carbon accumulation in its terrestrial territory over the period from 1990 to 2009. The underlying mechanisms of carbon sink over East Asia still remain largely uncertain, given the diversity and intensity of land management processes, and the regional conjunction of many drivers such as nutrient deposition, climate, atmospheric pollution and CO2 changes, which cannot be considered as independent for their effects on carbon storage.
The divergent impact of phenology change on the productivity of alpine grassland due to different timing of drought on the Tibetan Plateau
DOI:10.1002/ldr.v32.14 URL [本文引用: 1]
Determining the dominant factors determining the variability of terrestrial ecosystem productivity in China during the last two decades
DOI:10.1002/ldr.v31.15 URL [本文引用: 1]
The carbon balance of terrestrial ecosystems in China
DOI:10.1038/nature07944 [本文引用: 1]
Estimation of carbon sinks in terrestrial ecosystems in China: Methodology, progress and prospects
DOI:10.1360/SSTe-2021-0197 URL [本文引用: 1]
中国陆地生态系统碳汇估算: 方法、进展、展望
Geography: From knowledge, science to decision making support
DOI:10.11821/dlxb201711001
[本文引用: 1]
Geography is a subject to explore spatial distribution, time evolution and regional characteristics of geographical elements or geographical complexes. Geography is unique in bridging social sciences and natural sciences, and has characteristics of comprehensiveness, interdisciplinary research and regionalism. With the development of geographical science technology and research methods, geography is in the gorgeous historical process towards geographical science. Research themes of geography are focusing on the comprehensive research on the earth surface. The research paradigms of geography are shifting from geography knowledge description, coupling pattern and process, to the simulation and prediction of complex human and earth system. The development of Chinese geography needs to be rooted in the major needs of national strategy, and plays important roles in the studies of urbanization development, coupling ecological processes and services, water resources management and geopolitics. Under the country's major needs, China's geography tends to achieve the geography theory innovation, new method and technology application and developed disciplinary system with Chinese characteristics, and make more contribution to national and global sustainable development.
地理学: 从知识、科学到决策
DOI:10.11821/dlxb201711001
[本文引用: 1]
地理学是研究地理要素或者地理综合体空间分布规律、时间演变过程和区域特征的一门学科,是自然科学与人文科学的交叉,具有综合性、交叉性和区域性的特点。随着地理信息技术发展与研究方法变革,新时期的地理学正在向地理科学进行华丽转身,研究主题更加强调陆地表层系统的综合研究,研究范式经历着从地理学知识描述、格局与过程耦合,向复杂人地系统的模拟和预测转变。在服务国内重大需求和国际全球战略过程中,地理学正在扮演愈发重要的角色,在新型城镇化、生态环境保护、水土资源管理、地缘政治等领域拥有广阔发展前景。中国地理学正面临前所未有的机遇,需要紧紧围绕国家重大需求,创新发展综合性的理论、方法和技术,逐步形成具有鲜明中国特色、深远国际影响的地理科学体系,为中国和全球的可持续发展服务。
A review of geographical system models
DOI:10.18306/dlkxjz.2018.01.012
[本文引用: 1]
The geographical system is a complex system including multiple spheres and their interactions. A geographical system model is a coupled human and environmental system model for understanding and predicting changes in patterns and processes of the system. Geographical system models are important tools for supporting sustainable development policy making, and thus is a key scientific research area. During the past decades, geographical system models have been developed to examine global environmental problems such as global change and sustainable development. However, the existing geographical system models have limited ability to simulate and project changes in the complex coupled human-environmental system. This study reviewed the history of development of geographical system models, which is characterized by transitions from single process to multiple process, statistics-based to process-based, static to dynamic, and site level to regional and global scale simulations. We also summarized two important development trends of geographical system models: toward coupled human and natural processes and their interactions, and model-data synthesis. To support policy making for sustainable development in China and globally, developing geographical system models is urgent for the Chinese physical geography research community.
地理系统模型研究进展
DOI:10.18306/dlkxjz.2018.01.012
[本文引用: 1]
地理系统是多圈层交互的复杂巨系统。地理系统模型是理解和预测不同尺度地理系统格局和过程变化最重要的研究方法。地理系统模型作为可持续发展科学决策必需的工具,是自然地理学重要的研究方向。过去几十年来,在全球变化等全球性重大环境问题和人类科学决策需求的推动下,地理系统模型虽然发展迅速,但还不足以准确地模拟和预测复杂人地耦合系统。本文分别从模型原理、框架和尺度等方面回顾与梳理了地理系统模型从单要素到多要素、从统计到过程、从静态到动态、从单点到区域和全球尺度模拟等发展历程,并总结了地理系统模型对发展人类—自然耦合系统以及模型—数据融合系统的趋势。发展中国的地理系统模型将有助于中国和全球可持续发展的科学决策。
Review of spatio-temporal distribution of net primary productity in forest ecosystem and its responses to climate change in China
中国森林生态系统净初级生产力时空分布及其对气候变化的响应研究综述
Review on the estimation of net primary productivity of vegetation in the Three-River Headwater Region, China
DOI:10.11821/dlxb201609011
[本文引用: 1]
As the "Water Tower of China", the Three-River Headwater Region (TRHR) is an important ecological shelter for national security and regional sustainable development for many Southeast Asian countries and the middle or lower reaches of main rivers in China. The TRHR has typical high and cold environment and alpine vegetation system. Net primary productivity (NPP), as a key vegetation parameter and ecological indicator, can reflect the natural environment change and the carbon budget level intuitively. Given the particular geographic environment and strategic position of the TRHR, many scholars have estimated NPP of the TRHR using different methods. For various reasons, however, the estimated NPP varies greatly. At present, a great deal of research involving NPP estimation has been conducted on the TRHR, but no paper has been published to summarize and assess these studies. Therefore, this paper (1) summarized systematically the related methods and results of NPP estimation in the TRHR by review of previous researches; (2) discussed the suitability of existing methods to the TRHR and pointed out the main problems; and (3) assessed the estimated NPP results. Finally, the development directions of NPP estimation in the TRHR were prospected.
三江源植被净初级生产力估算研究进展
DOI:10.11821/dlxb201609011
[本文引用: 1]
植被净初级生产力(NPP)作为重要的植被参数和生态指标,能够直观地反映生态环境的变化和区域碳收支水平。鉴于三江源特殊的地理环境和战略地位,众多学者曾应用不同的方法对三江源植被NPP进行了估算,但是由于各方面原因,NPP估算结果存在较大差异。目前,虽在三江源地区开展了大量NPP估算研究,但尚未有相关文章对这些研究进行汇总并加以分析和评价。因此,本文在前人研究成果的基础上,通过综述已有文献,对三江源植被NPP估算的相关方法与结果进行了系统地总结,探讨不同方法在三江源地区的适用性,指出已有方法存在的主要问题,并对现有NPP估算结果进行评估分析,最后提出了未来三江源NPP估算研究亟待加大研究力度的方向。
Modeling Long-term changes in carbon fluxes and storage in a subtropical coniferous plantation based on CEVSA2 model
基于CEVSA2模型的亚热带人工针叶林长期碳通量及碳储量模拟
A comparative study of vegetation net productivity in China
DOI:10.1007/s11434-008-0064-4 URL [本文引用: 1]
中国植被净生产力的比较研究
Interannual variation in terrestrial ecosystem carbon fluxes in China from 1981 to 1998
<p>A dynamic biogeochemical model was used to estimate the responses of China''s terrestrial net primary productivity (NPP), soil heterotrophic respiration (HR) and net ecosystem productivity (NEP) to changes in climate and atmospheric CO2 from 1981 to 1998. Results show that China''s total NPP varied between 2.89 and 3.37 Gt C/a and had an increasing trend by 0.32% per year, HR varied between 2.89 and 3.21 Gt C/a and grew by 0.40% per year, Annual NEP varied between -0.32 and 0.25 Gt C but had no statistically significant interannual trend. The positive mean NEP indicates that China''s terrestrial ecosystems were taking up carbon with a total carbon sequestration of 1.22 Gt C during the analysis period. The terrestrial NEP in China related to climate and atmospheric CO2 increases accounted for about 10% of the world''s total and was similar to the level of the United States in the same period. The mean annual NEP for the analysis period was near to zero for most of the regions in China, but significantly positive NEP occurred in Northeast China Plain, the southeastern Xizang (Tibet) and Huang-Huai-Hai Plain, and negative NEP occurred in the Da Hinggan Mountains, Xiao Hinggan Mountains,Loess Plateau and Yunnan-Guizhou Plateau. China''s climate at the time was warm and dry relative to other periods, so the estimated NEP is probably lower than the average level. China''s terrestrial NEP may increase if climate becomes wetter but is likely to continue to decrease if the present warming and drying trend sustains.</p><p style="text-align: center">1981-2000年中国陆地生态系统碳通量的年际变化<br />曹明奎 陶 波 李克让 邵雪梅 Stephen D PRIENCE<sup>2</sup><br />(1. 中国科学院地理科学与资源研究所,北京100101;2. 马里兰大学地理系,美国20742)</p><p>摘要:应用一个生物地球化学模型(CEVSA)估算了中国陆地净初级生产力 (<em>NPP</em>)、土壤异养呼吸(<em>HR</em>)和净生态系统生产力 (<em>NEP</em>) 在1981~1998年期间对气候和大气CO<sub>2</sub>浓度变化的动态响应.结果显示,全国<em>NPP</em>总量波动于2.89~3.37 Gt C/a之间,平均值为3.09 Gt C/a,年平均增长趋势约为0.32%.HR总量变化范围为2.89~3.21 Gt C/a,平均值为3.02 Gt C/a, 年均增长0.40%.NEP总量变动于 -0.32和0.25 Gt C/a之间,在统计上没有明显的年际变化趋势.在研究时段内,年平均<em>NEP</em>约为0.07 Gt C/a,表明中国陆地生态系统在气候与大气CO<sub>2</sub>浓度变化的条件下吸收了碳,为碳汇,总的吸收量为1.22 Gt C,约占全球碳吸收总量的10%,与同期内美国由大气CO<sub>2</sub>和气候变化所产生的碳吸收量大致相当.尽管由于较高的年际变率,<em>NEP</em>在统计上没有明显的变化趋势,但<em>NPP</em>的增长率低于<em>HR</em>的增长率,说明在研究时段内,中国陆地生态系统的吸碳能力由于气候变化降低了.全国大多数地区年平均<em>NEP</em>接近零,明显的<em>NEP</em>正值区(即碳汇)出现在东北平原、西藏东南部和黄淮平原等地区,而大小兴安岭、黄土高原和云贵高原等地区<em>NEP</em>为负值(即碳源).研究认为,1981~1998年期间中国气候温暖、干旱,因此估算的NEP可能低于其他时段.如果气候进入一个比较湿润的时期,碳吸收量可显著增加,但若当前干旱和暖化趋势以此为继,中国的NEP可能会变成一个负值。</p><p>关键词: 中国;净初级生产力;土壤异养呼吸;净生态系统生产力;气候变化</p>
1981—2000年中国陆地生态系统碳通量的年际变化
Disturbance and climate effects on carbon stocks and fluxes across Western Oregon USA
DOI:10.1111/gcb.2004.10.issue-9 URL [本文引用: 1]
Spatial-temporal patterns of net primary productivity for 1988-2004 based on GLOPEM-CEVSA model in the "Three-river Headwaters" region of Qinghai province, China
基于遥感—过程耦合模型的1988—2004年青海三江源区净初级生产力模拟
DOI:10.3773/j.issn.1005-264x.2009.02.003
[本文引用: 1]
三江源区不仅是地处青藏高原的全球气候变化的敏感区, 也是我国甚至亚洲最重要河流的上游关键源区。作为提供物质基础的植被净初级生产力(Net primary production, NPP), 是评价生态系统状况的重要指标。该文应用已在碳通量观测塔验证, 扩展到区域水平的遥感-过程耦合模型GLOPEM-CEVSA, 以空间插值的气象数据和1 km分辨率的AVHRR遥感反演的FPAR数据为模型主要输入, 模拟并分析了1988~2004年该区NPP时空格局及其控制机制。结果表明, 该区植被平均NPP为143.17 gC·m–2·a–1, 呈自东南向西北逐渐降低的空间格局, 其中, 以森林NPP最高(267.90 gC·m–2·a–1), 其次为农田(222.94 gC·m–2·a–1)、草地(160.90 gC·m–2·a–1)和湿地(161.36 gC·m–2·a–1), 荒漠最低(36.13 gC·m–2·a–1)。其年际变化趋势在空间上呈现出明显的差异, 西部地区NPP表现为增加趋势, 每10 a增加7.8~28.8 gC·m–2; 而中、东部表现为降低趋势, 每10 a降低13.1~42.8 gC·m–2。根据显著性检验, NPP呈增加趋势(趋势斜率b>0), 显著性水平高于99%和95%的区域占研究区总面积的13.43%和20.34%, 主要分布在西部地区; NPP呈降低趋势(趋势斜率bNPP的年际变化趋势的气候驱动力分析表明, 整个区域水平上该地区植被生产力受气候变化的主导, 西部地区暖湿化趋势, 造成了该地区生产力较为明显的、大范围的增加趋势; 但东、中部地区则主要受人类活动的影响, 特别是长江、黄河等河流沿线, 是人类居住活动密集的地区, 造成这些地区放牧压力较大、草地退化严重, 而该地区暖干化趋势加剧了这一过程。
Light use efficiency of vegetation: A review
植被光能利用率研究进展
Advances in plant phenology
植物物候学研究进展
Net primary and ecosystem production and carbon stocks of terrestrial ecosystems and their responses to climate change
DOI:10.1046/j.1365-2486.1998.00125.x URL [本文引用: 2]
Dynamic responses of terrestrial ecosystem carbon cycling to global climate change
Modeling the effects of nitrogen deposition on carbon budget in two temperate forests
DOI:10.1016/j.ecocom.2010.04.002 URL [本文引用: 1]
Nitrogen deposition and its effect on carbon storage in Chinese forests during 1981-2010
DOI:10.1016/j.atmosenv.2015.10.081 URL [本文引用: 1]
Estimation and analysis of net primary productivity of forest ecosystems in Shennongjia forestry district during 1981-2015
1981—2015年神农架林区森林生态系统净初级生产力估算
Impacts of human activities and climate change on gross primary productivity of the terrestrial ecosystems in China
气候变化和人类活动对中国陆地生态系统总初级生产力的影响厘定研究
A review of future climate change based on regional climate models
DOI:10.7522/j.issn.1000-0534.2018.00018
[本文引用: 1]
Regional climate differentiation is becoming more and more obvious with global climate change, regional climate tends to be extreme. Droughts, heavy rainfall, heat waves, snow, super typhoons and other extreme weather events that have brought huge losses all over the world every year are very frequent across the global. Research on small-scale regional climate using the global climate models can't meet the requirements of spatial scale, temporal scale, the regional scale assessment of climate change and adaptation research. The global climate model reproduce climatic characteristics from large scale and it can't finely show the local information at different elevations. A full understanding of the inter-regional climate differences is very important for a more accurate prediction of future climate change. As the regional climate models have a more complete physical mechanism and higher spatial resolution, it has made a great deal of improvement over the global climate model and can solve the problem the global climate model faced and has been widely used in regional climate research, notable results have been achieved. In this paper, we sketched the development of the regional climate model, summarized the latest research progress in the regional climate model, the world's major regional climate models, and the development of climate scenarios. And we also summarized the general trend of climate change in different regions of the world from temperature and precipitation, research findings in different regions can help to have a better understanding of future climate change and also can help policymakers develop appropriate applicability strategies that will reduce the loss caused by climate change. Although the models used by the researchers may be different, the precipitation estimates are not the same, and there are significant regional characteristics in different region, almost all studies agree that in the future the world will continue to experience a process of sustained warming. Based on a summary of future climate change in different regions, then we discussed the current problems of the regional climate model, including the uncertainty of the model itself, the uncertainty of emissions scenarios and the complexity of the earth-atmosphere system. Finally, for the problems in the regional climate model, we summarized the solutions in term of current regional climate models, and looked forward to the development of the regional climate model and give the trend of the future regional climate model in China.
基于区域气候模式未来气候变化研究综述
DOI:10.7522/j.issn.1000-0534.2018.00018
[本文引用: 1]
随着全球气候变化愈加剧烈,区域气候的差异化特征越来越明显,单单利用全球气候模式对区域气候进行研究已经不能满足时空尺度的要求。由于区域气候模式具有更高的空间分辨率等优势,使用区域气候模式能够有效解决这一问题,目前区域气候模式已在全球范围内得到广泛应用。本文简述了区域气候模式发展历程、最新研究进展以及全球主流的动力降尺度区域模式,归纳了气候情景发展;分别从气温和降水两方面着重总结了区域气候模式在全球不同区域不同情景应用情况,分析了未来全球不同区域气候变化趋势,尽管不同研究者所使用模式存在差异,对未来降水预估不尽相同,区域性比较明显,但几乎所有研究一致认为未来全球仍将经历一个持续增暖过程。文章最后对区域气候模式模拟过程中存在的问题进行了概述并对未来区域气候模式发展方向进行了展望,给出中国区域气候模式未来发展方向。
Impacts of 1.5 ℃ and 2 ℃ global warming on net primary productivity and carbon balance in China's terrestrial ecosystems
Assessing potential impacts of 1.5 °C and 2 °C global warming and identifying the risks of further 0.5 °C warming are crucial for climate adaptation and disaster risk management. Four earth system models in the Coupled Model Intercomparison Project Phase 5 (CMIP5) and a process-based ecosystem model are used in this study to assess the impacts and potential risks of the two warming targets on the carbon cycle of China’s terrestrial ecosystems. Results show that warming generally stimulates the increase of net primary productivity (NPP) and net ecosystem productivity (NEP) under both representative concentration pathway (RCP) 4.5 and RCP8.5 scenarios. The projected increments of NPP are higher at 2 °C warming than that at 1.5 °C warming for both RCP4.5 and RCP8.5 scenarios; approximately 13% and 19% under RCP4.5, and 12.5% and 20% under RCP8.5 at 1.5 °C and 2 °C warming, respectively. However, the increasing rate of NPP was projected to decline at 2 °C warming under the RCP4.5 scenario, and the further 0.5 °C temperature rising induces the decreased NPP linear slopes in more than 81% areas of China’s ecosystems. The total NEP is projected to be increased by 53% at 1.5 °C, and by 81% at 2 °C warming. NEP was projected to increase approximately by 28% with the additional 0.5 °C warming. Furthermore, the increasing rate of NEP weakens at 2 °C warming, especially under the RCP8.5 scenario. In summary, China’s total NPP and NEP were projected to increase under both 1.5 °C and 2 °C warming scenarios, although adverse effects (i.e., the drop of NPP growth and the reduction of carbon sequestration capacity) would occur in some regions such as northern China in the process of global warming.
Impacts of future climate change on agroclimatic resources in Northeast China
东北地区未来气候变化对农业气候资源的影响
Multi-model ensemble projection of crop yield of India under RCP 8.5 climate change scenario during the 21st century
DOI:10.11821/dlxb201911009
[本文引用: 1]
<p id="C2">Using the multi-model ensemble projections of wheat and rice in India during the 21st century from the Inter-Sectoral Impact Model Intercomparison Project, this study assessed the future changes in crop yield under the RCP 8.5 emission scenario. The results show that the multi-model ensemble simulations generally reproduce the spatial variability in crop yield that is represented by ground measurements. Furthermore, the simulations reproduce the response of crop yield to climate changes, which is characterized by negative correlations between crop yield and temperature and positive correlations between crop yield and precipitation. Under the RCP8.5 emission scenario, temperature and precipitation during the growing season of wheat and rice will increase. Generally, temperature will increase at a higher rate than precipitation; the increases in temperature and precipitation during the wheat growing season will be stronger than that during the rice growing season. In terms of spatial dimension, the increase in temperature will be weakened gradually from the north to the south, while that of precipitation will be intensified gradually from the north to the south. Temperature increase in the wheat producing areas will be stronger than that in the wheat non-producing area, while precipitation increase in the wheat producing areas will be weaker than that in the wheat non-producing areas. However, the scenario is predicted to be reversed for the rice producing areas. In response to the climate changes, wheat and rice yields will decrease in the 21st century, particularly in the second half. The decrease in wheat yield will be greater than that of rice yield. In the first half of the 21st century, wheat and rice yields are predicted to decrease at the rates of 1.3%/10 a (<i>P </i>< 0.001) and 0.7%/10 a (<i>P </i>< 0.05), respectively. In the second half of the 21st century, they are predicted to decrease at the rates of 4.9%/10 a (<i>P </i>< 0.001) and 4.4%/10 a (<i>P </i>< 0.05), respectively. The drought stress resulting from climate warming might be the main reason for this projected yield reduction. The greatest decrease in wheat yield (as high as 60%) will occur in the southwest part of the Deccan Plateau, and the greatest decrease in rice yield (as high as 50%) will occur in the northern part of the Gangetic Plain. These findings suggest that food supply in India will face extreme challenges under the future climate change scenarios.</p>
RCP 8.5气候变化情景下21世纪印度粮食单产变化的多模式集合模拟
DOI:10.11821/dlxb201911009
[本文引用: 1]
基于跨部门影响模型比较计划(ISI-MIP)中20种气候模式与作物模型组合的模拟结果,预估了RCP 8.5排放情景下21世纪印度小麦和水稻单产变化。研究发现:① 多模式集合模拟结果基本再现了印度小麦和水稻单产的空间差异;同时,再现了小麦和水稻单产对温度和降水变化的响应特征:与温度呈负相关,与降水呈正相关。② RCP 8.5情景下,水稻和小麦生长季温度和降水均呈增加趋势,小麦生长季的温度、降水增加幅度大于水稻。空间上,温度增加幅度自北向南逐渐减小,降水增幅则逐渐增加,并且小麦种植区升温幅度大于非种植区,降水增幅则少于非种植区,水稻种植区升温幅度小于非种植区,降水增幅则多于非种植区。③ RCP 8.5情景下,小麦和水稻单产均呈下降趋势,21世纪后半叶尤为明显。小麦单产的下降速度明显大于水稻,其中21世纪前半叶小麦和水稻单产下降速度约分别为1.3%/10a (P P P P
Future climate projection over Northwest China based on RegCM4.6 (2007-2099)
基于RegCM4.6的中国西北未来气候预测(2007—2099)
Future climate projection in Northwest China with RegCM4.6
Land cover change in China in the first decade of the 21st century
21世纪前十年的中国土地覆盖变化
Classification system of China land cover for carbon budget
基于碳收支的中国土地覆被分类系统
Remote sensing estimates of vapor pressure deficit: An overview
DOI:10.11867/j.issn.1001-8166.2014.05.0559
[本文引用: 1]
Vapor Pressure Deficit (VPD) is an important climatic variable widely used in many ecosystem models to simulate fluxes and states of water and carbon; it plays an important role in fire warning and epidemic disease early warning systems. Accurate estimation of spatio-temporally distributed VPD is critical for ecosystem and climate modeling efforts. In this paper, the available remote sensing datasets for satellitebased VPD estimation are analyzed, the precision and spatial resolution are two important factors for selecting remote sensing data. Then, the principle and advantages of different estimation algorithms are analyzed, which include the regression method and analytic method. The regression method is simple, but requires mass sample data and can not be used in other region before calibration. The analytic method is more complex, but can be used anywhere once established. The near surface air temperature and humidity are two key parameters for estimating VPD, which are usually estimated from the satellite retrieved land surface temperature and total precipitable water vapor. The errors in estimated VPD cloud are further eliminated by improving the accuracy of input remote sensing data and improving estimation algorithms of near surface air temperature and humidity. Finally, the existing problems and the VPD estimation research prospect are discussed. Most research work is limited in clear sky days until now, and VPD estimation under cloudy days is a challenging work, but it is important for many applications. A full VPD map could be achieved by combining several satellite data from different instruments, especially by taking the advantages of optical and microwave remote sensing. The prospects of the satellitebased VPD estimation technologies are presented.
饱和水汽压差的卫星遥感研究综述
DOI:10.11867/j.issn.1001-8166.2014.05.0559
[本文引用: 1]
饱和水汽压差是许多陆表生态和陆面过程模型中非常重要的输入参数之一,精确估算并获取其时空分布特征是生态、农业遥感领域亟待解决的问题之一。在简要回顾饱和水汽压差的应用和传统获取方法的基础上重点介绍遥感估算饱和水汽压差的数据源和估算方法,即统计方法和解析计算法,并对解析计算法所需关键参数的国内外相关研究进展进行概述,探讨目前遥感估算饱和水汽压差存在的不足,并结合目前遥感技术发展现状和此领域研究存在的问题探讨其发展趋势,展望了联合多源遥感数据进行高时空分辨率的饱和水汽压差遥感估算问题。
Water and heat availability are drivers of the aboveground plant carbon accumulation rate in alpine grasslands on the Tibetan Plateau
DOI:10.1111/geb.v29.1 URL [本文引用: 1]
Linkages of the dynamics of glaciers and lakes with the climate elements over the Tibetan Plateau
DOI:10.1016/j.earscirev.2018.06.012 URL [本文引用: 1]
Spatio-temporal characteristics of vegetation net primary productivity in the Ili River Basin from 2008 to 2018
2008—2018年伊犁河流域植被净初级生产力时空分异特征
Seasonal dynamics of terrestrial net primary production in response to climate changes in China
<p> Study on seasonal responses of terrestrial net primary production (NPP) to climate changes is to help understand feedback between climate systems and terrestrial ecosystems and mechanisms of increased NPP in the northern middle and high latitudes. In this study, time series dataset of normalized difference vegetation index (NDVI) and corresponding ground-based information on vegetation,climate, soil, and solar radiation, together with an ecological process model, were used to explore the seasonal trends of terrestrial NPP and their geographical differences in China from 1982 to 1999. As the results, seasonal total NPP in China showed a significant increase for all four seasons (spring,summer, autumn and winter) during the past 18 years. The spring NPP indicated the largest increase rate, while the summer NPP was with the largest increase in magnitude. The response of NPP to climate changes varied with different vegetation types. The increased NPP was primarily led by an advanced growing season for broadleaf evergreen forest, needle-leaf evergreen forest, and needle-leaf deciduous forest, whilst that was mainly due to enhanced vegetation activity (amplitude of growth cycle) during growing season for broadleaf deciduous forest, broadleaf and needle-leaf mixed forest, broadleaf trees with groundcover, perennial grasslands, broadleaf shrubs with grasslands, tundra, desert, and cultivation. The regions with the largest increase in spring NPP appeared mainly in eastern China, while the areas with the largest increase in summer NPP occurred in most parts of Northwestern China, Qinghai-Xizang Plateau, Mts. Xiaoxinganling-Changbaishan, Sanjiang Plain, Songliao Plain, Sichuan Basin, Leizhou Peninsula, part of the middle and lower Yangtze River, and southeastern mountainous areas of China. In autumn, the largest NPP increase appeared in Yunnan Plateau-Eastern Xizang and the areas around Hulun Lake. Such different ways of the NPP responses depended on regional climate attributes and their changes. Key words: Carnegie-Ames-Stanford-Approach (CASA) model; net primary production (NPP); seasonal change; normalized difference vegetation index (NDVI); climate change</p><p> <div style="text-align:center;"> <span style="font-size:12px;">我国不同季节陆地植被NPP对气候变化的响应</span> </div> <div style="text-align:center;"> <span style="font-size:12px;">朴世龙 方精云 陈安平</span> </div> <div style="text-align:center;"> <span style="font-size:12px;">(北京大学生态学系,北京大学地表过程分析与模拟教育部重点实验室,北京100871)</span> </div></p><p> 摘要: 阐明不同季节陆地植被净第一性生产力(NPP)对全球变化的响应将有助于理解陆地生态系统和气候系统之间的相互作用以及NPP变化机制.本文使用1982~1999年间的AVHRR/NDVI、气温、降水以及太阳辐射等资料,结合植被分布图和土壤质地图,利用生态过程模型,研究不同季节我国陆地植被NPP的年际变化及其地理分异.结果表明,在1982~1999年的18年间,4个季节的NPP都呈显著增加趋势.其中,春季是NPP增加速率最快的季节,夏季是NPP增加量最大的季节.不同植被类型对全球变化的响应有很大差异.常绿阔叶林、常绿针叶林和落叶针叶林NPP的增加主要由生长季节的提前所致,而落叶阔叶林、针阔混交林、矮林灌丛、温带草原及草甸、稀树草原、高寒植被、荒漠以及人工植被NPP的增加主要来自生长季生长加速的贡献.从区域分布看,在四季中春季NPP增加量最大的地区主要集中在东部季风区域;夏季NPP增加量最大的地区包括西北干旱区域和青藏高原的大部分地区、小兴安岭-长白山区、三江平原、松辽平原、四川盆地、雷州半岛、长江中下游部分地区以及江南山地东部;而秋季植被NPP增加量最大的地区主要有云南高原-西藏东部和呼伦湖的周围等地区.不同植被和地理区域NPP的这些响应方式与区域气候特征及其变化趋势有关.</p><p> 关键词: CASA模型;净第一性生产力(NPP);季节变化;归一化植被指数(NDVI);气候变化</p><p> 通讯作者。E-mail: jyfang @ urban.pku.edu.cn。</p><p> </p><p> 通讯作者。D/G%"!:h JBA%,-i7(&%,; ?]7; >H7; ), j 。</p>
我国不同季节陆地植被NPP对气候变化的响应
Analysis of NDVI change trend and its impact factors in the Three-River Headwater region from 2000 to 2013
2000—2013年三江源植被NDVI变化趋势及影响因素分析
DOI:10.3724/SP.J.1047.2016.01707
[本文引用: 1]
基于2000-2013年三江源MODIS NDVI数据,本文系统地分析了三江源植被生长季累计NDVI的时空变化特征,并结合三江源生态保护与建设工程实施的相关统计数据,探讨了人类活动对三江源植被变化的影响,最后通过气候因子与生长季累计NDVI的相关性分析,揭示了影响三江源不同地区植被变化的主要气候限制因素。结果表明,2000-2013年三江源植被NDVI整体上呈增加趋势,NDVI明显增加的区域面积比例达17.84%,主要分布于研究区的西部和北部;明显减少的区域仅占0.78%,多零星分布于研究区中部;NDVI变化稳定或没有显著变化趋势的区域面积比例为59.64%,主要位于研究区东部和南部。三江源生态保护与建设工程的实施虽然促进了植被恢复,但对区域植被整体变化的影响有限,研究时段内区域植被整体好转主要受气候因素控制。西部长江源区的植被生长主要受气温影响,东北部黄河源区主要受降水制约,南部澜沧江源区降水和气温的限制性均不明显。
Green-up dates in the Tibetan Plateau have continuously advanced from 1982 to 2011
Global-scale characterization of turning points in arid and semi-arid ecosystem functioning
DOI:10.1111/geb.v29.7 URL [本文引用: 1]
Change of NPP at the mid-high latitude of Northern Hemisphere in the 21st century and its relation with climate factors
21世纪北半球中高纬度净初级生产力(NPP)变化及其与气候因子之间的关系
The effects of warming and added water on key processes of grassland carbon cycle
增温增水对草地生态系统碳循环关键过程的影响
Droughts, wildfires, and forest carbon cycling: A pantropical synthesis
DOI:10.1146/annurev-earth-082517-010235
[本文引用: 1]
Tropical woody plants store similar to 230 petagrams of carbon (PgC) in their above-ground living biomass. This review suggests that these stocks are currently growing in primary forests at rates that have decreased in recent decades. Droughts are an important mechanism in reducing forest C uptake and stocks by decreasing photosynthesis, elevating tree mortality, increasing autotrophic respiration, and promoting wildfires. Tropical forests were a C source to the atmosphere during the 2015-2016 El Nino-related drought, with some estimates suggesting that up to 2.3 PgC were released. With continued climate change, the intensity and frequency of droughts and fires will likely increase. It is unclear at what point the impacts of severe, repeated disturbances by drought and fires could exceed tropical forests' capacity to recover. Although specific threshold conditions beyond which ecosystem properties could lead to alternative stable states are largely unknown, the growing body of scientific evidence points to such threshold conditions becoming more likely as climate and land use change across the tropics. Droughts have reduced forest carbon uptake and stocks by elevating tree mortality, increasing autotrophic respiration, and promoting wildfires. Threshold conditions beyond which tropical forests are pushed into alternative stable states are becoming more likely as effects of droughts intensify.
Response to Comments on "Drought-Induced Reduction in Global Terrestrial Net Primary Production from 2000 Through 2009"
Climate change risk assessment of ecosystem productivity in the arid/humid transition zone of northern China
DOI:10.11821/dlxb202107003
[本文引用: 1]
Climate change risk has been a challenge for the development of society. As the ecosystems in the arid/humid transition zone (AHTZ) in northern China are characterized by sensitive and complex response to climatic fluctuations, assessing the climate change risk for ecosystems in the AHTZ is of scientific significance to regional climate governance and risk management. This study utilized the net primary productivity (NPP) as the indice for risk assessment. Based on the climate data of five global climate models (GCMs) participating in the Coupled Model Intercomparison Project Phase 5 (CMIP5) and four Representative Concentration Pathways (RCPs), the NPP was simulated using an improved LPJ (Lund-Potsdam-Jena). A climate change risk assessment method was built to identify the climate change risk levels and their spatio-temporal distributions in the AHTZ at different periods in the future. Results show that NPP loss would gradually extend and aggravate the risk in the AHTZ from mid-term period to long-term period of the 21st century. The risk under the high-emission scenario would be more serious, mainly manifested as a negative anomaly and a downward trend of NPP. In particular, under RCP8.5, 81.85% of the area may face climate change risk, and 54.71% will reach a high risk. During 2071-2099, under RCP8.5, the NPP anomaly in the high-risk area will reach (-96.00±46.95) gC m-2 a-1, and the changing rate of NPP will reach (-3.56±3.40) gC m-2 a-1. The eastern plain of AHTZ and the eastern grasslands of Inner Mongolia are expected to become the main risk concentration areas. The future vegetation growth in these areas may be adversely affected by climate change. Increasing warming and intensifying drying may be important causes for future climate change risks.
中国北方干湿过渡区生态系统生产力的气候变化风险评估
DOI:10.11821/dlxb202107003
[本文引用: 1]
气候变化风险是人类社会发展面临的严峻挑战,评估识别对气候波动响应敏感且复杂的干湿过渡区生态系统所面临的气候变化风险是一个重要科学问题,对区域气候治理和风险管理具有科学意义。本文利用参与耦合模式比较计划第五阶段(CMIP5)的多气候模式多情景数据,通过改进和验证Lund-Potsdam-Jena(LPJ)动态全球植被模型,辨识未来不同时段生态系统生产力的气候变化风险等级及其时空分布,明晰气候因子对净初级生产力(NPP)风险的作用特征。结果表明:未来中远期干湿过渡区生态系统生产力面临的气候变化风险面积将可能扩大,风险等级将可能提升,高排放情景下的风险更加严重,主要表现为NPP距平为负,且仍有继续下降的趋势。尤其是典型浓度路径(RCP8.5)情景下,81.85%的地区将可能面临气候变化风险,54.71%将达到高风险。2071—2099年,RCP8.5高风险区的NPP距平将达到(-96.00±46.95) gC m<sup>-2</sup> a<sup>-1</sup>,NPP变化速率将达到(-3.56±3.40) gC m<sup>-2</sup> a<sup>-1</sup>。干湿过渡区东部平原和内蒙古东部草原区预估将可能成为风险主要集中区域,这些地区未来的植被生长将可能受到气候变化的不利影响,增温加剧和干旱程度加重可能是未来气候变化风险的重要驱动因素。
Increasing sensitivity of dryland vegetation greenness to precipitation due to rising atmospheric CO2
Water availability plays a critical role in shaping terrestrial ecosystems, particularly in low- and mid-latitude regions. The sensitivity of vegetation growth to precipitation strongly regulates global vegetation dynamics and their responses to drought, yet sensitivity changes in response to climate change remain poorly understood. Here we use long-term satellite observations combined with a dynamic statistical learning approach to examine changes in the sensitivity of vegetation greenness to precipitation over the past four decades. We observe a robust increase in precipitation sensitivity (0.624% yr) for drylands, and a decrease (-0.618% yr) for wet regions. Using model simulations, we show that the contrasting trends between dry and wet regions are caused by elevated atmospheric CO (eCO). eCO universally decreases the precipitation sensitivity by reducing leaf-level transpiration, particularly in wet regions. However, in drylands, this leaf-level transpiration reduction is overridden at the canopy scale by a large proportional increase in leaf area. The increased sensitivity for global drylands implies a potential decrease in ecosystem stability and greater impacts of droughts in these vulnerable ecosystems under continued global change.© 2022. The Author(s).
Variation trends of natural vegetation net primary productivity in China under climate change scenario
Based on the widely used Lund-Potsdam-Jena Dynamic Global Vegetation Model (LPJ) for climate change study, and according to the features of natural environment in China, the operation mechanism of the model was adjusted, and the parameters were modified. With the modified LPJ model and taking 1961-1990 as baseline period, the responses of natural vegetation net primary productivity (NPP) in China to climate change in 1991-2080 were simulated under the Special Report on Emissions Scenarios (SRES) B2 scenario. In 1961-1990, the total NPP of natural vegetation in China was about 3.06 Pg C a(-1); in 1961-2080, the total NPP showed a fluctuant decreasing trend, with an accelerated decreasing rate. Under the condition of slight precipitation change, the increase of mean air temperature would have definite adverse impact on the NPP. Spatially, the NPP decreased from southeast coast to northwest inland, and this pattern would have less variation under climate change. In eastern China with higher NPP, especially in Northeast China, east of North China, and Loess Plateau, the NPP would mainly have a decreasing trend; while in western China with lower NPP, especially in the Tibetan Plateau and Tarim Basin, the NPP would be increased. With the intensive climate change, such a variation trend of NPP would be more obvious.
气候变化情景下中国自然植被净初级生产力分布
Spatiotemporal pattern of gross primary productivity and its covariation with climate in China over the last thirty years
DOI:10.1111/gcb.13830
PMID:28727222
[本文引用: 1]
The uncertainties of China's gross primary productivity (GPP) estimates by global data-oriented products and ecosystem models justify a development of high-resolution data-oriented GPP dataset over China. We applied a machine learning algorithm developing a new GPP dataset for China with 0.1° spatial resolution and monthly temporal frequency based on eddy flux measurements from 40 sites in China and surrounding countries, most of which have not been explored in previous global GPP datasets. According to our estimates, mean annual GPP over China is 6.62 ± 0.23 PgC/year during 1982-2015 with a clear gradient from southeast to northwest. The trend of GPP estimated by this study (0.020 ± 0.002 PgC/year from 1982 to 2015) is almost two times of that estimated by the previous global dataset. The GPP increment is widely spread with 60% area showing significant increasing trend (p < .05), except for Inner Mongolia. Most ecosystem models overestimated the GPP magnitudes but underestimated the temporal trend of GPP. The monsoon affected eastern China, in particular the area surrounding Qinling Mountain, seems having larger contribution to interannual variability (IAV) of China's GPP than the semiarid northwestern China and Tibetan Plateau. At country scale, temperature is the dominant climatic driver for IAV of GPP. The area where IAV of GPP dominated by temperature is about 42%, while precipitation and solar radiation dominate 31% and 27% respectively over semiarid area and cold-wet area. Such spatial pattern was generally consistent with global GPP dataset, except over the Tibetan Plateau and northeastern forests, but not captured by most ecosystem models, highlighting future research needs to improve the modeling of ecosystem response to climate variations.© 2017 John Wiley & Sons Ltd.
Impact of future climate change on terrestrial ecosystems in China
DOI:10.1002/joc.v30:6 URL [本文引用: 1]
Altered trends in carbon uptake in China's terrestrial ecosystems under the enhanced summer monsoon and warming hiatus
Human activities have markedly altered the pattern and trend of net primary production in the Ili River basin of Northwest China under current climate change
DOI:10.1002/ldr.v33.14 URL [本文引用: 1]
Satellite observed widespread decline in Mongolian grasslands largely due to overgrazing
DOI:10.1111/gcb.12365
PMID:23966315
[本文引用: 1]
The Mongolian Steppe is one of the largest remaining grassland ecosystems. Recent studies have reported widespread decline of vegetation across the steppe and about 70% of this ecosystem is now considered degraded. Among the scientific community there has been an active debate about whether the observed degradation is related to climate, or over-grazing, or both. Here, we employ a new atmospheric correction and cloud screening algorithm (MAIAC) to investigate trends in satellite observed vegetation phenology. We relate these trends to changes in climate and domestic animal populations. A series of harmonic functions is fitted to Moderate Resolution Imaging Spectroradiometer (MODIS) observed phenological curves to quantify seasonal and inter-annual changes in vegetation. Our results show a widespread decline (of about 12% on average) in MODIS observed normalized difference vegetation index (NDVI) across the country but particularly in the transition zone between grassland and the Gobi desert, where recent decline was as much as 40% below the 2002 mean NDVI. While we found considerable regional differences in the causes of landscape degradation, about 80% of the decline in NDVI could be attributed to increase in livestock. Changes in precipitation were able to explain about 30% of degradation across the country as a whole but up to 50% in areas with denser vegetation cover (P < 0.05). Temperature changes, while significant, played only a minor role (r(2) = 0.10, P < 0.05). Our results suggest that the cumulative effect of overgrazing is a primary contributor to the degradation of the Mongolian steppe and is at least partially responsible for desertification reported in previous studies. © 2013 John Wiley & Sons Ltd.
Impacts of climate change and human activities on the NPP of vertical natural belts in arid zones
气候变化和人类活动对干旱区垂直自然带NPP的影响
Analysis of spatio-temporal variation characteristics and influencing factors of net primary productivity in terrestrial ecosystems of China
中国陆地生态系统净初级生产力时空变化特征及影响因素
Nonlinear, interacting responses to climate limit grassland production under global change
DOI:10.1073/pnas.1606734113
PMID:27601643
[本文引用: 1]
Global changes in climate, atmospheric composition, and pollutants are altering ecosystems and the goods and services they provide. Among approaches for predicting ecosystem responses, long-term observations and manipulative experiments can be powerful approaches for resolving single-factor and interactive effects of global changes on key metrics such as net primary production (NPP). Here we combine both approaches, developing multidimensional response surfaces for NPP based on the longest-running, best-replicated, most-multifactor global-change experiment at the ecosystem scale-a 17-y study of California grassland exposed to full-factorial warming, added precipitation, elevated CO2, and nitrogen deposition. Single-factor and interactive effects were not time-dependent, enabling us to analyze each year as a separate realization of the experiment and extract NPP as a continuous function of global-change factors. We found a ridge-shaped response surface in which NPP is humped (unimodal) in response to temperature and precipitation when CO2 and nitrogen are ambient, with peak NPP rising under elevated CO2 or nitrogen but also shifting to lower temperatures. Our results suggest that future climate change will push this ecosystem away from conditions that maximize NPP, but with large year-to-year variability.
High carbon dioxide uptake by subtropical forest ecosystems in the East Asian monsoon region
DOI:10.1073/pnas.1317065111
PMID:24639529
[本文引用: 1]
Temperate- and high-latitude forests have been shown to contribute a carbon sink in the Northern Hemisphere, but fewer studies have addressed the carbon balance of the subtropical forests. In the present study, we integrated eddy covariance observations established in the 1990s and 2000s to show that East Asian monsoon subtropical forests between 20 °N and 40 °N represent an average net ecosystem productivity (NEP) of 362 ± 39 g C m(-2) yr(-1) (mean ± 1 SE). This average forest NEP value is higher than that of Asian tropical and temperate forests and is also higher than that of forests at the same latitudes in Europe-Africa and North America. East Asian monsoon subtropical forests have comparable NEP to that of subtropical forests of the southeastern United States and intensively managed Western European forests. The total NEP of East Asian monsoon subtropical forests was estimated to be 0.72 ± 0.08 Pg C yr(-1), which accounts for 8% of the global forest NEP. This result indicates that the role of subtropical forests in the current global carbon cycle cannot be ignored and that the regional distributions of the Northern Hemisphere's terrestrial carbon sinks are needed to be reevaluated. The young stand ages and high nitrogen deposition, coupled with sufficient and synchronous water and heat availability, may be the primary reasons for the high NEP of this region, and further studies are needed to quantify the contribution of each underlying factor.
Relationship between nitrogen deposition and LUCC and its impact on terrestrial ecosystem carbon budgets in China
DOI:10.1007/s11430-015-5277-0 URL [本文引用: 1]
Grassland responses to global environmental changes suppressed by elevated CO2
Simulated global changes, including warming, increased precipitation, and nitrogen deposition, alone and in concert, increased net primary production (NPP) in the third year of ecosystem-scale manipulations in a California annual grassland. Elevated carbon dioxide also increased NPP, but only as a single-factor treatment. Across all multifactor manipulations, elevated carbon dioxide suppressed root allocation, decreasing the positive effects of increased temperature, precipitation, and nitrogen deposition on NPP. The NPP responses to interacting global changes differed greatly from simple combinations of single-factor responses. These findings indicate the importance of a multifactor experimental approach to understanding ecosystem responses to global change.
Saturation of global terrestrial carbon sink under a high warming scenario
Nonlinear characteristics of NPP based on ensemble empirical mode decomposition from 1982 to 2015: A case study of six coastal provinces in southeast China
Inconsistent changes in NPP and LAI determined from the parabolic LAI versus NPP relationship
