

1 引言
气候变化关系到人类的生存和发展。1992年《联合国气候变化框架公约》要求各缔约国按照可比性方法,编制、更新并公布各类温室气体的人为源排放和汇清除的国家清单。联合国政府间气候变化委员会(IPCC)发布了1996年[1]、2006年[2]和2019年[3]等不同版本的国家温室气体清单指南。清单核算类型包括能源[4⇓⇓-7]、工业过程和产品使用[7]、农业[7]、土地利用及其变化和林业、废弃物5个部门。土地是陆地生态系统碳源或碳汇的自然载体,土地利用及其变化和林业(Land Use, Land-use Change and Forestry, LULUCF)是碳源或碳汇核算(以下简称碳核算)的重要部门。2020年IPCC发布的《气候变化与土地》特别报告[8]指出LULUCF既能成为碳源,也能成为碳汇。例如,2020年捷克、哈萨克斯坦、荷兰、丹麦等国LULUCF是净碳排放源,美国、俄罗斯、澳大利亚、德国等国LULUCF是净碳汇,LULUCF碳源或碳汇的空间异质性特征明显[9],存在很大不确定性,如何整体性地碳核算并提升碳核算精度成为研究的热点。当前,植被生物量异速生长的模拟、森林生物量碳汇的核算[10⇓⇓-13]与预测[14],耦合遥感及地面监测技术的森林碳源碳汇核算[15],基于样地调查的地方化碳汇能力测算[16⇓-18]等是LULUCF碳核算研究的主要方向,林地[19⇓-21]、草地[22]的碳核算较成熟,但耕地[23]、湿地[24]等其他土地利用类型的碳核算研究不足,成果难以支撑所有土地利用类型的LULUCF碳核算。
作为《联合国气候变化框架公约》非附件I国家的缔约国,中国在2020年明确提出2030年“碳达峰”与2060年“碳中和”目标,2021年中共中央、国务院印发《关于完整准确全面贯彻新发展理念做好碳达峰碳中和工作的意见》,要求持续提升碳汇增量和碳汇能力。科学核算LULUCF碳汇并提高核算精度可为实现碳中和目标提供支撑。IPCC采纳的碳核算5个部门中,LULUCF是碳汇的主要来源,国内符合IPCC框架的核算方法很少[25]。例如,研究土地整理对耕地土壤碳含量影响大小及其影响因素,其成果因空间尺度太小而缺乏核算的参考价值[23]。研究芦苇湿地在芦苇生长季的碳通量变化及影响因素,其成果因核算期太短不符合LULUCF年度碳核算的规范[24],也缺乏参考价值。在省域、市域或流域尺度碳核算上,基本采用土地利用“碳排放系数法”[26⇓⇓⇓-30],该方法假定了每一类土地碳排放强度或强度区间[31],其碳核算的本质是土地利用结构的“碳排放系数”加权求和。其方法简单易操作,但其碳核算结果精度不足。中国向联合国提交的历次(2004年、2012年及2017年)“气候变化国家信息通报”以及制定的《省级温室气体清单编制指南》(2011年)均遵循《IPCC国家温室气体清单指南》(1996年修订版)[1,32 -33],受数据和方法约束,LULUCF碳核算仅考虑了森林生物量碳库的变化,即“森林和其他木质生物质碳储量变化”和“森林转化碳排放(燃烧、分解排放)”两部分,未考虑土壤碳库、采伐木产品碳库及土地利用变化等部分,难以满足LULUCF的全面核算以及“碳达峰碳中和”目标下土地利用和自然资源的精细管理需要。随着中国自然资源调查内容的丰富和精度的增加,相关学科研究成果的进展,为LULUCF碳核算提供了基础。探索系统性精细化的核算方法,提高中国LULUCF碳核算的精度,推进LULUCF低碳增汇土地利用和自然资源政策的制定,具有重要现实意义。
本文参考IPCC关于LULUCF的国家温室气体清单指南2006年版[2]及2019年版[3],采用多期土地利用、森林及土壤调查数据开展LULUCF碳核算,旨在推进中国LULUCF碳核算方法,支撑“双碳”目标的土地精细化管理。本文选择广东省作为研究区域,有以下几方面的考虑。① 广东省陆地地貌类型较多,土地利用类型齐全,包含了LULUCF碳核算的所有土地利用类型。② 广东省是中国改革开放的前沿阵地,改革开放以来建设用地快速扩张、大规模的林业工程和土地整理活动使土地利用发生了剧烈变化[34],LULUCF产生的碳源或碳汇规模相对显著,有利于采用“库—差别法”进行碳核算。③ 广东省省内社会经济发展存在较大差异,LULUCF产生的碳源或碳汇同样存在空间异质性,具有一定典型性。
2 研究区概况与研究方法
2.1 研究区概况
广东省位于中国南部(20°09′N~25°31′N, 109°45′E~117°20′E),属热带及亚热带季风气候,据《广东自然资源年鉴2020》[35],广东省土地面积1797.25万 hm2,其中耕地259.41万hm2、林地1001.13万hm2、园地125.72万hm2、牧草地0.31万 hm2;年平均降雨量1505.2 mm,年平均气温22.8 °C,年日照1766.5 h;广东省森林面积1052.41万hm2,其中林业用地上的森林面积979.42万hm2,非林业用地上的森林面积72.99万hm2,有林地占86.31%,疏林地占0.19%,灌木林地占6.83%,森林蓄积量5.84亿m3,植被优势种有杉木、马尾松、湿地松、黎蒴、木麻黄、速生相思等;广东省社会经济发达,土地利用强度高,建设用地总规模208.53万hm2,但省内市际差异显著,建设用地总规模最大的广州市19.49万hm2,最小的潮州市4.49万hm2。
2.2 数据来源
广东省行政区划图及土地利用数据来源于中国科学院资源环境科学环境数据中心(
2.3 研究方法
2.3.1 库—差别法碳核算
用库—差别法核算LULUCF产生的碳源或碳汇量,公式如下:
式中:
本文重点核算生物量碳库及土壤碳库的年度变化量(图1),因数据不可获得性未核算死木、枯枝落叶及采伐的木产品碳库的年度变化。该年度变化量乘以碳元素与CO2的转换系数(44/12),可以转换为以CO2质量计量的碳源或碳汇量。对生物量碳库的核算主要基于森林二类调查、植被异速生长模型及IPCC国家温室气体清单指南的参考值,对土壤碳库的核算主要基于土壤普查及高分辨率国家土壤信息格网调查等成果。
图1
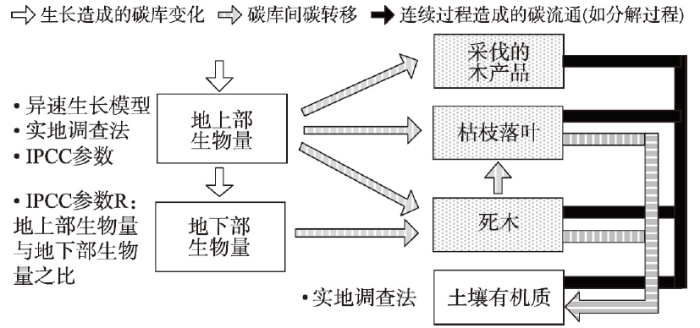
图1
主要碳池碳流通及基于IPCC温室气体清单指南的核算方法
注:本文核算了白底框(地上部生物量、地下部生物量及土壤有机质)所示碳池的碳储量及其年度变化量(碳源或碳汇)。
Fig. 1
Carbon flows between the major C pools and their accounting methods in accordance with IPCC guidelines
本文参考《IPCC国家温室气体清单指南》2006年及2019年版,各类型土地碳核算方法及数据来源汇总如表1。
表1 土地利用及其变化以及林业的生物量、土壤碳核算方法与数据来源
Tab. 1
| 地类 | 生物量碳源或碳汇量 | 土壤碳源或碳汇量 | 数据来源 | ||||
|---|---|---|---|---|---|---|---|
| 核算方法 | 数据时期 | 核算方法 | 数据时期 | ||||
| 林地 | 植被异速生长模型 | 2013—2016年 2017—2018年2020年 | 土壤调查,库—差别法 | 1979—1985年2010—2018年 | A,B,C,D,E,F | ||
| 湿地 | 植被异速生长模型 | 2013—2016年 2017—2018年2020年 | 土壤调查,库—差别法 | 1979—1985年2010—2018年 | A,B,C,D,E,F | ||
| 耕地 | 耕地“一年生”当年生物量碳源或碳汇设为0 | 2018年2020年 | 土壤调查,库—差别法 | 1979—1985年2010—2018年 | B,C,D,E | ||
| 草地 | 草地“一年生”当年生物量碳源或碳汇设为0 | 2018年2020年 | 土壤调查,库—差别法 | 1979—1985年2010—2018年 | B,C,D,E | ||
| 建设用地 | 建设用地当年生物量碳源或碳汇设为0 | 2018年2020年 | 土壤调查,库—差别法 | 1979—1985年2010—2018年 | B,C,D,E | ||
| 林地转建设用地 | 森林资源二类调查,库—差别法 | 2013—2016年 2017—2018年2020年 | 地类转换当年土壤碳库变化不大,当年碳源或碳汇量设为0 | 2018年 | A,E,F | ||
| 草地转建设用地 | 森林资源二类调查,库—差别法 | 2013—2016年 2017—2018年2020年 | 地类转换当年土壤碳库变化不大,当年碳源或碳汇量设为0 | 2018年 | A,E,F | ||
| 耕地转林地 | IPCC参考值,植被异速生长模型,库—差别法 | 2013—2016年 2017—2018年2020年 | 地类转换当年土壤碳库变化不大,当年碳源或碳汇量设为0 | 2018年 | A,E,F | ||
| 耕地转建设用地 | IPCC参考值,库—差别法 | 2018年 2020年 | 地类转换当年土壤碳库变化不大,当年碳源或碳汇量设为0 | 2018年 | E,F | ||
| 其他类型土地 | 其他类型土地植被当年生物量碳源或碳汇设为0 | 2018年 | 土壤调查 库—差别法 | 1979—1985年 2010—2018年 | B,C,D,E | ||
注:A为广东省第四次森林资源二类资源调查数据库(2013—2016年部分试点地市、2017—2018年全省域);B为全国第二次土壤普查数据广东部分(1979—1985年);C为中国高分辨率国家土壤信息格网基本属性数据集广东部分(2010—2018年);D为1979年广东省土地利用分类图;E为2018年广东省土地利用分类图;F为2020年广东省土地利用分类图。
2.3.2 生物量碳库量及碳源或碳汇核算
对某一土地利用类型的土地(表2),地上部及地下部生物量碳库及碳源或碳汇核算公式如下:
表2 广东省LULUCF生物量碳核算方法及相关参数
Tab. 2
| 碳核算公式及参数 | 用地类 | |||||
|---|---|---|---|---|---|---|
| 林地、湿地 | 林地转建设用地 | 草地转建设用地 | 耕地转建设用地 | 耕地转林地 | 耕地、草地、建设用地、其他 | |
| 公式(11) | 公式(8) | 公式(8) | 公式(8) | 公式(8) | 0 | |
| 0 | 0 | 0 | 公式(3)、(4) | |||
| 公式(3)(4) | 公式(3)、(4) | 公式(3)、(4) | 公式(3)、(4) | |||
| DryBiomass | 林地:公式(5) | 草地:公式(5) | 耕地:DryBiomass=10 | 耕地:DryBiomass=10;林地:公式(5) | ||
| BioMassAB | 公式(6) | 林地:公式(6) | 草地:按优势种取值,见表2 | 林地:公式(9) | ||
| Vol | 公式(7) | 林地:公式(7) | ||||
| B | 公式(9) | 按广东全树种均值取值,见表2 | ||||
| VegaAge | 林业小班变量 | VegaAge= | ||||
| R | 若BioMassAB<125,R=0.2;若BioMassAB≥125,R=0.24 | 若BioMassAB<125,R=0.2;若BioMassAB≥125,R=0.24 | 1.6 | 0.2 | ||
| CF | 0.47 | 0.47 | 0.47 | 0.47 | 0.47 | |
| BCEFS | 若Vol≤20,BCEFS=2.0;若21≤Vol≤40,BCEFS=1.0;若41≤Vol≤80,BCEFS=0.6;若Vol>80,BCEFS=0.4 | 若Vol≤20,BCEFS=2.0;若21≤Vol≤40,BCEFS=1.0;若41≤Vol≤80,BCEFS=0.6;若Vol>80,BCEFS=0.4 | ||||
| Outp | 63% | 63% | ||||
注:DryBiomass、R、CF、BCEFS等值参考了《IPCC国家温室气体清单指南》2006年版与2019年版;B值参考广东省本土化的植被异速生长建模结果及第四次森林二类调查均值(
式中:
基于森林资源二类调查计算广东省植被地上生物量密度与植被平均年龄的关系。
表3 按照植被优势种汇总的地上植被生物量密度均值与植被平均年龄的关系
Tab. 3
| 植被优势种(组) | 拟合公式或调查统计值(t hm-2) | R2 | B值 |
|---|---|---|---|
| 杉木 | BioMassAB=19.31×ln(VegaAge)-7.42 | 0.74 | 19.31 |
| 马尾松(广东松) | BioMassAB=12.48×ln(VegaAge)-2.31 | 0.86 | 12.48 |
| 湿地松(国外松) | BioMassAB=11.65×ln(VegaAge)+3.88 | 0.78 | 11.65 |
| 黎蒴 | BioMassAB=7.45×ln(VegaAge)+17.87 | 0.48 | 7.45 |
| 木麻黄 | BioMassAB=10.09×ln(VegaAge)+9.40 | 0.49 | 10.09 |
| 速生相思 | BioMassAB=9.30×ln(VegaAge)+14.30 | 0.52 | 9.30 |
| 阔叶混交林 | BioMassAB=11.10×ln(VegaAge)+1.73 | 0.75 | 11.10 |
| 针阔混交林 | BioMassAB=15.77×ln(VegaAge)-9.68 | 0.72 | 15.77 |
| 针叶混交林 | BioMassAB=15.17×ln(VegaAge)-5.91 | 0.82 | 15.17 |
| 其它林产化工树 | BioMassAB=18.37×ln(VegaAge)-12.45 | 0.84 | 18.37 |
| 其它软阔 | BioMassAB=13.30×ln(VegaAge)-4.42 | 0.69 | 13.30 |
| 其它硬阔 | BioMassAB=13.70×ln(VegaAge)-7.54 | 0.75 | 13.70 |
| 其他无确定树种(广东全树种均值) | BioMassAB=10.39×ln(VegaAge)+3.45 | 0.63 | 10.39 |
| 湿地植被组合(沿海防护林、湿地红树林) | BioMassAB=15.48×ln(VegaAge)+12.14 | 0.43 | 15.48 |
| 草本(综合) | BioMassAB=2.25 | 调查均值 | |
| 芒箕 | BioMassAB=4.79 | 调查均值 | |
| 蕨类 | BioMassAB=2.79 | 调查均值 | |
| 大芒 | BioMassAB=4.70 | 调查均值 | |
| 小芒 | BioMassAB=3.31 | 调查均值 | |
| 杂草 | BioMassAB=2.00 | 调查均值 |
2.3.3 土壤碳库及碳源或碳汇核算
图2
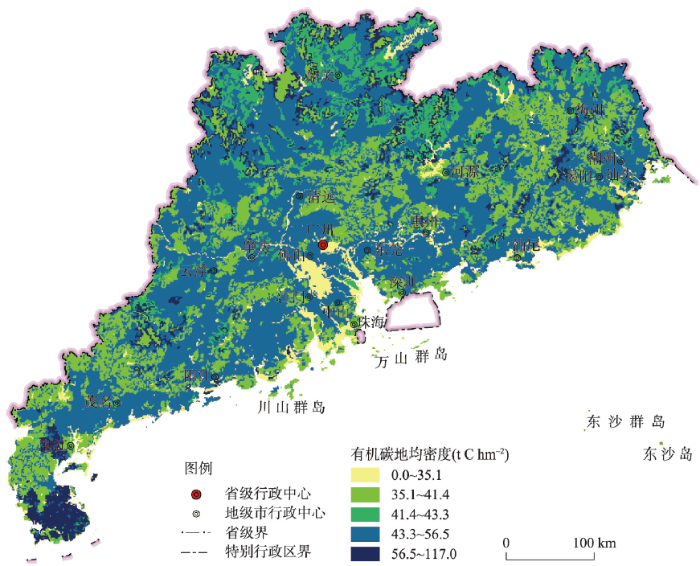
图2
1979—1985年广东省表层土壤有机碳地均密度
注:基于自然资源部标准地图服务网站审图号为GS(2019)3333号的标准地图制作,底图边界无修改。
Fig. 2
Average organic carbon stock per hectare of top soil in Guangdong from 1979 to 1985
图3
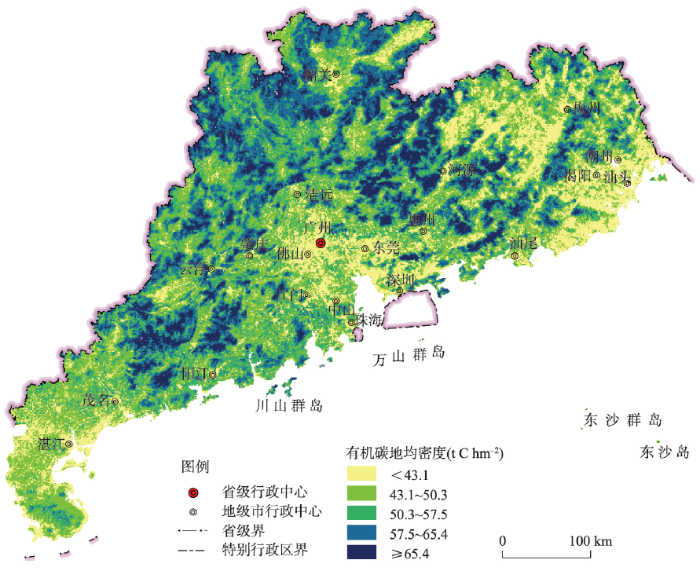
图3
2010—2018年广东省表层土壤有机碳地均密度
注:基于自然资源部标准地图服务网站审图号为GS(2019)3333号的标准地图制作,底图边界无修改。
Fig. 3
Average organic carbon stock per hectare of top soil in Guangdong from 2010 to 2018
式中:
图4
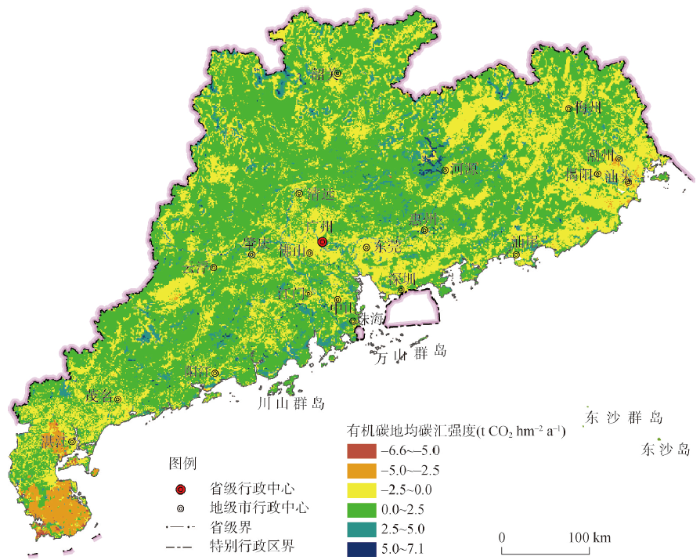
图4
2018年广东省表层土壤有机碳地均碳汇强度
注:基于自然资源部标准地图服务网站审图号为GS(2019)3333号的标准地图制作,底图边界无修改;若地均碳汇强度为负值,即表层土壤有机碳是碳排放源。
Fig. 4
Organic carbon sinks per hectare of top soil in Guangdong in 2018
2.3.4 地均碳源或碳汇强度计算方法
LULUCF地均碳源或碳汇强度地块尺度计算公式:
式中,
3 结果分析
3.1 广东省LULUCF碳核算结果
从生物量碳源或碳汇看(表4),广东省LULUCF生物量碳汇主要来源于林地碳汇及耕地转林地的碳汇,碳排放主要来源于耕地转建设用地,因林地转建设用地产生的碳排放次之。其中,粤北山区的清远市、韶关市、河源市等林地面积较大的区域其林地生物量碳汇总量也较大,湛江市及茂名市因耕地转建设用地产生的年均生物量碳排量较高。
表4 2018—2020年广东省LULUCF的生物量年均碳汇量(万t CO2 a-1)及面积(万hm2)
Tab. 4
| 统计区 | 林地 | 湿地 | 林地转建设用地 | 草地转建设用地 | 耕地转林地 | 耕地转建设用地 | ||||||||||||||||
|---|---|---|---|---|---|---|---|---|---|---|---|---|---|---|---|---|---|---|---|---|---|---|
| 碳汇 | 面积 | 碳汇 | 面积 | 碳汇 | 面积 | 碳汇 | 面积 | 碳汇 | 面积 | 碳汇 | 面积 | |||||||||||
| 广州市 | 43.3 | 22.1 | 0.03 | 0.01 | -15.3 | 0.6 | -0.2 | 0.02 | 13.4 | 2.8 | -23.4 | 1.4 | ||||||||||
| 韶关市 | 337.6 | 110.3 | 0.03 | 0.03 | -27.5 | 0.3 | -0.5 | 0.05 | 36.9 | 7.7 | -12.3 | 0.7 | ||||||||||
| 深圳市 | 6.9 | 4.7 | 0.00 | 0.00 | -8.3 | 0.3 | -0.1 | 0.01 | 1.4 | 0.3 | -2.3 | 0.2 | ||||||||||
| 珠海市 | 3.9 | 3.2 | 0.01 | 0.01 | -5.2 | 0.2 | -0.3 | 0.03 | 1.2 | 0.2 | -2.9 | 0.2 | ||||||||||
| 汕头市 | 6.7 | 2.9 | 0.02 | 0.06 | -0.8 | 0.1 | -0.3 | 0.03 | 2.6 | 0.5 | -10.2 | 0.6 | ||||||||||
| 佛山市 | 16.9 | 5.1 | 0 | 0.02 | -3.3 | 0.2 | 0.0 | 0.00 | 4.0 | 0.8 | -16.3 | 1.0 | ||||||||||
| 江门市 | 107.2 | 31.7 | 0.04 | 0.08 | -26.3 | 0.5 | -0.3 | 0.03 | 23.9 | 5.0 | -18.8 | 1.1 | ||||||||||
| 湛江市 | 63.9 | 11.7 | 0.41 | 0.9 | -9.3 | 0.4 | -0.1 | 0.01 | 51.0 | 10.6 | -36.9 | 2.2 | ||||||||||
| 茂名市 | 113.1 | 43.4 | 0.07 | 0.22 | -7.3 | 0.5 | -0.1 | 0.01 | 37.4 | 7.8 | -27.5 | 1.6 | ||||||||||
| 肇庆市 | 263.3 | 73.6 | 0.01 | 0.02 | -99.1 | 0.4 | -0.2 | 0.02 | 24.9 | 5.2 | -10.7 | 0.6 | ||||||||||
| 惠州市 | 169.6 | 57.7 | 0.01 | 0.01 | -33.1 | 0.6 | -0.4 | 0.04 | 23.5 | 4.9 | -17.6 | 1.0 | ||||||||||
| 梅州市 | 248.2 | 95.2 | 0.00 | 0.01 | -12.0 | 0.3 | -0.4 | 0.04 | 34.8 | 7.3 | -9.0 | 0.5 | ||||||||||
| 汕尾市 | 49.8 | 14.8 | 0.03 | 0.2 | -2.5 | 0.1 | -0.9 | 0.09 | 7.9 | 1.6 | -6.1 | 0.4 | ||||||||||
| 河源市 | 282.6 | 98.4 | 0.03 | 0.02 | -7.3 | 0.3 | -0.3 | 0.03 | 32.1 | 6.7 | -4.7 | 0.3 | ||||||||||
| 阳江市 | 91.8 | 33.0 | 0.06 | 0.21 | -20.7 | 0.3 | -0.2 | 0.02 | 21.8 | 4.6 | -11.7 | 0.7 | ||||||||||
| 清远市 | 302.3 | 102.4 | 0.04 | 0.05 | -17.5 | 0.4 | -0.5 | 0.05 | 43.1 | 9.0 | -16.6 | 1 | ||||||||||
| 东莞市 | 4.7 | 3.0 | 0.00 | 0.00 | -6.0 | 0.4 | -0.3 | 0.03 | 1.0 | 0.2 | -5.5 | 0.3 | ||||||||||
| 中山市 | 2.8 | 2.4 | 0.00 | 0.00 | -5.5 | 0.2 | -0.1 | 0.01 | 0.8 | 0.2 | -5.5 | 0.3 | ||||||||||
| 潮州市 | 30.2 | 11.0 | 0.00 | 0.02 | -1.6 | 0.1 | -0.2 | 0.02 | 6.6 | 1.4 | -8.2 | 0.5 | ||||||||||
| 揭阳市 | 55.7 | 16.5 | 0.01 | 0.01 | -5.7 | 0.2 | -0.4 | 0.04 | 11.3 | 2.4 | -15.5 | 0.9 | ||||||||||
| 云浮市 | 120.2 | 41.8 | 0.00 | 0.00 | -7.2 | 0.3 | -0.3 | 0.03 | 17.7 | 3.7 | -9.2 | 0.6 | ||||||||||
| 广东省 | 2320.9 | 785.3 | 0.80 | 1.88 | -321.5 | 6.6 | -6.1 | 0.61 | 397.4 | 82.9 | -271 | 15.8 | ||||||||||
注:碳汇数值若为负值,则LULUCF是碳排放源。
从土壤碳源或碳汇看(表5),1979—2018年,广东省林地土壤有机碳碳汇是表层土壤碳汇的主要来源,但湛江市林地表层土壤有机碳年度碳汇量为负值(-3.0万t CO2 a-1),这可能跟湛江市“砍伐原始森林,大面积种植橡胶树,充分利用土地,导致土壤中有机质逐渐降低”[43]有关。广东省耕地和建设用地的表层土壤有机碳年均碳汇量有正值也有负值,但全省总值为负值,属于弱的碳源。耕地表层土壤有机碳年均碳汇量正负值的区域差异尤为明显,这可能与各地市农业管理、土地利用强度、水田旱地利用结构、有机肥料输入、土地退化[2-3,8]等空间分异有关。建设用地表层土壤有机碳年均碳汇值一般为负值(属于弱的碳源),这可能与建设用地覆盖封存的土壤有机碳在热带及亚热带季风气候下分解(图1)有关,但广州市建成区绿化覆盖率1979—2018年由23%持续增长至45%[44],建设用地表层土壤有机碳碳库年度变化量为正值(属于弱的碳汇),这可能与城市绿地表层土壤有枯枝落叶或死木有机碳输入,形成土壤碳汇有关。
表5 1979—2018年广东省土地利用类型不变的地类土壤有机碳年均碳汇量(万 t CO2 a-1)及面积(万 hm2)
Tab. 5
| 统计区 | 林地 | 耕地 | 草地 | 建设用地 | 湿地 | |||||||||||||
|---|---|---|---|---|---|---|---|---|---|---|---|---|---|---|---|---|---|---|
| 碳汇 | 面积 | 碳汇 | 面积 | 碳汇 | 面积 | 碳汇 | 面积 | 碳汇 | 面积 | |||||||||
| 广州市 | 29.3 | 19.9 | 3.9 | 13.6 | 0.1 | 0.1 | 1.0 | 2.7 | 0.00 | 0.00 | ||||||||
| 韶关市 | 98.8 | 100.0 | 1.7 | 14.6 | 0.9 | 2.3 | -0.3 | 0.5 | 0.00 | 0.01 | ||||||||
| 深圳市 | 4.8 | 4.4 | 0.1 | 0.5 | 0.0 | 0.0 | -1.6 | 2.0 | 0.00 | 0.00 | ||||||||
| 珠海市 | 2.0 | 2.2 | 3.6 | 3.0 | 0.0 | 0.0 | -0.1 | 0.4 | 0.00 | 0.00 | ||||||||
| 汕头市 | 1.0 | 2.3 | -5.3 | 5.3 | 0.0 | 0.4 | -0.9 | 0.6 | 0.00 | 0.03 | ||||||||
| 佛山市 | 4.3 | 4.6 | 0.5 | 6.2 | 0.0 | 0.0 | -1.1 | 1.8 | 0.01 | 0.01 | ||||||||
| 江门市 | 34.7 | 28.0 | 10.5 | 15.2 | 0.1 | 0.3 | -0.4 | 0.9 | 0.00 | 0.02 | ||||||||
| 湛江市 | -3.0 | 7.5 | -36.3 | 42.5 | 0.0 | 0.1 | -1.1 | 1.1 | 0.02 | 0.26 | ||||||||
| 茂名市 | 40.9 | 38.3 | 3.8 | 16.5 | 0.4 | 0.4 | -0.5 | 0.9 | 0.01 | 0.12 | ||||||||
| 肇庆市 | 59.7 | 69.4 | 1.7 | 9.9 | 0.1 | 0.4 | -0.2 | 0.4 | 0.00 | 0.00 | ||||||||
| 惠州市 | 67.4 | 54.0 | 2.8 | 15.6 | 0.1 | 0.3 | -0.7 | 1.1 | 0.00 | 0.00 | ||||||||
| 梅州市 | 46.0 | 87.4 | -2.3 | 9.8 | 0.2 | 2.0 | -0.4 | 0.4 | 0.00 | 0.02 | ||||||||
| 汕尾市 | 10.9 | 13.0 | 0.7 | 7.9 | -0.9 | 3.7 | -0.3 | 0.2 | 0.08 | 0.13 | ||||||||
| 河源市 | 82.4 | 91.2 | -2.1 | 6.6 | 0.3 | 1.2 | -0.3 | 0.2 | 0.00 | 0.00 | ||||||||
| 阳江市 | 37.9 | 29.3 | 4.5 | 13.1 | 0.2 | 0.3 | -0.4 | 0.4 | 0.00 | 0.08 | ||||||||
| 清远市 | 104.9 | 93.2 | 5.5 | 19.3 | 3.0 | 4.0 | -0.2 | 0.5 | 0.01 | 0.02 | ||||||||
| 东莞市 | 2.5 | 2.5 | -0.1 | 1.2 | 0.0 | 0.1 | -1.7 | 1.8 | 0.00 | 0.00 | ||||||||
| 中山市 | 2.1 | 2.0 | 3.1 | 3.9 | 0.0 | 0.0 | -0.3 | 0.7 | 0.00 | 0.00 | ||||||||
| 潮州市 | 2.1 | 9.1 | -5.1 | 5.5 | -0.1 | 0.4 | -0.5 | 0.3 | 0.01 | 0.01 | ||||||||
| 揭阳市 | 10.1 | 14.6 | -7.6 | 12.7 | 0.0 | 0.8 | -0.6 | 0.4 | 0.00 | 0.00 | ||||||||
| 云浮市 | 38.0 | 38.5 | -1.7 | 7.4 | -0.3 | 0.8 | -0.2 | 0.3 | 0.00 | 0.00 | ||||||||
| 广东省 | 676.8 | 711.4 | -18.1 | 230.3 | 4.1 | 17.6 | -10.8 | 17.6 | 0.13 | 0.71 | ||||||||
注:碳汇数值若为负值,则土地利用是碳排放源。
生物量碳汇是LULUCF碳汇的主要形式,其次是土壤碳汇。广东省2018年度LULUCF碳汇年均值2967.3万t CO2 a-1,其中生物量碳汇2120.5万t CO2 a-1,土壤碳汇846.8万t CO2 a-1。按地类,林地以及耕地转林地是LULUCF碳汇的最主要来源,林地转建设用地以及耕地转建设用地是LULUCF碳源的主要来源。耕地和建设用地一般是弱碳源,草地和湿地一般为弱碳汇。
3.2 广东省LULUCF地均碳源或碳汇强度“一张图”
广东省2018年度LULUCF全省域地均碳汇强度1.7 t CO2 hm-2 a-1,其中耕地转林地(退耕还林且植树造林)的地均碳汇强度最大(4.8 t CO2 hm-2 a-1),既有林地地均碳汇强度次之(林木生长及林地土壤有机碳累积,3.9 t CO2 hm-2 a-1),林地转建设用地(建设用地占用林地而毁林)的地均碳源强度最大(-48.7 t CO2 hm-2 a-1),耕地转建设用地的地均碳源能力次之(-17.2 t CO2 hm-2 a-1)。湿地(0.6 t CO2 hm-2 a-1)和草地(0.2 t CO2 hm-2 a-1)地均碳汇能力较弱,耕地(-0.1 t CO2 hm-2 a-1)和建设用地(-0.6 t CO2 hm-2 a-1)地均碳源能力较弱(表6)。
表6 2018年度广东省土地利用及其变化和林业碳汇年均值
Tab. 6
| 碳核算类别 | 面积 (万 hm2) | 生物量碳汇 (万 t CO2 a-1) | 土壤碳汇 (万 t CO2 a-1) | 总碳汇 (万 t CO2 a-1) | 地均碳汇强度 (t CO2 hm-2 a-1) | |
|---|---|---|---|---|---|---|
| 林地 | 生物量 | 785.3 | 2320.9 | - | 2997.7 | 3.9 |
| 土壤有机碳 | 711.4 | - | 676.8 | |||
| 湿地 | 生物量 | 1.9 | 0.8 | - | 0.9 | 0.6 |
| 土壤有机碳 | 0.7 | - | 0.1 | |||
| 耕地 | 230.3 | 0.0 | -18.1 | -18.1 | -0.1 | |
| 草地 | 17.6 | 0.0 | 4.1 | 4.1 | 0.2 | |
| 建设用地 | 17.6 | 0.0 | -10.8 | -10.8 | -0.6 | |
| 林地转建设用地 | 6.6 | -321.5 | 0.0 | -321.5 | -48.7 | |
| 草地转建设用地 | 0.6 | -6.1 | 0.0 | -6.1 | -10.0 | |
| 耕地转林地 | 82.9 | 397.4 | 0.0 | 397.4 | 4.8 | |
| 耕地转建设用地 | 15.8 | -271.0 | 0.0 | -271.0 | -17.2 | |
| 其他类型土地 | 707.3 | 0.0 | 194.7 | 194.7 | 0.3 | |
| LULUCF汇总 | 1790.8 | 2120.5 | 846.8 | 2967.3 | 1.7 | |
注:碳汇数值若为负值,则LULUCF是碳排放源。
图5
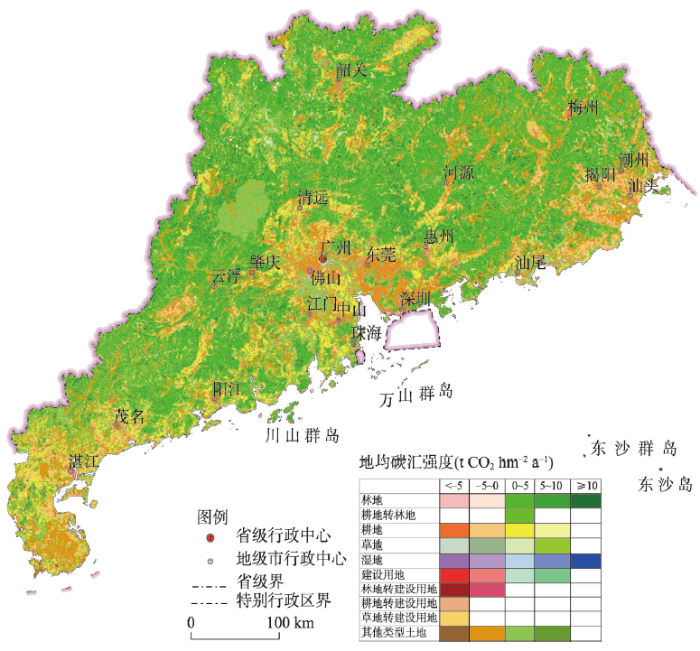
图5
2018年广东LULUCF地均碳汇强度
注:基于自然资源部标准地图服务网站审图号为GS(2019)3333号的标准地图制作,底图无修改;若地均碳汇强度为负,即LULUCF是碳排放源。
Fig. 5
Carbon sinks per hectare of each subcategory of LULUCF in Guangdong in 2018
表7 2018年度广东省各地市主要土地利用及其变化和林业地均碳汇强度(t CO2 hm-2 a-1)
Tab. 7
| 统计区 | 林地 | 湿地 | 耕地 | 草地 | 建设用地 | 林地转建设用地 |
|---|---|---|---|---|---|---|
| 广州市 | 3.4 | 3.0 | 0.3 | 1.0 | 0.4 | -25.5 |
| 韶关市 | 4.0 | 1.1 | 0.1 | 0.4 | -0.6 | -91.7 |
| 深圳市 | 2.6 | 0.0 | 0.2 | 0.0 | -0.8 | -27.7 |
| 珠海市 | 2.1 | 0.0 | 1.2 | 0.0 | -0.3 | -26.0 |
| 汕头市 | 2.7 | 0.3 | -1.0 | 0.0 | -1.5 | -8.0 |
| 佛山市 | 4.2 | 0.8 | 0.1 | 0.0 | -0.6 | -16.5 |
| 江门市 | 4.6 | 0.6 | 0.7 | 0.3 | -0.4 | -52.6 |
| 湛江市 | 5.1 | 0.5 | -0.9 | 0.0 | -1.0 | -23.3 |
| 茂名市 | 3.7 | 0.4 | 0.2 | 1.0 | -0.6 | -14.6 |
| 肇庆市 | 4.4 | 0.5 | 0.2 | 0.3 | -0.5 | -247.8 |
| 惠州市 | 4.2 | 0.0 | 0.2 | 0.3 | -0.6 | -55.2 |
| 梅州市 | 3.1 | 0.2 | -0.2 | 0.1 | -1.0 | -40.0 |
| 汕尾市 | 4.2 | 0.7 | 0.1 | -0.2 | -1.5 | -25.0 |
| 河源市 | 3.8 | 1.5 | -0.3 | 0.3 | -1.5 | -24.3 |
| 阳江市 | 4.1 | 0.3 | 0.3 | 0.7 | -1.0 | -69.0 |
| 清远市 | 4.1 | 1.2 | 0.3 | 0.8 | -0.4 | -43.8 |
| 东莞市 | 2.6 | 0.0 | -0.1 | 0.0 | -0.9 | -15.0 |
| 中山市 | 2.2 | 0.0 | 0.8 | 0.0 | -0.4 | -27.5 |
| 潮州市 | 3.0 | 0.6 | -0.9 | -0.3 | -1.7 | -16.0 |
| 揭阳市 | 4.1 | 1.0 | -0.6 | 0.0 | -1.5 | -28.5 |
| 云浮市 | 3.9 | 0.0 | -0.2 | -0.4 | -0.7 | -24.0 |
| 广东省 | 3.9 | 0.6 | -0.1 | 0.2 | -0.6 | -48.7 |
注:碳汇数值若为负值,则LULUCF是碳排放源。
4 讨论
(1)生物量和土壤碳源或碳汇的影响因素众多、空间分异大[2-3,45]。以往“碳排放系数法”假定了每一类土地碳排放在不同空间都具有相同的系数[26⇓⇓⇓-30],没有考虑同一地类的空间分异。本文发现相同地类不同地块的地均碳源或碳汇强度分异较大(图5、图6),如林地既可能因林木生长及土壤有机碳累积形成较高水平的林地碳汇,也可能因林地土壤碳源高于林木生物量碳汇,形成林地碳排放源。这一结果也印证了Hong等对于林地土壤有机碳的发现[46]。不同于土地利用“碳排放系数法”,本文以广东省为例,遵循《IPCC国家温室气体清单指南》2006年及2019年版及相应国际规范,采用库—差别法核算了地块尺度LULUCF碳源和碳汇,满足中国履行《联合国气候变化框架公约》要求,并能对标“公约”附件I国家的履约要求,具有重要的实践价值。
图6
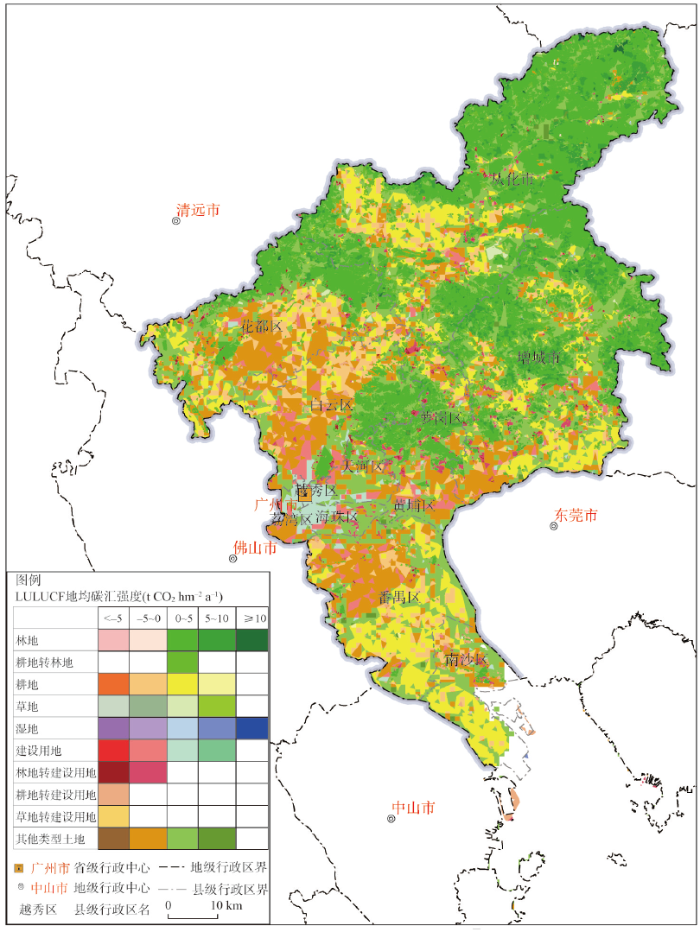
图6
2018年度广州市LULUCF地均碳汇强度放大示例
注:基于自然资源部标准地图服务网站审图号为粤S(2018)121号的标准地图制作,底图边界无修改;若地均碳汇强度为负,即LULUCF是碳排放源。
Fig. 6
Carbon sinks per hectare of each subcategory of LULUCF in the zoomed-in case of Guangzhou in 2018
(2)不同于“生态系统碳核算”[16-17]倾向于核算“自然—社会”[47]生态系统的全部碳源和碳汇,本文中的LULUCF碳核算更强调人为干扰或管理的LULUCF的碳源和碳汇,其核算的区域、范围、口径均小于“生态系统碳核算”,但LULUCF碳核算更加具有管理导向,更能为土地利用和自然资源管理的低碳增汇政策制定提供参考。如广东省的LULUCF碳核算发现杉木、林产化工树生长得较快(表2),生物量碳汇能力较高,因此可加强高碳汇树种的培育。LULUCF碳核算发现广东省大多数树种在30~40 a林龄以后碳汇能力变弱,为形成稳定的碳汇,可有计划的采伐[48],加强林木年轻化经营。LULUCF碳核算发现不仅要关注转换为建设用地的土地总量,进行总量控制,还需要关注土地上的生物量碳汇强度,避免建设用地占用生物量碳汇强度高的土地。对于存量建设用地,可扩大绿地率及绿化率,形成建设用地土壤碳汇,管理上可把绿地率或绿化率作为“低碳城市”的考核指标。
(3)本文受数据及核算方法所限,其结果存在一些不确定性。数据方面,因数据不可获得性,未核算“采伐的木产品”“枯枝落叶”及“死木”的碳源及碳汇;因森林调查与土地利用调查不完全匹配,部分地类或图斑缺失生物量信息,生物量碳源或碳汇的核算存在一定偏差;两期土壤调查的空间尺度不一致,会因尺度效应和空间再划效应产生统计误差。方法方面,采用森林二类调查的数据拟合植被生长曲线仅考虑了林地优势树种、植被平均年龄等因素,诸如立地条件、水热条件、土壤条件、人为管理措施、周边情况等可能因素[2-3]暂未考虑;表层土壤有机碳碳源和碳汇的核算期采用了两期土壤调查间的最大时间间隔(1979—2018年),属于土壤碳源或碳汇的保守估计。
5 结论
精细化的LULUCF碳核算是“双碳”目标下土地利用和自然资源精细管理的重要基础。本文以广东省为例,采用库—差别法核算了地块尺度上的LULUCF碳源和碳汇,主要结论如下:
(1)广东省LULUCF碳汇大部分是生物量碳汇,小部分是土壤碳汇,提升全域土地的植被盖度和加强林木经营是增加LULUCF碳汇最主要的手段。
(2)相同地类不同地块的碳源或碳汇强度分异较大,林地、湿地、耕地、建设用地、草地等地类均可能出现跨碳源和碳汇类别的差异。土地利用“碳排放系数”为常数的碳核算方法难以满足“双碳”目标下土地利用精细管理需要。
(3)本文提出的LULUCF碳核算方法综合了生物量及土壤碳库的变化,在全国范围具有适用性,可提高中国LULUCF碳核算的精度。植被异速生长模型和土壤有机碳地均碳源或碳汇分异图可用于地块尺度土地利用碳源或碳汇的多情景分析。其碳核算结果可为低碳增汇土地利用和自然资源管理政策的制定提供参考。
关联数据信息:本文关联实体数据集已在《全球变化数据仓储电子杂志(中英文)》出版,获取地址:
参考文献
Spatiotemporal patterns of energy carbon footprint and decoupling effect in China
DOI:10.11821/dlxb202101016
[本文引用: 1]

The global environment issue resulting from carbon emissions has aroused worldwide concern for governments, the public and scientific communities. A precise measurement of the time-resolved and spatial distribution characteristics of carbon dioxide (CO2) and carbon footprint as well as its long-period evolution mechanism, can help clarify the relationship between environmental carbon load and economic growth, and are critical references to the formulation of scientific carbon emission reduction targets with reasonable and differential emission reduction policies. In this study, the mainland of China is taken as the research object. According to the quantitative correlations between DMSP-OLS nighttime light image data and carbon emission statistics, the carbon emission panel data model was simulated for China's carbon emissions in the period 2000-2013, and then the spatiotemporal evolving trend and spatial distribution characteristics of carbon emissions in the 14-year research period were discussed using Theil-Sen Median trend analysis and Mann-Kendall test method. Based on the framework of exploratory spatial-temporal data analysis (ESTDA), the spatial pattern and spatiotemporal dynamic evolution of carbon footprint from 2001 to 2013 were analyzed from the perspective of spatiotemporal interaction. In the three periods, the decoupling effect between environmental carbon load and economic growth of 336 prefecture-level cities were analyzed using the improved Tapio decoupling model. The results show that the overall carbon emissions in China had been on the rise from 2000 to 2013, in which the stable-slow rise type was dominant. China's carbon footprint and carbon deficit increased year by year, and the central and western regions became the focus of the growth of carbon footprint and carbon deficit from 2001 to 2013. At different administrative city scales, the spatial distribution pattern of carbon footprint and carbon deficit show obvious administrative orientated and spatial zonal differentiation characteristics. The annual average of global Moran's I index of each level unit is 0.491, which indicates that there is a significant spatial auto-correlation feature in the carbon footprint of China's prefecture-level units. The relative length of the LISA time path is greater in the north than in the south, and it tends to increase from the coastal areas to the central and western regions. The curvature of LISA time path decreases from coastal areas to inland areas on the whole. The curvature of northeast and central regions is higher, while that of eastern and western regions is lower. There is a different trend of the decoupling effect of environmental carbon load in China. Meanwhile the expansion-connection and expansion of negative decoupling regions continuously increased and spatially agglomerated, presenting an "E"-shaped distribution pattern from the north to the south. The national average decoupling elastic value is gradually increasing, while the coefficient of variation continues to decline, and the decoupling type has a significant evolution trend. Therefore, the unbalanced trend of economic growth and carbon emissions in China will continue for a certain period.
中国能源碳足迹时空格局演化及脱钩效应
DOI:10.11821/dlxb202101016
[本文引用: 1]
利用DMSP-OLS夜间灯光数据和碳排放统计数据,构建碳排放面板数据模型,模拟了2000—2013年中国的碳排放量。运用探索性时空数据分析(ESTDA)框架体系,从时空交互视角分析2001—2013年碳足迹的空间格局和时空依赖动态演化;利用改进的Tapio脱钩模型对3个时间段336个地级单元环境碳负荷与经济增长之间的脱钩效应进行综合分析。研究表明:① 2000—2013年,中国的碳排放在时空演变上既表现出稳中有进的总体特征,也存在快速增长的阶段特征。② 碳足迹和碳赤字均呈逐年增长趋势,年均增长率分别为4.82%和5.72%;碳足迹和碳赤字整体北方大于南方,不同的行政单元尺度下碳足迹和碳赤字空间异质性特征明显。各地级单元碳足迹变异系数逐步增大,存在极为显著的空间自相关特征。③ LISA时间路径相对长度北方大于南方,且呈由沿海地区向中西部地区递增的趋势;LISA时间路径弯曲度整体上则由沿海地区向内陆地区递减。④ 综合脱钩指数整体以弱脱钩型为主,但弱脱钩型城市数量持续减少,扩张连接、扩张负脱钩区域数量逐渐增多且向中西部及东北地区聚集分布;全国平均脱钩弹性值逐步增长,变异系数持续下降。
Carbon emissions of urban water system based on water-energy-carbon nexus
DOI:10.11821/dlxb202112017
[本文引用: 1]
Discovering the inherent mechanisms between water cycle process and carbon emissions in urban water system is of important theoretical and practical significance for promoting water-energy conservation and low-carbon optimization. From the perspective of "water-energy-carbon" nexus, a theoretical framework and a series of calculation methods of carbon emissions within urban water system were established in this study. Based on statistical data from 2008 to 2017 and data obtained through questionnaires, the carbon emissions of water system in Zhengzhou city were calculated according to the energy consumptions of each subsystem. The characteristics of water-energy-carbon nexus in water system were demonstrated, based on which further analysis was made under different scenarios of carbon emission reduction potential. The main conclusions are as follows: (1) Water system of Zhengzhou city involves various subsystems, including water intake, water supply, water use, and wastewater treatment. The carbon emissions of urban water system were not only influenced by the amount of water supply and use, but also affected by the mode and distance of water delivery, energy type, structure and efficiency of operation facilities, and terminal use in each subsystem. Water use subsystem was the main source of carbon emissions, indicating that the main reason for the growth of carbon emissions was the increasing water demands driven by urban expansion and population growth. (2) There exist huge differences in carbon emission composition and intensity, as well as the temporal changing trends of carbon emissions among different water subsystems in Zhengzhou. Specifically, the intensity of energy consumption and carbon emissions of water intake and water use increased obviously, while it was relatively stable in water supply and wastewater treatment. Attentions should be paid to the increase of energy consumption of water intake and water use system, especially the increase of carbon emissions caused by long distance water supply and the reuse of raw sewage. (3) The different characteristics of "water-energy-carbon" nexus of different subsystems of water system in Zhengzhou were mainly affected by changes of water use, water treatment methods and processes, residential water use habits, water conservation awareness, natural conditions, and climate change. (4) In the future, water system efficiency should be improved to reduce energy consumption and carbon emissions. Effective measures include urban industrial and domestic water saving, water treatment process improvement, water saving promotion, water system optimization, low-carbon management, and energy efficiency improvement.
基于“水—能—碳”关联的城市水系统碳排放研究
DOI:10.11821/dlxb202112017
[本文引用: 1]
揭示城市水系统与碳排放的内在关系机理,对于推动城市水能节约和水系统低碳运行具有重要的理论和实践意义。本文分析了城市水系统“水—能—碳”关联机理,并构建了城市水系统碳排放的核算体系,采用2008—2017年的统计数据和调查问卷等资料,对郑州市水系统碳排放进行了核算和实证分析,探讨了其“水—能—碳”关联特征,并分析了不同情景下水系统的碳减排潜力。结果显示:① 郑州市水系统碳排放涉及取水、给水、用水、排水及污水处理等不同环节。其中,用水系统是郑州市水系统碳排放的主要来源,这表明由城市扩展和人口增长导致的用水需求增加是碳排放增长的主要因素;② 郑州市水系统不同环节的碳排放构成及其强度具有较大差异。其中,用水和取水系统能耗和碳排放强度增长态势明显,而给水与排水及污水处理系统则相对稳定。取水和用水系统的能耗增加,特别是由城市远距离供水和污水回用引起的碳排放增长应引起关注;③ 郑州市水系统不同环节“水—能—碳”关联特征的差异主要受城市水消耗量的变化、水处理方式和工艺、居民用水行为习惯和节水意识、自然条件及气候变化等因素的影响;④ 未来应重点从城市工业和生活节水、水处理工艺改进、水系统能效提升等方面入手,降低水系统能源消耗和碳排放。
Developing FFCO2 emission inventory with high spatio-temporal resolution: Methodology and prospects
DOI:10.11821/dlxb202203011
[本文引用: 1]
According to the statistics of the United Nations Environment Program (UNEP), fossil fuel (FF) CO2 emission comprises a major proportion of global anthropogenic greenhouse gas emissions. The inverse modeling approach was proposed to verify the results of the traditional bottom-up inventory based on atmospheric concentration (remote sensing and ground-based measurement) in the refinement to the 2006 IPCC Guidelines for National Greenhouse Gas Inventories on the 49th IPCC Plenary Session in 2019. This approach would further promote the development of high-resolution FFCO2 emission inventory which serves as the spatially and temporally distributed form of emission inventory and the prior input data for the inverse model. This paper hereby summarized the spatial distribution and temporal disaggregation approaches of high-resolution FFCO2 emission inventory from global and national scales to a city-wide scale, and put forward the future research prospects based on the specific requirements for high-resolution emission inventories in this 2019 refinement to the IPCC Guidelines: (1) the refined IPCC methodology will help to further improve the spatial and temporal resolution and the accuracy of FFCO2 emission inventories; and the high-resolution FFCO2 emission inventory concerning indirect emissions is emerging. (2) It is a good practice to compile a high-resolution FFCO2 emission inventory with the detailed spatial and temporal information from facility-level emission data, the remote sensing images and the intelligent transportation big data, while the use of geospatial surrogate data or proxy variables, and modeling such as regression, assimilation and artificial neural network, is also necessary to improve the accuracy of the estimates both spatially and temporally when the directly applicable data are unavailable. (3) The uncertainty information of the spatial distribution and temporal disaggregation should be qualitatively or quantitatively analyzed. The atmospheric inversion verification approach, as an independent and objective accounting method, will play an important role in QA/QC and verification of the high-resolution FFCO2 emission inventory.
高时空分辨率FFCO2排放清单的构建方法及研究展望
DOI:10.11821/dlxb202203011
[本文引用: 1]
化石能源(FF)CO<sub>2</sub>排放是全球人为温室气体排放的主体,作为衔接国家排放清单和大气反演验证途径的关键环节,2019年联合国政府间气候变化专门委员会(IPCC)对《国家温室气体清单指南》进行修订,势必将推动高分辨率FFCO<sub>2</sub>排放清单的进一步规范发展。本文结合修订版指南中对于高分辨率排放清单的具体要求,从全球尺度、国家及以下尺度两个层面对高时空分辨率FFCO<sub>2</sub>排放清单的构建方法进行梳理和归纳,并对其研究趋势进行展望。① IPCC方法学的进一步修订与完善,将有助于进一步提高FFCO<sub>2</sub>排放清单的时空分辨率和精度;而构建包含间接排放的高分辨率FFCO<sub>2</sub>排放清单正在兴起。② 作为大气反演模型的先验数据,采用自下而上的部门方法,直接获取排放统计数据,是编制高分辨率FFCO<sub>2</sub>排放清单的首要途径;而通过替代变量及建模途径进行排放总量的时空分配,也是编制高分辨率FFCO<sub>2</sub>排放清单的必要手段。③ 清单的不确定性分析中,需要考虑时空分配所带来的不确定性信息;基于大气观测的反演验证途径将作为独立于排放清单的一种客观核算手段,将在清单的质量保证/质量控制与验证中发挥重要作用。
Analysis of the Bole-Taipei Line as the divide for regional coordinated development: Evidence from greenhouse gas emissions of Chinese cities
DOI:10.11821/dlxb202112015
[本文引用: 3]
As the international political and economic situation has been undergoing profound changes, achieving regional coordinated development is essential for China to form a new development pattern dominated by the domestic economic cycle. The Bole-Taipei Line, which is perpendicular to the Hu Huanyong Line and is proposed by Professor Fang Chuanglin in February 2020, has the potential to be an appropriate representative of the coordinated and balanced line of China's regional development. By investigating the spatio-temporal distribution of greenhouse gas emissions among 338 Chinese cities from 2005 to 2015, and making use of the Theil index and the Gini coefficient that are appropriate for measuring the spatial equality on both sides of the Bole-Taipei Line and within the southwest and northeast parts, respectively, this paper attempts, for the first time, to underpin the scientific basis of the Bole-Taipei Line as China's regional coordinated development line. We find that: (1) Overall emissions of the carbon dioxide (CO2), methane (CH4), nitrous oxide (N2O) and fluorinated greenhouse gas show a balanced distribution on both sides of the Bole-Taipei Line, and there are small regional differences in sectoral CO2 emission intensity and per capita CO2 emissions. (2) There is a generally balanced distribution of greenhouse gas emission intensity and per capita emissions, as well as the sectoral CO2 emission intensity and per capita emissions within the southwest and northeast parts of the Bole-Taipei Line. The industrial and agricultural sectors serve as the major emitters of greenhouse gases and therefore require a low-carbon transition towards a more balanced distribution of greenhouse gas emissions on both sides of the Bole-Taipei Line. In conclusion, the greenhouse gas emissions as a measure of the magnitude of human activities on both sides of the Bole-Taipei Line are relatively balanced, which has justified the scientific robustness and rationality of the Bole-Taipei Line as a strategic line for socioeconomic development, and provided novel insights into China's regional coordinated development.
博台线作为中国区域发展均衡线的佐证分析: 以城市温室气体排放为例
DOI:10.11821/dlxb202112015
[本文引用: 3]
国际政治经济形势正在发生深刻变化,实现区域协调均衡发展对于形成以国内大循环为主的新发展格局至关重要。方创琳于2020年2月提出垂直于胡焕庸线的博台线可以表征中国区域发展的均衡格局。本文通过对中国338个地级市的温室气体排放水平进行分析,旨在论证博台线作为中国区域发展均衡线的合理性和可能性。结果显示:① 2015年二氧化碳(CO<sub>2</sub>)、甲烷(CH<sub>4</sub>)、氧化亚氮(N<sub>2</sub>O)和含氟温室气体总量以博台线为界呈南北对称的空间分布格局,且博台线两侧各类温室气体的排放强度和人均排放量分布基本均衡,各产业部门CO<sub>2</sub>排放强度和人均排放量的区域差异均较小;② 博台线西南半壁和东北半壁内各类温室气体排放在GDP和人口维度上总体呈均衡分布态势,且各部门CO<sub>2</sub>排放强度和人均排放量的空间分布也较为均衡。总体而言,博台线两侧表征人类活动强度的温室气体排放水平较为均衡,一定程度上反映出其作为中国区域发展战略均衡线的科学性与合理性。
A universal approach to estimate biomass and carbon stock in tropical forests using generic allometric models
DOI:10.1890/11-0039.1 URL [本文引用: 1]
Improved allometric models to estimate the aboveground biomass of tropical trees
DOI:10.1111/gcb.12629
PMID:24817483
[本文引用: 1]
Terrestrial carbon stock mapping is important for the successful implementation of climate change mitigation policies. Its accuracy depends on the availability of reliable allometric models to infer oven-dry aboveground biomass of trees from census data. The degree of uncertainty associated with previously published pantropical aboveground biomass allometries is large. We analyzed a global database of directly harvested trees at 58 sites, spanning a wide range of climatic conditions and vegetation types (4004 trees ≥ 5 cm trunk diameter). When trunk diameter, total tree height, and wood specific gravity were included in the aboveground biomass model as covariates, a single model was found to hold across tropical vegetation types, with no detectable effect of region or environmental factors. The mean percent bias and variance of this model was only slightly higher than that of locally fitted models. Wood specific gravity was an important predictor of aboveground biomass, especially when including a much broader range of vegetation types than previous studies. The generic tree diameter-height relationship depended linearly on a bioclimatic stress variable E, which compounds indices of temperature variability, precipitation variability, and drought intensity. For cases in which total tree height is unavailable for aboveground biomass estimation, a pantropical model incorporating wood density, trunk diameter, and the variable E outperformed previously published models without height. However, to minimize bias, the development of locally derived diameter-height relationships is advised whenever possible. Both new allometric models should contribute to improve the accuracy of biomass assessment protocols in tropical vegetation types, and to advancing our understanding of architectural and evolutionary constraints on woody plant development.© 2014 John Wiley & Sons Ltd.
Temporal-spatial dynamics of carbon storage of forest vegetation in China
中国森林生态系统植被碳储量时空动态变化研究
Allometric equations for volume, biomass, and carbon in commercial stems harvested in a managed forest in the Southwestern Amazon: A case study
The stage-classified matrix models project a significant increase in biomass carbon stocks in China's forests between 2005 and 2050
China's forests are characterized by young age, low carbon (C) density and a large plantation area, implying a high potential for increasing C sinks in the future. Using data of provincial forest area and biomass C density from China's forest inventories between 1994 and 2008 and the planned forest coverage of the country by 2050, we developed a stage-classified matrix model to predict biomass C stocks of China's forests from 2005 to 2050. The results showed that total forest biomass C stock would increase from 6.43 Pg C (1 Pg = 10(15) g) in 2005 to 9.97 Pg C (95% confidence interval: 8.98 - 11.07 Pg C) in 2050, with an overall net C gain of 78.8 Tg C yr(-1) (56.7 - 103.3 Tg C yr(-1); 1 Tg = 10(12) g). Our findings suggest that China's forests will be a large and persistent biomass C sink through 2050.
Allometric equations for integrating remote sensing imagery into forest monitoring programmes
DOI:10.1111/gcb.13388
PMID:27381364
[本文引用: 1]
Remote sensing is revolutionizing the way we study forests, and recent technological advances mean we are now able - for the first time - to identify and measure the crown dimensions of individual trees from airborne imagery. Yet to make full use of these data for quantifying forest carbon stocks and dynamics, a new generation of allometric tools which have tree height and crown size at their centre are needed. Here, we compile a global database of 108753 trees for which stem diameter, height and crown diameter have all been measured, including 2395 trees harvested to measure aboveground biomass. Using this database, we develop general allometric models for estimating both the diameter and aboveground biomass of trees from attributes which can be remotely sensed - specifically height and crown diameter. We show that tree height and crown diameter jointly quantify the aboveground biomass of individual trees and find that a single equation predicts stem diameter from these two variables across the world's forests. These new allometric models provide an intuitive way of integrating remote sensing imagery into large-scale forest monitoring programmes and will be of key importance for parameterizing the next generation of dynamic vegetation models.© 2016 The Authors. Global Change Biology Published by John Wiley & Sons Ltd.
Climate change, human impacts, and carbon sequestration in China
DOI:10.1073/pnas.1700304115 PMID:29666313 [本文引用: 2]
Patterns of plant carbon, nitrogen, and phosphorus concentration in relation to productivity in China's terrestrial ecosystems
DOI:10.1073/pnas.1700295114
PMID:29666316
[本文引用: 2]
Plant nitrogen (N) and phosphorus (P) content regulate productivity and carbon (C) sequestration in terrestrial ecosystems. Estimates of the allocation of N and P content in plant tissues and the relationship between nutrient content and photosynthetic capacity are critical to predicting future ecosystem C sequestration under global change. In this study, by investigating the nutrient concentrations of plant leaves, stems, and roots across China's terrestrial biomes, we document large-scale patterns of community-level concentrations of C, N, and P. We also examine the possible correlation between nutrient content and plant production as indicated by vegetation gross primary productivity (GPP). The nationally averaged community concentrations of C, N, and P were 436.8, 14.14, and 1.11 mg·g for leaves; 448.3, 3.04 and 0.31 mg·g for stems; and 418.2, 4.85, and 0.47 mg·g for roots, respectively. The nationally averaged leaf N and P productivity was 249.5 g C GPP·g N·y and 3,157.9 g C GPP·g P·y, respectively. The N and P concentrations in stems and roots were generally more sensitive to the abiotic environment than those in leaves. There were strong power-law relationships between N (or P) content in different tissues for all biomes, which were closely coupled with vegetation GPP. These findings not only provide key parameters to develop empirical models to scale the responses of plants to global change from a single tissue to the whole community but also offer large-scale evidence of biome-dependent regulation of C sequestration by nutrients.
Changes in forest biomass carbon storage in China between 1949 and 1998
DOI:10.1126/science.1058629
PMID:11423660
[本文引用: 1]
The location and mechanisms responsible for the carbon sink in northern mid-latitude lands are uncertain. Here, we used an improved estimation method of forest biomass and a 50-year national forest resource inventory in China to estimate changes in the storage of living biomass between 1949 and 1998. Our results suggest that Chinese forests released about 0.68 petagram of carbon between 1949 and 1980, for an annual emission rate of 0.022 petagram of carbon. Carbon storage increased significantly after the late 1970s from 4.38 to 4.75 petagram of carbon by 1998, for a mean accumulation rate of 0.021 petagram of carbon per year, mainly due to forest expansion and regrowth. Since the mid-1970s, planted forests (afforestation and reforestation) have sequestered 0.45 petagram of carbon, and their average carbon density increased from 15.3 to 31.1 megagrams per hectare, while natural forests have lost an additional 0.14 petagram of carbon, suggesting that carbon sequestration through forest management practices addressed in the Kyoto Protocol could help offset industrial carbon dioxide emissions.
Analysis on the China certified emission reductions, economic value and its sensitivity of Pinus Kesiya var. langbianensis afforestation project in Yunnan province
云南思茅松碳汇造林项目减排量、经济价值及其敏感性分析
DOI:10.16258/j.cnki.1674-5906.2017.02.008 [本文引用: 1]
Impacts of afforestation on the carbon stocks and carbon sequestration rates of regional forest ecosystems
造林对区域森林生态系统碳储量和固碳速率的影响
Carbon sequestration capacity of Beijing arbor forest based on NbS
基于NbS的北京市乔木林固碳能力分析
Dynamic study on soil organic carbon reservoir in inner Mongolia grassland under grassland ecological management
草地生态管理下内蒙古草地土壤有机碳库动态研究
Determining and estimating impacts of farmland consolidation projects on the regional carbon effects
DOI:10.18402/resci.2016.01.10
[本文引用: 2]
As a practice relying on engineering measures,farmland consolidation has an important influence on land use such as altering its structures and patterns. Farmland consolidation projects also exert significant effects on regional carbon balances. Here,we analyzed the carbon effect from three aspects:the carbon effect of engineering construction,land structure and land use patterns. We calculated comprehensive carbon effects in the case of farmland consolidation projects in Yixing City,Jiangsu,China. We found that farmland consolidation increased regional carbon sinks,carbon storage increased by 3 718t,but it also remarkably increased carbon emissions. Carbon emissions increased by 6 830t because of engineering construction,and the annual carbon sink increased by 5 459t. Farmland carbon stocks increased by 11 071t,among which the increase in farmland was a main factor. The increment of soil carbon storage accounted for 87.21% of the total carbon storage increment. Irrigation and drainage engineering were the main reasons affecting carbon emissions,accounting for 70.96% of total carbon emissions during engineering construction. The consumption of construction materials such as cement,steel and diesel were major sources of carbon emissions. The construction of shelterbelts had significant effects on the result. The annual carbon sink increased by 23.64% because of the increased acreage of arable land and improvements in agricultural irrigation.
农用地整治项目的碳效应分析与核算研究
DOI:10.18402/resci.2016.01.10
[本文引用: 2]
农用地整治项目作为一项采取工程技术措施对土地利用的结构、方式等进行改造的实践活动,在显著改变土地利用活动的同时,也对区域碳平衡产生重要影响。本文从工程实施碳效应、土地结构碳效应、土地利用方式碳效应三方面对农用地整治的碳效应进行了分析,并以江苏宜兴市农用地整治项目为例进行了测算。主要结论如下:①项目整治后,土地结构变化碳储量增加3 718t,工程建设净碳排放量约为6 830t,土地利用方式变化年碳汇量增加5 459t;②项目区耕地碳储量增加11 071t,耕地面积增加是主要原因;③灌溉排水工程是影响碳排放量的最重要的工程类型,水泥、钢材和柴油等工程建设物资投入是促使碳排放量增加的主要来源;④区域年净碳汇量增长显著,增幅为23.64%,主要源于耕地种植面积的增加和农业灌溉条件的改善。
Dynamic characteristics and influencing factors of carbon and water flux in reed wetland ecosystem in the Yellow River Delta
黄河三角洲芦苇湿地生态系统碳通量动态特征及其影响因素
DOI:10.16258/j.cnki.1674-5906.2021.05.007
[本文引用: 2]
利用涡度相关法,对黄河三角洲芦苇湿地生态系统进行了连续2年的通量观测,分析了2017—2018年生长季芦苇湿地生态系统碳交换量(NEE)及其影响因素,为区域的碳收支预算和为全球碳循环模型的进一步完善提供理论基础。结果表明,在季节尺度上,芦苇湿地生长季具有明显的碳汇功能,生态系统呼吸(R<sub>s</sub>)随着月份的增加呈倒“V”型变化特征,在8月达到最高;生态系统碳交换(NEE)和生态系统总初级生产力(GPP)随着月份的增加呈“V”型变化特征。2018年不同月份生态系统碳交换(NEE)、生态系统总初级生产力(GPP)、生态系统呼吸(R<sub>s</sub>)均高于2017年,局部有所差异,其变化趋势与2017年总体保持一致。在日尺度上,2017—2018年芦苇湿地NEE日变化特征表现为两个CO<sub>2</sub>吸收高峰,分别出现在11:00和16:00左右,其特点是在午间出现了碳交换通量的降低,CO<sub>2</sub>排放的日最大值两个生长季均出现在8月。2017—2018年NEE<sub>night</sub>随着月份的增加呈倒“V”型变化特征,在8月达到最高;而NEE<sub>total</sub>和NEE<sub>day</sub>随着月份的增加呈“V”型变化特征,在8月达到最高,局部有所差异。芦苇湿地生态系统的CO<sub>2</sub>交换受到光合有效辐射(PAR)、土壤温度(t<sub>s</sub>)和土壤体积含水量(T<sub>a</sub>)的共同影响,生长季NEE通量与5 cm土壤温度和土壤湿度呈显著或极显著的指数关系(P<0.05,P<0.01),同时生长季NEE通量与5 cm土壤温度和土壤湿度的R<sup>2</sup>均高于NEE通量与10 cm土壤温度和土壤湿度的R<sup>2</sup>,由此说明5 cm土壤温度和湿度能够更好的指示NEE通量的变化。
Spatio-temporal analysis of land-use change and the impact on terrestrial ecosystems carbon storage in Yangtze River City Group
扬子江城市群土地利用时空变化及其对陆地生态系统碳储量的影响
Spatial correlation and carbon balance zoning of land use carbon emissions in Fujian province
福建省土地利用碳排放空间关联性与碳平衡分区
Change of land use and the carbon emission effect of Ningxia autonomous region
宁夏自治区土地利用变化及碳排放效应
Dynamic simulation of carbon emissions from land use in Nanjing city under different policy scenarios
不同政策方案下的南京市土地利用碳排放动态模拟
Assessment of territorial ecosystem carbon storage based on land use change scenario: A case study in Qihe River Basin
DOI:10.11821/dlxb201903004
[本文引用: 2]
The change of regional land use is the main cause for the change of carbon storage in territorial ecosystem, which affects the process of carbon emission and sink. However, previous studies on the impact of future land use change on ecosystem carbon storage considering temporal and spatial scales in the basin are still absent. This study analyzed land use change from 2005 to 2015 in the Qihe River Basin, Taihang mountainous areas, and used Markov-CLUE-S composite models to predict land use pattern of this region in 2025, under three scenarios of natural growth, farmland protection and ecological conservation. Based on the data of land use, we used carbon storage module in InVEST model to evaluate carbon storage of territorial ecosystem during the past 10 years and the future. The results showed that: (1) The carbon storage and carbon density of the ecosystem in the Qihe River Basin in 2015 were 3.16×10⁷ t and 141.9 t/hm2, respectively, and they both had decreased by 0.07×10⁷ t and 2.89 t/hm2 during the 10 years. (2) From 2005 to 2015, the carbon density was mainly reduced in low altitude areas, and the ratio of the increased areas was similar to that of the reduced areas in the high altitude areas. The decrease of carbon density was mainly caused by expansion of construction land in the middle and lower reaches, and degradation of forestland in the upper reach of Qihe River Basin. (3) From 2015 to 2025, the carbon storage and carbon density of ecosystem will decrease by 0.03×10⁷ t and 1.38 t/hm2 respectively in the natural growth scenario, mainly due to the reduction of carbon sequestration capacity in low altitude areas. The farmland conservation scenario will slow down the decrease of carbon storage and carbon density (0.01×10⁷ t and 0.44 t/hm2), mainly due to the enhancement of carbon sequestration capacity in low altitude areas. The ecological protection scenario will increase carbon storage and carbon density significantly to 3.19×10⁷ t and 143.26 t/hm2 respectively, mainly appearing in the area above 1100 m. The ecological protection scenario can enhance carbon sequestration capacity, but it cannot effectively control the loss of farmland area. Therefore, the land use planning of the study area can comprehensively consider the ecological protection scenario and farmland conservation scenario, which not only increases carbon sink, but also ensures the farmland quality and food security.
基于土地利用变化情景的生态系统碳储量评估: 以太行山淇河流域为例
DOI:10.11821/dlxb201903004
[本文引用: 2]
区域土地利用变化是导致生态系统碳储量变化的主要原因,影响其碳源、碳汇效应,但以往结合时空尺度探讨流域未来土地利用变化对生态系统碳储量影响的研究尚不多见。以太行山淇河流域为例,分析2005-2015年土地利用变化,采用Markov-CLUE-S复合模型预测2025年自然增长、耕地保护及生态保护情景下的土地利用格局,并基于土地利用数据,运用InVEST模型的碳储量模块评估2005-2015年及未来不同情景下的生态系统碳储量。结果表明:① 2015年淇河流域生态系统碳储量和平均碳密度分别为3.16×10<sup>7</sup> t和141.9 t/hm<sup>2</sup>,自2005年以来分别下降0.07×10<sup>7</sup> t和2.89 t/hm<sup>2</sup>。② 2005-2015年碳密度在低海拔区域以减少为主,在高海拔区域增加区与减少区比例相当,淇河中下游地区建设用地的大肆扩张以及上游林地的退化是导致碳密度下降的主要原因。③ 2015-2025年自然增长情景下碳储量和碳密度下降仍较明显,主要是低海拔区域固碳能力的减弱;耕地保护情景减缓了碳储量和碳密度的下降幅度,主要是由于低海拔区固碳能力的增强;生态保护情景下,碳储量和碳密度显著增加,分别达到3.19×10<sup>7</sup> t和143.26 t/hm<sup>2</sup>,主要发生在海拔高于1100 m的区域。生态保护情景能够增强固碳能力,但不能有效控制耕地面积的减小。因此,研究区土地利用规划可统筹考虑生态保护和耕地保护情景,既能增加碳汇,又能保障耕地质量和粮食安全。
Land use change and its influence on carbon storage of terrestrial ecosystems in Jiangsu province
Land use change is a main driver to terrestrial ecosystems carbon storage. Most recent studies seem to focus only on a single ecosystem, such as soil ecosystem, forest ecosystem, farmland ecosystem, and grassland ecosystem. Data about land use, soil organic carbon, and vegetation were jointly used to analyze effect of land use change on carbon storage of the whole terrestrial ecosystem in Jiangsu Province. Land use change data were derived from remote sensing images acquired in 1985 and 2005; soil organic carbon data were provided by the Geological Survey of Jiangsu Province, including 24 186 soil samples which covers the whole area of Jiangsu; data of forest ecosystems were obtained from the fifth forest inventory; crop yield data of farmland ecosystems were provided by Statistical Yearbook of Jiangsu Province, 2006; and data of grassland ecosystems were obtained from the existing studies. This study calculated soil carbon storage and vegetation carbon storage for different land use types. Using the spatial analysis function of ArcGIS 9.3, land use change was derived. Effect of land use change on organic carbon storage of terrestrial ecosystems was analyzed. Major findings are as follows: 1) the terrestrial ecosystem carbon storage of Jiangsu Province was 975.72 Tg, in which soil carbon storage was 922.03 Tg, accounting for 94.5% and vegetation carbon storage was 53.69 Tg, accounting for 5.5%. The average soil carbon density in Jiangsu Province was 9.41kg/m<sup>2</sup> while the average vegetation carbon density is 1.79kg/m<sup>2</sup>; 2) for the reason of land use change, carbon storage decreased by 9.73Tg from 1985 to 2005, accounting for 1% of the total decrease. Soil carbon and vegetation carbon were 7.54 Tg and 2.19 Tg, respectively; 3) expansion of construction land was a main factor resulting in carbon storage decrease. In general, there was only slight disturbance of land use change induced by human activities on terrestrial carbon storage; and 4) in the future, some measures should be taken to reduce human impacts on natural carbon processes, such as strengthening cropland protection, increasing carbon sinks, and optimizing land use structure.
江苏省土地利用变化对陆地生态系统碳储量的影响
土地利用变化是影响陆地生态系统碳储量变化的重要驱动因素,目前相关研究主要集中在土地利用变化对单一生态系统的影响,如土壤生态系统、森林生态系统、农地、草地生态系统等,本文以江苏省为研究区域,综合考虑了整个生态系统来探讨土地利用变化对碳储量的影响。文中涉及到的数据包括土地利用数据、土壤数据、植被数据。利用ArcGIS9.3分析1985到2005年江苏省土地利用变化,根据不同的方法,分别计算了江苏省不同土地利用类型的土壤碳储量和植被碳储量,并分析其对土地利用变化的影响,主要结论如下:①江苏省陆地生态系统总碳储量为975.72Tg,其中土壤碳储量为922.03Tg,占有机碳总储量的94.5%,土壤平均碳密度为9.41 kg/m<sup>2</sup>,植被碳储量为53.69Tg,占有机碳总储量的5.5%,植被平均碳密度为1.791 kg/m<sup>2</sup>;②1985-2005年江苏省陆地生态系统有机碳储量共减少9.73Tg,其中土壤有机碳储量减少7.54Tg,植被有机碳储量减少2.19Tg,土地利用变化造成了有机碳的释放,释放量占江苏省陆地生态系统有机碳储量的1%;③建设占用耕地是引起碳储量变化的主要原因,但总体而言,人类土地利用活动对江苏省陆地生态系统总碳储量平衡的扰动并不大;④应通过加强耕地保护、增加碳汇和土地利用结构优化等方式来降低人为活动对自然碳过程的影响。
Dynamics of regional land uses affecting spatial heterogeneity of surface CO2 concentration
DOI:10.11821/dlxb202204011
[本文引用: 1]
This study analyzed the spatio-temporal variations of surface CO2 concentration at the 10 km×10 km grid level over the Beijing-Tianjin-Hebei (BTH) region during 2000-2018 and further clarified the dynamics of regional land uses affecting spatial heterogeneity of surface CO2 concentration based on the Gaussian diffusion equation and the spatial Ramsey model. The results showed that surface CO2 concentration in the BTH region was closely related to land use types. The high-value areas of surface CO2 concentration were mainly concentrated in economically developed and rapidly urbanized areas during 2000-2018. The spatio-temporal differences of land use intensity and efficiency provided potential power for surface CO2 concentration diffusion. The surface CO2 emission and diffusion in the BTH region had obvious spatial heterogeneity, presenting that the closer the area was to the high-value area of CO2 emission, the higher the corresponding CO2 concentration was, and it decreased gradually with the elapse of time and spatial expansion. Moreover, with the adjustment of land use structure, optimization of land use spatial pattern, and improvement of land use efficiency in the BTH region, the increase rate of CO2 emissions intensity declined significantly and the differences of the increase rate among regions narrowed gradually at the same time. Industrial transformation and development, land use spatial pattern optimization, and land use efficiency improvement effectively restrained the increase of surface CO2 emission intensity in the BTH region, and promoted the connotative growth and high-quality development of the region.
区域土地利用影响地表CO2浓度异质性特征的动力学机制
DOI:10.11821/dlxb202204011
[本文引用: 1]
本文综合应用高斯方程和拉姆齐模型,针对京津冀地区2000年以来10 km×10 km栅格尺度的地表CO<sub>2</sub>浓度开展研究,分析了区域土地利用影响地表CO<sub>2</sub>浓度异质性特征的动力学机制。研究发现:① 地表CO<sub>2</sub>浓度与土地利用类型密切相关。2000—2018年京津冀地区CO<sub>2</sub>浓度的高值区主要集中于经济较发达的快速城镇化地区;② 土地利用强度及土地利用效率上的时空分异为地表CO<sub>2</sub>扩散提供了潜在的势能。京津冀地区地表CO<sub>2</sub>排放及扩散存在明显的空间异质性,距离CO<sub>2</sub>排放高值区越近,其相应的CO<sub>2</sub>浓度越高并随时间推移及空间拓展呈逐步减小的态势;③ 京津冀地区在土地利用结构调整、格局优化及效率提升后,CO<sub>2</sub>排放强度增幅明显减弱,其区域间的增幅差异也逐渐缩小。产业转型发展、土地利用格局优化、土地利用效率提高有效地抑制了京津冀地区地表CO<sub>2</sub>排放强度的提升并促进了该区域的内涵式增长与高质量发展。
Spatiotemporal evolution of information entropy of land use structure in Guangdong province
广东省土地利用结构信息熵时空演变特征分析
Imbalance of inter-provincial forest carbon sequestration rate (2010-2060) in China and its regulation strategy
DOI:10.11821/dlxb202207016
[本文引用: 1]
Forest ecosystem, as a predominant component of terrestrial ecosystem carbon sinks, has a high potential for carbon sequestration. Accurate estimation of the carbon sequestration rate in forest ecosystems at provincial level is a prerequisite and foundation for scientifically formulating the technical approaches of carbon neutrality and associated regulatory policies. However, research on future carbon sequestration rates (CSRs) for forest ecosystems for provincial-level regions (hereafter province) in China has rarely been reported. This paper quantitatively assesses the carbon sequestration rates of existing forest ecosystems of all the provinces from 2010 to 2060 using the Forest Carbon Sequestration model (FCS), in combination with large quantities of measured data in China under three future climate scenarios (RCP2.6, RCP4.5, and RCP8.5). Results showed that CSRs across provinces varied from 0.01Tg C/a to 36.74 Tg C/a, with a mean of (10.09±0.43) Tg C/a. There are apparent inter-provincial differences in view of forest CSRs. In terms of the spatial variations in CSRs on unit area basis within provinces, the eastern region has larger capacity to sequestration than the western region, while the western region has greater CSR per unit GDP and per capita. Moreover, there are significant negative correlations between the CSRs per capita in each province and the corresponding GDP per capita, under an assumption that GDP per capita is constant across provinces. In summary, there is a significant regional imbalance of the CSR among provinces, and major technical and policy changes are needed to realize their carbon sink potential sustainably. In view of the overlap between China's poor areas and high ecological carbon sink areas, it is indicated that the existing policies to support the traditional carbon trading are far from sufficient. It is urgent to take China's regulatory measures such as "regional carbon compensation" in line with the Chinese characteristics, so that people in western or underdeveloped regions can voluntarily/consciously strengthen forest protection and enhance forest carbon sinks on the basis of ensuring coordinated regional development, thus China's forests can play a greater role in carbon neutrality strategies.
2010—2060年中国森林生态系统固碳速率省际不平衡性及调控策略
DOI:10.11821/dlxb202207016
[本文引用: 1]
森林生态系统具有很高的固碳潜力,是陆地碳汇的主体。准确估算各省(自治区)森林生态系统固碳速率,是科学制定碳中和技术路线及相应调控政策的重要依据。然而,目前有关中国不同省份森林生态系统未来固碳潜力的研究非常罕见。利用中国森林生态系统固碳模型(FCS)并结合3种未来气候情景(RCP2.6、RCP4.5和RCP8.5),定量评估了2010—2060年间各省现存森林生态系统的固碳速率。研究发现:中国区域内各省的森林生态系统固碳速率介于0.01~36.74 Tg C/a,平均值为(10.09±0.43) Tg C/a。省际间森林固碳速率存在非常大的差异,其中东部地区各省的单位面积固碳速率大于西部地区;但考虑到单位GDP固碳速率和人均固碳速率后则表现为西部地区明显更大。此外,各省人均碳固存速率与其人均GDP之间存在显著负相关关系。因此,省际间森林生态系统固碳速率存在明显的区域不均衡性,要真正地持续实现其碳汇潜力需要在技术和政策层面做出重大调整。结合中国贫困区与高生态碳汇区的重叠,不能仅仅依靠传统碳贸易,亟需研究制定符合中国特色的“区域碳补偿”措施,在保障区域协调发展的基础上使西部或不发达地区民众能自愿/自觉加强对森林的保护、保持甚至提升森林碳汇,使森林在实现碳中和战略中发挥更大作用。
The impact of land use and cover change on soil organic carbon and total nitrogen storage in the Heihe River Basin: A meta-analysis
DOI:10.1007/s11442-019-1678-y
[本文引用: 1]
Land use and cover change (LUCC) is an important indicator of the human-earth system under climate/environmental change, which also serves as a key impact factor of carbon balance, and a major source/sink of soil carbon cycles. The Heihe River Basin (HRB) is known as a typical ecologically fragile area in the arid/semi-arid regions of northwestern China, which makes it more sensitive to the LUCC. However, its sensitivity varies in a broad range of controlling factors, such as soil layers, LUCCs and calculation methods (e.g. the fixed depth method, FD, and the equivalent mass method, ESM). In this study, we performed a meta-analysis to assess the response of soil organic carbon (SOC) and total nitrogen (TN) storage to the LUCC as well as method bias based on 383 sets of SOC data and 148 sets of TN data from the HRB. We first evaluated the calculation methods and found that based on the FD method, the LUCC caused SOC and TN storage to decrease by 17.39% and 14.27%, respectively; while the losses estimated using the ESM method were 19.31% and 18.52%, respectively. The deviations between two methods were mainly due to the fact that the FD method ignores the heterogeneity of soil bulk density (BD), which may underestimate the results subsequently. We then analyzed the response of SOC and TN storage to various types of the LUCC. In particular, when woodland and grassland were converted into cultivated land or other land types, SOC and TN suffered from heavy losses, while other LUCCs had minor influences. Finally, we showed that increasing the depth of the soil layers would reduce the losses of SOC and TN storage. In summary, we identified a series of controlling factors (e.g. soil layer, the LUCC and calculation method) to evaluate the impact of the LUCC on SOC and TN storage in the HRB, which should be considered in future research.
Topsoil organic carbon storage and its changes in Inner Mongolia grassland from the 1980s to 2010s
DOI:10.11821/dlxb201411006
[本文引用: 1]
Soil carbon sequestration and potential has been a focal issue in global carbon research. Under the background of global change, the estimation of the extent well as its change of soil organic carbon (SOC) storage is of great importance. Based on soil data from the second soil survey of China and field survey during 2011-2012, this paper studied spatial distribution and changes of topsoil (0-20 cm) organic carbon storage in Inner Mongolia grassland between the 1980s and 2010s, by using the regression relation between soil data and remote sensing data. The results showed that (1) the SOC storage values in Inner Mongolia grassland in the 1980s and 2010s were estimated to be 2.05 and 2.17 Pg C, with an average density of 3.48 and 3.69 kg C·m-2, respectively. The SOC storage was mainly distributed in the typical steppe and meadow steppe, which accounted for over 98% of the total. The spatial distribution showed a decrease trend from the meadow steppe, typical steppe to the desert steppe, corresponding to the temperature and precipitation gradient. (2) SOC variations during 1982-2012 were estimated to be 0.12 Pg C, at 7.00 g C·m-2·yr-1, which did not show a significant change. This indicates that SOC storage in grassland ecosystem of Inner Mongolia remained relatively stable over this period. However, topsoil organic carbon of different grassland ecosystems showed different trends of carbon source/sink during the past three decades. Meadow steppe and typical steppe, as a carbon sink, had sequestered at 0.15 and 0.03 Pg C, respectively, while desert steppe, as a carbon source, had lost 0.06 Pg C. It is concluded that SOC storage in grassland ecosystem may respond differently to climate change, which is related to vegetation type, regional climate type and grazing intensity. These results will provide references for decision makers to find proper resolutions to protect grassland soil resource.
1980s—2010s内蒙古草地表层土壤有机碳储量及其变化
DOI:10.11821/dlxb201411006
[本文引用: 1]
以我国内蒙古草原为研究区域,结合1982-1988年第二次土壤普查资料以及2011-2012年实地考察数据,构建了基于遥感数据和土壤数据的区域表层土壤有机碳储量估算方法,对研究区1980s和2010s表层土壤有机碳储量、空间分布特征及其变化进行研究,结果表明:(1) 1980s、2010s内蒙古草地表层土壤 (0~20 cm) 有机碳储量分别为2.05 Pg C、2.17 Pg C,土壤有机碳密度约为3.48 kg C·m<sup>-2</sup>、3.69 kg C·m<sup>-2</sup>,其空间分布上呈现从草甸草原、典型草原、荒漠草原逐渐降低的特征;(2) 1982-2012年间,内蒙古草地表层土壤有机碳储量略有增加,但增加幅度较小,其中草甸草原和典型草原表层土壤有机碳储量增加,荒漠草原则表现为减少。研究结果将为研究区因地制宜地采取固碳措施,实现草地可持续管理提供科学参考。
Spatial and temporal variation of soil carbon storage and organic carbon content in Leizhou Peninsula, Guangdong province
雷州半岛土壤碳储量及其有机碳时空变化规律
Spatial patterns of SOC/TN content and their significance for identifying the boundary between warm temperate and subtropical zones in China's north-south transitional zone
DOI:10.11821/dlxb202109016
[本文引用: 1]
The Qinling-Daba Mountains form the main body of China's north-south transitional zone. However, because there is a controversy about the specific location of the geographical boundary in academic community, it is important to determine and improve the existing classification indices to construct the ecological geographical pattern in China. Soil is the core section of the transitional zone, the spatial distribution and variations in key soil indexes in the Qinling-Daba Mountains are important indicators for identifying the transition effect and regional characteristics of China's north-south transitional zone. This paper analyzes the spatial characteristics of soil organic carbon (SOC) and total nitrogen (TN), and their relationships with major geographical factors by means of spatial analysis and geostatistics, using data from the second national soil survey, as well as terrain, climate and vegetation data. Results show that spatial trends of SOC and TN contents are similar, and that there are three areas with high contents, one secondary area with high content and one area with low content. The high contents are found in the high-altitude regions of the Qinling-Daba Mountains and in the mountainous areas to the west of the Jialing River. Here, SOC and TN contents range from 15.03-71.04 g/kg and 1782.61-7710.00 mg/kg, respectively. The low-content areas spread from west to east across the Weihe Valley, to the southern Wutai and Funiu mountains, and along the north slope of the Qinling Mountains. Here, SOC and TN contents range from 0.64-6.50 g/kg and 110.00-885.96 mg/kg, respectively. The secondary high-content area is mainly located on the both sides of the Hanjiang River, in the Qinling-Daba Mountains where altitudes are less than 1000 m, in the Funiu Mountains at altitudes less than 1000 m and on both sides of Jialing River at altitudes slightly higher than 1000 m. Here, SOC and TN contents are between the above two ranges, with a gradual increase in content forming a "horn-shaped" pattern from west to east. In terms of the spatial characteristics and functions of vegetation, topography and climatic factors, it is found that the SOC/TN range in the secondary high-content area is consistent along the 1000 m contour line, at the upper limit of the warm temperate deciduous broadleaved forest belt (containing evergreen forest) and of the subtropical/warm temperate mixed evergreen-deciduous broadleaved forest belts, as well as along the 0 °C isotherm line in January and the 24 °C isotherm line in July. The temperature changes are stable in January, July, annually and during the four seasons, but the rainfall varies greatly in each season. This region is the main body area of the transtional zone between subtropical zone and warm temperate zone: the northern boundary is roughly distributed along the line of Dujiangyan-Maoxian-Pingwu-Wenxian to the west of the Jialing River and the 1000 m contour line on the southern slope of the Qinling Mountains. The southern boundary lies along the line of Dujiangyan-Beichuan-Qingchuan to the west of the Jialing River and the 1000 m contour line of the northern slope of the Daba Mountains. The results show that the spatial variation of SOC/TN content provides a reference for the demarcation of the subtropical-warm temperate zone. A further understanding of the soil processes and ecological effects in typical regions and typical mountains will help reveal the multi-dimensional transition characteristics and variation mechanism in the region.
中国南北过渡带土壤碳氮空间特征及暖温带与亚热带界限
DOI:10.11821/dlxb202109016
[本文引用: 1]
秦巴山区是中国南北过渡带的主体,过渡带分界划分在学界一直存在争议,确定和改进划分指标对构建中国生态地理格局有重要作用。土壤作为过渡带的核心部分,其关键指标的空间分布及变异机制对识别过渡效应和区域特征有指示作用。本文基于土壤二普资料,采用空间模拟和地统计方法分析土壤有机碳/全氮空间特征及与主要自然地理要素的关系。结果显示,秦巴山区有机碳/全氮含量空间分布趋势一致,存在3个高值区、1个次高值区和1个低值区。高值区分布在秦岭、大巴山高海拔区域和嘉陵江以西山地,含量分别为15.03~71.04 g/kg、1782.61~7710.00 mg/kg;低值区沿秦岭北坡的渭河谷地、南五台山和伏牛山分布,含量分别为0.64~6.50 g/kg、110.00~885.96 mg/kg;次高值区主要在汉江两侧、秦巴山地之间海拔< 1000 m及嘉陵江两侧略高于1000 m的山体,含量介于以上二者之间,自西向东呈南北向宽幅逐渐增大的“喇叭状”趋势。综合考虑地形—植被—气候作用,发现秦岭南坡—大巴山北坡有机碳/全氮次高值区分布范围与1000 m等高线、暖温带落叶阔叶林带(含常绿成分)和亚热带常绿落叶阔叶混交林带上限、1月0 ℃等温线、7月24 ℃等温线较一致,区内1月、7月、季节和全年气温变化较小,各季降雨变幅大,该区是亚热带向暖温带过渡的主体,北界大致沿都江堰—茂县—平武—文县和秦岭南坡1000 m等高线分布,南以都江堰—北川—青川和大巴山北坡1000 m等高线为界。有机碳/全氮空间变化为亚热带—暖温带的划界提供一定依据,进一步识别典型区土壤过程及生态效应,将全面揭示土壤多维过渡特征及其变异机理。
Divergent responses of soil organic carbon to afforestation
DOI:10.1038/s41893-020-0557-y [本文引用: 1]
Contribution of terrestrial carbon sink to future warming in China, the United States, Russia and Canada
DOI:10.11821/dlxb202101013
[本文引用: 1]
As a major climate forcing factor, CO2 is closely related to human activities, but many studies have overlooked the carbon absorption of terrestrial ecosystem to anthropogenic carbon emissions. China, the United States, Russia and Canada are the four countries with the largest area in the world at different socio-economic development stages. Quantifying the global radiative forcing contribution of CO2 emissions is important for assessing the climate effects of human and natural factors. Based on CO2 assimilation data, this study used a "carbon-climate" parameterization scheme to analyze the anthropogenic carbon emissions and its climatic effects while considering the climate effects of carbon sinks of terrestrial ecosystem. Then we obtained the net global radiative forcing contributions of the four countries. The results showed that the anthropogenic emissions of CO2 in all the four countries showed a significant increase (0.125 Pg C a -1). Meanwhile the carbon uptake of terrestrial ecosystems increased at a growth rate of 0.003 Pg C a -1. During the study period, the total anthropogenic carbon emissions of China and the United States accounted for 87.19% of the four countries while Russian terrestrial ecosystems had the strongest carbon absorption capacity, 14.69 Pg C. Correspondingly, as of 2016, the cooling effect of terrestrial ecosystems is -0.013 W m -2, which can offset 45.06% of the whole warming effects of anthropogenic carbon emissions, indicating that if the terrestrial ecosystems are not considered, the warming effect of anthropogenic carbon emissions will be significantly overestimated. Overall, the total anthropogenic carbon emissions of the four countries contributed 0.32 and 0.42 W m -2 of global radiative forcing, respectively, relative to the CO2 concentration levels before 2000 (initial year of this study) and before the Industrial Revolution. This study further explored the linear relationship between air temperature and radiative forcing. Compared with a single climate effect of anthropogenic or natural carbon emissions, the combined radiation forcing and the temperature change in the corresponding period had the highest consistency (30.3%).
中美俄加陆域碳汇对人为增温的消减贡献
DOI:10.11821/dlxb202101013
[本文引用: 1]
作为主要的气候强迫因子,CO<sub>2</sub>与人类活动密切相关,但很多研究往往忽视了陆地生态系统碳汇对人为排放CO<sub>2</sub>增温的消减作用。俄罗斯、加拿大、中国和美国是世界上地域面积最大、且社会经济处于不同发展阶段的4个国家,将短时期内CO<sub>2</sub>排放所引起的辐射强迫进行量化分析,对于评估人为和自然因素对气候的影响非常重要。本文基于CO<sub>2</sub>同化数据,利用“碳—气候”参数化方案,在分析人为碳排放及其气候效应的同时,考虑陆地生态系统碳汇的气候效应,进而得到4个国家的全球辐射强迫。结果显示:① 2000—2016年,4个国家人为排放的CO<sub>2</sub>均呈明显增加趋势(0.125 Pg C a <sup>-1</sup>),但陆地生态系统的碳汇作用也不断增强(0.003 Pg C a <sup>-1</sup>);其中,中美两国总的人为碳排放占了4个国家的87.19%,而俄罗斯陆地生态系统的吸收碳能力最强,总量达14.69 Pg C。② 截至2016年,陆地生态系统的降温效应达-0.013 W m <sup>-2</sup>,可消减人为碳排放增温效应的45.06%。充分说明若不考虑陆地生态系统,将会明显高估人为碳排放的增温效应。③ 整体上,相对于2000年和工业革命前的CO<sub>2</sub>浓度水平,4个国家总的人为碳排放分别贡献了0.32 W m <sup>-2</sup>和0.42 W m <sup>-2</sup>的全球辐射强迫。本文还进一步探讨了温度与辐射强迫的线性关系,相对于单一的人为或者自然因素而言,综合两者的辐射强迫,与相应时段的气温变化可解释度最高,达30.3%。
Characteristic of tradeoffs between timber production and carbon storage for plantation under harvesting impact: A case study of Huitong National Research Station of Forest Ecosystem
DOI:10.11821/dlxb201801013
[本文引用: 1]
The tradeoffs and optimizations of ecosystem services are the key research fields of ecology and geography. As the most important and complex ecosystem in terrestrial ecosystems, forest ecosystem plays a very important part in the biogeochemical cycle which include terrestrial carbon cycle and water cycle, and also provides numerous ecosystem services that are crucial to human wellbeing. China has the largest plantation area worldwide. Under the background of global warming, there are more and more concerns on timber production and carbon storage of plantations, nevertheless, they have a relationship of restricting each other. Thus, it is necessary to maximize the overall benefit of timber production and carbon storage for forest ecological development in China. We selected the Huitong National Research Station of Forest Ecosystem as our study area, and used permanent sample plot data of plantations and InVEST model to evaluate timber production and carbon storage quantitatively. Then, we constructed a conceptual framework of forest ecosystem service tradeoffs under different management regimes. Lastly, tradeoffs countermeasures for optimizing overall benefits of ecosystem services were put forward. The results showed that: (1) When timber production increased with harvesting intensity over the entire 100 year planning horizon, carbon storage decreased. There were tradeoffs between timber production and carbon storage according to the significant negative relationship. (2) When the overall benefits of timber production and carbon storage increased with harvesting intensity, the value of tradeoffs decreased. T1 and T2 scenarios, with harvesting intensity of 10%-20% every 10 years, were the optimum management regime for timber production and carbon storage to gain more benefits and less tradeoffs. (3) The current harvesting intensity in Huitong County was slightly higher than the optimum harvesting intensity. On practical dimension, these findings suggested that obvious objectives are needed to formulate the corresponding countermeasures of tradeoffs, in order to realize the improvement of ecosystem services and the optimization of ecosystem structures.
采伐影响下人工林木材生产与固碳功能权衡特征: 以湖南会同森林生态实验站为例
DOI:10.11821/dlxb201801013
[本文引用: 1]
中国人工林面积居世界首位,在全球气候变暖背景下,人工林在提供木材和固定CO<sub>2</sub>等方面同时具有重要意义。然而木材生产与碳储量之间存在此消彼长的权衡关系,如何综合考虑二者权衡过程,实现区域森林综合效益最大化,是中国森林生态建设中亟待解决的问题。选择会同森林生态实验站磨哨林场作为研究区,采用人工林固定样地多年观测数据以及InVEST模型,定量评估木材生产与碳储量,构建了不同管理模式下的权衡分析方法,提出了研究区森林生态系统综合效益最佳的权衡对策。研究发现:① 在采伐活动的影响下,木材生产与碳储量显著负相关(R = -0.907, P
