

1 引言
全球变暖已是不争的事实,对包括冰冻圈系统在内的地球气候系统产生了不利影响。根据全球政府间气候变化专门委员会(IPCC)第六次评估报告,人类活动造成的全球近地表气温在1850—2019年间上升了1.07 °C,且这一变暖趋势在未来仍将持续。冻土作为冰冻圈系统的重要组成,其分布状况与动态演化对气候变化和人类活动响应极为敏感,是全球变化的重要指示标志[1]。青藏高原是全球海拔最高、中低纬度面积最大的多年冻土分布区,高海拔多年冻土面积占全球的3/4,是全球气候变化的“驱动机”和“放大器”[2]。随着气候变暖,青藏高原多年冻土显著退化,具体表现为:多年冻土分布下界抬升、地温升高、活动层增厚、冻结期缩短、融化期延长、多年冻土厚度减薄、岛状多年冻土消失等[2⇓-4],严重制约高寒生态安全屏障作用发挥和中华水塔稳定。
浅表层冻融过程是冻土与高寒地理环境研究的核心和关键内容之一,是陆面过程的重要参量,影响并制约着深层冻土地温变化、地下冰形成及活动层厚度变化,并通过地—气热交换改变土壤理化性质、植被生长状况、地表水文过程、生物地球化学循环[5⇓-7]。地面冻结融化指数是浅表层冻土冻结和融化状况的重要表征,是计算冻土温度及多年冻土厚度的关键因子,在普通冻土、冻土环境及冻土工程研究中均有广泛应用[8-9]。然而,过去由于温度传感器防水性能弱及电池续航问题,长时间序列地面温度自动观测资料历来较少,因此地面冻融指数的计算多基于冻土区气象台站和再分析资料。相比而言,月尺度数据更容易获取,故冻土科学和工程研究多采用月均气温计算冻融指数。Zhang等[10]利用月均气温计算了阿拉斯加巴罗地区的冻结和融化指数,发现月均气温和日均气温计算的结果在高纬地区差异小于5%。Frauenfeld等[11]在北半球冻融指数的研究中得到相似结论,即高纬地区根据月均气温计算冻结指数的误差不足5%,但在青藏高原及中国东北的计算误差小于10%。青藏高原的冻融指数研究多基于国家台站资料。程国栋等[12]根据气温的年最大和最小月平均值计算了青藏铁路路基表面的融化指数和冻结指数。江灏等[13]通过年振幅方法基于月均气温的年最大值和最小值计算年振幅和年平均值,进而获得沱沱河和那曲地区路基表面融化指数与冻结指数。姜逢清等[14]在利用相邻站点资料插补缺失数据后,使用日最高和最低气温的平均值计算大气冻融指数。赵红岩等[8]分别用逐日温度、月平均和年振幅方法计算地面冻融指数,发现基于月均地面温度计算的结果整体误差可控制在一定水平内,融化指数和冻结指数的计算误差分别在2%和8%以内,而基于年振幅方法计算的冻融指数与月平均值的计算误差相当。高纬地区基于月尺度数据计算的冻融指数准确率相对较高,有的甚至高达95%[10],但在冻融交替频繁的中低纬地区,使用月尺度气温估计冻融指数相比日均气温的计算误差可能较大。
虽然气温反映了近地层大气空气分子间平均动能,但相比于冻土模拟制图的直接和上边界条件—地面温度,为了能更好反映多年冻土热状态,在应用气温计算冻土热状态参数时需考虑地表覆被(植被和积雪等)对温度的定量削减作用[15]。而地面温度是大气圈与土壤圈能量平衡的结果,与气温一道共同影响多年冻土的存在及其热稳定性,是冻土热状态研究的重要参数[16-17]。基于地面温度计算冻融指数并应用于相关冻土模型和方法,能在很大程度上减少模拟制图的误差[15]。由于地面温度观测相对较少,将大气冻融指数转换为地面冻融指数,是估算多年冻土活动层厚度、季节冻结深度的关键环节[18⇓-20]。在此过程中,联立地面与大气冻融指数比值的N因子起了重要作用,N因子反映了地表覆被对地面冻融指数的影响。庞强强等[21]利用气象台站的0 cm土壤温度计算了多年冻土活动层厚度,缺失值就利用N因子转换对应时段的气温得到;Zhang等[22]利用气温和N因子计算地面冻融指数,进而计算多年冻土活动层厚度。
当前冻土制图主要依靠大量钻孔实测地温数据以及冻土物理模型、统计学习和经验模型的应用,其精度取决于模型参数和输入数据的可靠性。受高寒高海拔恶劣气候、后勤补给保障困难及研究经费等的限制,野外大范围长期实地监测冻土地温数据获取较为困难。地面温度观测值则在一定程度上反映了冻土热状态,故多年冻土分布图的精准绘制有赖于野外实测地面温度数据的获取。目前国际上的一些冻土科学计划,如由国际冻土协会(IPA)领衔实施的全球多年冻土陆地网络(Global Terrestrial Network for Permafrost, GTN-P)和环极地活动层监测网络(Circumpolar Active Layer Monitoring Network, CALM)等均对地面温度进行了长期协同监测。区域性的冻土观测网络,如瑞士冻土监测网络(The Swiss Permafrost Monitoring Network, PERMOS),也在系统监测阿尔卑斯山多年冻土热状态及其变化之外监测了地面温度等。20世纪60年代以来中国在青藏高原布设了多年冻土监测网,开展了多年冻土水热状态变化机理、模型模拟和生态效应综合研究,但主要集中在青藏工程走廊进行,对于黄河源头区及青藏高原其他大部分区域仍缺少实地监测。
鉴于此,本文基于2015—2017年在黄河源头区多年冻土区的地面热状态长期监测数据,分析黄河源头区地面热状态和冻融过程特征,结合地面温度计算各监测点冻结融化指数、冻结融化天数、起始冻结融化时间、活动层厚度,并分析其与经纬度、海拔、植被指数等的空间相关性,以期为区域多年冻土的精准制图并进一步促进黄河源头区生态环境等相关研究提供基础。
2 研究区概况与数据方法
2.1 研究区概况
黄河源头区位于青藏高原东北部,本文的研究区为多石峡以上的集水区域(图1),地理位置为33.70°N~35.48°N、95.89°E~98.82°E,面积为2.94×10⁴ km2,海拔在4197~5267 m之间,平均为4490.9 m[23]。地形呈明显的带状特征,南北两侧为海拔较高的高山区,中部为低缓的宽谷湖盆[24]。研究区气候为内陆高寒气候类型,寒冷干燥,多年平均气温低于-3.0 ℃,多年平均降水量300~500 mm,多年平均蒸发量1000~1500 mm[25-26]。主要地表覆被包括高寒沼泽草甸、高寒草甸、高原草原和荒漠化草原,局部山地分布垫状植被和流石滩稀疏植被,其中高寒草甸和高寒草原为主要地表覆被,约占黄河源头区总面积70%以上[27]。以往研究表明,黄河源头区多年冻土面积2.5×10⁴ km2,约占85.2%;季节冻土面积0.3×10⁴ km2,约占9.8%;其余为鄂陵湖、扎陵湖及玛多四湖区域[28]。长期监测表明,研究区10~15 m的多年冻土年均地温大多高于-2.0 ℃,实测最低为-1.76 ℃,多年冻土厚度普遍小于40 m,最厚74 m[29]。2010年巴颜喀拉山南、北坡连续多年冻土分布下界约为4670 m和4615 m,布青山南北坡多年冻土分布下界约为4350 m和4200 m[30]。在气候变暖和人类活动影响下,源区多年冻土地温普遍升高,年变化深度处(约15 m)增温率为0.04~0.29 ℃·10a-1,其中低温多年冻土(年均地温低于-1.0 ℃)升温相对较快,而高温特别是年均地温高于-0.5 ℃的极高温多年冻土升温相对缓慢[29⇓-31]。
图1
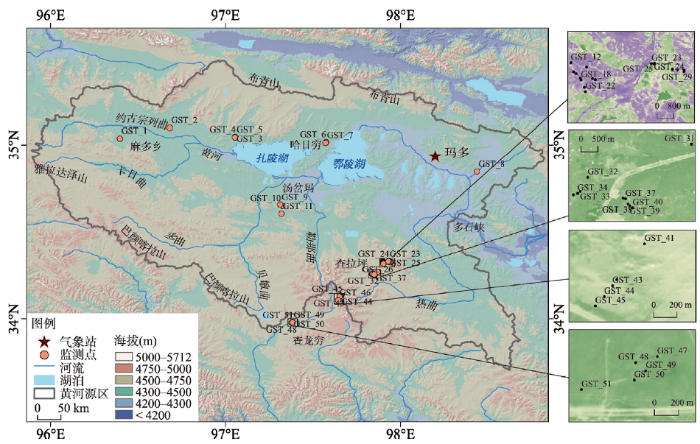
图1
研究区地理概况和地面温度监测点示意
Fig. 1
Geographical background and the observation sites of ground surface temperature in the Headwater Area of the Yellow River
2.2 数据来源
本文地面温度监测自地面以下植被根系0~5 cm深度,数据采集频率为30 min ·次-1。所有监测点均位于33.97°N~35.09°N,96.39°E~98.44°E之间,海拔范围4219~4962 m,平均为4602.2 m(图1)。位于季节冻土区的有GST_50、GST_24、GST_25、GST_26、GST_3、GST_2,其余监测点均位于多年冻土区,其中有深层土壤温度监测的点有GST_6、GST_7、GST_8、GST_31、GST_37、GST_46、GST_49、GST_51,同时监测气温的点包括位于哈日穷、汤岔玛、查拉坪的13个监测点。由于研究区气候恶劣、地形复杂,野外监测数据获取难度大,本文地面温度数据观测时间为2015—2017年。
为了探究地面热状态受植被影响的规律,基于空间分辨率为10 m的Sentinel-2影像(
2.3 研究方法
2.3.1 地面冻融指数
年地面冻结(融化)指数为冻结(融化)期所有低于(高于)0 ℃的日均地面温度之和[11]。为了保证冻结(融化)期负温(正温)数据的连续性,冻结期定义为7月1日至次年6月30日,融化期为1月1日至12月31日。地面冻结指数计算公式为:
式中:
地面融化指数的计算公式为:
式中:
2.3.2 冻融循环划分
2.3.3 活动层厚度计算
本文基于地面融化指数,利用Stefan公式计算活动层厚度,计算公式为:
2.3.4 NDVI计算
归一化植被指数(NDVI)是植被生长状态及其空间分布密度的最佳指示因子,其值介于-1.0~1.0,负值表示地面覆被为云、水、雪等,对可见光高反射;0表示下垫面为岩石或裸土等;正值表示有植被覆盖,其值越大表明植被生长状况越好。NDVI计算公式为:
式中:
2.3.5 统计分析方法
采用相关分析法探究地面温度、地面冻融指数等与海拔、经纬度、NDVI等影响因素的关系。利用逐步回归法确定地面热状态及冻融过程分异的影响因素,该方法将海拔、经纬度、植被指数等各自变量逐个引入回归模型,若某自变量通过显著性检验则将其纳入回归模型,否则移除,直至所有变量都考虑进模型中,最终得到地面热状态及冻融过程显著变量自动拟合的最优回归模型。
3 结果分析
3.1 地面温度分布特征
研究区内监测点年均地面温度范围为-3.06~1.31 ℃,平均为-0.55±0.16 ℃(图2)。相关分析表明,海拔对年均地面温度的贡献率为0.4 ℃ (100 m)-1,即海拔每上升100 m,年均地面温度下降0.4 ℃(R = -0.63、P < 0.01)。由此推测,黄河源头区年均地面温度为0 ℃的海拔大致为4461.3 m。但研究区地面温度在局地尺度上体现了极强的空间异质性,造成海拔最低点年均地面温度并非最低,而最高的年均地面温度却并不出现于海拔最低点。位于长江和黄河流域分界线的巴颜喀拉山口,5个监测点依据海拔差异布置,海拔范围4821~4962 m,年均地面温度范围-3.06~-1.14 ℃,其中GST_41为海拔最高点,其年均地面温度-3.06 ℃,为研究区内最低(图1)。位于典型高寒沼泽草甸查拉坪的监测点海拔范围为4591~4793 m,年均地面温度为-2.78~0.46 ℃。位于花石峡至玛多县城间的GST_8,海拔虽低至4219 m,但其年均地面温度为-0.26 ℃;而位于姊妹湖南汤岔玛盆地内的GST_09,海拔为4481 m,年均地面温度却为研究区最高,为1.31 ℃。
图2
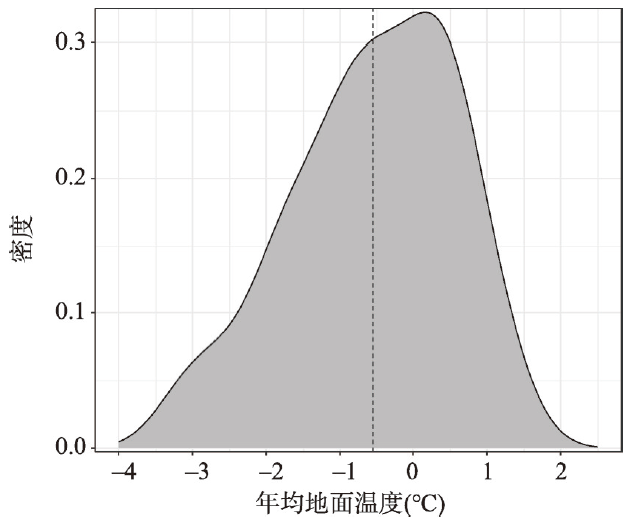
图2
黄河源头区年均地面温度密度
Fig. 2
Density of mean annual ground surface temperature in the Headwater Area of the Yellow River
黄河源头区地面温度空间分异受区域地带性因素和复杂下垫面要素的复合影响,前者包括纬度、经度、垂直地带性等,后者包括植被、积雪、水体、地质构造、土壤质地类型和水分条件等[34⇓⇓-37]。地表微地形通过改变太阳入射角而影响太阳辐射在地表的重分布,并通过植被和土壤湿度间接影响地面温度空间分布。为了更精准分析地表微地形对高海拔地面温度的影响,本文在逐步回归法中先后引入坡度、坡向以及归一化坡度、归一化坡向、等效纬度等因素。等效纬度是一个表征太阳直接辐射对地面热状态影响的长期潜能因子,也是判断坡面走向的重要数据,用来综合考虑地形及纬度对辐射的影响,由坡向、坡度和纬度共同计算得到。在排除奇异值GST_14之后,利用逐步回归法分析了研究区50个监测点年平均地面温度与海拔、纬度、经度、NDVI、坡度、坡向、归一化坡度、归一化坡向、等效纬度等的关系,得到地面温度最佳回归方程(R2 = 0.613、P < 0.001):
式中:
表1 最佳回归模型残差与F检验结果
Tab. 1
| 参数 | 平方和 | 自由度 | 均方 | F值 | P值 |
|---|---|---|---|---|---|
| 回归 | 37.291 | 3 | 12.430 | 24.284 | <0.001 |
| 残差 | 23.545 | 46 | 0.512 | ||
| 总计 | 60.836 | 49 |
黄河源头区基于监测的月均地面温度范围为(-11.01±2.35)~(8.64±2.81) ℃,平均-0.59±7.07 °C(图3)。1月平均值最低,为-11.01±2.35 ℃,最低值出现于GST_2,为-15.9 ℃。植被覆盖度影响地面温度年内较差,覆盖度较高的监测点,其地面温度年较差较小(R = 0.50,P < 0.001)。由于黄河源头区植被类型相对较单一,NDVI能够反映吸收的光合有效辐射、叶绿素密度、叶面积以及蒸发速率等植被参数[38],本文以NDVI表征植被长势。研究发现,NDVI越大,即植被生长状况越好,冷季温度就越高,暖季温度就越低。如,NDVI小于0.4的监测点1月份平均地面温度为(-12.1±0.5) ℃,NDVI大于0.4的监测点则为(-9.9±0.3) ℃。月均地面温度在8月份达到最高,为(8.6±2.8) ℃,最高值出现于GST_3,其月均地面温度为16.3 ℃。将监测点根据NDVI阈值分为≤ 0.2、0.2~0.5、> 0.5等3类,发现其8月份月均地面温度分别为(10.7±1.6) ℃、(8.8±0.5) ℃、(7.9±0.6) ℃,即随NDVI值升高而降低,这也意味着较好的植被覆盖具有较强的地面温度削减作用。
图3
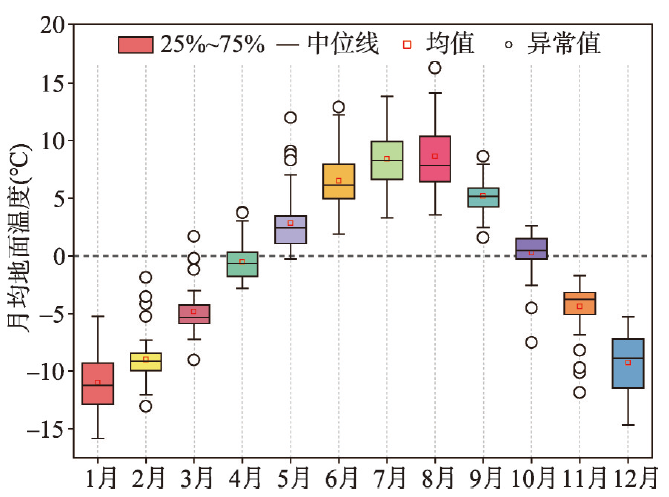
图3
黄河源头区所有监测点的月均地面温度
Fig. 3
Monthly ground surface temperature averaged for all the 51 sites in the Headwater Area of the Yellow River
3.2 地面冻融指数空间分布特征
黄河源头区各监测点的地面冻结指数范围为851.9~1906.6 ℃·d,平均为1253.3 ℃·d(图4),最大值出现于查拉坪的GST_35,最小值位于查拉坪东侧的GST_24(图1)。黄河源头区大多数监测点的冻结指数集中于1000~1600 °C·d,> 1600 ℃·d的监测点均位于东南部的查拉坪和巴颜喀拉山口,这与该地海拔较高和植被指数较大相对应。冻结指数随海拔升高而增加(R = 0.292、P < 0.05),其与经纬度的相关性并不强。局地尺度上,巴颜喀拉山口冻结指数为1229.6~1782.5 ℃·d,与海拔显著正相关(R = 0.972、P < 0.01);查拉坪东北部监测点冻结指数为851.9~1576.4 ℃·d,海拔范围4500~4793 m,与海拔显著正相关(R = 0.822、P < 0.001)。
图4
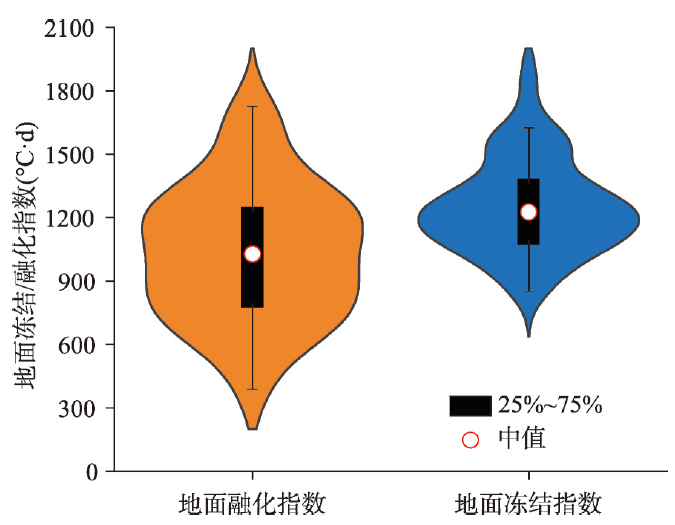
图4
黄河源头区地面冻结/融化指数
Fig. 4
Violin plots of ground surface freezing and thawing indices in the Headwater Area of the Yellow River
黄河源头区各监测点地面融化指数范围为388.4~1727.2 ℃·d,平均值为1039.3 ℃·d(图5),最大值出现于扎陵湖西北岸的GST_3,最小值位于查拉坪的GST_37。对融化指数与其他因素的相关性分析发现,融化指数随海拔、经度升高而显著下降,其中海拔对于融化指数的影响最大(R = -0.725)。逐步回归法分析表明,融化指数与海拔、纬度、经度、NDVI等显著相关(R = 0.818、P < 0.001),而冻结指数相关性较弱(R = 0.399、P < 0.01)。地面融化指数所构建的回归方程为:
图5
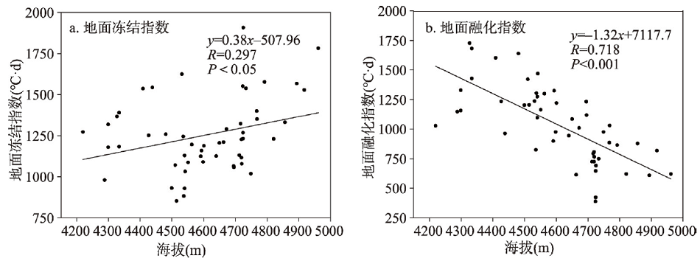
图5
地面冻结/融化指数与海拔关系
Fig. 5
Linear relationship between ground surface freezing/thawing index and elevation in the Headwater Area of the Yellow River
式中:
3.3 冻融天数空间分布特征
黄河源头区不同监测点的土壤温度和含水量、地表覆被等空间分异明显,进而造成地面冻结融化天数具有极大的空间分布差异。其中,完全冻结天数为54~219 d,平均为137.1 d;完全融化天数为61~156 d,平均为128.8 d(图6);日冻融循环天数为15~230 d,平均为102 d。将监测点冻结天数划分为3种类型:0~90 d(约少于3个月);90~180 d(约3~6个月);180~270 d(超过6个月),整体而言,研究区大部分监测点的冻结天数在90~180 d,低于90 d以及高于180 d的监测点共13个,占总体的25.4%。从空间分布来看,完全冻结天数超过180 d的监测点主要位于查拉坪,该区监测点平均海拔4705 m,NDVI平均为0.56。而黄河源头区北部的纬度更高、海拔和植被覆盖度更低的监测点,冻结天数为67~153 d,平均为121.6 d。完全冻结天数少于90 d的监测点零星分布于查拉坪。完全融化天数平均为127.4 d,可以分为3种类型:60~90 d(少于3个月);90~120 d(约在3~4个月);120~160 d(大于4个月),完全融化天数集中于120~160 d,占总体的69.7%。完全融化天数大于100 d时,融化天数与海拔呈显著负相关(R = -0.521、P < 0.01),与NDVI呈显著正相关(R = 0.526、P < 0.01)。土壤表层发生日冻融循环的天数在不同地区差异极大,范围在15~230 d,日冻融循环的平均天数为102.4 d。
图6
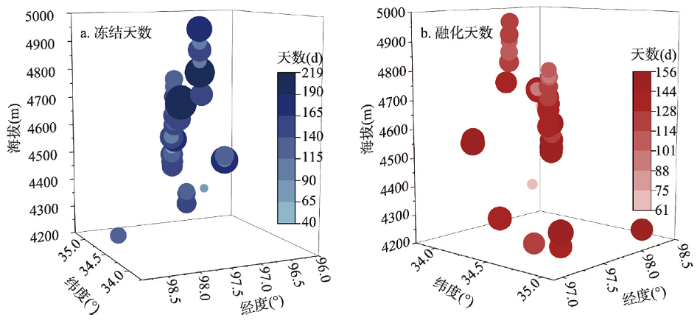
图6
黄河源头区地面冻结/融化天数与海拔、经纬度关系
Fig. 6
Relationship between ground surface frost/thawed days and elevation, latitude, and longitude in the Headwater Area of the Yellow River
3.4 起始冻融时间空间分布特征
图7
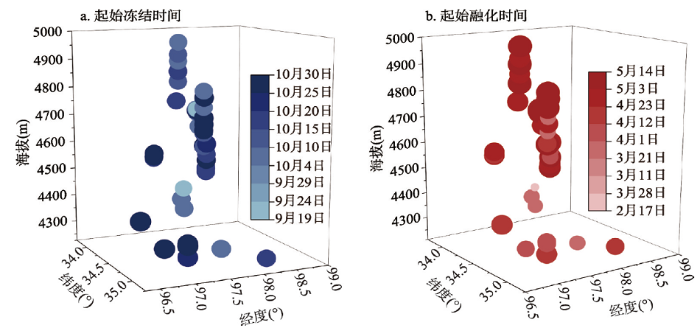
图7
黄河源头区地面起始冻结/融化时间与经纬度和海拔关系
Fig. 7
Relationship between the ground surface freezing/thawing onset date and the latitude, longitude, and elevation in the Headwater Area of the Yellow River
黄河源头区地面起始冻结时间的变化范围小于起始融化时间的变化范围,主要集中于9月下旬到10月底,平均为10月17日,绝大部分监测点的起始冻结时间集中在10月上中旬(图7)。地面起始冻结时间最早为9月24日,出现于GST_32,最迟与最早相差达36 d。位于两湖之间的监测点起始冻结时间均在10月下旬,该区域监测点起始融化时间和起始冻结时间较晚。查拉坪大部分监测点起始冻结时间在10月10日之前,该区域起始融化时间迟,而起始冻结时间早。总体而言,研究区起始冻结时间与海拔呈负相关关系(R = 0.523、P < 0.001),海拔越高,开始冻结的时间越早。回归结果表明,起始冻结时间与海拔、纬度具有相关性,起始融化时间在各监测点差异较大,与地理位置、植被等关系不显著。稳定冻结开始时间主要集中在10月份,冻结过程发生的时间更为集中,耗时小于融化过程。
3.5 N因子
N因子是地面冻融指数与大气冻融指数的比值,通过N因子及其影响因子的归因分类,结合大气冻融指数即可获得地面冻融指数。通常而言,融化N因子(Nt)大于冻结N因子(Nf)。本文根据研究区已有自动气象站气温数据,计算了汤岔玛、哈日穷及查拉坪部分监测点的N因子。结果表明,Nt范围为0.87~1.60,主要集中于1.20~1.50,平均1.29±0.21;Nf范围为0.49~0.90,主要集中于0.5~0.65,平均0.60±0.18(图8),与野外实测场地N因子值相当[40],但比国家台站值都小[41]。以往研究表明,黄河源头区实测Nt范围为0.76~1.84,平均1.31±0.28,Nf范围为0.39~0.91,平均0.58±0.12[40];而位于黄河源头区的玛多站Nt平均为2.09±0.14,Nf平均为0.70±0.08[41]。本文还发现,Nt越大,Nf也越大,查拉坪、汤岔玛、哈日穷平均Nt分别为1.33、1.26、1.14;Nf分别为0.61、0.60、0.56。这是因为,海拔更高的场地暖季地气温差更大,冷季地气温差更小,查拉坪、汤岔玛、哈日穷的平均海拔分别为4721 m、4445 m、4299 m,夏季平均地气温差分别为0.92 ℃、0.73 ℃、0.03 ℃,冬季地气温差分别为2.79 ℃、3.73 ℃、5.21 ℃;查拉坪地面融化指数与大气融化指数的差值较其他场地更大,地面冻结指数与大气冻结指数的差值较其他场地更小。
图8
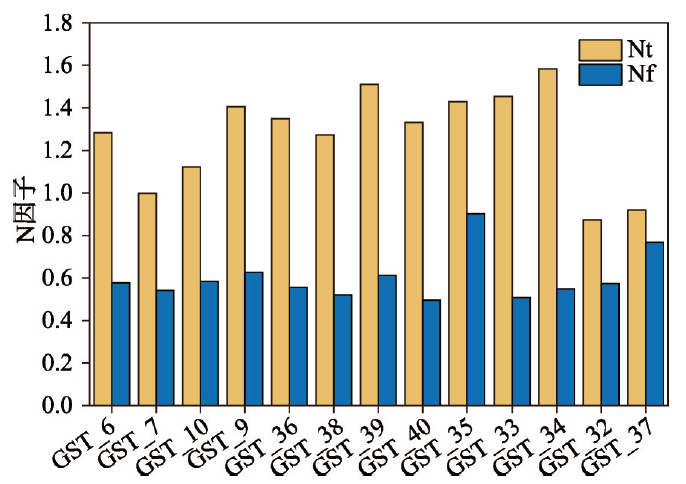
图8
黄河源头区实测N因子
Fig. 8
The measured N-factor in the Headwater Area of the Yellow River
一般而言,N因子的空间分异受植被状况、地形、气候条件影响而变化,Nf通常小于1.0,而Nt通常大于1.0。本文中高寒沼泽草甸Nt为0.87~1.58,平均为1.30,Nf为0.49~0.90,平均为0.60;高寒草原的Nt平均为1.34,Nf平均为0.60,这与青藏高原其他多年冻土区较为相似。如Yin等[42]在青藏高原腹地北麓河盆地的研究中发现,高寒草原的Nf为0.54~0.71,Nt为1.15~2.48;沼泽草甸的Nf为0.38~0.7,Nt为0.91~1.65。张中琼等[18]采用《1∶100万中华人民共和国植被图》中植被类型划分,测量了青藏公路沿线相应植被类型下的N因子,发现高寒草原为1.39,高寒草甸及高寒草原草甸混合区为1.61,无植被区为2.55。
3.6 活动层厚度
表2 各监测点活动层厚度实测值与计算值对比
Tab. 2
| 监测点 | 纬度(°N) | 经度(°E) | 海拔(m) | 实测值(m) | 计算值(m) | 偏差(m) |
|---|---|---|---|---|---|---|
| GST_8 | 34.85 | 98.44 | 4219 | 2.391 | 2.417 | 0.026 |
| GST_7 | 35.01 | 97.57 | 4299 | 1.200 | 1.286 | 0.087 |
| GST_6 | 35.02 | 97.58 | 4299 | 1.516 | 1.551 | 0.035 |
| GST_51 | 33.98 | 97.38 | 4532 | 2.322 | 2.654 | 0.332 |
| GST_49 | 33.98 | 97.38 | 4536 | 2.715 | 2.168 | -0.547 |
| GST_46 | 34.11 | 97.65 | 4749 | 2.572 | 2.689 | 0.117 |
| GST_37 | 34.26 | 97.85 | 4724 | 0.718 | 1.077 | 0.359 |
| GST_31 | 34.27 | 97.87 | 4663 | 1.854 | 1.397 | -0.457 |
不同地形、植被、土壤条件下,活动层厚度的主要影响因素有所差异。查拉坪场地植被覆盖度较高,加之其浅表层为细颗粒且较厚的泥炭层,其活动层厚度平均为1.48±0.21 m。回归分析表明,活动层厚度与海拔、显著相关(R = 0.845、P < 0.001):
式中:
4 结论与讨论
4.1 讨论
4.1.1 海拔是地面热状态和冻融过程分异的主要因素
影响地面热状态和冻融过程空间分异的因素既有经纬度、海拔等地带性因素,也有植被、土壤质地、坡度坡向等非地带性的局地因素。黄河源头区遍布高低起伏的高山丘陵,地形遮蔽和阴影通常会造成更低的地面温度。若只考虑海拔对地面温度的影响,海拔每上升100 m,年均地面温度就下降0.4 ℃,即地面温度的垂直递减率为0.4 ℃·(100 m)-1;而综合考虑海拔、纬度及NDVI影响时,其垂直递减率达到0.7 ℃·(100 m)-1。这与其他一些地区的研究结论相近,如李述训等[17]的研究表明,青藏高原地面温度垂直递减率为0.47 ℃·(100 m)-1,Steffen等[43]的研究表明格陵兰的近地表温度垂直递减率为0.71 ℃·(100 m)-1。
海拔与融化指数的相关性大于冻结指数,这与曹斌等[9]的研究结论较为一致。本文中融化指数低于900 ℃·d的监测点大多位于海拔较高的查拉坪和巴颜喀拉山口。巴山口监测点海拔4820 m以上,其平均融化指数仅为709.5 ℃·d。查拉坪海拔4710 m以上,加之其地表覆被为高寒沼泽草甸,植被覆盖度和地表含水量高,反射部分到达土壤的太阳辐射,减少了进入土层的热量,因而融化指数也较低。黄河源头区地面起始冻融时间主要受海拔和纬度影响,这与岳书平等[44]、杨淑华等[45]、Wang等[3]的研究结论较为一致,即海拔越高,起始冻结时间越早,起始融化时间越晚。刘广岳等[39]发现,青藏公路沿线地面起始融化时间与海拔的相关性大于纬度,起始冻结时间与海拔的相关性小于纬度。本文研究结果表明,黄河源头区起始融化时间与海拔的相关性大于纬度,但起始冻结时间只与海拔相关,与纬度无关,这可能与监测点之间纬度差异较小有关。
4.1.2 阴阳坡地面热状态的差异分析
坡度坡向引起潜在太阳辐射的差异分布,是地面温度空间分异的重要原因[46],并进一步导致高海拔多年冻土分布下界不一[29],且使各局地因素作用权重不同。地面温度在阴阳坡往往也有明显的非对称性。本文将监测点地面温度按阴坡、阳坡进行逐步回归分析,发现阳坡地面温度与海拔(P < 0.001)、坡度(P < 0.05)、坡向(P < 0.05)有关(R = 0.790、P < 0.001),而阴坡地面温度只与海拔(P < 0.01)显著相关(R = 0.690、P < 0.01)。坡向不仅控制地面接收的太阳辐射量,使阳坡接受热量多于阴坡,也影响降水量与土壤水分分异,阴坡植被长势一般较阳坡为好。本文51个监测点中,位于阴坡的监测点其NDVI平均为0.50,位于阳坡的监测点其NDVI平均为0.42,而阳坡年平均地面温度为-0.26 ℃,明显高于阴坡的-0.96 ℃。
通常而言,气温垂直递减率与近地层大气状况、地表比辐射率、风速等有关[47],而植被和积雪等下垫面条件对地面温度的复合作用导致其与气温并不以等比例形式增减,因而两者的垂直递减率呈现一定差异。本文发现不同坡向对黄河源头区地面温度垂直递减率的分异产生影响。参照李静等[48]将纬度转化为等量高程值并叠加在实际高程上消除纬度影响的做法,本文将等效高程值引入到阴坡的地面温度回归模型中,发现其有效提升了模型拟合度(R = 0.716、P < 0.001)。新回归方程中,地面温度与等效高程显著相关(P < 0.001)。经等效高程值修正的阳坡的垂直递减率为0.7 ℃·(100 m)-1,在阴坡的垂直递减率为0.5 ℃·(100 m)-1。
4.1.3 植被对地面热状态和冻融天数的影响
地表植被特征既影响土壤理化性质,事实上也在一定程度上指示了土壤理化特征,对表层土壤水—热交换具有显著作用[37]。植被冠层截流降水引起地表蒸散发量变化,对太阳辐射反射作用的强弱影响地面能量平衡,是造成地面温度和融化指数分异的重要局地因素。植被对地面温度具有削减作用,且其作用大小与季节相关。逐步回归分析表明,NDVI与年均地面温度和夏季地面温度负相关,与冬季地面温度正相关。这是因为,植被对地面温度的影响具有双重性。夏季时,植被通过反射和蒸腾作用减少太阳直接辐射接收,降低土体温度,起冷却作用,因此NDVI越大的地方,夏季地面温度越低。而冬季时,植被降低近地表风速,成为阻挡土壤散热的隔热体,并减少了地表散热,对土体起保温作用。因此,NDVI值较大即植被生长状况较好的监测点,冬季地面温度较高,而夏季较低,冬夏季地面温差与NDVI显著负相关(P < 0.01)。
植被也是影响完全冻结天数和完全融化天数空间分异的重要因素之一。查拉坪以北的监测点由于海拔相对低,完全冻结天数均较小,但其完全融化天数并未受海拔影响。巴颜喀拉山口的监测点,其海拔平均为4890 m,其中GST_41海拔最高,完全冻结天数达173 d,而GST_45海拔较其低141 m,但由于其植被状况更好,完全冻结天数达204 d,说明在该区域植被对土壤的降温作用强于海拔升高引起的降温作用。此外,巴颜喀拉山口完全融化天数与
4.2 结论
本文利用黄河源头区地面温度实测资料分析了地面冻结和融化指数、冻结融化天数和起始冻结融化时间的空间分布特征及其影响因素,得到以下结论:
(1)黄河源头区地面温度受海拔、纬度、NDVI共同作用(P < 0.001),海拔影响最大。只考虑海拔影响时其垂直递减率为0.4 ℃·(100 m)-1,考虑多因子后阳坡垂直递减率为0.7 ℃·(100 m)-1,阴坡为0.5 ℃·(100 m)-1。月均地面温度1月份最低,8月份最高。夏季NDVI越大,地面温度越低,冬季NDVI越大,地面温度越高,冬夏地面温差与NDVI显著负相关。
(2)黄河源头区各监测点地面冻结指数平均为1253.3 ℃·d,地面融化指数平均为1039.3 ℃·d。冻结指数随海拔升高而增大;融化指数与海拔、纬度、经度、NDVI均呈显著负相关,NDVI对融化过程的作用较冻结过程更大。冻结指数与经度、纬度弱相关。
(3)黄河源头区地面起始融化发生于3月下旬到5月中旬,起始冻结发生于9月下旬到10月底。起始冻结时间与海拔、纬度具有正相关;各监测点起始融化时间空间分异较大,起始冻结时间越晚,起始融化时间越早。
(4)黄河源头区完全冻结天数平均为137.1 d,完全融化天数平均为128.8 d,日冻融循环天数平均为102 d。完全冻结天数在空间上呈北低、东南高的特征,完全冻结融化天数与监测点附近微地形、土壤质地、植被状况、积雪情况等相关,空间异质性较大。
(5)黄河源头区融化N因子(Nt)多集中于1.2~1.5,平均为1.29±0.21;冻结N因子(Nf)主要集中在0.5~0.65,平均为0.60±0.18;基于地面融化指数计算的活动层厚度为0.99~2.72 m,平均为1.68±0.45 m。
参考文献
Progress in studies of cryospheric changes and their impacts on climate of China
冰冻圈变化及其对中国气候的影响
Characteristic, changes and impacts of permafrost on Qinghai-Tibet Plateau
青藏高原多年冻土特征、变化及影响
Changes in the timing and duration of the near-surface soil freeze/thaw status from 1956 to 2006 across China
DOI:10.5194/tc-9-1321-2015
URL
[本文引用: 2]

. The near-surface soil freeze/thaw status is an important indicator of climate change. Using data from 636 meteorological stations across China, we investigated the changes in the first date, the last date, the duration, and the number of days of the near-surface soil freeze over the period 1956–2006. The results reveal that the first date of the near-surface soil freeze was delayed by about 5 days, or at a rate of 0.10 ± 0.03 day yr−1, and the last date was advanced by about 7 days, or at a rate of 0.15 ± 0.02 day yr−1. The duration of the near-surface soil freeze decreased by about 12 days or at a rate of 0.25 ± 0.04 day yr−1, while the actual number of the near-surface soil freeze days decreased by about 10 days or at a rate of 0.20 ± 0.03 day yr−1. The rates of changes in the near-surface soil freeze/thaw status increased dramatically from the early 1990s through the end of the study period. Regionally, the changes in western China were greater than those in eastern China. Changes in the near-surface soil freeze/thaw status were primarily controlled by changes in air temperature, but urbanization may also play an important role.\n
Spatio-temporal characteristics of evapotranspiration and its relationship with climate factors in the source region of the Yellow River from 2000 to 2014
DOI:10.11821/dlxb201811006
[本文引用: 1]
Located at the eastern margin of the Tibetan Plateau, the source region of the Yellow River is an important ecological security shelter for economic development in Southwest China, with its unique natural habitats and abundant natural resources. Based on the data of 18 meteorological stations within and around the source region, map of China vegetation types (1:1000,000) and DEM data, and using the methods of trend analysis, relative inter-annual variation and correlation analysis, we selected MODIS evapotranspiration (ET) as the main data source to research the spatio-temporal characteristics of ET and its variation under different land use types as well as its relationship with climate factors in the study area from 2000 to 2014. The results indicate that: (1) the regional differentiation of mean ET over years is obvious, the northern ET is significantly weaker than that of the central and southeastern parts, and the strongest ET is observed in the southeastern part. The multi-year mean value of ET is 538.61 mm/a, and the anomaly relative variation is obvious. In addition, the trend of inter-annual variation of ET decreases firstly and then increases, and the trend variation rate is 0.44 mm/a. (2) During the study period, the ET shows a periodic unimodal trend and peaks in July. Moreover, seasonal differences of ET are apparent in the source region of the Yellow River, and the highest value of ET reaches 188.14 mm/a in summer, followed by spring and autumn, yet the lowest is only 97.15 mm/a in winter. (3) From 2000 to 2014, the value of ET in different types of land use has a similar regular pattern, namely: wetland > forest > grassland > other types > bare land. On the whole, the value of ET in each type of land use increases gradually. (4) According to the correlation analysis results, there are positive correlations between ET and air temperature, as well as between ET and precipitation, while ET has a negative correlation with relative humidity. The effect of precipitation on ET is stronger than that of air temperature. Furthermore, the result of ET driven by different factors demonstrates that the climate-driven region of ET is predominantly precipitation-driven in the source region of the Yellow River.
2000—2014年黄河源区ET时空特征及其与气候因子关系
DOI:10.11821/dlxb201811006
[本文引用: 1]
黄河源区地处青藏高原东缘,具有独特的自然生境和丰富的自然资源,是中国西南区域经济发展的重要生态安全屏障。以MODIS ET产品作为研究黄河源区地表蒸散发(ET)的数据源,结合黄河源区内部及周边18个气象站数据、全国1∶100万植被类型图和黄河源区DEM数据,利用趋势分析、相对年际变化和相关分析法,研究2000-2014年黄河源区ET时空变化特征及不同土地利用类型下ET的变化规律,重点探讨了ET与气候因子的关系。结果表明:① 黄河源区多年ET区域分异规律明显,北部ET显著弱于中部和东南部,最强ET位于黄河源区的东南部,多年平均ET值为538.61 mm/a,距平相对变化显著,ET年际变化呈先减小后增加的趋势,平均趋势变化率为0.44 mm/a;② 年内ET呈周期性单峰变化趋势,7月达到峰值;2000-2014年黄河源区多年四季ET季节性差异明显,夏季ET最强达到188.14 mm/a,春秋季次之,冬季ET最弱仅97.15 mm/a;③ 研究时段内不同土地利用类型的ET大小表现为沼泽地>林地>草地>其他>裸地,整体上各土地利用类型的ET呈逐渐增加趋势;④ 相关分析结果表明,ET与同期气温、降水呈正相关关系,与相对湿度呈负相关关系,其中降水对ET的影响强于气温;驱动分区结果显示黄河源区ET受气候因子驱动的地区主要表现为降水驱动。
Relationship between frozen soil together with its water-heat process and ecological environment in the Tibetan Plateau
青藏高原冻土及水热过程与寒区生态环境的关系
The development of study on the soil freezing-thaw process in land surface model
陆面模式中土壤冻融过程参数化研究进展
DOI:10.11867/j.issn.1001-8166.2002.01.0044
[本文引用: 1]
土壤冻融过程在寒区水文和气候系统中有着重要作用。陆面模式中土壤冻融过程的参数化对模式的设计和模拟结果有着关键作用。通过对广泛应用的Bucket,SIB,BATS,VIC,BEAS, LSM等几种主要的陆面模式中的冻融过程参数化方案进行了总结和比较。首先,详尽地描述了土壤冻融与气候变化的数值模拟研究,总结和评述了土壤冻融过程对气候变化的作用。其次,对几种主要的陆面过程模式在土壤水热参数化方案中对冻融过程的考虑及其特点进行了比较和讨论。还对冻结深度和冻结周期的预报模式进行了简介,最后对该领域当前面临的主要研究问题进行了探讨和阐述。
Co-evolution of climate-vegetation-hydrology and its mechanisms in the source region of Yellow River
DOI:10.11821/dlxb202207011
[本文引用: 1]
Vegetation recovery under global change and its consequent evolution of eco-hydrological processes have modulated the water resources conservative capacity in the source region of the Yellow River (YRSR). Based on climatological data, remotely sensed vegetation index and geographical information, the integrated simulations of water and carbon cycles in the YRSR are presented, with the vegetation interface processes (VIP) distributed eco-hydrological dynamic model. Then the co-evolving mechanisms of hydrological and vegetation dynamics are investigated. Results show that warming and wetting climate in the YRSR has improved the vegetation growing condition and extended the growing period for more than 10 days in recent decades. Averaged NDVI from 2010 to 2020 increased by 4.5% relative to that from 2000 to 2009. Vegetation gross primary productivity (GPP) shows a significant uptrend with a rate of 4.57 gC m-2 a-1, 77% of which is contributed by climate change and elevated atmosphere CO2 fertilization, and the rest 23% is by vegetation greening. Evapotranspiration (ET) is increasing at a rate of 2.54 mm a-1 and vegetation water use efficiency (WUE, expressed as GPP/ET) is also improving at a relative rate of 5.1% a-1. Generally, annual ET, GPP and WUE and their trends are decreasing along the elevation below 4200 m. At basin scale, there are significant positive correlations between the vegetation greenness and the runoff coefficient with precipitation in the current and previous years, demonstrating a legacy effect of precipitation for vegetation recovery on water conservation capacity. The increased ET might be a benefit to the water recycle between land surface and atmosphere, which will alleviate the reduced potential of water yield owing to ecological restoration and establish trades-off and synergies among precipitation, vegetation and water yield. Conclusively, exploring the mechanisms of hydrological responses to climate change and vegetation recovery and its feedback will provide scientific support to the assessment of ecological engineering programs in the source regions.
黄河源区气候—植被—水文协同演变及成因辨析
DOI:10.11821/dlxb202207011
[本文引用: 1]
全球变化下黄河源区水文过程的演变影响流域生态系统的水源涵养功能,流域植被改变也影响水循环。本文基于气候、植被信息和VIP分布式生态水文模型,开展黄河源区水碳循环要素变化的集成模拟,分析了气候—植被—水文要素的协同演变机制。结果表明,2000年以来黄河源区气候呈暖湿化趋势;植被绿度明显提高,2010—2019年比2000—2009年平均增加了4.5%;生长季延长了至少10 d;植被生产力(GPP)显著上升,倾向率为4.57 gC m<sup>-2</sup> a<sup>-1</sup>;植被恢复措施对GPP变化的贡献约为23%,气候变化和大气CO<sub>2</sub>升高的施肥效应的贡献为77%。源区植被蒸散量(ET)呈增加趋势,倾向率为2.54 mm a<sup>-1</sup>,水分利用效率(WUE)亦提高,平均相对上升率为5.1% a<sup>-1</sup>。GPP、ET和WUE年总量及其变化率在海拔4200 m以下随高度上升而减小,之后变化趋缓。源区植被绿度和径流系数与当年和前一年降水呈显著正相关,反映降水蓄存于植物根层土壤的遗留效应。蒸散增强在一定程度上有利于源区地表—大气之间的水分再循环,帮助缓解生态恢复引起的产水能力下降,促进降水—植被—径流之间的良性互馈关系的形成。揭示水文对气候变化和植被恢复的响应和互馈机制,可为生态恢复措施对源区水源涵养功能的影响及效应的定量评估提供科学依据。
The surface thawing-freezing indexes along the Qinghai-Tibet railway: analysis and calculation
青藏铁路沿线地表融冻指数的计算分析
Spatial variability of freezing-thawing index over the Heihe River Basin
DOI:10.11867/j.issn.1001-8166.2015.03.0357
[本文引用: 2]
Air and ground freezing thawing index for stations in the Heihe River Basin were calculated based on daily mean temperature, and its variation characteristics and time series were analyzed. The results showed that, the freeing index over the Heihe River Basin were influenced by elevation and latitude while the thawing index mainly influenced by elevation;air freezing-thawing index and surface freezing-thawing index ranges were 673~2 135℃·d,1 028~4 177 ℃·d,682~1 702 ℃·d,1 956~5 278 ℃·d, respectively; freezing index exhibited decreasing trend and the slopes of air freezing index (1951—2007) and surface freezing index (1954—2005) were -56.0 ℃·d /10a and -35.4 ℃·d /10a; thawing index increased and the liner tendency of air thawing index was 47.8 ℃·d/10a during 1951—2008; surface thawing index decreased during 1954—1975 with a rate of -135.9 ℃·d /10a and increased during 1976—2006 with a rate of 185.3 ℃·d /10a. Freezing index was influenced by both elevation and latitude while thawing index was mainly controlled by elevation in the Heihe River Basin. We also found that there was a strong liner relationship between mean annual air temperature and freezing-thawing index.
黑河流域年冻融指数及其时空变化特征分析
DOI:10.11867/j.issn.1001-8166.2015.03.0357
[本文引用: 2]
利用黑河流域气象站点的逐日平均温度数据计算空气及地表冻融指数,并分析其变化趋势以及空间分布。结果表明,黑河流域空气冻结指数、空气融化指数、地表冻结指数和地表融化指数变化范围依次为:673~2 135 ℃·d,1 028~4 177 ℃·d, 682~1 702 ℃·d,1 956~5 278 ℃·d;黑河流域冻结指数出现明显的下降趋势,其中空气冻结指数(1951—2007年)下降速率为56.0℃·d/10a,地表冻结指数(1954—2005年)下降速率为35.4 ℃·d/10a;融化指数表现为上升,其中空气融化指数(1951—2008年)整体以每年47.8 ℃·d/10a的速率上升,地表融化指数在1954—1975年以135.9 ℃·d/10a的速率下降,在1976—2006年以185.3 ℃·d/10a的速率上升;黑河流域各站点冻结指数受海拔及纬度双重影响,而融化指数则主要受海拔影响;年平均气温与冻融指数有非常强的线性关系。
Some characteristics of the climate in Northern Alaska, USA
DOI:10.2307/1551862 URL [本文引用: 2]
Northern hemisphere freezing/thawing index variations over the twentieth century
DOI:10.1002/(ISSN)1097-0088 URL [本文引用: 2]
Thawing index and freezing index on the embankment surface in permafrost regions
冻土路基表面的融化指数与冻结指数
A prediction for temperature and thawing-freezing index of roadbed along the Qinghai-Tibet railway
青藏铁路路基表面温度及融冻指数预测
Variation trends of the freezing and thawing index along the Qinghai-Xizang Railway for the period 1966-2004
青藏铁路沿线1966—2004年冻结与融化指数的变化趋势
Difference between near-surface air, land surface and ground surface temperatures and their influences on the frozen ground on the Qinghai-Tibet Plateau
DOI:10.1016/j.geoderma.2017.09.037 URL [本文引用: 2]
Review on the interaction models between climatic system and frozen soil
冻土—气候关系模型评述
The relationship between air temperature and ground temperature in the Tibetan Plateau
青藏高原地气温度之间的关系
Predicting changes of active layer thickness on the Qinghai-Tibet Plateau as climate warming
气候变化情景下青藏高原多年冻土活动层厚度变化预测
Responses of active layer thickness on the Qinghai-Tibet Plateau to climate change
青藏高原多年冻土活动层厚度对气候变化的响应
Permafrost monitoring and detection of climate change
DOI:10.1002/(ISSN)1099-1530 URL [本文引用: 1]
Simulated distribution of active layer depths in the frozen ground regions of Tibetan Plateau
青藏高原冻土区活动层厚度分布模拟
Spatial and temporal variability in active layer thickness over the Russian Arctic drainage basin
The extraction of watershed characteristics of the source area of Yellow River based on SRTM DEM with ArcGIS
An analysis of geomorphologic characteristics of the Yellow River source region based on ASTER-GDEM
基于ASTER-GDEM数据的黄河源地区构造地貌分析
Dynamic variations of landscape pattern and the landscape ecological functions in the source area of the Yellow River
黄河源区景观格局与生态功能的动态变化
Changes in frozen ground in the source area of the Yellow River on the Qinghai-Tibet Plateau, China, and their eco-environmental impacts
Mapping frozen soil distribution and modeling permafrost stability in the source area of the Yellow River
DOI:10.13249/j.cnki.sgs.2016.04.013
[本文引用: 1]
The source area of the Yellow River (SAYR) is located in the eastern-to-medium part of the Qinghai-Tibet Plateau. Permafrost in the SAYR experienced remarkable degradation in the past. Taking distribution patterns of frozen soil and permafrost stability as research object, the characteristics of permafrost development and distribution patterns at various terrains and land covers were analyzed based on a large amount of field investigations and the measurements. In addition, thermal features of permafrost were analyzed based on the measured ground temperatures at various depths. The effects of the geological and geographic factors on permafrost distribution and thermal stability were discussed. It was indicated that: 1) Permafrost was occasionally developed in the various fluvial and proluvial plains with elevation generally lower than 4 300 m; 2) Permafrost was widely distributed in the mountains higher than 4 350 m except for the sunny slope terrain, where local terrain played an important role in permafrost development and distribution; 3) The combinations of local terrain, surficial vegetation, soil wetness and moisture conditions all contributed to the formation and distribution of permafrost in the low hills and mountains where elevation ranged in 4 300-4 350 m.Taking the annual mean ground temperature (MAGT) as the basis, an experiential-statistical MAGT-based model was constructed, of which latitude, longitude and elevation were set up as independent variables. Together with DEM data, permafrost MAGTs were primarily modeled using the statistically regression model. And then, the modeled results in the south-facing areas were slightly adjusted, and a secondly model was constructed to model permafrost distribution in the shady areas. Thirdly, the combined modeling results were locally adjusted using the measurements. The frozen soil map in the SAYR was thus compiled. Taking 0oC as the boundary between permafrost and seasonally frozen soil, it was indicated that permafrost was distributed in an area of 2.5×10⁴km2, which occupied approximately 85.1% in the SAYR, and that seasonally frozen soil was distributed in an area of 0.3×10⁴km2 with an areal percentage of 9.7%. Permafrost was further divided into seven stability taking 0.5oC or 1.0oC of MAGTs as intervals.They were the first zone with permafrost MAGT smaller than -4.0oC, the second zone with permafrost MAGT varying between -4.0oC and -3.0oC, the third zone with permafrost MAGT varying between -3.0oC and -2.0oC, the fourth zone with permafrost MAGT varying between -2.0oC and -1.0oC, the fifth zone with permafrost MAGT varying between -1.0oC and -0.5oC, the sixth zone with permafrost MAGT varying between -0.5oC and 0oC, and the seventh zone with permafrost MAGT higher than 0oC.
黄河源区冻土分布制图及其热稳定性特征模拟
DOI:10.13249/j.cnki.sgs.2016.04.013
[本文引用: 1]
以黄河源区多年冻土分布现状和热力特征为研究目标,通过野外调查及实测数据,分析了黄河源区不同地形地貌、不同地表覆盖条件下的冻土形成、分布特征和以地温为基础的热学特征,探讨了不同尺度因素对多年冻土分布的影响。结果表明,在高程低于4 300 m的平原区,多年冻土多不发育;在高于4 350 m的山区,局地地形对多年冻土的形成与分布作用显著。除阳坡地形外,多年冻土均比较发育;介于4 300~4 350 m的低山丘陵和平原区,局地地形、地表植被、土壤湿度等因素共同决定着多年冻土的形成和分布格局。以年均地温指标为基础,构建了以纬度、经度和高程为自变量的回归模型,并对阳坡地形进行微调和校正。结果表明,以0oC作为划分季节冻土和多年冻土的标准和界限,多年冻土面积2.5×10<sup>4</sup>km<sup>2</sup>,约占整个源区面积的85.1%;季节冻土面积0.3×10<sup>4</sup>km<sup>2</sup>,约占整个源区面积的9.7%。进一步以0.5oC或1.0oC为分类间隔绘制了黄河源区多年冻土热稳定性空间分布图。
Numerical simulation of spatial distribution and change of permafrost in the source area of the Yellow River
DOI:10.11821/dlxb201709007
[本文引用: 1]
The numerical simulation method was used to predict the future possible changes that happened on permafrost by setting up the prediction results of the climate model from the IPCC Fifth Assessment Report as a possible climatic condition. The source area of the Yellow River with complicated permafrost conditions was chosen as the study area. The past and future permafrost distribution were predicted, and the future possible changing trends in permafrost in this area were calculated. The obtained results were, (1) during the past 30 years of 1972-2012, a small part of permafrost was degraded, which covered an area of about 833 km2. In this period, the seasonal frozen soil type was mainly distributed in the of Requ river valley, Xiaoyemaling, and Tangchama, as well as the southern part of the two lake basins. (2) Under different climatic scenarios of RCP 2.6, RCP 6.0 and RCP 8.5, little difference would happen on permafrost degradation until 2050. In details, the possible degradation area of permafrost would be 2224 km2, 2347 km2, and 2559 km2 under the scenarios of RCP 2.6, RCP 6.0, and RCP 8.5, respectively, accounting for 7.5%, 7.9%, 8.6% of the total study area. The seasonal frozen soil type would be sporadically distributed in the river valleys of Lena Qu, Duo Qu, Baima Qu, but widely distributed around Yeniugou, Yeniutan and four Madio lakes located in the Yellow River valley in the eastern part of Ngoring Lake. (3) In 2100, the predicted permafrost degradation area would be 5636 km2, 9769 km2 and 15548 km2, respectively, and they would account for 19%, 32.9% and 52.3% of the source area. The permafrost degradation mainly occurred in the areas of Xingsuhai, Gamaletan, Duogerong, of which low-temperature permafrost would be degraded into a high-temperature permafrost type. And the mean annual ground temperature of permafrost would rise differentially. (4) Under the scenario of RCP 2.6, all permafrost with current mean annual ground temperature higher than -0.15oC would be degraded into seasonal frozen soil type, and the permafrost with the mean annual ground temperature ranging from -0.15 oC to -0.44oC would be partly degraded into seasonal frozen soil type. Under the scenarios of RCP 6.0 and RCP 8.5, permafrost with the current mean annual ground temperature higher than -0.21 oC and -0.38 oC would be totally degraded, the permafrost with the mean annual ground temperature ranging from -0.21 to -0.69 oC and from -0.38 oC to -0.88 oC would be partly degraded.
黄河源区多年冻土空间分布变化特征数值模拟
DOI:10.11821/dlxb201709007
[本文引用: 1]
基于IPCC第五次评估报告预估的气温变化情景,采用数值模拟的方法对黄河源区典型冻土类型开展模拟,推算过去及预测未来黄河源区冻土分布空间变化过程和发展趋势。结果表明:1972-2012年源区多年冻土只有少部分发生退化,退化的冻土面积为833 km<sup>2</sup>,季节冻土主要集中在源区东南部的热曲谷地、小野马岭以及两湖流域南部的汤岔玛地带;RCP 2.6、RCP 6.0、RCP 8.5情景下,2050年多年冻土退化为季节冻土的面积差别不大,分别为2224 km<sup>2</sup>、2347 km<sup>2</sup>、2559 km<sup>2</sup>,占源区面积的7.5%、7.9%、8.6%;勒那曲、多曲、白马曲零星出现季节冻土,野牛沟、野马滩以及鄂陵湖东部的玛多四湖所在黄河低谷大片为季节冻土;2100年多年冻土退化为季节冻土的面积分别为5636 km<sup>2</sup>、9769 km<sup>2</sup>、15548 km<sup>2</sup>,占源区面积的19%、32.9%、52.3%;星宿海、尕玛勒滩、多格茸的多年冻土发生退化,低温冻土变为高温冻土,各类年平均地温出现了不同程度的升高。到2100年,RCP 2.6情景下源区多年冻土全部退化为季节冻土主要发生在目前年平均地温高于-0.15 oC的区域,而-0.15~-0.44 oC的区域部分发生退化;RCP 6.0、RCP 8.5情景下目前年平均地温分别为高于-0.21 oC以及-0.38o C的区域多年冻土全部发生退化,而-0.21~-0.69 oC以及-0.38~-0.88 oC的区域部分发生退化。
Elevation-dependent thermal regime and dynamics of frozen ground in the Bayan Har Mountains, northeastern Qinghai-Tibet Plateau, southwest China
DOI:10.1002/ppp.v29.4 URL [本文引用: 3]
Degradation of permafrost and cold-environments on the interior and eastern Qinghai Plateau
青海高原中、东部多年冻土及寒区环境退化
Response to climate change and prediction of runoff in the source region of Yellow River
DOI:10.11821/xb201109011
[本文引用: 1]
The hydrological and meteorological data of the source region of Yellow River from 1956 to 2010 and future climate scenarios from regional climate model (PRECIS) during 2010-2020 are used to analyze the flow variations and revealing the climate causes, and to predict the variation trend for future flows. Some conclusions can be drawn as follows. 1) Annual mean flow shows a decreasing trend in recent 50 years in the source region of Yellow River, and there are periods of 5a, 8a, 15a, 22a and 42a. 2) The precipitation decrease due to the weakened South China Sea summer monsoon as well as the increasing evaporation and the degenerating frozen soil in global warming are the climate origin of decreasing flow. 3) Based on the regional climate model PRECIS prediction, the flows in the source region of Yellow River are likely to decrease in the next 20 years.
黄河源区径流对气候变化的响应及未来趋势预测
Characteristics of land surface heat and water exchange under different soil freeze/thaw conditions over the central Tibetan Plateau
DOI:10.1002/hyp.v25.16 URL [本文引用: 1]
Diurnal freeze/thaw cycles of the ground surface on the Tibetan Plateau
青藏高原表层土壤的日冻融循环
Problems on zonation of high-altitude permafrost
DOI:10.11821/xb198402006
[本文引用: 1]
There is an obvious three-dimensional zonation in the distribution of high-altitude per-mafrost, namely, vertical, latitudinal and aridity (or longitudinal) zonation.
我国高海拔多年冻土地带性规律之探讨
DOI:10.11821/xb198402006
[本文引用: 1]
多年冻土南界以南一定的海拔高度以上出现的多年冻土称为高海拔多年冻土,而南界以北的多年冻土则叫作高纬度多年冻土。
Dual influences of local environmental variables on ground temperatures on the interior-eastern Qinghai-Tibet Plateau (Ⅰ): Vegetation and snow cover
青藏高原中、东部局地因素对地温的双重影响(Ⅰ): 植被和雪盖
The variability of soil thermal and hydrological dynamics with vegetation cover in a permafrost region
Progress in quantitative inversion of vegetation ecological remote sensing parameters
植被生态遥感参数定量反演研究方法进展
Spatial and temporal variation characteristics on the onset dates of freezing and thawing of active layer and its influence factors in permafrost regions along the Qinghai-Tibet Highway
青藏公路沿线多年冻土区活动层起始冻融时间的时空变化特征和影响因素
Characteristics of ground surface temperature at Chalaping in the source area of the Yellow River, northeastern Tibetan Plateau
Spatial and temporal characteristics of the site-specific N-factor over the Qinghai-Tibet Plateau
Effects of local factors and climate on permafrost conditions and distribution in Beiluhe basin, Qinghai-Tibet Plateau, China
Surface climatology of the Greenland ice sheet: Greenland Climate Network 1995-1999
DOI:10.1029/2001JD900161 URL [本文引用: 1]
Spatiotemporal variations of soil freeze-thaw state in Northeast China based on the ERA5-LAND dataset
DOI:10.11821/dlxb202111012
[本文引用: 1]
The soil freeze-thaw cycle plays an important role in land surface processes. Repeated freeze-thaw cycles can have profound effects on land-atmosphere energy exchange, surface runoff, plant growth, ecosystems and soil carbon & nitrogen cycles. Using spatial analysis functions of geographical information system and python programming language, this paper analyzed the spatial distributions and temporal variations of soil freeze-thaw state in Northeast China based on the ERA5-LAND hourly soil temperature dataset for the period 1981-2019. The results suggest that the start dates of the four soil freeze-thaw periods for the near-surface layer are mainly determined by latitude and topography. The start dates of freeze-thaw transition period in spring (SFTTP) and complete thawing period (CTP) show a southeast-northwest gradient with later starts in the northwest part, while the start dates of freeze-thaw transition period in autumn (AFTTP) and complete freezing period (CFP) exhibit a latitudinal pattern with earlier starts in the north. For most parts of the study area, the average annual number of days for SFTTP is less than 30, with higher values in the south and west compared to the north and east. The number of days for AFTTP, however, is below 10 per year for most parts of the region, with just a slight difference in the study area. The CTP is the longest compared to the other three periods, varying from 150 days in the northwest to 240 days in the southeast. The CFP, which comes next, ranges from 90 to 180 days per year, presenting a dustpan-shaped spatial pattern with higher values in the north and lower values in the south. Trend analysis shows that with the advance of start date for SFTTP and the delay of start date for AFTTP, the number of days for CTP has increased with a rate of 0.2 d/a. The number of days for SFTTP in the Liaohe Plain, the western part of the Da Hinggan Mountains and the northern part of Hulun Buir Plateau shows a decreasing trend, while in other regions an increasing trend is observed. In the western part of the Da Hinggan Mountains and the northern part of the Hulun Buir Plateau, the CTP starts earlier. The start date of AFTTP is significantly delayed in the Songnen Plain and Changbai Mountains, and the trend for the number of days varies substantially with an increase in the north and a decrease in the south. The start date for CFP occurs later in the vast area of the Northeast China Plain and occurs earlier in the Da Hinggan Mountains, Xiao Hinggan Mountains, Changbai Mountains, Eastern Liaoning Peninsula and Western Liaoning Hills. The number of days for CFP shows a declining trend throughout the study area, especially in the seasonally frozen area located in the central part with an annual decreasing rate of more than 0.2 d/a.
基于ERA5-LAND的中国东北地区近地表土壤冻融状态时空变化特征
DOI:10.11821/dlxb202111012
[本文引用: 1]
土壤冻融交替是陆地表层极其重要的物理过程,土壤冻融状态的频繁变化对地气能量交换、地表径流、植被生长、生态系统及土壤碳氮循环等均具有重要的影响。本文基于1981—2019年ERA5-LAND逐小时土壤温度数据,借助GIS空间分析功能,利用Python编程处理分析了中国东北地区近地表土壤冻融状态的时空变化特征。结果表明:从不同冻融状态起始日期的空间分布来看,近地表不同阶段的起始日期主要受纬度和地形的影响,具有明显的纬度地带性和垂直地带性。春季冻融过渡期和完全融化期的起始日期由东南向西北均呈逐渐推迟趋势,而秋季冻融过渡期与完全冻结期起始日期则由东南向西北随纬度升高越来越早。就不同冻融状态发生天数的空间分布而言,研究区南部春季冻融过渡期发生天数多于北部,西部多于东部,年均发生天数均在30 d以内;秋季发生冻融的天数空间差异不大,研究区一半以上的地区年均发生天数在10 d以内。完全融化期发生天数最多,从东南向西北呈逐渐减少趋势,年均发生天数主要介于150~240 d之间;完全冻结期发生天数则由南向北日益增多,其空间分布表现为一向南开口的簸箕形,各地年均发生天数集中于90~180 d之间。从时间变化趋势来看,近年来春季冻融过渡期起始日期以提前趋势为主,而秋季冻融过渡期起始日期总体表现为延后,致使完全融化期发生天数以增加趋势为主,年均变化速度高达0.2 d/a;大兴安岭以西、呼伦贝尔高原以北地区及辽河平原春季冻融过渡期发生天数呈减少趋势,其他地区为增加趋势;大兴安岭以西地区、呼伦贝尔高原以北地区完全融化期起始日期明显提前;松嫩平原和长白山区秋季冻融过渡期起始日期推迟显著,发生天数的变化趋势呈北增南减的空间分异特征;不同地区完全冻结期起始日期的变化趋势差异显著,中部广大的平原区呈不显著的推迟趋势,而大、小兴安岭、长白山、辽东半岛和辽西丘陵则提前进入完全冻结状态;研究区完全冻结期发生天数呈减少趋势,研究区中部的季节冻土区完全冻结期明显变短,年均减少速度大于0.2 d/a。
Spatial-temporal changes of the near-surface soil freeze-thaw status over the Qinghai-Tibetan Plateau
DOI:10.7522/j.issn.1000-0534.2017.00043
[本文引用: 1]
Based on the surface soil daily minimum temperature and air temperature datas from 87 meteorological stations over the Qinghai-Tibetan Plateau (QTP), the trends of the near-surface freeze-thaw status and its correlation with air temperature, altitude and latitude was analyzed by using the linear regression method and correlation method.Using Mann-Kendall method to test the abrupt change and discuss the spatial variation characteristics of the near-surface soil freeze-thaw status over QTP.The results show that the near-surface soil freeze-thaw status changed significantly on QTP in recent 36 years.The first date of the near-surface freeze was delayed by about 26 days, or at a rate of 0.72 d·a<sup>-1</sup>, and the late date of the near-surface freeze was advanced by about 14 days, or at a rate of 0.40 d·a<sup>-1</sup>.The number of duration days and freeze days of the near-surface freeze decreased about 41 and 33 days respectively, and the rate of change was 1.13 d·a<sup>-1</sup> and 0.93 d·a<sup>-1</sup>, respectively.The trend of the near-surface soil freeze-thaw status was same overall QTP, while in some areas was slight differences.The central and eastern region of QTP, the first date of the near-surface freeze was earlier and the last date was later than other regions.However, there was a contrary variation in the southeast region.It may be the lower elevation of the stations and it had the higher air temperature all years.For the change rate of the near-surface soil freeze-thaw status, the eastern part of QTP changed the fastest, the western was moderate and the stations that changed slower scattered in central and southern regions.The temperature had a significant effect on the near-surface soil freeze-thaw status, but air temperature had a certain lag effect on soil freeze-thaw cycle.And the near-surface soil freeze-thaw status was great significantly correlated with altitude.With decreasing elevation, the first days of the near-surface soil freeze was delayed and the late days was advanced, and the numbers of duration days and freeze days of the near-surface soil freeze were significantly decreased.
青藏高原近地表土壤冻融状况的时空变化特征
DOI:10.7522/j.issn.1000-0534.2017.00043
[本文引用: 1]
利用青藏高原(下称高原)87个气象台站的日最低地表温度和气温资料,通过线性回归和相关分析法,分析高原1980-2015年近地表土壤冻融状况变化趋势及其与气温、海拔和纬度的相关性。利用Mann-Kendall检验对其进行突变分析,并探讨其空间变化特征。结果表明:近36年,高原近地表土壤冻融状况发生显著变化。冻结起始时间推迟约26天,其变化速率为0.72 d·a<sup>-1</sup>,冻结结束时间提前约14天,速率为0.40 d·a<sup>-1</sup>;冻结持续时间和冻结天数分别缩短约41天和33天,其变化速率分别为1.13 d·a<sup>-1</sup>和0.93 d·a<sup>-1</sup>。高原冻融状况变化整体表现一致,局部地区略有差异。高原中东部地区冻结起始时间较早,结束时间较晚;而在东南部地区则存在相反的变化特征,这是由于该地区海拔较低,且全年土壤温度较高导致。就冻融状况变化速率而言,东部地区变化最快,西部适中,变化较慢的站点零星分布在中部和南部地区。气温对近地表土壤冻融状况有重要影响,但气温对土壤冻融循环存在一定的滞后作用。此外,高原近地表土壤冻融状况与海拔呈极显著相关,随海拔的降低,冻结起始推迟,冻结结束时间提前,冻结持续时间和冻结天数显著减少。
Improved estimates of incident radiation and heat load using non-parametric regression against topographic variables
DOI:10.1111/j.1654-1103.2007.tb02590.x URL [本文引用: 1]
Studies on geographic distribution of the altitudinal lapse rate of temperature in China
Application of the equivalent-elevation approach to alpine permafrost distribution models in the upper reaches of the Shule River, Qilian Mountains
等效高程方法在祁连山区高山/高海拔多年冻土分布模型中的应用
