

1 引言
监测冻融循环的前提是获得土壤的冻融状态。传统的冻融状态判别方法主要依赖于研究区内监测站点获取的数据,然而,在青藏高原地区实地测量成本高、难度大,难以实现大范围的土壤冻融状态获取[9]。遥感技术的快速发展为实现大范围、长时间序列的土壤冻融循环监测提供了有力的技术支持[10]。遥感手段对土壤冻融状态的监测主要通过热红外、被动微波和主动微波传感器实现。热红外遥感通过长时序的地表温度(Land Surface Temperature, LST)实现冻土状态监测[11]与冻土类型判别[12],但易受到天气的影响,限制连续冻融状态监测的开展[13];被动微波辐射计通过观测到的地表辐射亮温进行土壤状态判别,具有更好的可解释性和精度,但产品的空间分辨率较低,多为几公里至数十公里[14⇓-16];主动微波遥感通过微波散射计[17]和合成孔径雷达[18-19]获取土壤冻融状态,然而微波与地表作用过程复杂、影响因素众多,导致冻融状态模型建立存在挑战。总之,不同传感器各有其优势和不足。
近年来,高空间分辨率的近地表土壤状态监测产品和方法得到广泛的关注。针对被动微波辐射计较为粗糙的空间分辨率,Hu等[20]利用热红外遥感数据将AMSR数据获得的冻融产品空间分辨率降尺度至5 km,为微波辐射计冻融产品的降尺度提供了可行的方案;Zhao等[21]将ASMR数据与热红外遥感产品融合以获取青藏高原高分辨率冻融产品,并证明了热红外遥感数据与微波遥感数据在近地表土壤冻融状态判断中的互补性;Gao等[22]利用不同分辨率影像在频率域上的相似性,基于频谱分析的方法对AMSR系列冻融状态产品进行降尺度研究,将中国东北地区冻融产品分辨率提升至1 km,为后续其他区域冻融状态降尺度研究提供新的思路。针对更高分辨率的合成孔径雷达数据,Zhou等[23]利用C波段Sentinel-1A卫星,获取了青藏高原工程走廊区域的近地表土壤的冻融状态并将冻融状态的空间分辨率提升至10 m;但受限于传感器的重访周期,只能获取冻融状态变化时间点范围[18]。因此,开展大范围近地表土壤冻融状态的监测,需要在满足时间分辨率的同时尽可能提高空间分辨率。
随着海量数据的积累,融合多源遥感数据能够综合不同数据在时间和空间分辨率上的优势,为土壤冻融状态监测提供了新思路。Hu等[14]利用AMSR-E和AMSR-2两款微波辐射计获取地表冻融状态,实现了2002—2018年全球的土壤冻融产品生产,拓宽了近地表冻融产品的时间范围,但产品中青藏高原精度明显低于高纬度区域。此外,Hu等[20]通过线性回归模型融合AMSR-2获得的冻融判别产品与MODIS地表温度产品,生成了2013—2014年5 km空间分辨率的中国冻融状态图,但未考虑每个昼夜间冻融状态的变化。相比于高纬度冻土区,青藏高原的昼夜温差更大,昼夜冻融变化更加频繁[20],因此在融合多源遥感数据时,需要考虑温度变化对观测值的影响[24],这对青藏高原区域近地表土壤冻融状态研究提出了更高的要求。
尽管目前已经开展了大量青藏高原近地表土壤冻融监测与冻融循环的研究,结合昼夜冻融状态变化的近地表土壤日冻融循环模式的研究仍存在空缺,尤其是利用遥感数据对大范围日冻融循环的监测。当前研究使用夜间过境的瞬时遥感数据作为土壤是否发生冻融的判别标准,缺少对近地表土壤状态昼夜变化的描述,无法准确获取一天之内土壤冻融状态的动态变化。因此,本文基于昼夜MODIS、AMSR-E、AMSR-2遥感数据等资料,获取AMSR系列传感器在青藏高原的昼夜校准系数,利用Fourier非线性模型实现青藏高原区域内AMSR传感器产品与MODIS地表温度产品的融合,生成2002—2020年每日1 km分辨率近地表土壤日冻融状态结果,并进一步探索青藏高原近地表土壤日冻融循环的时空变化模式。
2 研究区与数据
2.1 研究区概况
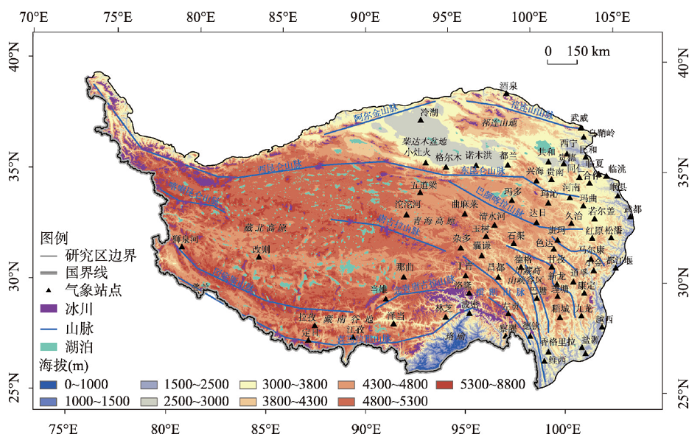
青藏高原(Qinghai-Tibet Plateau, QTP)是亚洲内陆高原,也是世界海拔最高、中国最大的高原,地理位置介于25°N~40°N、68°E~105°E之间,南起喜马拉雅山脉南缘,北至昆仑山、阿尔金山脉和祁连山北缘,西部为帕米尔高原和喀喇昆仑山脉,东及东北部与秦岭山脉西段和黄土高原相接,是全球最大的中低纬度多年冻土区[25]。高原与周围区域海拔差异巨大,而其内部又较为平缓,总体地势为西北高东南低,自西北向东南倾斜,地形上可分为藏北高原、青海高原、藏南谷地、柴达木盆地、祁连山地和川藏高山峡谷区等6个部分,平均海拔超过4000 m。本文针对中国境内的青藏高原区域开展研究,如图1所示。
图 1
2.2 遥感数据
本文使用的MODIS产品[26]为MYD11A1。该产品提供当地时间凌晨1:30和13:30的地表温度反演数据(LST),空间分辨率为1 km。通过原始产品与官方提供的尺度系数(0.02)结合,去除无效值,即可获得对应开氏温度。
本文使用AMSR-E和AMSR-2两代微波辐射计的亮度温度(Brightness Temperature, Tb)产品[15,27](
2.3 气象数据
本文使用的参考数据为中国基本气象站点实测0 cm地温数据。0 cm地温数据来自国家气象科学数据中心(
3 研究方法
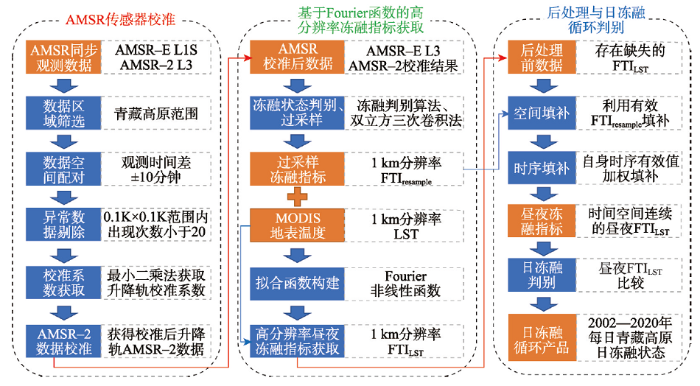
本文结合MODIS、AMSR-E、AMSR-2遥感数据等资料,首先获取AMSR系列传感器在青藏高原区域的校准系数并对AMSR-2数据进行校准。其次,使用由AMSR传感器得到的冻融指标(Freeze Thaw Index, FTI)与MODIS LST构造Fourier非线性融合模型,并使用LST与融合模型获得1 km冻融指标。最后,由经过后处理的1 km分辨率冻融指标获得2002—2020年每天的日冻融状态并进行时空变化分析。主要流程如图2所示。
图2
3.1 AMSR传感器相互校准
AMSR系列传感器校准以AMSR-E为基准,通过2013—2015年青藏高原区域内的AMSR-E L1S有效数据与AMSR-2 L3产品进行拟合,分别获得适用于青藏高原区域的升轨与降轨校准系数,将获得的校准系数应用于所有年份的AMSR-2 L3产品从而获得AMSR-2校准后产品。具体流程包括:① 青藏高原区域2013—2015年AMSR-E L1S,AMSR-2 L3数据获取;② AMSR-E L1S与AMSR-2 L3数据时间空间配对,对并发观测值进行筛选(观测时间差±10 min);③ 异常值剔除,统计
式中:
3.2 基于Fourier函数的高分辨率冻融指数获取
受到AMSR传感器参数的限制,由AMSR直接获得的FTI存在细节缺失的问题。本文使用更高分辨率的MODIS LST产品对FTI进行降尺度优化,以补充冻融状态的细节信息。另外,由于自身天线角度限制AMSR系列传感器在青藏高原获取的FTI存在扇形系统性缺失,本文基于MODIS LST产品与FTI数据的互补性[21]对近地表土壤FTI进行降尺度研究并对缺失的FTI进行补充,以保证最终判断的冻融状态在时间、空间上的连续性。
本文1 km分辨率冻融指标获取主要为3个流程,分别为低分辨率冻融指标获取,基于Fourier函数的FTI与LST融合模型构建,基于融合模型的1 km分辨率冻融指标获取。
(1)低分辨率冻融指标获取
式中:
(2)基于Fourier函数的FTI与LST融合模型构建
考虑到FTI的周期变化存在三角函数特性,本文针对线性融合模型[21]进行改进,利用Fourier函数对每个像元位置每一年获得的冻融指标FTI与MODIS LST产品进行模型构建,其回归模型构造如下:
式中:
(3)基于融合模型的1 km分辨率冻融指标获取
将构建完成的融合模型应用于1 km分辨率的LST中,可获得具有细节信息的分辨率为1 km的冻融指标(FTILST),其回归模型如下:
式中:
3.3 后处理与日冻融循环判别
针对FTILST中存在的数据缺失现象,本文依据产生原因进行后处理填充。LST容易受到云雾遮挡从而产生数据缺失的问题,该缺失情况导致无法由LST产品经过回归模型得到FTILST值。为解决该问题,本文利用过采样后的FTIresample,对FTILST中缺失数据进行填补。此外,LST受到云雾遮挡的时空位置与AMSR传感器系统缺失时空位置相互重叠,导致无法使用FTIresample对FTILST进行填充,本文进一步使用FTILST时序上最邻近的有效值进行加权线性插值对缺失数据进行填补。
获得时空连续性完整的FTILST产品后,依据昼夜FTILST值对每日的日冻融状态进行判断,最终获得日冻融循环产品。日冻融循环状态判断过程如公式(5)所示:
3.4 日冻融精度评估方法
对日冻融循环产品的精度评价,以气象站实测值判断的日冻融情况为参考,统计2002—2020年日冻融循环产品判断正确天数与错误天数,其中将气象站2:00实测值作为夜间最低地表温度,14:00实测值作为白天最高地表温度。精度评价分为单一站点精度评价与产品整体精度评价,其中产品整体精度评价是所有单一站点精度评价汇总。精度评价公式如下:
式中:
4 结果与讨论
4.1 AMSR系列微波辐射计校准效果分析
表1 AMSR-2校准至AMSR-E校准系数表
Tab. 1
| 轨道 | 通道 | 斜率 | 截距 | R2 | 轨道 | 通道 | 斜率 | 截距 | R2 |
|---|---|---|---|---|---|---|---|---|---|
| 升轨 | 18H | 1.0303 | -1.9121 | 0.9251 | 降轨 | 18H | 1.0421 | -14.6959 | 0.9149 |
| 18V | 1.0234 | -2.6260 | 0.9088 | 18V | 1.0052 | 1.3326 | 0.9048 | ||
| 36H | 1.0389 | -15.6300 | 0.9368 | 36H | 1.0252 | -2.0683 | 0.9181 | ||
| 36V | 1.0323 | -1.1584 | 0.9130 | 36V | 1.0121 | 7.9381 | 0.8981 |
表2 青藏高原范围内不同校准函数决定系数表
Tab. 2
由表2可知,本文的AMSR系列传感器校准相较于其他方法,能获得更高的拟合精度,可为青藏高原区域长时间近地表土壤观测提供更准确的结果。全球观测值或高纬度地区观测值得到的校准系数应用于中低纬度的青藏高原地区的AMSR系列传感器校准存在一定程度的偏差。
4.2 日冻融产品精度分析
对本文方法获取的空间分辨率为1 km、时间分辨率为1 d的青藏高原昼夜近地表土壤冻融情况产品(FTILST)及由FTILST获取的日冻融循环产品,从FTILST、FTI的日冻融循环产品对比,FTILST、LST与地表实测数据对比,FTIresample与LST的融合模型准确性3个方面进行评价。
(1)FTILST、FTI的日冻融循环产品对比分析
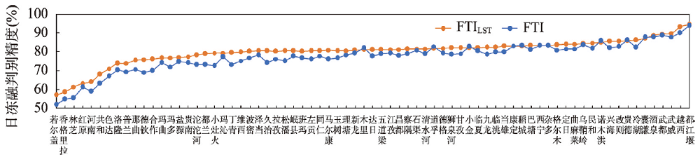
本文利用气象站实测0 cm地面温度,以0 ℃作为判断近地表土壤冻融的阈值,获得真实的近地表土壤日冻融循环判断的参考结果,分别对由FTILST、FTI获得的日冻融循环产品进行精度评价。73个气象站日冻融循环产品昼夜冻融判别精度如图3所示,橙色代表融合后FTILST获取的日冻融循环产品在各个站点的精度,蓝色代表未融合的FTI获取的日冻融产品在各个站点的精度。FTILST日冻融循环产品平均精度达到80.96%。其中46个站点日冻融判别精度F高于80%。相较由未融合FTI获得的日冻融循环产品,FTILST日冻融产品在分辨率从10 km提升到1 km的同时整体精度提升了3.95%。
图3
(2)FTILST、LST与地表实测数据对比
选取具有日冻融循环代表性的乌鞘岭气象站(37.12°N、102.52°E),对2018—2019年融合后冻融指标(FTILST)、MODIS获取的地表温度(LST)、气象站实测0 cm地表温度(GST)和实测近地层气温(TEM)进行比较,同时获取每日昼夜GST、FTILST、LST对冻结状态的判别结果进行判别对比(图4)。
图4
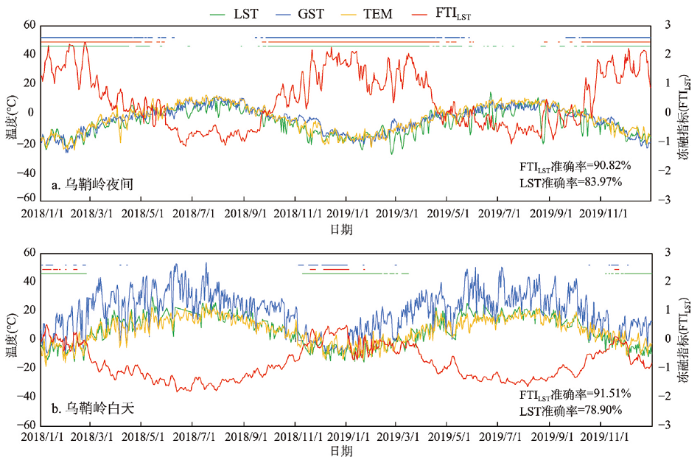
图4
GST、TEM、LST、FTILST差异及冻融判别对比
Fig. 4
GST, TEM, LST, and FTILST differences and freeze-thaw judgment comparison
其中图4a、4b分别是夜间与白天的观测与实测数据。折线表示每天的测量与观测值,其中蓝色、黄色、绿色、红色分别代表GST、TEM、LST、FTILST。上方的粗实线表示基于遥感观测值与地表测量值判断的近地表土壤发生冻结的时间分布,其中蓝色、红色、绿色分别为GST、FTILST、LST的判断为冻结所处时间点。对比图4夜间与白天可知,夜间LST、GST和TEM较为相近,白天GST与其他两者的差异较大,且LST更接近于TEM。FTI与FTILST、GST、TEM 3个温度观测值有相反的变化趋势。通过对比FTILST与LST的昼夜冻融情况判别,昼夜FTILST 的冻融判别精度都高于LST,白天两者的精度差异明显,FTILST 的冻融判别结果更接近于GST实测的冻融判别结果,能够更好地判断昼夜近地表土壤冻融状态。
(3)FTIresample与LST的融合模型准确性评价
融合模型拟合过程的准确性对最终产品的精度存在影响。为进一步判断FTIresample与LST拟合过程的准确性,本文选取狮泉河(32.30°N、80.05°E,2008年)和武都(33.24°N、104.55°E,2018年)两个气象站的全年数据,并对两个站点夜间与白天的拟合结果进行分析(图5)。整体上,夜间的FTIresample对应的LST有效数据多于白天。夜间的拟合效果要较优于白天,其中狮泉河夜间拟合决定系数为0.9179,武都为0.927。此外,两个站点在对应的年份内LST与FTIresample拟合后的昼夜决定系数均达到0.89以上,拟合效果有较好。
图5
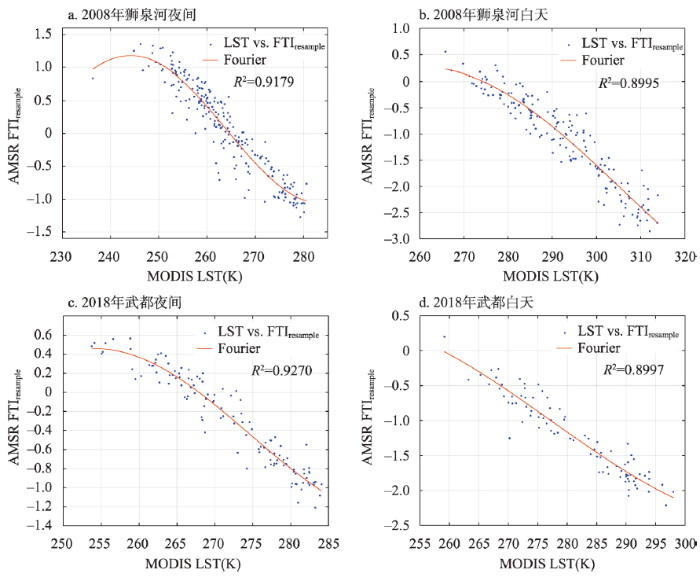
图5
FTIresample与LST比较及拟合评价
Fig. 5
FTIresample and LST comparison and fitting evaluation
4.3 青藏高原年内日冻融循环发生天数空间差异及周期性特征分析
本文分析2002—2020年的日冻融循环结果,获取青藏高原年均日冻融天数分布。近地表日冻融循环出现在季节性冻结—融化(F-T)过程以及季节性融化—冻结(T-F)过程,如图6所示。图6a展示了近地表土壤F-T过程中发生的日冻融循环的天数分布,分析可知青藏高原中西部F-T过程日冻融发生天数明显多于东部。在F-T过程中,藏南区域日冻融发生天数最多,集中在藏南高山区域;青海高原、藏北高原、柴达木盆地多地年均日冻融发生天数超过105 d;青藏高原东部及川藏高山峡谷区年均日冻融发生天数基本低于35 d;珞瑜地区及横断山脉南部不发生日冻融现象。图6b为近地表土壤T-F过程中发生的日冻融循环的天数分布情况。在T-F过程中,日冻融发生天数最多的区域集中在藏南谷地东侧谷地区域以及川藏高山峡谷区北部;青藏高原东部年均日冻融发生天数超过90 d;青海高原及柴达木盆地年均日冻融发生较少;藏北高原、藏南高山区、珞瑜地区、横断山脉南部基本不发生日冻融现象。图6c展示了全年年均日冻融天数分布情况,是图6a与6b叠加后的可视化结果。由图6c可知,一年内藏南珞瑜地区与横断山脉南部年内日冻融循环天数最少(1~39 d),青藏高原东部及青藏高原西北部(西昆仑山脉西段)年内日冻融循环天数较少(40~85 d);冈底斯山脉东段、念青唐古拉山脉、喜马拉雅山脉、藏南谷地区域及青海高原西部在年内有较多天数(超过194 d)的日冻融循环现象发生。
图6

图6
2002—2020年年内日冻融循环天数分布
Fig. 6
Distribution of the average number of diurnal freeze-thaw cycle days per year
F-T过程中,日冻融发生区域主要集中在西部;而T-F过程中,日冻融发生主要集中于东南区域。其中藏南谷地在两个过程中均发生了频繁的日冻融循环现象,融化过程以高山区域为主,冻结过程以谷地区域为主。青海高原在F-T过程和T-F过程中都有日冻融发生,F-T过程以西部为主,T-F过程则以东部为主。青藏高原东部在F-T过程中有较少的日冻融发生,而在T-F过程中则有较多的日冻融发生天数。藏北高原西北区域由于寒冷,日冻融发生天数较少。珞瑜地区与横断山脉南部较为温暖,表现出极少的日冻融发生。
本文进一步分析青藏高原2002—2020年不同月份日冻融情况及分布规律,获得了该区域平均每个月份发生日冻融循环天数,如图7所示。年初因气温较低,日冻融循环主要发生在藏南区域、青藏高原东部以及横断山脉北部,1月有24.55%的区域日冻融发生天数超过15 d;随着气温升高,青藏高原近地表土壤由冻结状态转向融化状态,青海高原近地表土壤开始融化导致日冻融现象逐渐增加,日冻融循环高频发生区域向着青藏高原西北推进。4月40.87%区域日冻融发生天数超过15 d,青藏高原东部近地表土壤由于部分时间完全融化,日冻融天数逐渐减少。进入8月后,日冻融循环主要集中在青藏高原西北部,其中32.51%区域日冻融发生天数超过15 d。9—12月青藏高原部分区域近地表土壤由融化状态转向冻结,发生日冻融循环的区域由西北向着东南移动。其中,11月时藏北高原基本冻结,日冻融循环发生天数低于8 d,12月时日冻融循环分布趋向于1月,有38.72%区域日冻融发生天数超过15 d。
图7

图7
2002—2020年月均日冻融循环天数分布
Fig. 7
Distribution of the average number of diurnal freeze-thaw cycle days per month
日冻融循环分布变化存在周期性,具有升温时向西北转移、降温时向东南转移的特点。以日冻融发生区域为界限,东南范围近地表土壤表现为完全融化状态,西北为完全冻结状态。1月是一年内青藏高原低温时日冻融范围最小的月份,8月是一年内青藏高原高温时日冻融范围最小的月份。对每天昼夜冻融情况进行细分后,可将青藏高原近地表冻融状态准确地区分为日冻融循环状态、全日冻结状态与全日融化状态,并获取不同状态的周期性特点与分布情况,为青藏高原近地表土壤冻融与气候变化的响应提供支持。
4.4 青藏高原日冻融循环发生天数变化趋势分析
通过统计青藏高原2002—2020年日冻融循环发生天数变化,发现2002—2020年青藏高原日冻融循环发生天数变化呈现较强的空间异质性(图8)。青藏高原东部纬度30°N~35°N区域、藏北高原、藏南区域以及柴达木盆地的年际日冻融循环天数呈上升趋势,最大幅度可达1.5 d/a。祁连山地日冻融循环天数变化幅度较小。与之相反,青海高原和青海湖西北部区域日冻融天数有较为明显的减少,最大减少幅度可达到3.1 d/a。
图8
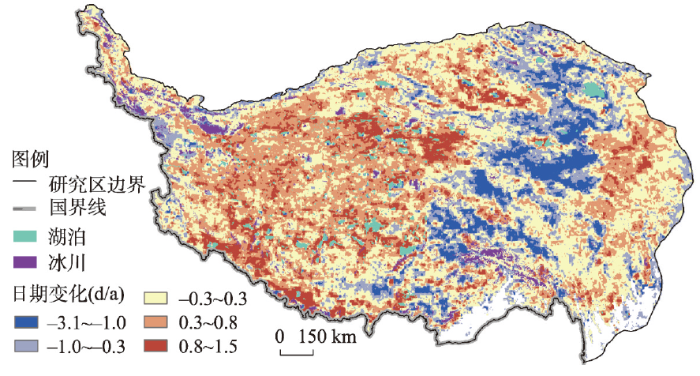
图8
2002—2020年日冻融循环天数变化分布
Fig. 8
Distribution of changes in the number of days in the diurnal freeze-thaw cycle between 2002 and 2020
日冻融循环变化趋势与海拔高低有密切关系。其中青藏高原东部的日冻融循环天数增加的区域处于3000~3800 m海拔,主要表现在T-F过程的日冻融循环天数增加。藏北高原及藏南山地海拔处于4300 m以上,日冻融循环天数整体呈增加趋势,主要是T-F过程中日冻融循环天数增加。海拔处于3800~4300 m的区域日冻融循环天数减少较为明显,主要是F-T过程中日冻融循环持续时间缩短,近地表土壤更快地转变为完全融化状态。
为分析青藏高原整体日冻融面积的变化,本文将近20年青藏高原逐年日冻融天数划分为小于100 d、100~180 d、180~260 d、260~365 d区间,并分别统计面积(图9)。由图9可知青藏高原日冻融循环整体天数较多,平均每年45%的区域发生日冻融循环的时间占一年的50%及以上,超过80%的区域每年发生超过100 d的日冻融现象。图9中一年内发生的天数为100~180 d的区域面积增加速率为0.33%/a,发生天数大于180 d的区域面积减少速率为0.29%/a,发生天数小于100 d的区域面积也有所增加。结合图8与图9分析,100~180 d日冻融天数的区域增加,主要是因为较为寒冷的藏北高原日冻融天数的增加,260~365 d日冻融天数的区域减少,主要是因为藏南区域完全融化天数增加,相应地日冻融天数减少。
图9
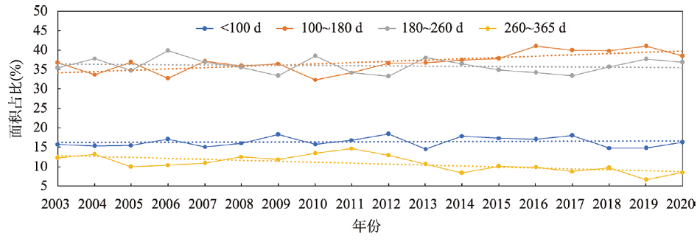
图9
2002—2020年日冻融循环面积变化
Fig. 9
Changes of the diurnal freeze-thaw cycle area during 2002-2020
4.5 青藏高原连续日冻融起始发生时间点空间差异及变化分析
为获取青藏高原近地表土壤季节性冻融过程中日冻融循环发生的时间点的分布与变化,本文对近20年内日冻融循环起始时间点开展统计。近地表土壤冻融状态变化的过程中存在日冻融循环与全日融化或全日冻结交替出现的情况。为排除这种现象对日冻融循环起始时间点获取的影响,对连续日冻融起始时间点进行规定:时间点发生日冻融循环并满足前3 d为全日融化或全日冻结,且后7 d内有5 d为日冻融状态。依据上述定义分别获得F-T过程与T-F过程日冻融循环起始时间点(图10)。
图10
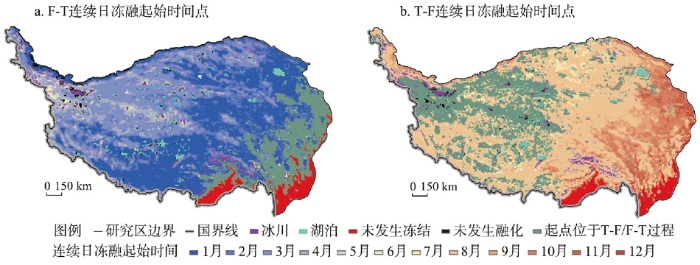
图10
2002—2020年日冻融循环年均起始时间点分布
Fig. 10
Distribution of the average annual starting dates of the diurnal freeze-thaw cycle during 2002-2020
结合图10a、10b可以发现在F-T过程至T-F过程中,青藏高原日冻融循环现象出现在不同类型的季节性冻融变化中。青藏高原西北部藏北高原以“完全冻结—日冻融循环—完全冻结”的周期性变化为主,该区域在F-T过程中于5—7月出现连续日冻融循环,并且在日均温度最高的时段保持着日冻融循环,进入T-F过程后随着温度的下降由日冻融循环转换变成完全冻结状态。青海高原、祁连山地及藏南谷地大部分地区呈现出“完全冻结—日冻融循环—完全融化—日冻融循环—完全冻结”的循环过程。其中青海高原与藏南谷地大部分地区于1—3月由完全冻结转变为日冻融循环,随着温度升高趋于昼夜完全融化,并于8—9月进入T-F过程的日冻融循环,随着温度降低进入完全冻结。祁连山地存在相同的过程,F-T过程日冻融起始时间延后为4—6月以及部分区域T-F过程中日冻融起始时间点提前至7月。藏东区域及横断山脉北部呈现出“日冻融循环—完全融化—日冻融循环”的周期性现象。该区域日冻融循环起始于T-F过程,主要集中在9—11月间,并在日均温度最低的时段保持着日冻融循环,进入F-T过程后随着温度的上升,逐渐由日冻融循环状态转变成为全日融化状态。在图10a、10b中可以发现,青藏高原存在未发生连续日冻融的区域,其中藏东南区域与珞瑜地区(红色区)由于全年的温度高始终保持着融化状态,未发生冻结;藏西北部分区域(黑色区)由于全年温度低始终保持着冻结状态,未发生融化。
本文分别对2002—2020年T-F过程与F-T过程中连续日冻融循环起始时间点进行统计,并将青藏高原内每年的起始时间点与近20年来平均起始时间点进行对比(图11)。在F-T过程中日冻融循环发生时间点提前了0.17 d/a,即更早地进入融化过程;在T-F过程中日冻融循环发生时间点提前了0.18 d/a,即更早进入冻结过程。这表明连续日冻融循环发生时间点受到了青藏高原整体气候变化的影响,整个日冻融周期将整体缓慢提前。
图11
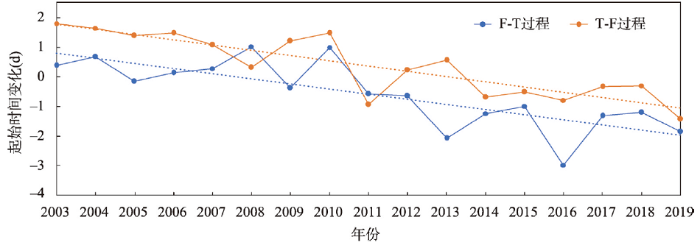
图11
2003—2019年日冻融循环发生时间点变化
Fig. 11
Change of the start dates for the freeze-thaw cycle during 2003-2019
5 结论
本文基于MODIS、AMSR-E、AMSR-2遥感数据,针对青藏高原区域内AMSR系列传感器数据进行校准,并利用Fourier非线性模型完成微波遥感获得的冻融指标与热红外遥感获得的地表温度的融合,获得2002—2020年青藏高原1 km分辨率近地表土壤日冻融状态,详细分析了季节性冻结与融化过程的日冻融循环分布,日冻融循环天数变化以及日冻融循环发生时间点分布和变化。主要得出以下结论:
(1)针对青藏高原区域AMSR系列遥感数据的校准方法改进,使两个微波辐射计数据在青藏高原校准更加准确。基于MODIS和校准后的AMSR系列遥感数据,本文利用Fourier非线性模型获取的冻融判别产品,在将分辨率提升至1 km的同时克服了MODIS数据水汽干扰的数据缺失问题和AMSR系列产品空间分辨率低的难点,能够有效判断青藏高原地区的昼夜冻融情况。相对于相对未经融合的FTI产品,FTILST获得的日冻融判别精度为80.96%,提升了3.95%。
(2)青藏高原年内日冻融循环发生天数空间上存在显著差异性,时间上存在明显周期性。研究表明,全年内日冻融现象集中发生在青藏高原中西部,其中藏南区域、青海高原发生天数最多,藏北高原与川藏高山峡谷区次之。季节性融化过程中青藏高原中西部日冻融发生天数明显多于东部,其中藏南高山区最多;季节性冻结过程中,青藏高原东部日冻融发生天数明显多于中西部,其中藏南谷地东部及横断山脉区域最多。同时,日冻融循环分布在时间上表现出周期性特点,呈升温时向西北转移,降温时向东南转移。
(3)青藏高原日冻融循环发生天数变化呈现出较强的空间异质性。青藏高原东部、藏北高原、藏南区域的增加(最高1.5 d/a)与西昆仑山脉、喀喇昆仑山脉、青海高原等地的减少(最高-3.1 d/a)。整体上,年内日冻融循环天数为100~180 d的区域面积每年增加0.33%,年内日冻融循环天数为260~365 d的区域面积每年减少0.29%。
(4)青藏高原连续日冻融循环起始时间点分布存在区域差异。研究表明在F-T过程中,连续日冻融循环起始时间点在青藏高原东部及藏南谷地发生较早,整体向西北推移;在T-F过程中连续日冻融起始于西北部,向东南推移,横断山脉、青藏高原东部发生较晚;一年内F-T过程与T-F过程中连续日冻融循环整体发生时间点均有所提前,分别为0.17 d/a与0.18 d/a。
关联数据信息:本文关联实体数据集已在《全球变化数据仓储电子杂志(中英文)》出版,获取地址:
参考文献
Permafrost region and permafrost area in the Globe and China
全球和我国多年冻土分布范围和实际面积研究进展
Respiratory burst after freezing and thawing of soil: Experiments with soil bacteria
DOI:10.1016/0038-0717(88)90092-2 URL [本文引用: 1]
Effect of soil moisture variation on near-surface air temperature over the Tibetan Plateau
DOI:10.11821/dlxb202001007
[本文引用: 1]

The Tibetan Plateau is one of the most sensitive regions to global climate change. It is of important theoretical significance to explore the effect of soil moisture changes on near-surfaceair temperature for the study of the water cycle of the Tibetan Plateau and its impact on the surrounding climate and environment. Based on the NCEP-CFSR dataset, this paper reveals the spatial-temporal pattern of soil moisture content in different seasons and different vegetation zones on the Tibetan Plateau, the response and coupling of soil moisture and evaporation rate, and the impact of soil moisture on near-surface air temperature through evapotranspiration. The results show that: (1) The spatial pattern of soil water on the Tibetan Plateau is basically similar in different seasons, showing a decreasing trend from southeast to northwest and the spatial characteristics of drying in humid regions and wetting in arid regions; (2) The soil moisture in most parts of the Tibetan Plateau is in a transitional state, in which the southern and southeastern parts of the plateau are in a state of transition throughout the year, while the soil moisture in the Qaidam Basin is almost in a dry state all the year round; (3) The sensitivity of the near-surface air temperature to soil moisture is the weakest in winter, but the strongest in summer with weak spatial difference, which is negative feedback in winter, spring and summer. Moreover, the sensitivity of air temperature to soil moisture varies greatly in different vegetation coverage areas. This study has important theoretical significance for further exploring the regional water cycle and its effects under the coupled land-atmosphere state and the changing environment of the Tibetan Plateau.
青藏高原土壤水分变化对近地面气温的影响
DOI:10.11821/dlxb202001007
[本文引用: 1]
青藏高原为全球气候变化最为敏感的区域之一,探讨该地区土壤水分变化对近地面气温的影响将为青藏高原水汽循环研究及该地区对周边气候与环境的影响研究提供重要理论支撑。利用NCEP-CFSR数据集,基于土壤水分对近地面气温的影响机理,揭示了青藏高原不同季节、不同植被分区下土壤水分时空分异规律、土壤水分与蒸发率的响应与耦合状态及土壤水分通过蒸散发过程对近地面气温的影响。结果表明:① 不同季节下青藏高原土壤水分空间分布基本一致,除西北地区和喜马拉雅山脉外,整体呈现由东南向西北递减趋势,青藏高原地区存在干旱区变湿,湿润区变干的空间特征;② 青藏高原大部分区域土壤水分处于干湿过渡状态,其中青藏高原南部和东南部地区全年处于干湿过渡状态,而柴达木盆地几乎全年处于干旱状态;③ 近地面气温对土壤水分的响应在冬季最弱,在夏季最强且空间差异较小,其中在冬、春、夏季为负反馈,另外不同植被覆盖区近地面气温对土壤水分的敏感性差异很大。此项研究对于进一步探讨青藏高原地区陆气耦合状态及变化环境下的区域水汽循环及其效应具有重要理论意义。
Diurnal freeze/thaw cycles of the ground surface on the Tibetan Plateau
DOI:10.1007/s11434-007-0004-8 URL [本文引用: 3]
Spatiotemporal variations of soil freeze-thaw state in Northeast China based on the ERA5-LAND dataset
DOI:10.11821/dlxb202111012
[本文引用: 1]
The soil freeze-thaw cycle plays an important role in land surface processes. Repeated freeze-thaw cycles can have profound effects on land-atmosphere energy exchange, surface runoff, plant growth, ecosystems and soil carbon & nitrogen cycles. Using spatial analysis functions of geographical information system and python programming language, this paper analyzed the spatial distributions and temporal variations of soil freeze-thaw state in Northeast China based on the ERA5-LAND hourly soil temperature dataset for the period 1981-2019. The results suggest that the start dates of the four soil freeze-thaw periods for the near-surface layer are mainly determined by latitude and topography. The start dates of freeze-thaw transition period in spring (SFTTP) and complete thawing period (CTP) show a southeast-northwest gradient with later starts in the northwest part, while the start dates of freeze-thaw transition period in autumn (AFTTP) and complete freezing period (CFP) exhibit a latitudinal pattern with earlier starts in the north. For most parts of the study area, the average annual number of days for SFTTP is less than 30, with higher values in the south and west compared to the north and east. The number of days for AFTTP, however, is below 10 per year for most parts of the region, with just a slight difference in the study area. The CTP is the longest compared to the other three periods, varying from 150 days in the northwest to 240 days in the southeast. The CFP, which comes next, ranges from 90 to 180 days per year, presenting a dustpan-shaped spatial pattern with higher values in the north and lower values in the south. Trend analysis shows that with the advance of start date for SFTTP and the delay of start date for AFTTP, the number of days for CTP has increased with a rate of 0.2 d/a. The number of days for SFTTP in the Liaohe Plain, the western part of the Da Hinggan Mountains and the northern part of Hulun Buir Plateau shows a decreasing trend, while in other regions an increasing trend is observed. In the western part of the Da Hinggan Mountains and the northern part of the Hulun Buir Plateau, the CTP starts earlier. The start date of AFTTP is significantly delayed in the Songnen Plain and Changbai Mountains, and the trend for the number of days varies substantially with an increase in the north and a decrease in the south. The start date for CFP occurs later in the vast area of the Northeast China Plain and occurs earlier in the Da Hinggan Mountains, Xiao Hinggan Mountains, Changbai Mountains, Eastern Liaoning Peninsula and Western Liaoning Hills. The number of days for CFP shows a declining trend throughout the study area, especially in the seasonally frozen area located in the central part with an annual decreasing rate of more than 0.2 d/a.
基于ERA5-LAND的中国东北地区近地表土壤冻融状态时空变化特征
DOI:10.11821/dlxb202111012
[本文引用: 1]
土壤冻融交替是陆地表层极其重要的物理过程,土壤冻融状态的频繁变化对地气能量交换、地表径流、植被生长、生态系统及土壤碳氮循环等均具有重要的影响。本文基于1981—2019年ERA5-LAND逐小时土壤温度数据,借助GIS空间分析功能,利用Python编程处理分析了中国东北地区近地表土壤冻融状态的时空变化特征。结果表明:从不同冻融状态起始日期的空间分布来看,近地表不同阶段的起始日期主要受纬度和地形的影响,具有明显的纬度地带性和垂直地带性。春季冻融过渡期和完全融化期的起始日期由东南向西北均呈逐渐推迟趋势,而秋季冻融过渡期与完全冻结期起始日期则由东南向西北随纬度升高越来越早。就不同冻融状态发生天数的空间分布而言,研究区南部春季冻融过渡期发生天数多于北部,西部多于东部,年均发生天数均在30 d以内;秋季发生冻融的天数空间差异不大,研究区一半以上的地区年均发生天数在10 d以内。完全融化期发生天数最多,从东南向西北呈逐渐减少趋势,年均发生天数主要介于150~240 d之间;完全冻结期发生天数则由南向北日益增多,其空间分布表现为一向南开口的簸箕形,各地年均发生天数集中于90~180 d之间。从时间变化趋势来看,近年来春季冻融过渡期起始日期以提前趋势为主,而秋季冻融过渡期起始日期总体表现为延后,致使完全融化期发生天数以增加趋势为主,年均变化速度高达0.2 d/a;大兴安岭以西、呼伦贝尔高原以北地区及辽河平原春季冻融过渡期发生天数呈减少趋势,其他地区为增加趋势;大兴安岭以西地区、呼伦贝尔高原以北地区完全融化期起始日期明显提前;松嫩平原和长白山区秋季冻融过渡期起始日期推迟显著,发生天数的变化趋势呈北增南减的空间分异特征;不同地区完全冻结期起始日期的变化趋势差异显著,中部广大的平原区呈不显著的推迟趋势,而大、小兴安岭、长白山、辽东半岛和辽西丘陵则提前进入完全冻结状态;研究区完全冻结期发生天数呈减少趋势,研究区中部的季节冻土区完全冻结期明显变短,年均减少速度大于0.2 d/a。
Temporal and spatial variability of the beginning and end of daily spring freeze/thaw cycles derived from scatterometer data
DOI:10.1016/j.rse.2006.09.004 URL [本文引用: 1]
Effects of the freezing-thawing cycle mode on alpine vegetation in the Nagqu River basin of the Qinghai-Tibet Plateau
The freezing–thawing cycle is a basic feature of a frozen soil ecosystem, and it affects the growth of alpine vegetation both directly and indirectly. As the climate changes, the freezing–thawing mode, along with its impact on frozen soil ecosystems, also changes. In this research, the freezing–thawing cycle of the Nagqu River Basin in the Qinghai–Tibet Plateau was studied. Vegetation growth characteristics and microbial abundance were analyzed under different freezing–thawing modes. The direct and indirect effects of the freezing–thawing cycle mode on alpine vegetation in the Nagqu River Basin are presented, and the changing trends and hazards of the freezing–thawing cycle mode due to climate change are discussed. The results highlight two major findings. First, the freezing–thawing cycle in the Nagqu River Basin has a high-frequency mode (HFM) and a low-frequency mode (LFM). With the influence of climate change, the LFM is gradually shifting to the HFM. Second, the alpine vegetation biomass in the HFM is lower than that in the LFM. Frequent freezing–thawing cycles reduce root cell activity and can even lead to root cell death. On the other hand, frequent freezing–thawing cycles increase microbial (Bradyrhizobium, Mesorhizobium, and Pseudomonas) death, weaken symbiotic nitrogen fixation and the disease resistance of vegetation, accelerate soil nutrient loss, reduce the soil water holding capacity and soil moisture, and hinder root growth. This study provides a complete response mechanism of alpine vegetation to the freezing–thawing cycle frequency while providing a theoretical basis for studying the change direction and impact on the frozen soil ecosystem due to climate change.
Changes in the near-surface soil freeze-thaw cycle on the Qinghai-Tibetan Plateau
DOI:10.1016/j.jag.2011.12.002 URL [本文引用: 1]
Spatiotemporal changes of freezing/thawing indices and their response to recent climate change on the Qinghai-Tibet Plateau from 1980 to 2013
DOI:10.1007/s00704-017-2157-y URL [本文引用: 1]
Progress on remote sensing of snow, surface soil frozen/thaw state and soil moisture
积雪、土壤冻融与土壤水分遥感监测研究进展
Comparison of MODIS-derived land surface temperatures with ground surface and air temperature measurements in continuous permafrost terrain
DOI:10.5194/tc-6-51-2012
URL
[本文引用: 1]
. Obtaining high resolution records of surface temperature from satellite sensors is important in the Arctic because meteorological stations are scarce and widely scattered in those vast and remote regions. Surface temperature is the primary climatic factor that governs the existence, spatial distribution and thermal regime of permafrost which is a major component of the terrestrial cryosphere. Land Surface (skin) Temperatures (LST) derived from the Moderate Resolution Imaging Spectroradiometer (MODIS) sensor aboard the Terra and Aqua satellite platforms provide spatial estimates of near-surface temperature values. In this study, LST values from MODIS are compared to ground-based near-surface air (Tair) and ground surface temperature (GST) measurements obtained from 2000 to 2008 at herbaceous and shrub tundra sites located in the continuous permafrost zone of Northern Québec, Nunavik, Canada, and of the North Slope of Alaska, USA. LSTs (temperatures at the surface materials-atmosphere interface) are found to be better correlated with Tair (1–3 m above the ground) than with available GST (3–5 cm below the ground surface). As Tair is most often used by the permafrost community, this study focused on this parameter. LSTs are in stronger agreement with Tair during the snow cover season than in the snow free season. Combining Aqua and Terra LST-Day and LST-Nigh acquisitions into a mean daily value provides a large number of LST observations and a better overall agreement with Tair. Comparison between mean daily LSTs and mean daily Tair, for all sites and all seasons pooled together yields a very high correlation (R = 0.97; mean difference (MD) = 1.8 °C; and standard deviation of MD (SD) = 4.0 °C). The large SD can be explained by the influence of surface heterogeneity within the MODIS 1 km2 grid cells, the presence of undetected clouds and the inherent difference between LST and Tair. Retrieved over several years, MODIS LSTs offer a great potential for monitoring surface temperature changes in high-latitude tundra regions and are a promising source of input data for integration into spatially-distributed permafrost models.\n
Mapping the permafrost stability on the Tibetan Plateau for 2005-2015
DOI:10.1007/s11430-020-9685-3 [本文引用: 1]
Spatial and temporal variations of summer surface temperatures of wet polygonal tundra in Siberia: Implications for MODIS LST based permafrost monitoring
DOI:10.1016/j.rse.2010.04.012 URL [本文引用: 1]
A continuous global record of near-surface soil freeze/thaw status from AMSR-E and AMSR2 data
DOI:10.1080/01431161.2019.1597307 URL [本文引用: 3]
The Advanced Microwave Scanning Radiometer for the Earth Observing System (AMSR-E), NASDA's contribution to the EOS for global energy and water cycle studies
DOI:10.1109/TGRS.2002.808331 URL [本文引用: 2]
Monitoring the spatial distribution and changes in permafrost with passive microwave remote sensing
DOI:10.1016/j.isprsjprs.2020.10.011 URL [本文引用: 1]
Freeze/thaw detection and validation using aquarius' l-band backscattering data
DOI:10.1109/JSTARS.4609443 URL [本文引用: 1]
Identifying soil freeze/thaw states using scattering and coherence time series of high-resolution c-band synthetic aperture radar in the Qinghai-Tibet Plateau
DOI:10.1109/JSTARS.2021.3137187 URL [本文引用: 2]
Classification of Alaska spring thaw characteristics using satellite l-band radar remote sensing
High-resolution mapping of freeze/thaw status in China via fusion of MODIS and AMSR2 data
Estimation of high-resolution near-surface freeze/thaw state by the integration of microwave and thermal infrared remote sensing data on the Tibetan Plateau
DOI:10.1002/ess2.v4.8 URL [本文引用: 4]
Spatial downscaling based on spectrum analysis for soil freeze/thaw status retrieved from passive microwave
Detection of soil freeze/thaw states at a high spatial resolution in Qinghai-Tibet engineering corridor
A method based on temporal component decomposition for estimating 1-km all-weather land surface temperature by merging satellite thermal infrared and passive microwave observations
DOI:10.1109/TGRS.36 URL [本文引用: 1]
A discussion on the boundary and area of the Tibetan Plateau in China
DOI:10.11821/yj2002010001
[本文引用: 1]
<p>The Tibetan Plateau is a unique geomorphic unit composed of some basic geomorphic types, such as extreme high mountains,high mountains, hills, plains, and tablelands of high altitude or sub-high altitude. Different opinions for the exact scope of Tibetan Plateau exist. According to latest research achievement and the long time fieldwork, questions related to the area and boundary of the Plateau have been discussed in view of geography, and the principles taking geomorphic characters as the main rule and considering the integrity have been made to define the boundary. The 1∶1 000 000 geomorphological map was compiled based on 1∶100 000 aerial photographic map,1∶500 000 topographic map and interpretation of satellite images. By refering to the 1∶3 000 000 relief map, the boundary of the Plateau was delineated.The position of the boundary was quantitatively determined with GIS and GPS.The map of electronic version of the Tibetan Plateau was compiled. The main conclusion is that Tibetan Plateau starts from the southern edge of the Himalayan Range, abuts on India,Nepal and Bhutan,connects the northern edge of Kunlun, Altun and Qilian Mts., and joins Tarim Basin and Hexi Corridor in Central Asia.The west of it is the Pamirs and Karakorum Mts., bordering on Kirghizistan, Tajikistan, Afghanistan, Pakistan and Kashmir. The east of it is Yulongxueshan, Daxueshan, Jiajinshan and Qionglaishan Mts.as well as south or east piedmont of Minshan Mts. Tibetan Plateau joins the Qinling Mts.and Loess Plateau with its eastern and northeastern part. Tibetan Plateau in China's territory starts from the Pamirs in the west and reaches to Hengduanshan in the east. It bestrides a longitude of 31 degrees with a length of 2 945 km from east to west,and bestrides a latitude of 13 degrees with a length of 1 532 km from south to north. It ranges from 26°00′12" N to 39°46′50" N and from 73°18′52"E to 104°46′59"E, covering an area of 2 572.4×10 3 km 2. Administratively, it embraces 201 counties (cities) in 6 provinces, namely, the Tibet Autonomous Region (73 counties/cities,1 176.0×10 3 km 2, part of Cona, Mêdog and Zayü), the Qinghai Province(40 counties/cities,721.0×10 3 km 2, some counties only partially), Dêqen Tibetan Autonomous Prefecture in Northwest Yunnan Province(9 counties/cities,33.5×10 3 km 2), West Sichuan Province ( 46 counties/cities about 254.0×10 3 km 2,such as Garze Autonomous Prefecture, Aba Tibetan and Qiangzu Autonomous Prefecture,and Muli Autonomous County, etc.),Gansu Province(21 counties/cities, 74.9×10 3 km 2), and Southern Xinjiang Uygur Autonomous Region (about 12 counties/cities, 313.0×10 3 km 2).</p>
论青藏高原范围与面积
A generalized split-window algorithm for retrieving land-surface temperature from space
DOI:10.1109/36.508406 URL [本文引用: 1]
A continuous global record of near-surface soil freeze/thaw status from AMSR-E and AMSR2 data
DOI:10.1080/01431161.2019.1597307 URL [本文引用: 5]
Intercalibration of AMSR2 NASA team 2 algorithm sea ice concentrations with AMSR-E slow rotation data
DOI:10.1109/JSTARS.4609443 URL [本文引用: 3]
Inter-calibration of satellite passive microwave land observations from AMSR-E and AMSR2 using overlapping FY3B-MWRI sensor measurements
DOI:10.3390/rs6098594 URL [本文引用: 3]
Estimate of phase transition water content in freeze-thaw process using microwave radiometer
DOI:10.1109/TGRS.2010.2051158 URL [本文引用: 1]
A new soil freeze/thaw discriminant algorithm using AMSR-E passive microwave imagery
DOI:10.1002/hyp.v25.11 URL [本文引用: 2]
