

1 引言
区域管理需要认识到区域差异,而区域之间的差异性是自然环境和人文社会环境综合作用下的结果,因此区域评估通常采用多指标进行综合衡量。国际上比较知名的是1990年联合国开发计划署创立的人类发展指数(Human Development Index, HDI)[3]。Togtokh提出在HDI基础上引入人均碳排放量构建人类可持续发展指数(Human Sustainable Development Index, HSDI)[4]。Bravo认同增加环境维度来修正HDI的观点,但同时认为HSDI在环境可持续性方面的代表性仍然不足[5]。2020年联合国发布《人类发展报告》30周年纪念版,进一步提出“地球压力调整后的人类发展指数”(Planetary pressures-adjusted Human Development Index, PHDI),该指数纳入了二氧化碳排放量和“物质足迹”的概念[6]。国内许多学者针对区域持续发展 [7]、区域发展规划[8]、人居环境质量[9]、贫困度[10]等方面进行了研究,构建了综合评价指标体系,为区域评估的指标体系构建提供了理论参考。国内外诸多指标体系从人口、资源、环境和发展(PRED)方面综合衡量和评估了区域的差异性,并对世界和中国的区域发展问题研究发挥了积极作用。但其中也存在着一些问题,比如各类指标往往侧重于反映特定主题的区域发展问题,有些指标缺乏整体观念和动态化机制,还有不少综合性指标存在着理论构建与实际运用相矛盾的问题。理论构建希望完整全面,而实际运用又需要考虑用户的接受度和数据获取性等方面的制约。中国艰苦边远地区类别划分研究探讨区域发展基础评估问题,其指标体系的构建同样存在着考虑PRED协调发展的科学性问题、指标体系能够长期使用的动态化机制问题以及保证数据可获取、便于用户使用等问题。
关于艰苦边远地区津贴的实施范围和类别划分,国际上存在类似的政策。俄罗斯国防部颁布的《俄罗斯联邦军人薪金与补贴法》中规定了地区津贴,包括北极地区津贴、偏远地区津贴、高山地区津贴、荒漠干旱地区津贴等,以此激励工作在艰苦或特殊环境地区的军人。日本《国家公务员法》第62条规定了地域性津贴,给予服务于离岛或生活显著不便地区公务员“特地勤务津贴”以及北海道等寒冷地区“寒冷地津贴”。美国《联邦公务员地区可比性工资法案》的地区薪酬(Locality Pay)中规定,关于在边远地区如夏威夷、阿拉斯加、波多黎各及太平洋海外领地等地工作的联邦公务员,对其因生活费用和环境因素造成的额外付出给予特殊津贴。澳大利亚为了使卫生人才资源配置趋于合理,1994年公共事业和卫生部制定了澳大利亚边远地区分级标准“农村、边远地区和大城市分级标准(RRMA)”。2010年澳大利亚卫生与老龄部基于阿德雷德大学的“澳大利亚可及性及偏远指数”研究成果启用新的“澳大利亚边远地区分级标准(ASGCRA)”[11]。从各国制定的相关政策可以看出,各国均意识到给予艰苦边远地区工作人员津贴补助对稳定人才队伍、补偿超额劳动付出起到至关重要的作用。但是由于一些国家人口较少(如澳大利亚)或国土面积较小(如日本),对构成艰苦边远因素的考虑较单一,并没有形成系统的指标体系。中国幅员辽阔、人口众多,地理环境特征复杂,对艰苦边远特征的考察必须从自然、生态、经济、社会等多因素加以考虑。
中国历史时期就对边远地区做出了相关管理考虑,比如清代对边疆地区实施的协饷与专饷制度[12],对边疆的治理发挥了重要作用,有力地维持了边疆稳定。1978年改革开放之后,1983年国务院相关部门制定政策(《劳人科局(1983)064号》文),将全国边远地区分为3类:其一为边远省界县、穷困山区县;其二为边疆国境县、边疆县(指执行边疆政策的县)、少数民族自治县和海拔2000 m以上的高寒山区县;其三为海拔3000 m以上的特别高寒县等。1993年在原3类边远地区类别划分基础上,将海拔4000 m以上地区列为第四类地区,形成4类艰苦边远类别划分(国发[1993]79号)。1983年和1993年全国艰苦边远类别划分主要是从管理学上做的划分,划分标准主要依赖于实际感受和历史经验,缺乏一个更为科学、合理、通用并能落地实施的区域发展基础评价指标体系。
基于此,本文将讨论制定社会经济问题政策时经常涉及的区域评估体系问题,其中包括对区域的状态认识以及对区域的结构辨析。在实际的工作中,需要结合国家任务即中国艰苦边远地区辨识①(①辨识中国艰苦边远地区是历代中国政府一直重视的一项区域管理工作。从20世纪50年代开始,国家就针对区域管理问题划分了艰苦边远地区类别,以此作为区域管理的基础。)。该任务是中国政府长期坚持的一项管理工作,本文以中国艰苦边远地区类别划分标准及其应用为例,来探讨区域发展基础评估问题,它的管理科学直接目标是为国家制定区域公务员工资和补贴政策,以维护区域平衡发展。
2 区域发展的地理机制
构建中国艰苦边远地区辨识的指标体系,需要从大量的数据中挖掘出区域信息,是典型的区域科学问题,技术上也是地理信息科学上的数据挖掘问题。关于数据挖掘,相关学者首先要明确数据挖掘和分析将服务于的管理目标和场景,这样才能从大量的区域考察中获得数据。这时数据仍然是散乱的,数据挖掘的第一步工作就是从散乱的数据中理出分析问题的主线。地理数据挖掘是常见的工作,王劲峰等[13]、苏奋振等[14]结合具体地理过程探讨了地理数据挖掘方法。本文的目的是探讨区域管理的数据挖掘特征问题,区域管理的政策行动关键是制定区域的工资(或津贴)政策,因此区域管理的实践者应该根据马克思主义的劳动价值观点研究问题。区域治理工作者主要是辨识出区域劳动者在某种地理环境中产生某种劳动成果需要的劳动付出量(或付出水平),从而相应地对劳动者实行劳动补偿。纯经济学的工资理论,忽视了地理环境对劳动付出的差异性,隐含了对劳动者的不公平,不利于劳动者按劳取酬。
各国艰苦边远津贴的实施即地理学意义上承认地理环境对区域自然产出能力形成差异、对人的健康造成损失,以及承认工作者远离家乡的痛苦和生活上存在的障碍,这就是区域艰苦性与边远性特点。各国给予艰苦边远地区劳动者以津补贴的政策,也意味着承认在艰苦边远环境里劳动者需要更多的劳动付出。在经济学中,劳动者收入是由产出决定的,产出是各种生产力因素投入的结果,从纯经济学看,即有
式中:Y为产出;K为资本;L为劳动力;α、β为弹性系数;A为一个由技术水平决定的参数(算子)。
在实际经济现象观察中可以发现,存在这样的情况,同样的劳动力、资本和人力资本在同样技术水平投入下,各地区产出不同。按经济学原理,由于工资是劳动投入的结果,所以付出同样的劳动,在不同地理环境中,产出必然不尽相同。换言之,在艰苦边远地区较自然条件良好区要产生同样劳动产出,需要多付出一个依赖于地理环境的“努力”量E(> 0),于是经济学的技术参数(算子)A被修改为:
即由A变形为AEi,说明一个区域(地方i)的地方产出函数Yi除了由资本K和劳动力L决定之外,还要受到技术能力A与地理环境Ei结合的地方特征的影响。
由此(2)式定义了一个区域(地方)劳动者依赖其地理环境付出“努力”的量Ei。显然,Ei是地理环境差异的函数。由于区域(地方)Ei的存在,艰苦边远地区人员需要比其他地区人员付出更多的劳动、克服更大的困难才能完成相同效果的工作内容,这个问题由此在理论上被追溯为地理问题。经济学家Krugman提出了地理环境存在“两个地理本性”学说[15],两个地理本性决定区域的经济学特性,第一(次)本性是“先天的自然禀赋”,决定了区域的比较优势,第二(次)本性是“后天的区域内生的适应性变性”,从经济地理学上内生化了某种“优势”。第一(次)地理学本性的先天自然禀赋是一种表现为地理环境艰苦性的特征,例如高海拔、碘缺乏病等诸多因素大大地降低了所在地区人员的生命质量和健康水平。而作为第二(次)地理学本性的区位、交通条件均是人类有目的改造和利用的结果,它们表现为工作和生活成本的变化(如医疗、出行、生活资料的获取),可以理解为一个地方i地理环境的某种测度的函数。
总之,因为区域或地方具有地理特征,地理环境具有人类可感受的艰苦边远性,为此引用Krugman的地理本性学说来刻画它们:在传统上,地理学关于描述一个区域的地理本性共有两类,即Krugman的第一(次)地理本性和第二(次)地理本性[15],两个本性在物理意义和地理意义上明确。刘清春等进一步认识到区域有三次地理本性[16]。三次本性论中,第一(次)本性是考虑地球赋予人类的先天环境条件,是自然禀赋,这些是人类难于通过自身的力量加以改变的;而第二(次)地理本性是人类自身在历史发展过程中利用并构造的地理本性;第三(次)地理本性是人类在社会发展中创造出来的。通俗地说,艰苦边远性存在于自然环境和社会环境两方面,第一(次)本性是自然本底的,第二(次)本性是人文社会内生的,第三(次)本性是人类社会创造的,传统上它们相互联系并构成人地关系,这些区域的地理基础通常是区域人文—生态系统特征,人文—生态系统观是地理学新人地关系论的要点。
如上文所述,在区域管理实践方面,许多国家对其艰苦边远地区实行津补贴政策,以补偿额外劳动付出。比较完整的是《美国法典》②(②《美国法典》是指美国对生效的公法、一般法以及永久性法律的正式汇编。作为美国的治理基础,它由美众议院的一个委员会负责监督、指导,由政府出版发行。关于美国艰苦边远地区3项原则认定见《美国法典》第五章第5941节:基于生活费用和环境条件的津贴以及驻扎在美国大陆以外或阿拉斯加等地的雇员。)第五章第5941节明确提出对美国边远地区实行地区津贴,并提出了认定艰苦边远地区的3项原则:自然生存条件恶劣、物质供应艰苦和地理环境条件有害于人类身体健康,这就是一个艰苦性的概念框架。对中国艰苦边远地区的考察发现,艰苦边远性的后果一般表现出以下特征:疾病增多、寿命缩短、生活水平下降、受教育困难、社会活动缺少丰富性等。
基于借鉴《美国法典》艰苦边远地区认定的3项原则和新经济地理学的“两次本性理论”[17],从管理学角度认为,艰苦边远性主要来自于地区间物质生产能力、贸易和生活便利程度以及长期健康环境三方面的因子差异,而且这些因子可能存在交互作用,如水资源缺乏可能导致疾病增多,也导致物资生产不足,还导致生活困难。另外有的因子表现了除健康损害、物资欠缺外,还可能存在民族文化障碍,从而产生诸多生活不便和文化摩擦。另一个不良因素是地方病,地方病使得许多地区劳动者遭受特殊的健康损害,它不是一种劳动付出,但却使人丧失某些技能,是一类与劳动付出相关的需要补偿性因素。付出函数的理论意义是:取得同样的劳动成绩,不同地区劳动者的付出是不同的。因此,可以依劳动付出函数对一个地方的艰苦边远性作出价值评价。
有了劳动付出的理论认识,就可以在经济学理论上对艰苦边远地区辨识指标体系展开数据挖掘。为此把每一个艰苦边远性特征称为艰苦边远性强度的地理因子xi,并且可以采用Cobb-Douglas形式的函数来度量一个区域地理环境的经济产出(劳动付出):
这个模型可以称为地理环境价值付出函数模型,本质上地理环境产出是艰苦性强度xj的函数,表示生产同一单位量的产品,劳动者因为各种艰苦边远强度特征
式中:Di(它是lgxj的线性合成)为i地方艰苦边远综合指数。
在规模报酬不变的条件下,在地理学意义上各项艰边因子的弹性不一样,可以将艰苦边远因子xj的弹性
3 区域评估指标确定原则与地理因子选择的科学性
为计算区域艰苦边远评价指标,必须明确选择的地理因子具有物理意义(或者地理意义)的表达模式,以保证区域特征具有测量可行性。另一方面,如在前节已经论述的那样,各个艰苦边远性特征是在地理环境意义上彼此联系的,因此要保证各因子完全相互独立几乎是不可能的,但是从因子选择的过程来看,单一物理的、地理的、经济的指标对艰苦边远性的作用是非单调的。为了制定可行的区域管理政策,设计获得的指标必须具有关于地理特征强度的单调性特征。恰当地选择指标,科学地进行合成,确定每个艰边因子对应的值应具唯一性,为此在确定艰边指标的过程中一般应该遵循下列原则。
3.1 指标选择的科学性
每一个指标的确定都要建立在地理学以及经济学等相关学科的研究基础上,要确实能够反映艰苦边远性的某方面本质特征,如海拔反映人类的好氧本性,同时也刻画着热力环境。大气含氧量随海拔指数下降,是一种物理规律,山地环境气温也有“高处不胜寒”的经验规律。在热力不足的条件下,根据气温与海拔的物理气候规律换算,将一个地方的海拔艰苦性唯一地计算出来,得到综合反映区域地理环境气温和热力状况的合成海拔值。此外对于某个区域内普遍存在的特殊困难,要结合实地考察与理论论证,将其科学地反映在艰苦边远指标中。
3.2 指标物理意义、地理意义、区域发展意义的明确性
列入艰苦边远指标的内容都与某个艰边因子有动力的、明确的、单调的联系,其在物理、地理、区域发展等方面的独立性是重要的。比如海拔的作用是独立的,不因与其他要素合成而导致它的物理学、地理学成因的多样性。比如农业生产潜力是一个土壤、水分变量合成的单调系列,降水量这个自然因子不被视为一个单独的艰边因子,是因为降水强度有洪涝和干旱的两面性,其对地理环境影响也不具有单调性。再如“区域人均受教育水平”,其本质上是一种区域的客观存在,是区域发展地理意义的表现。
3.3 数据的连续性
每一个区域评估指标原则上都是连续数值型变量,这样可以应用一般统计分析技术、计算技术进行操作。
3.4 数据的可获得性
考虑到要对每个区域的艰苦边远程度进行确定,这就需要确保所选指标的可获得性,数据可获得性反映了区域状态具有一定的稳定性,稳定的结果可以保证指标评价体系的公平性。
3.5 尊重长期工作经验
地方工作人员或长期从事艰苦边远地区津贴发放工作,或本身在艰苦边远地区工作,他们对不同地区艰苦边远性的差异有着切身的体会,对当地主要的艰苦边远性特征有着深刻的认识,这对于认识地方艰苦边远性的偏序关系十分重要,可以用这些经验检验数据挖掘的可靠性。当然,由于地方利益的存在,“艰苦边远指标”的认定要审慎、客观地对待地方干部的经验,既要予以充分重视,又不能完全依赖,更不能熟视无睹。
4 最优化的数据挖掘
4.1 区域状态的计算
由公式(2)可见,计算分析艰苦边远性指数需要两个基础,第一个基础是获得艰苦边远地区的状态变量。根据地理本性学说和普通地理学知识,王铮等[18-19]选择了以下10个因素:合成海拔[20]、地表崎岖度[21]、人生气候指数[22]、水资源适宜度[23]、农业生产潜力[24]、自然灾害性因子[2]、区位指数[25]、交通指数[26]、人文发展指数[3]、信息化水平[27],其中第1到第6个因素属于第一(次)地理本性,第7和第8因素是第二(次)地理本性的,第9和第10个因素是属于第三(次)地理本性的,关于这些特征能够反映地理本性的认识是基于地理学理论研究的[28⇓-30]。表1给出了根据理论分析选择的艰边因子,这些因子状态(地理要素)又根据地理科学原理由某些可观察的基本变量的函数进行表达。
表1 艰苦边远性要素合成原理
Tab. 1
| 地理学本性 | 地理要素 | 具体指标的内容 | |
|---|---|---|---|
| 艰苦边远性多 层次综合指标 | 地理学第一(次)区域本性 | 合成海拔 | 平均海拔 |
| 县城海拔 | |||
| 纬度按热量带折合海拔 | |||
| 地表崎岖度 | 地质基础 | ||
| 特殊岩性分布比重 | |||
| 平均坡度 | |||
| 单位距离上高程均方差 | |||
| 人生气候指数 | 温度 | ||
| 湿度 | |||
| 纬度 | |||
| 风速 | |||
| 太阳高度角 | |||
| 水资源适宜度 | 湿润度 | ||
| 流域降水量 | |||
| 分级河流长度 | |||
| 喀斯特分布 | |||
| 农业生产潜力 | 水分有效系数 | ||
| 大于10 °C积温 | |||
| 年总辐射量 | |||
| 土壤性质 | |||
| 自然灾害性因子 | 地方病(如克山病) | ||
| 50年台风过境次数 | |||
| 地震 | |||
| 地理学第二(次)区域本性 | 区位指数 | 空间作用势采用指数衰减势[31] | |
| 交通指数 | 公路可达性 | ||
| 铁路可达性 | |||
| 航空可达性 | |||
| 地理学第三(次)区域本性 | 人文发展指数 | 人均受教育年限 | |
| 人均财政收入 | |||
| 人均预期寿命 | |||
| 信息化水平 | 信息设施 | ||
| 信息产业 | |||
| 信息载体发展水平 | |||
| 互联网 |
为了保证计算的科学性和数据挖掘的稳定性,技术上对计算获得的地理要素值作了预处理。预处理的目的是将因子可能取值的表达形式尽可能划为正态分布,这里可能需要某种变换,这种处理是为了统计计算的合理性和最后分类时可以利用统计判断的贝叶斯准则。预处理采用标准差标准化,这样可以消除不同指标间量纲、量级的差异。预设艰苦边远特征数据是服从正态分布原理的,这是因为实践证明,艰苦边远性因子的取值是受到多种因素共同影响,没有哪几个因素是决定性的。例如决定农业生产潜力的因素有太阳辐射量、土地环境温度、土壤含水量、土壤养分、光合作用强度等,而这些因素背后又有日照模式、土壤类型、母岩成分等特性。标准化处理使地方艰苦边远性的确定放到全国总体样本中去考虑得以实现,所以各因子数据可被认为是服从正态分布的,这是中心极限定律成立的条件,也是最终可以确定地方艰苦边远性在全国相对位置的基础。
本文采用标准差标准化方法,使得各因子的全国平均水平为零。标准化后数值表示各县(市、旗)在全国的相对位置。标准差标准化公式如下:
式中:xij是i地方的第j个艰苦边远特征;sj是总体j特征的标准差;
标准差标准化的目的是计算中引用主成分分析的系数时不受量纲的影响。
4.2 区域地理环境要素
重写(4)式为:
式中:αij是i地方j因素的权重。这就由因子状态xij定义了一种区域i的地理关联性关系。这里有两个关键:第一是地理因子权重αij,它相当于因子重要性的弹性,另外一个是因子本身状态值xij。因子状态是由许多基本变量按某种物理或地理原理复合计算出来的,如人生气候指数
表1是中国艰苦边远性指标合成的结构原理,从中可以理解,对于一般艰苦边远性的研究,首先需要对区域的艰苦边远性做实地考察。选定某些典型区作为样本区域,邀请样本区相关研究人员和公众,就他们对本地区的艰苦边远性在不考虑寿命影响的条件下做一个偏序(即重要性排序)估计。对于人均预期寿命,由于具有可测性,因此建立人均预期寿命与艰边因子的关系统计。接下来,选择有理论表述的状态作为合成艰苦边远性指数计算的函数基,这些函数实际上有明确的地理、物理或者经济意义,在数学意义上构成BANACH空间的函数基,只不过它们未必直接表征了艰苦边远性。
本文选定了除特殊因子(自然灾害性因子)以外的9个表达作为泛函空间的函数基(表1),这9个函数的表达是根据地理学理论与经验认识提出的可测量因子复合计算出来的,这样就在某一个样本点(区域)获得一组数据,相当于样本空间是一个矢量。用主成分分析方法计算这些因子为BANACH空间的基,获得矢量组的空间主成分,采用主成分分析是为了避免因子的交叉作用。主成分特征量的存在,说明这些因子在某个方面存在统一性表现,而且压缩了变量;结构中有几个空间主成分,即说明艰苦边远性在几个方面有表现,而不是原来理论和经验上认为有关系的9个方面。
主成分分析获得的特征变量对应的因子系数与各个主成分的贡献相乘,得到这些因子对艰苦边远性可能的贡献或重要性的度量。其原理就是,如果主成分空间有3个,即从张成区域空间的地理本性看,区域本性本质特征是3个,对应主成分每个特征的重要性,就是每个特征向量的贡献率(对应每个特征的贡献作用,也就是对应某个主成分系数和地理函数的贡献率修正)。通过对区域的地理特性的主成分分析,分别获得区域内生的地理本性以及相应区域外生的地理本性。从主成分系数,反演出各地理因子对应的权重基数αK为生产要素的弹性系数,并计算获得K个主成分,说明区域系统有9个因子可合成K类艰边因子。
统计分析发现,区域总体综合性因素个数K约为3,这与地理学认识到的存在3个区域地理学本性特征一致。分别是先天的第一(次)区域地理学本性,如合成海拔、农业生产潜力,第二(次)区域地理学本性,如区位、交通,以及人类创造的第三(次)区域地理学本性,如信息化水平等。从地理学本质上看,这是区域生产力的本性特征。公式(2)刻画的机制是全面认识区域生产力的基础,即一个区域的生产要素除了资本、人力资本和技术水平以外,还存在区域地理环境资本(Ei)。通过实验和观察Ei的范畴,在区域管理意义上存在前述公式(3)的关系:
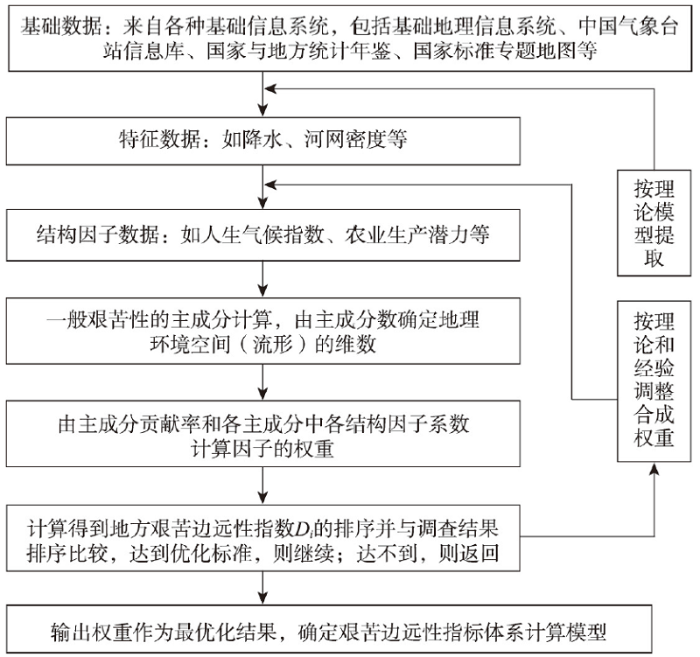
对每个因子权重基数进行归一化处理,得到各个地理因子的初始权重。该“初始权重”是由标准化因子计算艰苦边远综合指数Di的权重,这是一种原理性的理解。之后以试错法进行试验性的排序探索,即按公式(8)计算出艰苦边远性指数Di,将该Di的取值排序与实际调查典型区获得的经验认可的地区艰苦边远性排序比较,如果二者排序一致,即认为获得的权重合理,接受实验的权重;如果不一致,则需要修改各地理因子的权重或者函数表达,甚至返回函数构成,从原理上调整因子,从而调整排序。最终根据函数计算获取的区域艰苦边远性实验排序逼近艰苦边远地区专家经验排序(实地工作者排序),在误差最小的情况下确定指标体系应该采取的权重。需要提醒的是两者比较的是排序结果而不是艰苦边远性的精确值,这是因为对于区域艰苦边远性,人类能够感受的是排序而不是数值。如人们的经验感觉是西藏阿里比拉萨艰苦,但是却不能感觉出二者艰苦差别的具体程度。另外,修改因子而不是增添因子,修改地理因子与构成变量的函数关系,从而重新计算因子取值,进而得到艰苦边远性权重,类似地重复计算区域艰苦边远性对应的数值结果,直至获得的计算排序结果与调查的典型区各地经验排序一致,则认为最终的计算结果合理,以上为确定权重的完整过程。图1是简化的计算流程,这个过程实际上是以经验排序和人机交互排序差别最小为目标④(④国家人社部排序评估,第一步主要是邀请了新疆、宁夏、青海、黑龙江、吉林、云南、四川、广西、海南等地人事厅的同志以他们日积月累的经验为基础作了第一次评估,然后又分别听取各地有关部门公务员(含教师)对本地排序的评估意见,其中第二次评估还要求评估者提出指标函数的修改处及修改理由。)。
图1
4.3 权重计算算法及其验证
表2 艰苦边远性要素主成分分析
Tab. 2
| 成分 | 初始特征值 | 提取载荷平方和 | 旋转载荷平方和 | ||||||||
|---|---|---|---|---|---|---|---|---|---|---|---|
| 总计 | 方差百分比(%) | 累积(%) | 总计 | 方差百分比(%) | 累积(%) | 总计 | 方差百分比(%) | 累积(%) | |||
| 1 | 3.655 | 40.614 | 40.614 | 3.655 | 40.614 | 40.614 | 2.574 | 28.600 | 28.600 | ||
| 2 | 1.765 | 19.609 | 60.223 | 1.765 | 19.609 | 60.223 | 2.285 | 25.389 | 53.989 | ||
| 3 | 1.002 | 10.879 | 71.102 | 1.002 | 10.879 | 71.102 | 1.540 | 17.113 | 71.102 | ||
| 4 | 0.901 | 10.015 | 81.117 | ||||||||
| 5 | 0.624 | 6.932 | 88.049 | ||||||||
| 6 | 0.466 | 5.178 | 93.227 | ||||||||
| 7 | 0.348 | 3.866 | 97.093 | ||||||||
| 8 | 0.142 | 1.575 | 98.668 | ||||||||
| 9 | 0.120 | 1.332 | 100.000 | ||||||||
表3 艰苦边远性要素主成分分析成分矩阵
Tab. 3
| 成分 | |||
|---|---|---|---|
| 1 | 2 | 3 | |
| 合成海拔 | 0.889 | 0.239 | 0.183 |
| 地表崎岖度 | 0.325 | 0.169 | 0.813 |
| 人生气候指数 | 0.217 | 0.074 | 0.819 |
| 水资源适宜度 | 0.745 | 0.173 | 0.291 |
| 农业生产潜力 | 0.194 | 0.386 | 0.249 |
| 区位指数 | 0.760 | 0.433 | 0.069 |
| 交通指数 | 0.583 | 0.527 | 0.003 |
| 人文发展指数 | 0.279 | 0.878 | 0.084 |
| 信息化水平 | 0.209 | 0.883 | 0.126 |
由主成分分析获得的一般艰苦边远性对艰苦边远综合指数的特征贡献率为71.1%,其剩余的贡献率需要考虑人均预期寿命所反映的艰苦边远性特征,因为人均预期寿命权重涉及人们的人生价值观,十分复杂。本文以合成海拔、地表崎岖度、人生气候指数、水资源适宜度、农业生产潜力、区位指数、交通指数、人文发展指数和信息化水平9个因子作为基本地理因子,对分省人均预期寿命进行回归(表4),由此估计出艰苦边远因子与人均预期寿命的关系。回归分析结果的调整R2为0.886,其中合成海拔和农业生产潜力二项艰边因子通过假设检验,本文将通过假设检验的合成海拔和农业生产潜力两项艰边因子与人均预期寿命的回归系数(标准化系数分别为0.719和0.457,调整R2为0.756)作为艰苦边远性权重计算的调整基础,从而获得9个艰苦边远的权重。为了验证因子分析和回归分析的有效性,选取了青海等省各县市为典型考察区域,且课题组做了多次实地考察。
表4 艰苦边远因子与人均预期寿命回归分析
Tab. 4
| 未标准化系数 | 标准化系数 | t值 | 显著性 | |
|---|---|---|---|---|
| (常量) | 74.910 | 0.000 | 447.480 | 0.000*** |
| 合成海拔 | 1.446 | 0.535 | 2.620 | 0.016** |
| 地表崎岖度 | 0.269 | 0.100 | 0.960 | 0.350 |
| 人生气候指数 | 0.491 | 0.182 | 1.960 | 0.164 |
| 水资源适宜度 | 0.057 | 0.021 | 0.200 | 0.844 |
| 农业生产潜力 | 0.546 | 0.202 | 2.080 | 0.050* |
| 区位指数 | 1.017 | 0.376 | 1.320 | 0.201 |
| 交通指数 | 0.942 | 0.349 | 1.930 | 0.167 |
| 人文发展指数 | 0.342 | 0.126 | 0.470 | 0.643 |
| 信息化水平 | 1.101 | 0.407 | 1.560 | 0.133 |
注:*p < 0.1,**p < 0.05,***p < 0.01。
基于此,3个主成分矢量可以分别用描写地理环境特征的函数基线性标出。主成分的每个函数基前面的旋转载荷方差百分比对应于艰苦边远性综合指数Di的贡献率,由此获得一般艰苦边远性的权重值,再将通过假设检验的回归分析标准化系数对其进行校正。主成分分析结果解释了艰苦边远性71.1%的特征贡献量,剩余特征贡献量由人均预期寿命与艰边因子的关系统计。将9个函数基的权重基础归一化,就得到9个函数基(艰苦边远性)理论权重。通过理论研究和实地考察调研的结果,按照图1所示的艰苦边远性的计算流程进行迭代调整,以经验排序和人机交互计算排序差别最小为目标,最终获得如表5所示的艰苦边远权重表。各区域考察获得的特征量与相应的权重相乘,即可得到区域的艰苦边远性评价。
表5 地理要素权重表
Tab. 5
| 地理要素 | 权重 | 备注 |
|---|---|---|
| 第一地理本性 | 0.694 | |
| 合成海拔 | 0.265 | 合成了区域的高程海拔与纬度地带性 |
| 地表崎岖度 | 0.093 | 计算包括地面坡度与地形起伏 |
| 人生气候指数 | 0.069 | 关于人类在野外环境生活的舒适度 |
| 水资源适宜度 | 0.118 | 按水资源的丰硕度及洪涝风险计算 |
| 农业生产潜力 | 0.149 | 采用黄秉维农业生产潜力模型计算[24,32] |
| 自然灾害性因子(地质条件与灾害) | 定性评估:在做区域评估时,对危害性经验赋分 | 包括地震、台风、地方病等 |
| 第二地理本性 | 0.167 | |
| 区位指数 | 0.088 | 距中心城市的威尔逊距离及距国界邻边境位置等 |
| 交通指数 | 0.079 | 包括公路、铁路及航空可达性 |
| 第三地理本性 | 0.139 | |
| 人文发展指数 | 0.071 | 包括人均受教育年限、人均财政收入等 |
| 信息化水平 | 0.068 | 包括信息设施、信息产业等 |
注:自然灾害性因子对区域发展的贡献以负分另外计算。
通过研究得到了中国艰苦边远地区数据挖掘的权重,按照该权重对中国各县(市、旗)的艰苦性排序(表5)。最终全国县级行政单位被划分为7种艰苦边远性类型,其中零类为区域发展基础较好的类型,不享受艰苦边远地区津贴。
研究发现,在第一本性因子中,合成海拔权重最大,其次是农业生产潜力,第三位是水资源适宜度,再其次是地表崎岖度,最后是人生气候指数;第二本性因子中区位指数权重高于交通指数;第三本性因子中人文发展指数权重略高于信息化水平。总的来说,反映含氧量变化对人类健康产生影响的海拔因素是构成艰苦边远性指标最重要因子,而农业生产潜力和水资源适宜度客观反映了各区域的基础物资生产和供应能力,由此成为重要的艰苦边远性影响因子。第二本性和第三本性因子的改善虽然能够在一定程度上缓解各区域的艰苦边远性程度,但是其影响是相对有限的,就缓解各区域艰苦边远性而言,第二本性因子的重要性要高于第三本性因子。
5 结论与讨论
1978年改革开放以来,中国区域发展迅速、成就瞩目,但各区域发展基础不同,区域发展不平衡现象依然存在。为了体现国家对艰苦边远地区的政策倾斜,补偿艰苦边远地区工作人员的额外劳动付出,引导人才合理流动,国家设立了艰苦边远地区津贴制度。结合国家任务即中国艰苦边远地区辨识,本文以中国艰苦边远地区类别划分标准及其应用为例,探讨了区域发展基础评估问题。
(1)基于区域产出与区域要素特征之间的关系,从自然地理环境、交通区位、社会发展等方面界定了地理学三大本性内涵,科学地构建了区域发展基础的评价指标体系,为区域管理政策制定提供了理论参考和现实依据。相较于仅依赖主观赋权或平等赋权的方法,本文采用最优化数据挖掘方法,将实地考察的经验判断与主成分分析相结合,精确地评估了各指标的权重,更具有科学性和合理性。
(2)在现代区域发展中,第一本性依赖的第一类地理要素贡献率接近70%,第二本性依赖的第二类地理要素的贡献率约为17%,引发第三次产业革命的第三类地理要素贡献率约为13%。验证了第一本性的地理要素在区域发展中发挥了重要作用,意味着区域发展面临第一本性地理要素的锁定效应和地理工程改造的必要性,要实现区域创新发展就要依赖三个地理本性的进化作用。
(3)区域发展系统具有复杂性,尽管本文基于地理视角所构建的指标体系能够科学反映区域发展的内涵,但是区域发展具有动态性,特别是对于人口聚集水平等区域的第二地理学本性内容,以及人口社会发展水平等区域的第三地理学本性,其推动区域发展的动力学机制还需要进一步探索。
致谢
$\boxed{\hbox{王远飞}}$、刘丽、李山、薛俊波、刘筱、张焕波、毛可晶、周莉萍、仇泸毅、王勔追等参加了研究的实地考察;杨念、利果、汪晶、王魁、花卉、刘涛、闫阁、孙翊、廖悲雨、余惠强等参加了本文的数据计算;两位审稿专家的意见很有参考价值,特此一并深表谢意。
参考文献
Time to stop celebrating the polluters
The human sustainable development index: New calculations and a first critical analysis
DOI:10.1016/j.ecolind.2013.10.020 URL [本文引用: 1]
Study on the indicators of regional sustainable development
DOI:10.11821/xb199802007
[本文引用: 1]

Problems of indicator for regional sustainable development have theoretical, practical and technical properties. All indicators proposed only from one part of theoretical analysis, and practical application or technical design have some specified limitations. Indicators of regional sustainable development are a sign of the level of men’s understanding. So, indicators of regional sustainable development should be an indicator system of regional economy, society, resources and environment, and it can be used to describe the state of regional sustainable development, to monitor the process of regional sustainable development, to show the prospects of regional sustainable development, and to judge the quality of regional sustainable development. On the basis of summarizing indicator studies for sustainable development, this paper presented an indicator system of man land interactive potential consisting of the bearing capacity of natural resources, the latent capacity of social resources and the social economic capacity of natural environment. There are many studies and ripe methods on the natural resources dimension. On the natural environment dimension, the studies are still in the stage of theoretical research, and the next stage should be practical research. The input output potential belongs to social resource dimension, its measuring method is a key link in the theory and practice of regional sustainable development. Henan Province is a complex regional system, its social economic level and conditions of resources and environment are representative in China. Taking Henan Province as a case, this paper gives a method of measuring regional input output potential, and discusses the analysis and application of this indicator in the sustainable development of Henan Province supported by GIS. The results indicate that input output potential is an effective indicator of measuring the level, capacity and prospects of regional sustainable development, these analysis methods of indicators can be used for other regions by the support of GIS.
区域持续发展的指标研究
DOI:10.11821/xb199802007
[本文引用: 1]
区域持续发展指标问题具有理论、应用和技术三重性。本文在总结、概括已有指标的基础上,提出了区域人地相互作用潜力三维指标体系,通过这一潜力空间来综合测度区域持续发展的水平、能力和前景。最后以河南省为例,就该指标体系中的投入产出潜力分量进行了较全面的分析和应用。
Discussion on the establishment of regional development planning index system
区域发展规划指标体系建立方法探讨
Establishment and application of human settlements environment index model (HEI) based on GIS
DOI:10.11821/xb200812010
[本文引用: 1]
<p>With the degeneration of environment and acceleration of urbanization, human settlements have attracted great attention worldwide. For the necessity of natural environment evaluation of human settlements, by choosing terrain, land cover, climate and water condition as the evaluation factors, based on Geographic Information System technique, this paper sets up the human settlements environment index (HEI) model and evaluates the natural environment suitability of human settlements in China with it. The results show that: the HEI of China decreases from southeast to northwest in general, which reflects the regional difference of natural environment suitability of human settlements in China; and HEI is significantly correlated with population density at grid size and the R2 value for them amounts to 0.87, which indicates that natural environment suitability of human settlements has a significant influence on population distribution. From southeast to northwest and from hilly regions and plains to plateaus and mountainous areas, the natural environment suitability of human settlements in China decreases in general. Specifically, the high suitable region, with a land area of 95.92×10<sup>4</sup> km<sup>2</sup> and a population of 380 million, is mainly located in Southeast Hilly Region and most parts of the middle and lower reaches of the Yangtze River; most parts of Yunnan-Guizhou Plateau and Sichuan Basin, Guanzhong Basin and southern part of North China Plain belong to the moderate suitable region, accounting for 1/6 of a land area and one half of population of China; with a land area of 167.78×10<sup>4</sup> km<sup>2</sup> and a population of 226 million, the low suitable region mainly includes Northeast China Plain, northern part of North China Plain and Loess Plateau; eastern part of Tibetan Plateau, Junggar Basin and Inner Mongolia Plateau belong to the critical suitable region, covering a land area of 225.11×10<sup>4</sup> km<sup>2</sup>, and 41 million people live in this region; and the non-suitable region mainly includes most parts of Tibetan Plateau, Tarim Basin and Alex Plateau, where the land area is 304.42 km<sup>2</sup>, but there are only 2.49 million people. From the high suitable to the non-suitable region, the land area increases with the decrease of population density, indicating that the population in China is mainly concentrated in natural environment suitable region.</p>
基于GIS的中国人居环境指数模型的建立与应用
China's multidimensional poverty measurement and its spatiotemporal interaction characteristics in the perspective of development geography
DOI:10.11821/dlxb202008006
[本文引用: 1]
Exploring the poverty supervision evaluation indicator system and the dynamic characteristics of spatio-temporal interaction of poverty among regions are of great significance to the current research on sustainable poverty reduction in China. From the perspective of development geography, this paper introduces panel vector autoregressive (PVAR) model and identifies poverty-causing and poverty-reducing factors in China in combination with human development approach and global indicator framework for the SDGs, so as to measure multidimensional poverty index. Then it uses exploratory spatio-temporal data analysis (ESTDA) method to reveal the spatio-temporal interaction characteristics of multidimensional poverty. The results show that: (1) The poverty-causing factors of China's current poverty monitoring and evaluation include the crop-to-disaster ratio and social gross dependency ratio, the poverty-reducing factors include per capita GDP, per capita social security expenditure, per capita public health expenditure, number of hospitals per 10,000 persons, participation rate of new rural cooperative medical scheme, vegetation coverage, per capita education expenditure, number of universities, per capita scientific research and experimental development (R&D) expenditure, and per capita funding for cultural undertakings. (2) From 2007 to 2017, provincial income poverty, health poverty, cultural poverty and the multidimensional poverty have been significantly improved, with the national comprehensive poverty level declining by an average of 5.67% annually, and the poverty of different dimensions in some provinces is differentiated. (3) During the study period, the local spatial pattern of multidimensional poverty between provinces had strong spatial dynamics and showed an increasing trend from the eastern region to the central and western regions; the multidimensional poverty index among provinces shows a strong spatial dependence over time, forming a pattern of decreasing from the northwestern and northeastern regions to the surrounding areas. (4) The spatio-temporal network of multidimensional poverty interaction in neighboring provinces is mainly negatively correlated with Shaanxi and Henan, Shaanxi and Ningxia, Qinghai and Gansu, Hubei and Anhui, Sichuan and Guizhou, and Hainan and Guangdong, forming spatially strong cooperative poverty reduction relationships. The research results have important reference value for the current implementation of China's strategy on targeted measures in poverty alleviation, especially the prevention of poverty-returning after 2020.
发展地理学视角下中国多维贫困测度及时空交互特征
DOI:10.11821/dlxb202008006
[本文引用: 1]
探索贫困监测评估指标体系及区域间贫困时空交互动态特征对当前中国可持续减贫研究具有重要意义。基于发展地理学视角,引入面板向量自回归(PVAR)模型并结合人类发展分析路径与SDGs全球指标框架识别影响中国贫困的致贫和减贫因素,以此测度多维贫困指数,进而采用探索性时空数据分析(ESTDA)方法揭示多维贫困的时空交互特征。结果表明:① 中国当前贫困监测评估的致贫因子包括农作物受灾比和社会总抚养比,减贫因子则涉及人均GDP、人均社会保障支出、人均公共卫生支出、每万人医院数、新型农村合作医疗参合率、植被覆盖率、人均教育支出、高校数量、人均科学研究与试验发展支出、人均文化事业经费。② 2007—2017年中国省域收入贫困、健康贫困、文化贫困及多维贫困状况得到显著改善,全国综合贫困程度年均下降5.67%,部分省域的不同维度贫困内部出现差异化。③ 研究期内省域间多维贫困局域空间格局表现为较强的空间动态性,并呈现由东部向中、西部增大的变化态势;省域间多维贫困指数随时间演变呈现强的空间依赖关系,形成以西北和东北为高值区向四周递减的变化格局。④ 邻接省域多维贫困交互的时空网络以负向关联为主,仅有陕西与河南、陕西与宁夏、青海与甘肃、湖北与安徽、四川与贵州、海南与广东形成空间上较强的减贫协同关系。研究成果对当前中国精准扶贫战略实施尤其是2020年后预防返贫具有重要的参考价值。
Assistance funds and special funds in Xinjiang during the Qing Dynasty
清代新疆的协饷和专饷
Geographic spatiotemporal data analysis methods
DOI:10.11821/dlxb201409007
[本文引用: 1]
Following the emergence of large numbers of spatiotemporal datasets, the literatures related to spatiotemporal data analysis increase rapidly in recent years. This paper reviews the literatures and practices in spatiotemporal data analysis, and classifies the methods available for spatiotemporal data analysis into seven categories: including geovisualization of spatiotemporal data, time series analysis of spatial statistical indicators, coupling spatial and temporal change indicators, detection of spatiotemporal pattern and abnormality, spatiotemporal interpolation, spatiotemporal regression, spatiotemporal process modelling, and spatiotemporal evolution tree. We summarized the principles, input and output, assumptions and computer software of the methods that would be helpful for users to make a choice from the toolbox in spatiotemporal data analysis. When we handle spatiotemporal big data, spatial sampling appears to be one of the core methods, because (1) information in a big data is often too big to be mastered by human physical brain, so has to be summarized by statistics understandable; (2) the users of Weibo, Twitter, internet, mobile phone, mobile vehicles are neither the total population nor a random sample of the total population, therefore, the big data sample is usually biased from the population, and the bias has to be remedied to make a correct inference; (3) the data quality is usually inconsistent within a big data, so there should be a balance between the variances of inferences made by using data with various quality and by using small but high quality data.
地理学时空数据分析方法
DOI:10.11821/dlxb201409007
[本文引用: 1]
随着地理空间观测数据的多年积累,地球环境、社会和健康数据监测能力的增强,地理信息系统和计算机网络的发展,时空数据集大量生成,时空数据分析实践呈现快速增长。本文对此进行了分析和归纳,总结了时空数据分析的7类主要方法,包括:时空数据可视化,目的是通过视觉启发假设和选择分析模型;空间统计指标的时序分析,反映空间格局随时间变化;时空变化指标,体现时空变化的综合统计量;时空格局和异常探测,揭示时空过程的不变和变化部分;时空插值,以获得未抽样点的数值;时空回归,建立因变量和解释变量之间的统计关系;时空过程建模,建立时空过程的机理数学模型;时空演化树,利用空间数据重建时空演化路径。通过简述这些方法的基本原理、输入输出、适用条件以及软件实现,为时空数据分析提供工具和方法手段。
Framework foundation and prototype construction of process geographic information system
过程地理信息系统框架基础与原型构建
First nature, second nature, and metropolitan location
DOI:10.1111/jors.1993.33.issue-2 URL [本文引用: 2]
Research on geographical elements of economic difference in China
DOI:10.11821/yj2009020017
[本文引用: 1]
<p>Much research has been done on the effect of geographical elements on economic difference throughout the world. Furthermore, based on the theory of two nature of metropolitan location proposed by Krugman, as well as the theory of human-land relationship and comparative advantages, this paper presents three geographical elements that affect economic differences. The first geographical element includes natural environment, i.e., elevation, slope, undulating topography, human climate index, water resource index, and potential agricultural production; the second consists of traffic and location, which are represented by transport facilitation and economic position respectively; and the third contains human capital and R&D level, respectively represented by years of schooling and the number of patents. Supported by Arcgis 9.0 software, this paper, through modeling, analyzes the impact of various geographical elements on economic difference within the whole country and three major regions. The result shows that the geographical environment plays an increasingly important role in economic development. In addition, it extends the knowledge of Sachs et al. about geographical elements of economic development. At present, China's economy is in transition. Among all geographical elements, the great one affecting economic difference is transport facilities index, reaching 0.374. So more capital should be injected in infrastructure construction in the future.</p>
中国区域经济差异形成的三次地理要素
Increasing returns and economic geography
DOI:10.1086/261763 URL [本文引用: 1]
A big-data analysis of HU Line existence in the ecology view and new economic geographical understanding based on population distribution
胡焕庸线存在性的大数据分析: 中国人口分布特征的生态学及新经济地理学认识
Evaluation of the influence of plateau on human healthiness in China
我国高原健康环境评估
Climate suitability index for city tourism in China
Climate is the main factor in tourism development This article used the human climate suitability index to evaluate the climate suitability of cities,including the THI(temperature humidity index)、K(index of wind effect ) and ICL (index of clothing). Firstly,the article calculated the value and the bias value of the human climate suitability of 44 cities in China,and analyzed the suitable duration and the change of the index value and the bias value of the human climate suitability. Then it was found that there were 19 cities with five suitable months and few cities with too long or too short suitable duration. According to the climate suitability duration and the distribution of suitability months,the article classified the climate suitability duration into three classes and two types. Secondly,the comfortable seasons are spring and autumn,the comfortable months are April and October for most places except the tropical ones. In summer,the climate tends to be heated bias,particularly in Haikou,where the bias reaches the maximum,and the comfortable places are Lijiang,Kunming and so on. In winter,the climate tends to be cold bias,particularly in Harbin,where the bias value reaches the maximum,but in the tropical or subtropical places people feel comfortable. Lastly,to evaluate the overall climate condition of the cities,the article classified 44 cities into five clusters by means of Kohonen neural network self-organization in Matlab. The results show the fist class,with the highest climate suitability bias,is comfortable in summer and suitable for tourism. People should prevent coldness in the other seasons,particularly in winter,but the special cold in the north can attract people to travel. The second class is comfortable in winter,most of which are coastal cities and suitable to travel. The third class,with the average bias level,has the comfortable seasons of summer and winter,The forth class,with the lowest bias level,is cool in summer and warm in winter,and the overall climate is comfortable,so the cities included have the climate advantage to develop tourism. The fifth class,where is hot in summer and cold in winter,must make full use of the comfortable spring and autumn and develop the particular tourism resource in order to improve the regional tourism competition.
中国城市旅游气候舒适性分析
气候是影响人们旅游活动的重要因子。本文选取了人生气候舒适指数来衡量城市旅游气候的舒适性,该指数包括温湿指数、风效指数、着衣指数。首先,计算了全国44个城市的人生气候舒适指数以及偏离度,分析了旅游气候舒适期,发现其中19个城市舒适气候期是5个月,舒适期过短或者过长的城市都较少。按照舒适期的长短以及舒适月分布的连续性,将舒适期分为3类2型。其次,从季节上看,春秋季节特别是4月、10月,除热带地区外的全国大部分地区气候都较适宜。夏季,全国大部分地区气候发生热偏,以海口气候偏离度最大,丽江、昆明、拉萨等气候都相对比较适宜,可以成为人们避暑的选择地;而冬季,全国大部分地区气候发生冷偏,以哈尔滨气候偏离度最大,地处亚热带、热带地区的城市人生气候感觉舒适。最后,为评价各城市的气候综合状况,利用各人生气候指数偏离度,通过Kohonen神经网络方法,将44个城市分成5类。
Spatiotemporal variation in reference evapotranspiration and its contributing climatic factors in China under future scenarios
DOI:10.1002/joc.v40.8 URL [本文引用: 1]
China 2050: Climate scenarios and stability of Hu-Line
中国2050: 气候情景与胡焕庸线的稳定性
The anylysis of traffic convenience on county level based on GIS
基于GIS的中国县级尺度交通便利性分析
Research on information evaluation system at home and abroad
国内外信息化评估体系研究
Evolution of land differentiation in Chinese mainland
DOI:10.11821/yj2012120001
[本文引用: 1]
In this paper,on the basis of three natures which determine Chinese spatial heterogeneity, further analysis of the role of three natures on the regional development and evolution is done in the point of view of evolutionary economic geography.The first nature which determines the spatial lock of Chinese agriculture-the Line of Qinling Mountain-Huaihe River and the Great Wall plays a leading role in the first industrial revolution(Agricultural Revolution).When times transferred from the agricultural society to industrial society,the second nature composed of transportation and infrastructure increasingly contributed to the regional economic development. The original spatial lock was broken.The central cities locked the basic spatial structure.Center- Hinterland structure can be found in the region.The third nature promotes regional structural variation.The structure of Hub-Network is created.The path dependence of three natures can be observed significantly,which means the second nature is initially driven by the first nature,and the third nature is initially driven by the first and second natures.In the process of regional evolution, Hu Huanyong Line,which is a famous geographical boundary in China,has not been broken.The Hu Huanyong Line has become the basic lock of regional development in China.
中国空间结构分异的进化
