

1 引言
2 青藏高原氧含量测定及影响因素
氧气在生物地球化学循环中扮演着不可替代的角色。青藏高原平均海拔4000 m以上,空气稀薄,生态环境极为脆弱,缺氧是极其重要的环境风险因子之一。然而,一直以来鲜有开展氧含量监测及其变化分析研究。第二次青藏高原综合科学考察从地球表层系统的角度出发,通过对青藏高原地理环境与生态系统的综合考察研究,在青藏高原部署了“7横5纵”的综合科考路线和9处定点观测小区。
2.1 氧含量的测量
2017—2022年科考小分队在青藏高原开展了14次路线/样点式的野外科考测量(图1),共计得到807个测量点的地理环境数据,并利用地表覆盖大样方(1 km×1 km)测量得到青藏高原51个测量点的地表覆盖度。
图1
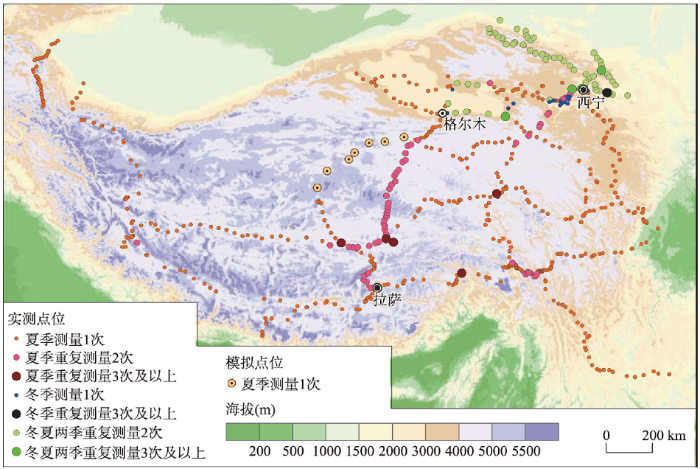
图1
2017—2022年夏季、冬季青藏高原氧含量科考采样点分布
Fig. 1
Samples distribution for scientific research on oxygen concentration on Qinghai-Tibet Plateau in summer and winter from 2017 to 2022
2.2 氧含量与影响因素
2.2.1 地理位置与海拔
2018—2020年实测氧含量数据表明,青藏高原氧含量随经度/纬度的增大均呈现波动的状态。2018—2020年所有夏季测点,其海拔与氧含量呈显著的负相关关系(n = 369、R2 = 0.7367、p < 0.001)。从平均值看,海拔每上升1000 m,夏季的地表氧含量下降约0.15%[7]。
2.2.2 气候因素
为进行青藏高原野外观测的对照观测,以定量分析影响青藏高原氧含量的各种地理要素,于2019年3月—2020年2月在北京房山对太阳总辐射和光合有效辐射进行了观测。房山站观测结果表明,光合有效辐射与日间总辐射、气温呈显著的正相关(R2分别为0.9881、0.5286,p < 0.001),日间平均光合有效辐射每增加100 μmol (m2 s)-1,氧含量增加约0.12%。2018—2020年青藏高原夏季氧含量与气温呈现显著的正相关关系(n = 369、R2 = 0.5661、p < 0.001),平均温度每上升10 ℃,地表大气氧含量上升约0.21%[7]。从2019年3月—2020年2月所有观测点近16万条的实测数据来看,氧含量与气温呈现显著的正相关关系(R2 = 0.9446,p < 0.001)。
房山站对比观测结果表明,日降水与氧含量的变化没有特别明显的对应关系。房山站夏季较大的降水量一般对应着较低的氧含量,且二者通过了显著性检验(n = 24,R2 = -0.3397,p < 0.005)。在温度相对较高的夏季,白天降水量越大,对应降水时间越长,植被接收的太阳辐射越少,日间平均气温相对越低,可导致较低的氧含量水平。
2018—2020年青藏高原夏季的氧含量与空气相对湿度在统计上呈现显著的负相关关系(n = 369,R2 = -0.0286,p < 0.001),空气相对湿度降低20%,氧含量降低约0.04%。房山站夏季实测氧含量与大气相对湿度呈现出显著的负相关关系(n = 41000,R2 = -0.5489,p < 0.001),其与降水的作用机制类似,生态系统中植被能接收到的太阳辐射越少,光合作用水平降低,导致产氧量也处于较低水平。
2.2.3 植被因素
基于2018—2020年夏季野外采样点获取对应位置的青藏高原夏季植被日均产氧量数据,发现植被日均产氧量与氧含量呈现显著正相关关系,拟合优度R2达到0.2804,且通过了0.001水平的显著性检验(图2)。青藏高原不同植被类型的净初级生产力与氧含量均呈现正相关关系。草地类型净初级生产力与氧含量的相关系数为0.3906(p < 0.001),灌丛荒漠类型净初级生产力与氧含量的相关系数为0.2374(p < 0.05),森林带氧含量测量点受山地垂直地带性空间分异的影响,虽然相关系数为0.2699,但未通过显著性检验(p = 0.1062)[13]。此外,氧含量与GPP、NPP均呈现显著正相关关系,这与氧含量与植被覆盖度、叶面积指数的关系一致,表明在样点尺度上,植被产氧能力越强,氧含量相对越高[14]。
图2
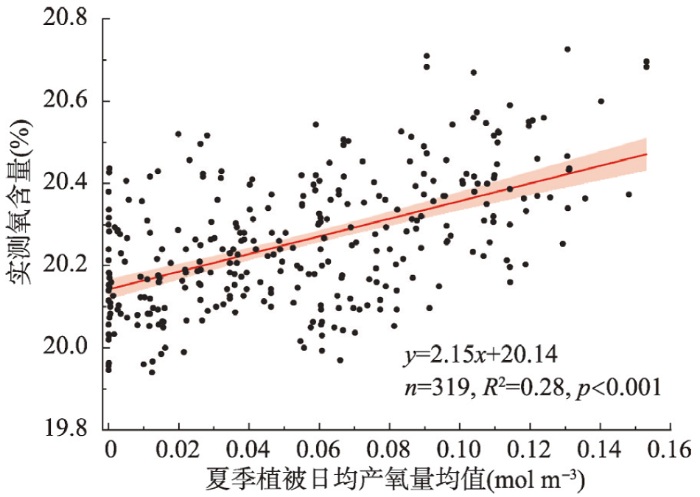
图2
青藏高原夏季植被日均产氧量与实测氧含量关系
注:植被日均产氧量数据测定时间为2019年7—9月;氧含量测定时间为2018—2020夏季;红色线为其函数关系拟合曲线,红色阴影为95%置信区间。
Fig. 2
Relationship between oxygen concentration and average daily oxygen production of vegetation on Qinghai-Tibet Plateau in summer from 2018 to 2020
2.2.4 土壤因素
基于在9处定点观测小区测量的光合作用、呼吸作用等数据,计算了净生态系统生产力(NEP),结果显示NEP均为正值,即均为生态系统碳汇,而氧含量也与NEP呈现显著正相关关系,表明在样点尺度上,碳汇越大,植被产氧能力越强,氧含量相对越高[14],这也间接反映了土壤和植被对氧含量的协同影响。基于2018年青海省碳汇数据[15]与夏季植被日均产氧量均值数据分析显示,青海省格网碳汇数据与夏季植被日均产氧量均值数据呈显著正相关(n = 705665、R2 = 0.14、p < 0.001)。利用2018年1 km ×1 km青海省网格碳汇数据提取的青海省内各采样点对应的氧含量数据,并将二者进行线性拟合,发现二者存在正相关关系,虽未通过显著性检验(n = 93、R2 = 0.0412、p = 0.052),但也在一定程度表明,碳汇越大,氧含量越高;反之,碳汇越小,氧含量越低。
2.2.5 土地利用因素
青海玉树地区冰雪消融区岩漠时空动态变化特征显示,冰雪消融区高原裸地正在不断扩展,玉树地区冰雪消融区裸地面积增加了2450.34 km2,占到全州(含格尔木管辖的唐古拉山镇)面积的2%[18]。此外,过牧与土地超载也是青藏高原裸地增加的一个因素。青藏高原裸地面积占比很大,因裸地区气候普遍寒冷干燥,植被分布稀少,几乎没有产氧。裸地面积占比增大,对生态系统产氧有很大的负面影响。
基于2018—2020年夏季测得的数据,取相关系数法与主成分分析法计算贡献率的均值,得到海拔、气温、叶面积指数对氧含量的相对贡献率分别为-39.58%、35.50%、24.92%[14]。由此认为,可依据氧含量定量展现青藏高原综合自然地理特征的时空格局。
3 青藏高原氧含量时空格局
2017—2022年在青藏高原获取的807组测量点氧含量数据的统计结果表明,不同科考路线/测量点夏季、秋冬季氧含量存在显著差异。基于实测数据构建的夏季(7月)、冬季(1月)青藏高原氧含量呈现出明显的时空差异,并显示突出的东西、南北与高度空间分异规律。
3.1 夏、冬(秋)季差异
表1 不同年份青藏高原夏、冬(秋)季氧含量统计特征
Tab. 1
| 季节 | 年份 | 样本量(个) | 氧含量(%) | 与20.946%的差异 | |||||
|---|---|---|---|---|---|---|---|---|---|
| 最小值 | 最大值 | 平均值 | 标准差 | 显著性水平 | 95%置信区间 | ||||
| 夏季 | 2017 | 65 | 20.37 | 21.67 | 20.72 | 0.26 | 0.001 | 20.65~20.78 | |
| 2018 | 80 | 19.94 | 20.66 | 20.19 | 0.16 | 0.001 | 20.15~20.22 | ||
| 2019 | 113 | 20.02 | 20.78 | 20.37 | 0.16 | 0.001 | 20.34~20.40 | ||
| 2020 | 176 | 19.97 | 20.73 | 20.30 | 0.18 | 0.001 | 20.28~20.33 | ||
| 2021 | 95 | 19.91 | 20.41 | 20.20 | 0.10 | 0.001 | 20.18~20.22 | ||
| 2022 | 186 | 19.47 | 20.82 | 20.38 | 0.31 | 0.001 | 20.34~20.43 | ||
| 冬(秋)季 | 2019 | 53 | 19.98 | 20.43 | 20.16 | 0.11 | 0.001 | 20.13~20.19 | |
| 2021 | 39 | 19.77 | 20.24 | 20.01 | 0.12 | 0.001 | 19.97~20.05 | ||
3.2 科考路线所及三级地貌单元差异
2017—2022年在青藏高原科考路线所及地貌单元主要有青藏高原上的高海拔和高起伏山系,如喜马拉雅山、冈底斯山、唐古拉山、昆仑山、喀喇昆仑山、祁连山、横断山系等;高海拔、低起伏的高平原,如羌塘高原、可可西里高原、江河源区等(多为青藏高原的三级夷平面);中高海拔、低起伏高原盆地,如柴达木盆地、共和盆地、塔里木盆地南缘、四川盆地西缘、滇中盆地西北缘等;高海拔河谷,如雅鲁藏布江、长江上游河谷、黄河上游河湟谷地、澜沧江上游河谷、怒江上游河谷等;中低海拔、低起伏山地丘陵,如滇西北山地丘陵、川西北山地丘陵、甘南丘陵、青东北与甘中部山地黄土丘陵等。在27个三级地貌区中[22],平均氧含量最高的为四川盆地西部洪积冲积平原区,为20.69%,标准差为0.07%;最低为喜马拉雅山极高山高山区,仅为20.17%,标准差为0.14%。
3.3 青藏高原氧含量空间格局
3.3.1 青藏高原氧含量的模拟
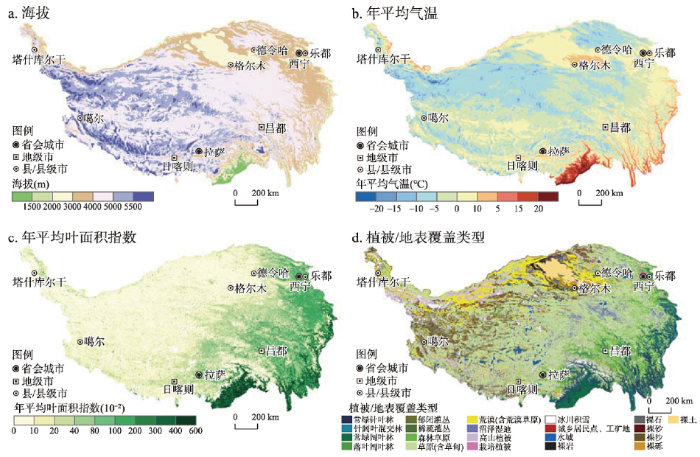
首先对实测的青藏氧含量主要影响因子数据进行标准化,对其分别进行加权求和(以各因子对氧含量的相对贡献为权重),对计算结果(中间量)与实测氧含量进行拟合,得到二者的对应关系式,同时对已有的青藏高原氧含量主要影响因子栅格数据进行标准化,同样对其分别进行加权求和(以各因子对氧含量的相对贡献为权重),得到计算结果(中间量),根据由青藏高原实测数据建立的氧含量与主要影响因子的关系式,可反算得到各格点对应的氧含量。在这一过程中,假定青藏高原氧含量各主要影响因子的作用及其相对贡献保持不变;综合考虑样本量、数据可得性和结果可靠性,实测氧含量使用2018—2020年在青藏高原野外获得的369组数据;氧含量影响因子选取海拔、气温和叶面积指数(图3a~3c);模拟的氧含量在时间上主要考虑夏季(7月)、冬季(1月)和年平均温度[14]。
图3
3.3.2 青藏高原氧含量模拟值的时空格局
首先,年平均氧含量东西分异明显,即东部高于西部,且自东而西,递减明显,从20.68%减少到19.39%,差值为1.29%,东部高值区比西部低值区约高6.65%,这与植被产氧有很大关系(图4d),亦是温湿气候与冷干气候的差异,显示了经度地带性(干湿度地带性)的规律。其次,南北带状更替、东西延伸,东西延绵山脉区自南而北从19.39%增加到19.97%,差值为0.58%(由高海拔到低海拔东西延伸);东西山脉间的河谷、盆地与高平原区,自南向北从20.68%减少到20.06%,差值为0.62%(由低纬度偏高温向高纬度偏低温),高值区比低值区约高3.55%,这与海拔、温度的综合影响有很大关系,亦是高原高寒冰雪气候与寒冷气候的差异,显示了纬度地带性(山脉间低地)与高度地带(山脉区)交替的规律。最后,周边高于腹地,且自低而高,递减明显,从20.31%减少到19.39%,差值为0.92%,周边高值区比腹地低值区约高4.80%,这与地势和温度有很大关系,亦是温干(北周边)、温湿气候(东、东南、南周边)与冷干(中东腹地)、冷湿(中西腹地)气候的差异,显示了高度地带性(垂直分异)的规律。
图4
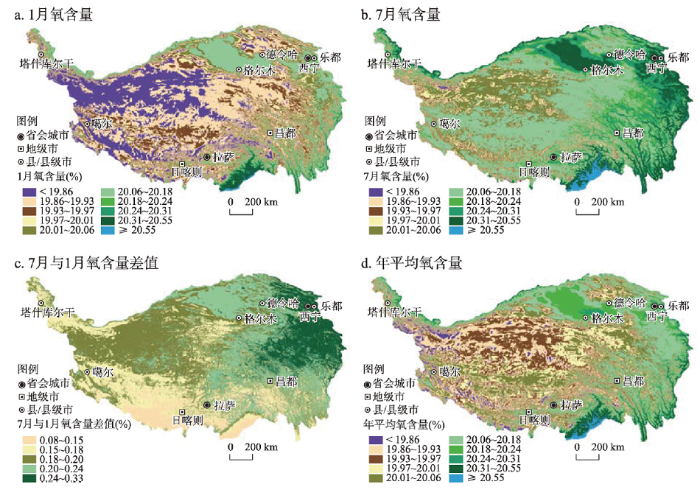
青藏高原7月地表大气氧含量整体高于全年平均,高于20.06%的面积达72.79%(表2)。从分布看(图4b),首先是东西分异,即东部明显高于西部,且自东而西递减,从大于20.55%减少到19.86%,差值为0.69%,明显小于全年,低值区面积明显减少,东部高值区比西部低值区约高3.47%,突显温湿气候与温干气候的差异,显示了明显经度地带性规律。第二是南北带状更替、东西延伸,东西延绵山脉区从小于19.86%增加到河谷、盆地与高平原区的20.55%,差值为0.69%(由高海拔到低海拔);山脉带比河谷、盆地与高平原高约3.47%,与东西的差异相当,显示了明显高度地带性的规律。第三南北差异较小、且北高南低,山脉带从小于19.93%减少到19.86%,差值仅为0.07%;河谷、盆地与高平原从20.55%减少到20.18%,差值为0.37%;明显小于东、西差值的0.69%,这与海拔、温度的综合影响有很大关系,亦是高原寒冷气候与温冷气候的差异,显示了纬度地带性(山脉间低地)与高度地带(山脉区)交替的规律。
表2 格点尺度青藏高原1月、7月氧含量及年均各分级面积占比(%)
Tab. 2
| 分级 | ≤19.86 | 19.86~19.93 | 19.93~19.97 | 19.97~20.01 | 20.01~20.06 | 20.06~20.18 | 20.18~20.24 | 20.24~20.31 | 20.31~20.55 | >20.55 |
|---|---|---|---|---|---|---|---|---|---|---|
| 1月 | 20.13 | 28.57 | 14.23 | 8.59 | 8.62 | 14.42 | 2.38 | 1.16 | 1.73 | 0.17 |
| 7月 | 0.23 | 1.18 | 2.47 | 6.24 | 17.09 | 36.19 | 9.93 | 10.75 | 14.36 | 1.56 |
| 年均 | 2.62 | 12.47 | 16.27 | 15.76 | 17.04 | 19.54 | 8.03 | 3.86 | 3.83 | 0.57 |
青藏高原1月氧含量整体小于全年平均,低于20.06%的面积达80.14%,其中极低值区(小于19.86%)面积达20.13%(表3)。从分布看(图4a),首先表现为明显的垂直分异,从20.55%减少到小于19.86%,差值为0.69%,显示了高度地带性(山脉间低地向山脉顶部区的快速递减)。第二是高原周边向腹地的递减,类似高度地带性。第三是东西的差异,且主要是高原东部山地河谷的高值区与西部大面积低值区间的突出差异,但相比夏季,明显不突出,从20.31%减少到小于19.86%,差值为0.42%,低于夏季的0.69%,和垂直差异相当。图4中氧含量的最高分级(>20.55%),在1月的面积占比仅有0.17%,而同期氧含量的最低分级(≤ 19.86%)面积占比为20.13%;相对应7月的氧含量最高分级面积占比为1.56%,最低分级面积占比仅为0.23%,突显青藏高原冬、夏季氧含量明显有别的同时,分布格局的差异,夏季东、西分异为主,高度分异为辅;冬季高度分异为主,东、西分异为辅。
表3 青藏高原自然带海拔、气温、叶面积指数和氧含量特征
Tab. 3
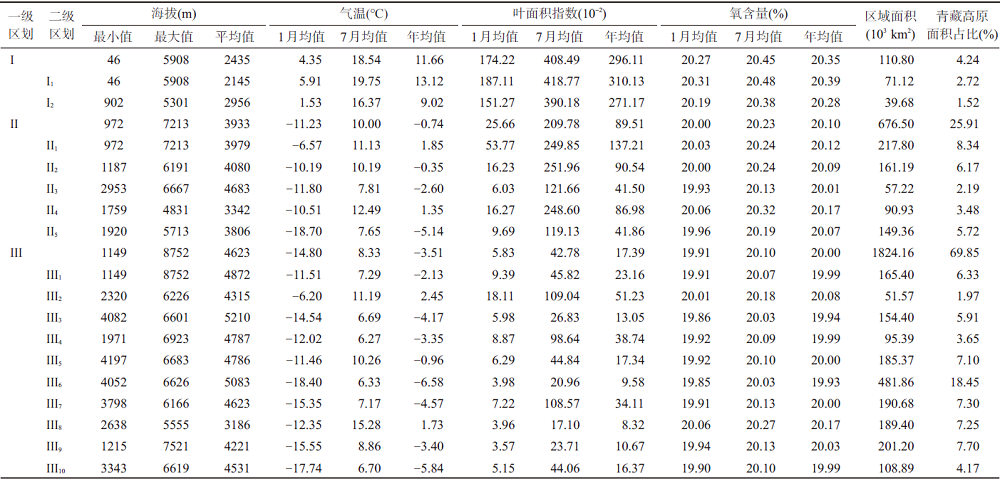 |
注:① Ⅰ 东南部亚热带森林—森林草原区域:Ⅰ1 藏东南暖热湿润山地河谷森林—森林草原带,Ⅰ2 横断山区南部暖温湿润河谷森林—森林草原带;Ⅱ 东部温带森林—草原—草甸区域:Ⅱ1 藏东—横断山区北部温暖湿润半湿润森林—草原带,Ⅱ2 川西高原温凉半湿润灌丛草原—草甸带,Ⅱ3 那曲高原温冷半湿润半干旱草原—草甸带,Ⅱ4 青东—甘南高原温凉半湿润半干旱森林草原—草原带,Ⅱ5 祁连山温冷半干旱半湿润森林草原—草甸带;Ⅲ 西部寒带温带草原—荒漠—草甸区域:Ⅲ1 喜马拉雅山地温冷半湿润半干旱灌丛草原—草甸带,Ⅲ2 雅鲁藏布江高原河谷温凉半湿润半干旱灌丛草原—农田带,Ⅲ3 冈底斯山寒冷半干旱干旱灌丛草原带,Ⅲ4 念青唐古拉山寒冷半干旱灌丛草原—草甸带,Ⅲ5 藏北层状高原温冷半干旱干旱灌丛草原—荒漠草原带,Ⅲ6 羌塘波状高原寒冷干旱半干旱荒漠—灌丛草原—草甸带,Ⅲ7 青南高原温冷半干旱草原—草甸带,Ⅲ8 柴达木盆地温暖干旱半干旱荒漠—荒漠草原带,Ⅲ9 喀喇昆仑山—昆仑山—阿尔金山温凉干旱荒漠—荒漠草原—草甸带,Ⅲ10 东昆仑山—阿尼玛卿山温冷半干旱干旱草原、荒漠草原—草甸带;② 表中气温数据源于参考文献[
表4 青藏高原自然带土地利用和覆盖类型特征
Tab. 4
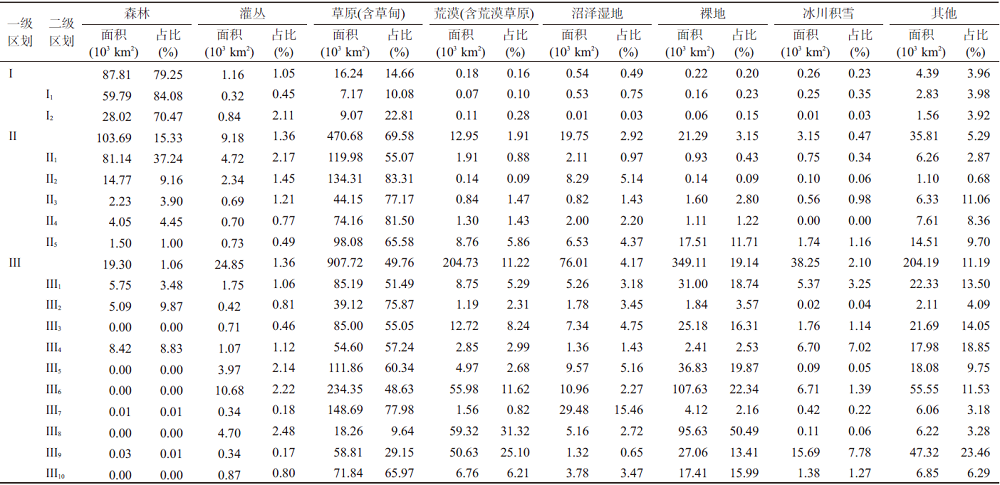 |
注:① Ⅰ 东南部亚热带森林—森林草原区域:Ⅰ1 藏东南暖热湿润山地河谷森林—森林草原带,Ⅰ2 横断山区南部暖温湿润河谷森林—森林草原带;Ⅱ 东部温带森林—草原—草甸区域:Ⅱ1 藏东—横断山区北部温暖湿润半湿润森林—草原带,Ⅱ2 川西高原温凉半湿润灌丛草原—草甸带,Ⅱ3 那曲高原温冷半湿润半干旱草原—草甸带,Ⅱ4 青东—甘南高原温凉半湿润半干旱森林草原—草原带,Ⅱ5 祁连山温冷半干旱半湿润森林草原—草甸带;Ⅲ 西部寒带温带草原—荒漠—草甸区域:Ⅲ1 喜马拉雅山地温冷半湿润半干旱灌丛草原—草甸带,Ⅲ2 雅鲁藏布江高原河谷温凉半湿润半干旱灌丛草原—农田带,Ⅲ3 冈底斯山寒冷半干旱干旱灌丛草原带,Ⅲ4 念青唐古拉山寒冷半干旱灌丛草原—草甸带,Ⅲ5 藏北层状高原温冷半干旱干旱灌丛草原—荒漠草原带,Ⅲ6 羌塘波状高原寒冷干旱半干旱荒漠—灌丛草原—草甸带,Ⅲ7 青南高原温冷半干旱草原—草甸带,Ⅲ8 柴达木盆地温暖干旱半干旱荒漠—荒漠草原带, Ⅲ9 喀喇昆仑山—昆仑山—阿尔金山温凉干旱荒漠—荒漠草原—草甸带,Ⅲ10 东昆仑山—阿尼玛卿山温冷半干旱干旱草原、荒漠草原—草甸带;② 植被与土地覆盖数据源于参考文献[
4 青藏高原自然地带“三维分异”的新认识
本文以氧含量空间格局为基础,参考前人相关研究成果,依据吴绍洪等提出的“主导因素原则、空间连续性原则、相对一致性原则”和“自上而下的演绎法和自下而上的归纳法相结合”[26],以基于氧含量为主导因素的青藏高原自然地理地带划分指标体系,对青藏高原自然地理地带“三维分异”提出了新的认识,即把青藏高原自然地带划分为区域、地带二级,构成青藏高原自然地理区—带二级区划体系。
4.1 基于氧含量为主导因素的青藏高原自然地理地带划分指标体系
一级区指标:以年均氧含量20.24%、20.06%,海拔平均3000 m、4500 m,森林、草原(草甸)植被类型的任何一类占比大于区域的60%、荒漠植被占比大于区域的30%,热带、温带、寒带气候区占比大于区域的50%左右,作为划分一级区的指标。参考郑度对青藏高原温度带的划分[27],以7月平均气温>18 ℃作为热带(含亚热带)、7月平均气温≥ 10 ℃且≤ 18 ℃作为温带、7月平均气温<10 ℃作为寒带的划分指标。
二级区指标:依据1月、7月氧含量、年均植被叶面积指数,在Ⅰ区,以7月、1月平均氧含量分别≥ 20.31%、≥ 20.18%、年均植被叶面积指数>300;在Ⅱ区,以7月、1月平均氧含量分别≥ 20.18%、≥ 19.93%、年均植被叶面积指数>40;在Ⅲ区,以7月、1月平均氧含量分别≥ 20.01%、<19.97%、年均植被叶面积指数<40;参考青藏高原年均降水量≥ 800 mm(湿润区)、800~401 mm(半湿润区)、400~200 mm(半干旱区)、 <200 mm(干旱区)的分区[28-29],并参考程维明等青藏高原的3级地貌分区[22],综合协调,作为划分二级区的划分依据(表3、表4)。
4.2 青藏高原自然地理地带划分
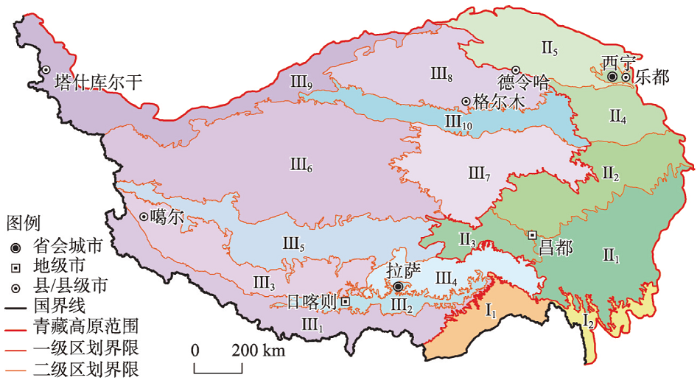
依据前述一、二级区划指标体系,按地域分异规律,把青藏高原自然地理地带划分为3个区域,分别用罗马符号Ⅰ、Ⅱ、Ⅲ表示。按地带分异规律,将3个区域共划分为17个带,分别用罗马符号后加数字编号组成,如Ⅰ1、Ⅰ2、Ⅱ1…Ⅱ5、Ⅲ1…Ⅲ10表示(图5)。
图5
4.2.1 东南部亚热带森林—森林草原区域(Ⅰ)
以年均氧含量20.24%为界,将其值大于此值的区域归本区。这一区域是中国东部亚热带季风性气候区向西延伸受高原山地影响的产物,即中国东部纬度自然地带与青藏高原高度自然带分异叠加的结果,分布有南亚热带季雨林、中亚热带季风性常绿阔叶林、北亚热带季风性落叶阔叶、常绿阔叶林与温带落叶阔叶林。本区年均氧含量为20.35%,平均海拔为2435 m,热带气候区(含亚热带)占比为54.29%,森林植被(含山地灌丛草原)占79.20%。这一区域与张新时划分的“西南季风山地森林植被地区”[3]、郑度等划分的“亚热带及热带北缘”[4]相当。依据上述二级区划分的指标,将其进一部划分为2个自然地带:Ⅰ1藏东南暖热湿润山地河谷森林—森林草原带和Ⅰ2横断山区南部暖温湿润河谷森林—森林草原带。
4.2.2 东部温带森林—草原—草甸区域(Ⅱ)
以年均氧含量在20.06%~20.24%的区域划为本区,年均氧含量20.24%等值线为与Ⅰ区的分界线,年均氧含量20.06%等值线为与Ⅲ区的分界线。这一区域是中国东部温带季风性气候区向西延伸受高原山地影响的产物,即中国东部经度自然地带与青藏高原高度自然带分异叠加的结果,分布有温带森林、森林草原与草甸、温带草原与草甸。本区年均氧含量为20.10%,平均海拔为3933 m,温带气候区占比为56.68%,草原植被(含草甸)区占69.54%。依据上述二级区划分的指标,将其进一步划分为5个自然地带:Ⅱ1藏东—横断山区北部温暖湿润半湿润森林—草原带、Ⅱ2川西高原温凉半湿润灌丛草原—草甸带、Ⅱ3那曲高原温冷半湿润半干旱草原—草甸带、Ⅱ4青东—甘南高原温凉半湿润半干旱森林草原—草原带和Ⅱ5祁连山温冷半干旱半湿润森林草原—草甸带。
4.2.3 西部寒带温带草原—荒漠—草甸区域(Ⅲ)
以年均氧含量20.06%为界,将其值小于此值的区域归本区。这一区域是大陆性气候在青藏高原上的产物,即青藏高原纬度、经度、高度自然地带综合叠加的结果,分布有寒带、温带草原—荒漠草原—荒漠、温带草甸。本区年均氧含量为20.00%,平均海拔为4623 m,寒带气候区占比为64.59%,荒漠植被(含山地荒漠草原、裸地、冰雪)区占32.45%以上。依据上述二级区划分的指标,将其进一步划分为10个自然地带:Ⅲ1喜马拉雅山地温冷半湿润半干旱灌丛草原—草甸带、Ⅲ2雅鲁藏布江高原河谷温凉半湿润半干旱灌丛草原—农田带、Ⅲ3冈底斯山寒冷半干旱干旱灌丛草原带、Ⅲ4念青唐古拉山寒冷半干旱灌丛草原—草甸带、Ⅲ5藏北层状高原温冷半干旱干旱灌丛草原—荒漠草原带、Ⅲ6羌塘波状高原寒冷干旱半干旱荒漠—灌丛草原—草甸带、Ⅲ7青南高原温冷半干旱草原—草甸带、Ⅲ8柴达木盆地温暖干旱半干旱荒漠—荒漠草原带(虽然本区有绿洲灌溉农田、人工林分布,使年均氧含量有所提高,但对年均植被叶面积指数影响甚微)、Ⅲ9喀喇昆仑山—昆仑山—阿尔金山温凉干旱荒漠—荒漠草原—草甸带和Ⅲ10东昆仑山—阿尼玛卿山温冷半干旱干旱草原、荒漠草原—草甸带。
4.3 青藏高原自然地理地带划分相关问题的讨论
4.3.1 关于青藏高原自然地带的认识
郑度等在明确了青藏高原存在“三维地带”性基础上[4],视青藏高原为一独特的自然地域单元,受大气环流和高原地势格局的制约,形成了高原温度、水分状况地域组合的不同,呈现从东南温暖湿润向西北寒冷干旱的变化。郑度依高原自然地域系统的划分遵循生物气候原则,即地带性原则,按照温度条件、水分状况和地形差异依次加以划分,即高原自然地域系统—高原自然地带—自然区三级划分体系。以日均温≥ 10 ℃的日数作为主要指标、最暖月均温为辅助指标,划分出高原亚寒带、高原温带和山地亚热带,后者为喜马拉雅南翼,已属高原外缘区域;以年干燥度为主要指标、年降水量为辅助指标,区分出湿润、半湿润、半干旱和干旱等不同水分状况的地域类型,据此,考虑大地势结构和大气环流的影响,在温度、水分条件组合上呈现共同特征,具有地带性植被和土壤的、范围较大的自然地域,划分为11个自然地带;基于一定的区域地形单元、具有相互联系的地形类型组合,划分为28个自然区[27]。
本文在深入理解“高原地带”“三维地带”和“高原自然地域系统”的基础上,提出将青藏高原划分为3个高原自然地域系统、17个高原自然地带,并以年均氧含量等值线、7月平均气温、年均植被叶面积指数、地表植被与土地覆盖类型、海拔等作为自然地域系统划界的主要依据。实际上,年均氧含量已包含了海拔、气温、植被等的信息,但为突出植被产氧,以及海拔、气温对大气压的影响,本文把地表植被与土地覆盖类型、7月平均气温、海拔等在青藏高原自然地域系统划分时,作为主要的自然要素指标予以考虑。在此基础上,主要以7月、1月氧含量、年均植被叶面积指数、年均降水量,并参考地貌区划等作为高原自然地带划分的依据。
4.3.2 关于青藏高原自然地域与自然地带量化指标的厘定
本文在对青藏高原自然地域系统—自然地带二级区划的具体划界时,主要基于网格(1 km×1 km)年均氧含量、7月、1月氧含量、年均植被叶面积指数、海拔、7月温度、主要植被与地表覆盖类型占比分布,以及地貌区划、年降水量等进行划分。其中,年均氧含量20.24%是东南部亚热带森林—森林草原区域与东部温带森林—草原—草甸区域的分界线,年均氧含量20.06%是东部温带森林—草原—草甸区域与西部寒带温带草原—荒漠—草甸区域的分界线。据此,在东南部亚热带森林—森林草原区域,针对地势造成的温度和地形起伏差异,将其划分为东西2个地带,即:纬度地带性基础上的高度地带性的具体呈现。在东部温带森林—草原—草甸区域,针对温度南北地带与地势分异将其划分为南北5个地带,即:主体为纬度地带性的具体呈现;其中川西高原温凉半湿润灌丛草原—草甸带与那曲高原温冷半湿润半干旱草原—草甸带的东西分异,主要是地势西高东低造成的,即:纬度地带性基础上的高度地带性的具体呈现。在西部寒带温带草原—荒漠—草甸区域,针对温度、地势南北分异与降水东西分异,将其划分为南北10个地带,即:纬度地带性基础上的高度、经度地带性的具体呈现;其中冈底斯山寒冷半干旱干旱灌丛草原带与念青唐古拉山寒冷半干旱灌丛草原—草甸带的东西分异、喀喇昆仑山—昆仑山—阿尔金山温凉干旱荒漠—荒漠草原—草甸带与东昆仑山—阿尼玛卿山温凉半干旱干旱草原、荒漠草原—草甸带的东西分异,主要都是降水东高西低,即:纬度地带性基础上的经度地带性的具体表现。
4.3.3 基于氧含量的青藏高原自然地域与自然地带划分的人畜缺氧健康效应
已有的青藏高原自然地带和青藏高原自然地域系统的划分[3-4,27]对指导青藏高原生态保护与生态屏障建设起到了重要的科技支撑作用。本文基于氧含量的青藏高原自然地域与自然地带划分,期望对青藏高原人畜缺氧健康效应的认识和其风险防范有一定的指导价值。对于人口缺氧健康来说,年均氧含量20.24%比全球平均含氧量20.946%[21]少0.706%,高于此值的东南部亚热带高原山地河谷森林—森林草原区,一般很少会形成因缺氧的慢性高原病(低于县域人口的10%);年均氧含量20.06%比全球平均含氧量20.946%少0.886%,低于此值的西部温带寒带草原—荒漠—草甸区域,一般会明显形成因缺氧引起的慢性高原病(可达县域人口的25%以上);介于20.06%~20.24%之间的东部温带森林—草原—草甸区与西部温带寒带草原—荒漠—草甸区域,因缺氧的慢性高原病一般在10%~25%之间。对于饲养家畜缺氧健康来说,年均氧含量低于20.24%的东南部亚热带高原山地河谷森林—森林草原区,一般会影响饲养家畜(牛、羊)的出栏率,低于东部平原的50%(牛)~25%(羊);年均含氧量低于20.06%的西部温带寒带草原—荒漠—草甸区域,一般会明显影响对饲养家畜(牛、羊)的出栏率,低于东部平原的70%(牛)~50%(羊);介于20.06%~20.24%之间的东部温带森林—草原—草甸区与西部温带寒带草原—荒漠—草甸区域,饲养家畜(牛、羊)的出栏率,低于东部平原的50%~70%(牛)和25%~50%(羊)。总之,基于氧含量的青藏高原自然地域与自然地带划分,可为青藏高原高寒草地生产系统中“人”和“畜”的“生态、生产、生活”和谐可持续发展提供支撑。
5 结语
本文对青藏高原自然地带所取得的重要成果基础上,基于第二次青藏高原综合科学考察研究“缺氧环境及其健康效应”科考小分队6年的野外观测测量数据,发现氧含量因受海拔、地势、地貌、气候、水文、植被、土壤、土地利用等地理要素的综合影响,其数值可以比较客观地定量展现青藏高原地表综合自然地理特征。据此,提出对青藏高原自然地带“三维分异”的新认识,即:基于青藏高原氧含量的时空格局,构建了一个青藏高原自然地域系统与自然地带划分方案,求教于同行。这一探讨的目的是进一步完善对青藏高原地域系统空间分异规律的认识,量化其空间差异,为青藏高原生态文明建设,特别是生态屏障保护与建设、人畜缺氧健康风险防范提供科学依据。持续开展青藏高原自然地域系统的区划研究,在全球变暖大背景下,对全面理解中国自然地域的分异规律有着极为重要的作用。这正如郑度等所指出的“区划是地理学的传统工作和重要研究内容,是从区域角度观察和研究地域综合体,探讨区域单元的形成发展、分异组合、划分合并和相互联系,是对过程和类型综合研究的概括和总结”[30],亦是落实全球和区域可持续性发展纲要,“尊重自然、顺应自然、保护自然”的科学基础。
参考文献
Characteristic, changes and impacts of permafrost on Qinghai-Tibet Plateau
青藏高原多年冻土特征、变化及影响
Environmental changes and countermeasures in the Pan-Third Pole region
泛第三极环境变化与对策
The plateau zonality of vegetation in Xizang
西藏植被的高原地带性
On the natural zonation in the Qinghai-Xizang Plateau
DOI:10.11821/xb197901001
[本文引用: 4]

Very high elevation coupled with very vast extension as well as their accom-panying intense thermodynamic effects have made the Qinghai-Xizang Plateau a unique physical geographical region in the world, where natural conditions are very complicated and the horizontal zonation is closely correlated with vertical zonation.
试论青藏高原的自然地带
DOI:10.11821/xb197901001
[本文引用: 4]
雄伟壮丽、气势磅礴的青藏高原,以其自然历史发育的年青,自然地理景观的独特和对周围区域的巨大影响吸引着人们的密切注意,也是地学、生物学领域解决若干重大问题的关键地区。
Factors contribution to oxygen concentration in Qinghai-Tibetan Plateau
青藏高原大气氧含量影响因素及其贡献率分析
Further research on the factors contributing to oxygen concentration over the Qinghai-Tibetan Plateau
再论青藏高原近地表大气相对氧含量影响因素的贡献率
Factors contributing to spatial-temporal variations of observed oxygen concentration over the Qinghai-Tibetan Plateau
Oxygen (O) is the most abundant molecule in the atmosphere after nitrogen. Previous studies have documented that oxygen concentration remains nearly constant (20.946%) at all altitudes. Here we show for the first time that oxygen concentration varies significantly from earlier consensus and shows strong spatial and seasonal differences. Field observations on the Qinghai-Tibetan Plateau (QTP) indicate oxygen concentration of 19.94-20.66% (2018, n = 80), 19.98-20.78% (2019, n = 166) and 19.97-20.73% (2020, n = 176), all statistically different from earlier reports (p < 0.001) and are lower than the nearly constant. The mean oxygen concentration in summer (20.47%) is 0.31% higher than that of winter (20.16%) (n = 53) at identical locations in 2019, sampled in the Qilian Mountains, northwest QTP. We used LMG (The Lindeman, Merenda and Gold) method to estimate the relative contributions of altitude, air temperature and vegetation index (Fractional Vegetation Cover, FVC and Leaf Area Index, LAI) to oxygen concentration, which are 47%, 32% and 3% (FVC, R = 82%); 45%, 30% and 7% (LAI, R = 82%), respectively. These findings provide a new perspective for in-depth understanding on population risk in high altitude regions in the context of global climate change, to ensure the health and safety of residents and tourists in high altitude regions and promoting the stability, prosperity and sustainable development of high-altitude regions worldwide.© 2021. The Author(s).
A warming climate may reduce health risks of hypoxia on the Qinghai-Tibet Plateau
DOI:10.1016/j.scib.2021.10.003 PMID:36546082 [本文引用: 1]
Environmental factors affecting near-surface oxygen content vary in typical regions of the Qinghai-Tibet Plateau
A conversion method to determine the regional vegetation cover factor from standard plots based on large sample theory and TM images: A case study in the eastern farming-pasture ecotone of Northern China
Monitoring rock desert formation caused by ice-snow melting in the Qinghai-Tibet Plateau using an optimized remote sensing technique: A case study of Yushu prefecture
Discussion on environmental impact of wind farm project construction in high altitude area and soil and water conservation on prevention: Taking the 1000 MW wind power project in Qieji township of Gonghe county as an example
高海拔地区风电场建设对环境的影响及水土保持对策探讨: 以共和县切吉乡1000 MW风电项目为例
The impact of photovoltaic power plants on ecological environment and climate: A literature review
DOI:10.7522/j.issn.1000-0534.2020.00020
[本文引用: 1]
Solar energy plays an essential role in mitigating fossil fuels shortage and resolving, environmental issues caused by burning fossil fuel, and global warming.Resources such as oil, natural gas and coal are diminishing day by day.Tradition energy consumption causes environment problem.Renewable energy has become an inevitable road and extensive consensus for the international community to respond to climate change.As a clean renewable energy, solar energy is gradually becoming an important alternative energy.Thus, the photovoltaic industry witnesses a rapid global growth.However, the deployment of photovoltaic modules on a large scale has also caused certain influence on the ecological environment and climate.The author summarized the impacts of photovoltaic power plants on the ecological environment and climate developed globally, nationally and locally, analyzed and discussed the feedback effect of photovoltaic power plants construction on the environment at different scale.The research results show that there is no consistent conclusion on the feedback effect of building photovoltaic power plants.The major mechanism is that the decrease of solar radiation on the surface causing by shielding effect of photovoltaic modules and the absorption and conversion of solar radiation, which then affects the surrounding environment, and causes the change of ecological environment and climate.The physical mechanism appears complex.And the research to the impact of photovoltaic power plant on the ecological environment and climate in China is still in the elementary stage.Therefore, the mechanism needs further research.
光伏电站对生态环境气候的影响综述
DOI:10.7522/j.issn.1000-0534.2020.00020
[本文引用: 1]
太阳能对于缓解化石燃料短缺、 燃烧造成的环境问题以及全球气候变暖有着十分重要的作用。全球光伏产业发展迅速, 然而大规模布设光伏组件对生态环境及气候也造成了不同程度的影响。基于对全球、 国家区域、 城市地区和局部地区大规模发展光伏电站对生态环境及气候造成的影响进行总结归纳, 分析讨论建设光伏电站对于不同尺度区域环境的反馈作用。结果表明: 建设光伏电站对于不同尺度区域环境的反馈作用并没有统一结论, 主要机理是光伏组件的遮蔽作用和对于太阳辐射的吸收转换导致地表的太阳辐射减弱, 进而作用于周围环境, 引起生态环境气候的变化, 物理机制较为复杂。目前我国光伏电站对生态环境气候的影响研究还处于起步阶段, 其作用机理还需要进一步深入研究。
Atmospheric oxygen in 1967 to 1970
Observations of atmospheric oxygen in clean air between 50 degrees N and 60 degrees S, mainly over the oceans, yield an almost constant value of 20.946 percent by volume in dry air. Since 1910 changes with time over the globe appear to be either zero or smaller than the uncertainty in the measurements.
Geomorphological regionalization theory system and division methodology of China
DOI:10.11821/dlxb201905001
[本文引用: 2]
Geomorphological regionalization and geomorphological types are the two core contents of geomorphologic research. Despite that there are many research achievements on the study of geomorphological regionalization, defects still exist such as the inconsistence of landform indicators, the small quantity of division grades, the disparity of geomorphological characteristics, the difference of mapping results and the small scale of zoning maps. New requirements for the national geomorphological regionalization therefore should be proposed at the request of national geo-information surveying and other national specific projects. On the basis of combing the theories of geomorphological regionalization in China including plate tectonics and crustal features, geomorphological features from endogenic and exogenic forces, and differences and regional differentiations of geomorphological types, a new research program of China's geomorphological regionalization with five grades, that is, major region, sub-major region, region, sub-region and small region, was proposed based on the previous geomorphological regionalization proposed in 2013 which divided the whole China into 6 major geomorphological regions and 37 districts. The major contents of the new geomorphological regionalization program can be summarized as follows: (1) principles of the national multi-grades geomorphological regionalization were established, (2) hierarchical indicator systems of the geomorphological regionalization (i.e. characteristics of the terrain ladder under the control of tectonic setting, combinations of regional macro-form types, combinations of endogenic and exogenic force and basic types of morphology, combinations of regional morphological types, combinations of regional micro-morphological types) were constructed, (3) naming rules and coding methods of the geomorphological regionalization were proposed, (4) precise positioning techniques and methods of the multi-grades geomorphological regionalization based on multi-source data were developed. On the basis of this new geomorphological regionalization project, the partitioning works of national five-grade geomorphological regionalization of 1:250,000 of China were successfully completed. And the geomorphological regionalization systems of the whole China were divided into 6 major regions, 36 sub-major regions, 136 regions, 331 sub-regions and more than 1500 small regions. In addition, the database and the management information system of the national geomorphological regionalization were then established. This research is of important guiding significance for promoting the development of China's regional geomorphology and the application research based on geomorphological regionalization.
中国地貌区划理论与分区体系研究
DOI:10.11821/dlxb201905001
[本文引用: 2]
区划和类型是地貌学研究的两大核心内容。中国地貌区划已有诸多划分方案,比较而言,各种方案存在遴选指标不一、确定等级较少、反映特征各异、划分结果不同、成图尺度较小等不足。应中国地理国情普查等国家专项任务的需求,对较大尺度、多级地貌区划研究提出了新的要求。在梳理中国地貌区划的理论,包括板块构造与地貌圈特征、地貌形态与内外营力体系、地貌形态的类型组合与区域分异的基础上,基于2013年提出的中国地貌二级区划的新方案,归纳了全国多级地貌区划分的原则,提出了基于“大区—地区—区—亚区—小区”的全国五级地貌等级分区方案,建立了“大地构造控制下的地势阶梯特征—>区域宏观形态类型组合—>内外营力及基本形态类型组合—>区域内形态类型组合—>区域微地貌形态组合”的五级地貌分区指标体系,提出了五级地貌区划体系的命名规则和编码方式,构建了基于多源数据进行多级地貌区划单元精确定位的技术与方法,完成了全国1:25万尺度五级地貌区的划分,包括6个一级大区、36个二级地区、136个三级区、331个四级亚区、1500多个五级小区,并建立了全国地貌区划数据库。该研究对于促进中国区域地貌学的发展、基于地貌区划的应用研究等具有重要的指导意义。
1 km monthly temperature and precipitation dataset for China from 1901 to 2017
DOI:10.5194/essd-11-1931-2019
URL
[本文引用: 1]
. High-spatial-resolution and long-term climate data are\nhighly desirable for understanding climate-related natural processes. China\ncovers a large area with a low density of weather stations in some (e.g.,\nmountainous) regions. This study describes a 0.5′ (∼ 1 km)\ndataset of monthly air temperatures at 2 m (minimum, maximum, and mean proxy monthly temperatures, TMPs)\nand precipitation (PRE) for China in the period of 1901–2017. The dataset\nwas spatially downscaled from the 30′ Climatic Research Unit (CRU) time\nseries dataset with the climatology dataset of WorldClim using delta spatial\ndownscaling and evaluated using observations collected in 1951–2016 by 496\nweather stations across China. Prior to downscaling, we evaluated the\nperformances of the WorldClim data with different spatial resolutions and\nthe 30′ original CRU dataset using the observations, revealing that their\nqualities were overall satisfactory. Specifically, WorldClim data exhibited\nbetter performance at higher spatial resolution, while the 30′ original CRU\ndataset had low biases and high performances. Bicubic, bilinear, and\nnearest-neighbor interpolation methods employed in downscaling processes\nwere compared, and bilinear interpolation was found to exhibit the best\nperformance to generate the downscaled dataset. Compared with the\nevaluations of the 30′ original CRU dataset, the mean absolute error of the new dataset (i.e., of the 0.5′ dataset downscaled by bilinear interpolation) decreased by 35.4 %–48.7 % for TMPs and by 25.7 % for PRE. The root-mean-square error decreased by 32.4 %–44.9 % for TMPs and by 25.8 % for PRE. The Nash–Sutcliffe efficiency coefficients increased by\n9.6 %–13.8 % for TMPs and by 31.6 % for PRE, and correlation\ncoefficients increased by 0.2 %–0.4 % for TMPs and by 5.0 % for PRE. The new dataset could provide detailed climatology data and annual trends of all climatic variables across China, and the results could be evaluated well using observations at the station. Although the new dataset was not evaluated before 1950 owing to data unavailability, the quality of the new\ndataset in the period of 1901–2017 depended on the quality of the original\nCRU and WorldClim datasets. Therefore, the new dataset was reliable, as the\ndownscaling procedure further improved the quality and spatial resolution of\nthe CRU dataset and was concluded to be useful for investigations related\nto climate change across China. The dataset presented in this article has\nbeen published in the Network Common Data Form (NetCDF) at\nhttps://doi.org/10.5281/zenodo.3114194 for precipitation (Peng,\n2019a) and https://doi.org/10.5281/zenodo.3185722 for air temperatures at 2 m\n(Peng, 2019b) and includes 156 NetCDF files compressed in zip\nformat and one user guidance text file.\n
A new vegetation map for Qinghai-Tibet Plateau by integrated classification from multi-source data products
基于多源数据产品集成分类制作的青藏高原现状植被图
A discussion on the boundary and area of the Tibetan Plateau in China
DOI:10.11821/yj2002010001
[本文引用: 2]
<p>The Tibetan Plateau is a unique geomorphic unit composed of some basic geomorphic types, such as extreme high mountains,high mountains, hills, plains, and tablelands of high altitude or sub-high altitude. Different opinions for the exact scope of Tibetan Plateau exist. According to latest research achievement and the long time fieldwork, questions related to the area and boundary of the Plateau have been discussed in view of geography, and the principles taking geomorphic characters as the main rule and considering the integrity have been made to define the boundary. The 1∶1 000 000 geomorphological map was compiled based on 1∶100 000 aerial photographic map,1∶500 000 topographic map and interpretation of satellite images. By refering to the 1∶3 000 000 relief map, the boundary of the Plateau was delineated.The position of the boundary was quantitatively determined with GIS and GPS.The map of electronic version of the Tibetan Plateau was compiled. The main conclusion is that Tibetan Plateau starts from the southern edge of the Himalayan Range, abuts on India,Nepal and Bhutan,connects the northern edge of Kunlun, Altun and Qilian Mts., and joins Tarim Basin and Hexi Corridor in Central Asia.The west of it is the Pamirs and Karakorum Mts., bordering on Kirghizistan, Tajikistan, Afghanistan, Pakistan and Kashmir. The east of it is Yulongxueshan, Daxueshan, Jiajinshan and Qionglaishan Mts.as well as south or east piedmont of Minshan Mts. Tibetan Plateau joins the Qinling Mts.and Loess Plateau with its eastern and northeastern part. Tibetan Plateau in China's territory starts from the Pamirs in the west and reaches to Hengduanshan in the east. It bestrides a longitude of 31 degrees with a length of 2 945 km from east to west,and bestrides a latitude of 13 degrees with a length of 1 532 km from south to north. It ranges from 26°00′12" N to 39°46′50" N and from 73°18′52"E to 104°46′59"E, covering an area of 2 572.4×10 3 km 2. Administratively, it embraces 201 counties (cities) in 6 provinces, namely, the Tibet Autonomous Region (73 counties/cities,1 176.0×10 3 km 2, part of Cona, Mêdog and Zayü), the Qinghai Province(40 counties/cities,721.0×10 3 km 2, some counties only partially), Dêqen Tibetan Autonomous Prefecture in Northwest Yunnan Province(9 counties/cities,33.5×10 3 km 2), West Sichuan Province ( 46 counties/cities about 254.0×10 3 km 2,such as Garze Autonomous Prefecture, Aba Tibetan and Qiangzu Autonomous Prefecture,and Muli Autonomous County, etc.),Gansu Province(21 counties/cities, 74.9×10 3 km 2), and Southern Xinjiang Uygur Autonomous Region (about 12 counties/cities, 313.0×10 3 km 2).</p>
论青藏高原范围与面积
Comprehensive climate change risk regionalization of China
DOI:10.11821/dlxb201701001
[本文引用: 1]
The influence of climate change on the natural environmental and socio-economic system leads to a series of adverse effects. With the development of socio-economy, climate change hazards interact with the environmental and socio-economic risk bearing body and form the spatial-temporal patterns of climate change risk. The systematic expression of the spatial-temporal patterns is the scientific foundation of climate changes adaptation. Based on the RCP8.5 climate scenario data from 2021 to 2050, we analyzed the variation trend and rate of temperature and precipitation, and assessed the hazard of extreme climate events including drought, heat wave and flood. Then, economy, population, food production and ecosystem were selected as the risk bearing bodies to assess the possible impacts of climate change as the indices qualifying the comprehensive climate change risk. Under the guidance of systematic principle, predominating factor principle, as well as the space consecution principle, we proposed a scheme of three-level regional division system for the comprehensive climate change risk regionalization in China. Finally, the Chinese mainland was divided into 8 climate change sensitive zones, 19 danger zones of extreme events and 46 comprehensive risk zones of bearing body. The result shows that the climate changes high risk zones in China under the RCP8.5 climate scenario from 2021 to 2050 include North China weak warming and precipitation increased sensitive zone, North China Plain heat wave danger zone, population-economy-food high risk zone, South China-Southwest China weak warming and precipitation increased sensitive zone, Yunnan-Guizhou mountain heat wave danger zone, ecosystem-economy-food-population high risk zone; coastal South China flood-heat wave danger zone, ecosystem-food-economy-population high risk zone. The comprehensive climate change risk regionalization of China covers the climate change scenarios, the extreme events, and the possible lost information of the socio-economy and ecosystem, which can provide scientific and technological support for national and local governments to cope with the climate change and risk management.
中国综合气候变化风险区划
DOI:10.11821/dlxb201701001
[本文引用: 1]
气候变化作用于自然环境与社会经济系统,产生一系列影响。随着未来社会经济发展,气候变化危险性与自然环境和社会经济承险体耦合形成有规律的风险时空格局。将此时空格局系统化表达即是综合气候变化风险区划,是适应气候变化的科学基础之一。本文基于RCP 8.5下的近中期(2021-2050年)气候情景,分析了中国未来气温和降水变化趋势与速率,评价了干旱、高温热浪以及洪涝等极端事件危险性,选取人口、经济、粮食生产和生态系统等承险体风险作为综合风险定量评估的指标。在系统性、主导因素以及空间连续性原则的指导下,提出中国综合气候变化风险区划三级区域系统方案,划分出8个气候变化敏感区、19个极端事件危险区和46个承险体综合风险区。结果发现:2021-2050年RCP 8.5情景下中国的气候变化高风险区主要包括:华北弱暖增雨敏感区,华北平原热浪危险区,人口经济粮食高风险区;华南—西南弱暖增雨敏感区,黔滇山地热浪危险区,生态经济粮食人口高风险区;华南沿海涝热危险区,生态粮食经济人口高风险区。中国综合气候变化风险区划涵盖了气候变化情景、极端事件发生、社会经济与生态系统的可能损失信息,可以为国家或地方应对气候变化及气候变化风险管理提供科技支撑。
A study on the natural geographical system of the Qinghai-Tibet Plateau
青藏高原自然地域系统研究
Inhomogeneity characteristics of intra-annual precipitation over the Tibetan Plateau in recent 42 years
DOI:10.11821/xb201103010
[本文引用: 1]
Based on the daily precipitation datasets from 1967 to 2008 recorded at stations over the Tibetan Plateau, the precipitation concentration degree (PCD) and precipitation concentration period (PCP) of the Plateau are defined. By means of EOF and correlation, as well as spatial and temporal distributions of PCD and PCP, the relationship between PCD and plateau heavy rainfall, and signals of PCP are investigated. The results show that PCD of the plateau area is between 0.4 and 0.8, while PCP is within 36-41 pentads. In space scale, PCD is nearly congruous in the whole region, while PCP manifests a north-south reverse pattern mainly. In time scale, PCD appears to be a subdued tendency when PCP displays an advanced characteristic. Except for a few places in the southern plateau, PCD shows positive correlation with days as well as amounts of intensive rainfall on plateau. In addition, the water vapor transports have significant differences between northern and southern PCP of the plateau, the onset of Bay of Bengal monsoons may have an effect on PCP of the southern plateau.
近42年来青藏高原年内降水时空不均匀性特征分析
Precipitation division of the Qinghai-Tibet Plateau from 1978 to 2018 and spatiotemporal evolution characteristics of each zone
1978—2018年青藏高原降水区划及各区降水量时空演变特征
Regionalization in China: Retrospect and prospect
DOI:10.11821/yj2005030002
[本文引用: 1]
Based upon a review on foreign regionalization work, this paper summarized the characteristics of the regionalization work in different stages, gave a brief introduction to the methodology in the regionalization of China, and discussed some issues on the regionalization work. Since the latter half of the 20th century, the regionalization in China has entered a stage of systematic research and all-around development. The main characteristics of the regionalization work in this stage are as follows. First, the various regionalization schemes are based on their historical background respectively. They are the scientific work closely related to the economic development and social demands at the time. Roughly speaking, research on the regionalization in China had mainly served agricultural production since the 1950s. Since the 1980s, the research had been concentrated on economic development. Since the 1990s, the regionalization work has been focused on sustainable development. Second, the work was mostly static and was not able to reflect the dynamics of the changing natural and social factors. And several important boundaries were identified with some assumption and presumption. In recent years, some trends of overemphasizing models and quantification have appeared in regionalization studies. Third, the regionalization studies were inclined to physical geography. The economic geographical regionalization studies were relatively weak. Moreover, current physical and economic regionalization studies are not well related, which has become a limitation to the research of regional sustainable development. Fourth, current regionalization studies focus on terrestrial system, and haven't paid enough attention to marine system. Fifth, the confirmation of regionalization schemes is not institutionally assured yet. So the research results have not been well absorbed by the economic planning of local governments, and the purpose of serving the sustainable socio-economic development has not been realized. Finally, the necessity and importance of carrying out comprehensive regionalization in China was analyzed, and some key scientific issues related with the comprehensive regionalization of China were discussed. The paper pointed out that as a new growing point of regionalization researches, comprehensive regionalization with an integration of natural and social factors will be an important contribution of the human-earthsystem research to the sustainable development.
中国区划工作的回顾与展望
