

1 引言
新型冠状病毒肺炎(COVID-19)疫情已在全球蔓延超过3年。联合国报告(2020)指出全球90%以上COVID-19病例来自城市,而2020年全球城市人口占比为56%[1]。城市不仅是财富和创新的高地,也是传染病滋生的温床[2]。传染病传播离不开人与人的接触交互,而人与人交互随城市人口规模呈超线性增长[3]。因此,传染病发病数与城市人口规模一般呈超线性关系,即大城市发病率更高[4-5]。COVID-19疫情发生后,各国各城市普遍采取了限制出行等非药物干预措施[6-7],这些防控措施显著改变了城市交互网络[8⇓⇓-11]。然而,COVID-19病例数与城市人口规模的定量关系仍不明确;特别是在疫情反复变化背景下二者非线性关系的动态演化过程仍不清楚。
城市具有自组织、非线性、分形等特征,是一个典型复杂系统;由多个城市构成的城市体系也是复杂系统[12⇓⇓-15]。已有研究从不同视角理解城市复杂性,代表性的观点包括:宏观自组织和耗散结构论视角[16],分形和元胞自动机视角[17],微观自组织和协同学视角[18],空间相互作用视角[19],非线性、不可还原性和规律对称破坏视角[13]等。城市体系内,城市指标与人口规模的非线性关系可用标度律(Scaling Law)定量刻画[20⇓⇓⇓⇓⇓-26]。城市体系标度律的数学形式为幂函数(Y = Y0Nβ),其中Y为城市指标,N为人口规模,β被称为标度指数(Scaling Exponent)[27]。根据β与1的关系,可将城市指标分为3类:① 社会交互类指标与人口规模呈超线性标度关系(β > 1),例如经济产出、传染病发病数等[28],这类城市指标的标度指数在1.15左右;② 基础设施类指标与人口规模呈亚线性标度关系(β < 1),例如道路、管网长度等[29-30],这类城市指标的标度指数在0.85左右[27];③ 个人需求类指标与人口规模呈线性标度关系,例如居民用电量等。
复杂城市系统理论为认识城市健康提供了新视角[31⇓-33]。已有研究广泛报道了传染病发病数与人口规模的超线性标度关系[5,34⇓ -36]。例如一项采用美国、巴西、瑞典等国数据的研究发现艾滋病、流感、登革热等传染病发病数与城市人口规模呈超线性标度关系[5]。巴西城市2000年和2010年当年艾滋病感染人数与城市人口规模呈超线性标度关系,标度指数分别为1.37和1.31[37]。关于传染病死亡病例,也有研究指出美国66个城市1918年大流感前后肺炎死亡数与城市人口规模呈线性标度关系,而流感死亡数与人口规模呈亚线性标度关系[38],原因是规模较小城市的医疗水平,经济状况,居民健康水平较差[38]。
尽管传染病发病数与人口规模存在标度关系已成为共识,并且可以预期COVID-19确诊病例与城市人口规模应该存在超线性标度关系。但确诊病例的标度指数是否在1.15左右?确诊和死亡病例标度指数有何差异?特别是在疫情动态发展背景下,标度指数随时间的演化特征和空间差异还不清楚。另一方面,疫情防控政策使得城市社会交互产生了多次波动且存在往复,这可能相当于正常情况下城市系统几十年甚至上百年的演进过程[45]。从这个角度来看,不断发展的COVID-19疫情为揭示城市标度律时间演化规律提供了数据案例。
2 数据与方法
2.1 研究区及数据
本文以美国为例,分析COVID-19病例与城市人口规模标度律及标度指数时间演化。美国经历了多轮COVID-19疫情,且持续时间长,有利于研究标度律时间演化特征。此外,美国各州、各地区疫情进展不同,有利于探究标度律及其时间演化的区域差异。本文获取了美国3139个县级行政单元(County)2020年1月22日—2022年7月1日每日COVID-19确诊和死亡病例以及各县2019年人口数据(
图1
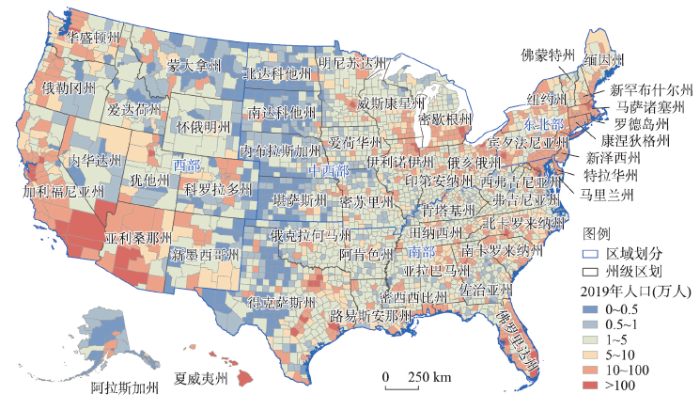
图1
美国行政区划及2019年县级人口规模
Fig. 1
Administrative divisions and population at the county level in 2019 in the United States
2.2 标度律及其拟合
对(1)式两边同时取以10为底对数,可以得到:
3 结果与分析
3.1 COVID-19病例与城市规模的标度律
研究期内美国每日和7日滑动平均新增COVID-19确诊/死亡病例如图2所示。综合确诊/死亡病例变化趋势,本文将截至2022年7月1日美国COVID-19疫情划分为7个阶段。2021年11月1日—2022年5月1日(第6阶段)美国COVID-19疫情主要由传染性极强的奥密克戎(Omicron)变异毒株引起,该阶段确诊病例显著高于其他阶段,但该阶段死亡病例并没有明显高于其他阶段(图2b)。2020年3月15日—10月1日,美国县级尺度确诊病例空间分布及其演化过程如图3所示。美国COVID-19疫情开始于西雅图、纽约、洛杉矶、旧金山、芝加哥等东、西海岸大城市,然后蔓延至本土其他地区,呈现由东、西海岸向中部地区蔓延的整体趋势。
图2
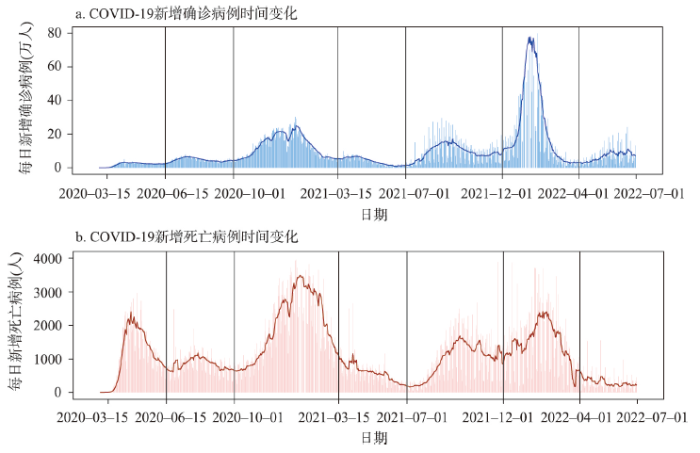
图2
美国每日和7日滑动平均新增COVID-19确诊和死亡病例时间变化趋势
Fig. 2
Temporal variations of daily and 7-d averagely added COVID-19 cases and deaths in the United States
图3
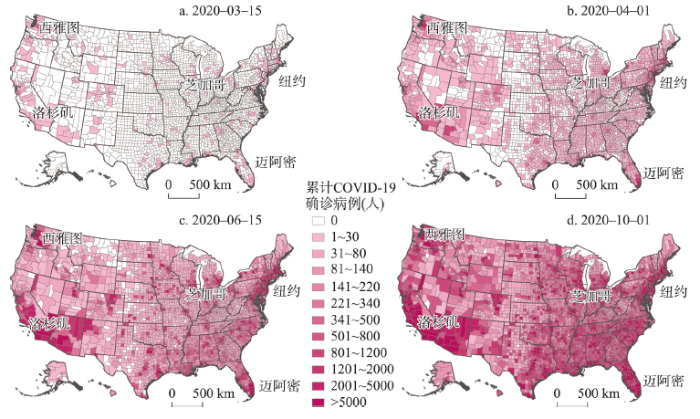
图3
美国不同日期COVID-19累计确诊病例空间分布
Fig. 3
Spatial distributions of accumulated COVID-19 cases on four dates in the United States
美国各县不同日期COVID-19累计确诊/死亡病例与人口规模散点图及其拟合结果如图4a和图4b所示。疫情初期(2020年4月以前),很多县级单元尚未有确诊/死亡病例,散点图较为分散。此后散点图线性趋势越来越明显,显示了COVID-19病例与人口规模稳健的标度关系。散点图拟合直线斜率为标度指数。图4c显示了确诊/死亡病例标度指数时间变化趋势,灰色阴影为标度指数估计值的95%置信区间。疫情初期,β确诊小于1,COVID-19疫情传播的规模效应尚未显现。此后,β确诊迅速上升并超过1。2020年4—7月,β确诊稳定在1.25左右,COVID-19疫情在大城市发病率更高的规模效应非常明显。2020年7—12月,β确诊随时间下降;说明大城市疫情传播的规模效应在减弱。2020年12月以后,β确诊微弱上升,直至稳定在1左右,并且一直持续至2022年6月。标度指数持续稳定在1附近,说明不同规模城市COVID-19累计确诊率趋同。
图4
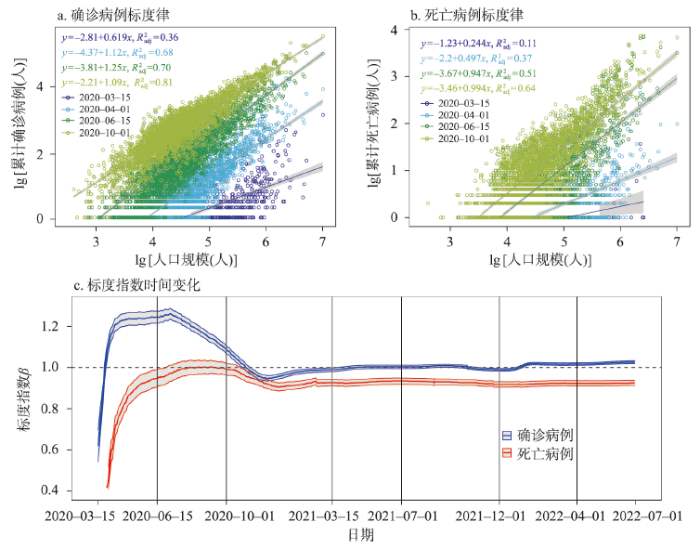
图4
美国各县COVID-19累计确诊和死亡病例与人口规模的标度律及标度指数的时间变化
Fig. 4
Scaling laws between COVID-19 cases or deaths and the population at the county level and daily variations of scaling exponents in the United States
死亡病例的标度指数与确诊病例的变化趋势一致,但二者数值有本质差异。β死亡也经历了先快速上升,并持续稳定在1附近,然后下降,最后稳定的过程(图4c)。与β确诊相比,β死亡上升过程更加缓慢,说明死亡病例与人口规模的标度关系需要更长时间达到稳定状态。2020年6月15日以前,β死亡均显著小于1,说明大城市COVID-19病死率更低。而在稳定阶段(2020年6月15日—10月1日),β死亡也没有显著大于1。2020年10月以后,β死亡先下降,后稳定在0.9左右,呈现亚线性标度关系。总之,从美国全境来看,死亡病例并没有与人口规模呈现超线性标度关系。
3.2 标度指数时间变化的地区差异
美国不同地区(东北部、南部、西部、中西部)COVID-19疫情增长趋势差异明显(图5)。2020年5月以前,纽约州所在的东北部确诊病例增长速度最快(图5a);同期东北部死亡病例增长速度远超其他区域(图5b)。此后多轮疫情,美国南部确诊和死亡病例增长趋势更加明显。整体来看,美国不同区域确诊/死亡病例与人口规模的标度指数均经历了由上升到稳定、再下降的变化过程(图5c、5d)。4个区域β确诊在稳定阶段(2020年4—10月)均呈现超线性标度关系,说明不同区域大城市COVID-19确诊率均更高。2020年10月以后,除了东北部,其他区域β确诊逐渐趋近于1。2021年11月以后,东北部β确诊也逐渐趋近于1;显示了经过多轮疫情后,COVID-19累计确诊率已经没有规模差异。不同区域对比来看,美国东北部的标度指数明显高于其他3个区域,东北部大城市COVID-19疫情比其他地区大城市更加严重。只有东北部β死亡大于1,南部β死亡一直小于1,西部和中西部β死亡在稳定阶段(2020年4—10月)维持在1附近波动。
图5
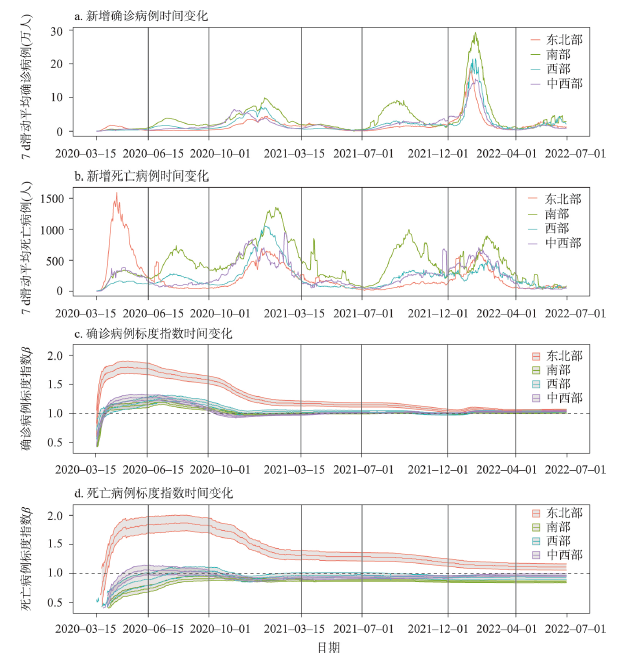
图5
美国不同区域COVID-19病例及其与人口规模标度指数的时间变化
Fig. 5
Daily variations of COVID-19 cases and deaths and their scaling exponents in four regions of the United States
本文进一步分析了美国各州COVID-19病例与人口规模的标度关系及其时间演化(图6)。美国东北部州仅有少数县级单元,本文在州级尺度分析时将东北部部分州与其邻近州合并:哥伦比亚特区和特拉华州合并至马里兰州,罗德岛州合并至康涅狄格州,新罕布什尔州合并至缅因州。州级尺度分析不包括夏威夷群岛。考虑到2021年3月15日及以后标度指数基本都趋近于1(图4和图5c、5d),因此只展示截至2021年3月15日州级尺度标度指数的时间变化(图6),图6中灰色阴影为标度指数估计值的95%置信区间。与美国全境和4大区域相比(图4c和图5c、5d),州内标度指数时间变化波动较大,这与州内县级单元个数较少有关。整体上,标度指数时间变化具有以下特征和规律:① β确诊与β死亡都经历了先上升、后稳定、再下降,直至趋近于1的时间变化过程;② β确诊与β死亡时间变化趋势一致,但β死亡滞后于β确诊的时间变化;③ 大多数州内确诊病例与人口规模呈现超线性标度关系,而死亡病例与人口规模呈现亚线性标度关系。
图6
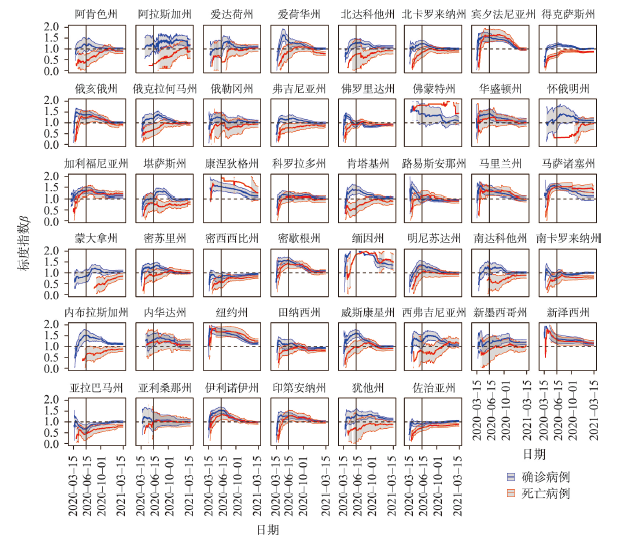
图6
美国州内各县COVID-19累计确诊和死亡病例与人口规模标度指数的时间变化
Fig. 6
Daily variations of scaling exponents between COVID-19 cases or deaths and the population of counties in each state of the United States
2020年6月15日是第一轮疫情结束时间,该日期前后5日(2020年6月10—20日)美国各州标度指数平均值的空间分布如图7所示。美国东北部COVID-19病例标度指数最高,显示该区域大城市受疫情影响更加严重。美国东南部β确诊与β死亡较低,密西西比州和亚拉巴马州β确诊甚至出现亚线性,显示该两州第一轮COVID-19疫情传播的规模效应不明显。
图7
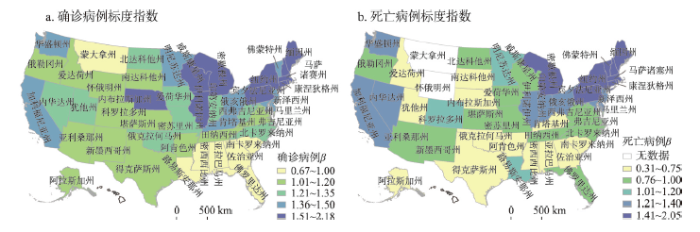
图7
2020年6月10—20日美国各州COVID-19病例标度指数均值的空间分布
Fig. 7
Spatial distributions of averaged scaling exponents of COVID-19 cases and deaths from June 10, 2020 to June 20, 2020 in each state of the United States
4 讨论
本文以美国为例,采用标度律视角研究了COVID-19疫情在城市系统中传播演化过程。COVID-19确诊病例与人口规模呈现超线性标度关系,说明从小城市到大城市,确诊病例增长速度快于人口增加速度,大城市确诊率更高。大城市社会交互更加频繁、密集,更有利于传染病扩散传播。本文的重要发现之一是揭示了COVID-19确诊病例与人口规模标度关系的时间演化过程。在疫情动态发展背景下,标度指数整体上经历了先上升、后稳定、再下降、直至趋近于1的演化过程。疫情初期,局地出现病例后尚处于“低水平传播”阶段,疫情传播的规模效应不明显;此时确诊病例与人口规模的标度指数小于1。但该阶段持续时间非常短,不足两周(图4c)。随着疫情扩散,标度指数迅速上升,直至稳定在1.25左右;显示了确诊病例与人口规模稳健的超线性标度关系。疫情传播较长时间后,标度指数逐渐下降,直至趋近于1。标度指数减小说明疫情传播的规模效应减弱,不同规模城市累计确诊率相近。
图8
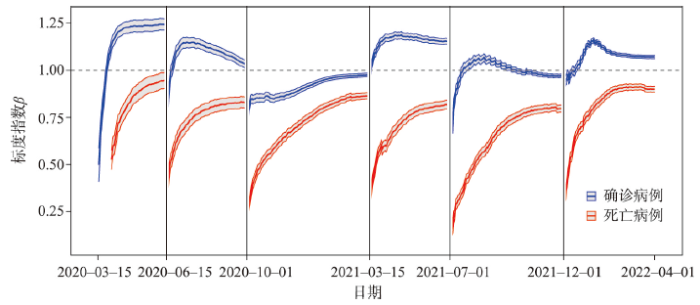
图8
美国全境分阶段COVID-19累计确诊和死亡病例与人口规模标度指数的逐日时间变化
Fig. 8
Daily variations of scaling exponents between COVID-19 cases or deaths and the population during different waves of the COVID-19 epidemic in the United States
本文还从区域和州内尺度分析了COVID-19病例与人口规模标度指数的时间变化趋势和空间差异(图5~图7)。不同区域和大多数州的确诊病例与人口规模都呈超线性标度关系,充分说明了大城市传染病发病率更高。不同区域标度指数存在明显的空间差异。纽约州所在的美国东北部β确诊最高,而东南部州确诊病例与人口规模表现出亚线性标度关系。大部分地区和州的死亡病例与人口规模呈现线性或亚线性标度关系,说明大城市的COVID-19病死率没有高于中小城市;但东北部β死亡呈现超线性并且高于β确诊(图5d)。纽约州所在的东北部是最早受疫情重创的地区,大城市的医疗资源在短时间内受到挤兑,医疗系统崩溃,是造成美国东北部大城市死亡率更高的原因。
5 结论
本文以美国为例,从复杂城市系统视角分析了2020—2022年COVID-19病例与城市人口规模的标度律,揭示了二者非线性标度关系的时间演化特征。整体上,COVID-19确诊病例与人口规模呈现超线性标度关系,即大城市感染率更高;其标度指数经历了先快速升高、后稳定在1.25附近、再下降的变化过程。这说明城市指标与人口规模的标度关系不是固定不变,而是动态演化的。对比来看,COVID-19死亡病例并没有与人口规模呈现超线性标度关系,大城市病死率没有高于中小城市。死亡病例和确诊病例标度指数时间变化趋势一致,但时间滞后。病例的累积效应掩盖了后期疫情传播的规模效应,分阶段拟合后发现:标度指数在每轮疫情均经历了先上升,后稳定,再下降的时间演化过程。本文采用标度律理论揭示了COVID-19疫情传播的规模效应,标度指数时间演化规律的发现也丰富了城市标度律的理论,两者是实践与理论的互动结合。
COVID-19疫情仍在不断演化,我们还将面临其他新发传染病的威胁。本文对于未来疫情防控有两点政策启示:① 由于规模效应,大城市疫情传播速度更快;控制大城市疫情不仅对于大城市本身有利,还可防止疫情通过大城市向中小城市扩散。② 合理分配医疗资源,切实提升中小城市医疗救治能力,避免中小城市疫情死亡率高于大城市。未来需要综合疫情防控措施、疫苗接种水平、病毒传播属性等因素,挖掘疫情标度指数时间演化的驱动机制,揭示确诊和死亡病例标度指数的协同演化规律。此外,有必要收集更多国家或地区的COVID-19疫情时序数据,验证并拓展本文的研究发现。
参考文献
Seeing COVID-19 through an urban lens
DOI:10.1038/s41893-020-00620-3 URL [本文引用: 1]
The scaling of human interactions with city size
The scaling of human contacts and epidemic processes in metapopulation networks
We study the dynamics of reaction-diffusion processes on heterogeneous metapopulation networks where interaction rates scale with subpopulation sizes. We first present new empirical evidence, based on the analysis of the interactions of 13 million users on Twitter, that supports the scaling of human interactions with population size with an exponent. ranging between 1.11 and 1.21, as observed in recent studies based on mobile phone data. We then integrate such observations into a reaction-diffusion metapopulation framework. We provide an explicit analytical expression for the global invasion threshold which sets a critical value of the diffusion rate below which a contagion process is not able to spread to a macroscopic fraction of the system. In particular, we consider the Susceptible-Infectious-Recovered epidemic model. Interestingly, the scaling of human contacts is found to facilitate the spreading dynamics. This behavior is enhanced by increasing heterogeneities in the mobility flows coupling the subpopulations. Our results show that the scaling properties of human interactions can significantly affect dynamical processes mediated by human contacts such as the spread of diseases, ideas and behaviors.
The non-linear health consequences of living in larger cities
DOI:10.1007/s11524-015-9976-x URL [本文引用: 3]
Population flow drives spatio-temporal distribution of COVID-19 in China
DOI:10.1038/s41586-020-2284-y URL [本文引用: 1]
An investigation of transmission control measures during the first 50 days of the COVID-19 epidemic in China
DOI:10.1126/science.abb6105
PMID:32234804
[本文引用: 1]

Responding to an outbreak of a novel coronavirus [agent of coronavirus disease 2019 (COVID-19)] in December 2019, China banned travel to and from Wuhan city on 23 January 2020 and implemented a national emergency response. We investigated the spread and control of COVID-19 using a data set that included case reports, human movement, and public health interventions. The Wuhan shutdown was associated with the delayed arrival of COVID-19 in other cities by 2.91 days. Cities that implemented control measures preemptively reported fewer cases on average (13.0) in the first week of their outbreaks compared with cities that started control later (20.6). Suspending intracity public transport, closing entertainment venues, and banning public gatherings were associated with reductions in case incidence. The national emergency response appears to have delayed the growth and limited the size of the COVID-19 epidemic in China, averting hundreds of thousands of cases by 19 February (day 50).Copyright © 2020 The Authors, some rights reserved; exclusive licensee American Association for the Advancement of Science. No claim to original U.S. Government Works.
The development of COVID-19 in China: Spatial diffusion and geographical pattern
DOI:10.11821/dlyj020200329
[本文引用: 1]
The study of the spatial diffusion and geographical mode of COVID-19 is of great significance for the rational allocation of health resources, the management and response of public health emergencies, and the improvement of public health system in the future. Based on multiple spatio-temporal scale, this paper studied the spatial spreading process of COVID-19 between cities and its evolution characteristics in China, and then explored its influencing factors. The results are shown in the following: the inter-city spreading process of COVID-19 in China mainly experienced six stages, namely, stage I: diffusion in Wuhan, stage II: rapid multi-point diffusion in space, stage III: rapid increase of confirmed cases, stage IV : gradual decrease of new confirmed cases, stage V: the epidemic under control, and stage VI: cases imported from overseas. In the context of globalization and open regional system, the social and economic development of regions are closely related to each other. With the development of fast and convenient high-speed railway network, the spatial characteristic of population migration shows a cross-regional and hierarchical pattern, and forms a certain spatial cascade structure along the transport corridor. Accordingly, the spatial spread of COVID-19 mainly showsthe characteristics of adjacent diffusion, relocation diffusion, hierarchical diffusion, and corridor diffusion. The study found that geographical proximity, population migration and population size, traffic network, epidemic prevention and control measures have significant influence on the spatial diffusion process of COVID-19. Among different modes of transportation, airplanes play agreater role than others in the early stage of the epidemic. In addition, the population flow during the Spring Festival had a certain impact on the spread of the epidemic. In conclusion, to some extent, the spatial spread process and pattern of COVID-19 epidemic reflects the spatial organization pattern of social and economic activities under the "space of flows" network, which is closely related to the geographical proximity, the social and economic linkages between regions, and the spatial an temporal patterns of human activities. From the perspective of geography, this paper analyzed the inter-city spread pattern of COVID-19 epidemic and provided some implications for prevention and control measures against the epidemic in other countries, and also offered some suggestions for China to deal with public health emergency risks in the future.
新冠肺炎疫情的空间扩散过程与模式研究
DOI:10.11821/dlyj020200329
[本文引用: 1]
研究新冠肺炎疫情的空间扩散过程与模式对于防疫抗疫资源的合理配置、突发公共卫生事件的管理与应对以及未来公共卫生体系的完善具有重要意义。本文综合时间和空间尺度,从地理学视角研究了新冠肺炎疫情的城际空间扩散过程,归纳总结扩散模式,并揭示了其影响因素。研究发现:新冠肺炎疫情在中国的发展主要经历了6个阶段,并在空间上表现出邻近扩散、迁移扩散、等级扩散和廊道扩散等地理模式;地理邻近性、人口流动、人口规模、交通网络、疫情防控管理等因素对疫情的空间扩散具有显著影响。新冠肺炎疫情的空间扩散过程和模式一定程度上是“流空间”网络下人类社会经济活动空间组织模式的一种反映,与地理邻近性、社会经济联系的跨区域性及人类活动的时空规律等密切相关。本研究以期为世界各国的疫情防控措施制定提供参考,也为中国未来应对公共卫生应急风险提供经验借鉴。
Spatial and temporal patterns and factors influencing the spread of the COVID-19 pandemic in China
DOI:10.11821/dlxb202202012
[本文引用: 1]
It is essential to unravel the spatial and temporal patterns of the spread of the epidemic in China during the backdrop of the global coronavirus disease 2019 (COVID-19) outbreak in 2020, as the underlying drivers are crucial for scientific formulation of epidemy-preventing strategies. A discriminant model for the spatio-temporal pattern of epidemic spread was developed for 317 prefecture-level cities using accumulated data on confirmed cases. The model was introduced for the real-time evolution of the outbreak starting from the rapid spread of COVID-19 on January 24, 2020, until the control on March 18, 2020. The model was used to analyze the basic characteristics of the spatio-temporal patterns of the epidemic spread by combining parameters such as peak position, full width at half maximum, kurtosis, and skewness. A multivariate logistic regression model was developed to unravel the key drivers of the spatio-temporal patterns based on traffic accessibility, urban connectivity, and population flow. The results of the study are as follows. (1) The straight-line distance of 588 km from Wuhan was used as the effective boundary to identify the four spatial patterns of epidemic spread, and 13 types of spatio-temporal patterns were obtained by combining the time-course categories of the same spatial pattern. (2) The spread of the epidemic was relatively severe in the leapfrogging model. Besides the short-distance leapfrogging model, significant differences emerged in the spatial patterns of the time course of epidemic spread. The peaks of the new confirmed cases in various spatio-temporal patterns were mostly observed on February 3, 2020. The average full widths at the half maximum of all ordinary cities were approximately 14 days, thus, resonating with the incubation period of the COVID-19 virus. (3) The degree of the population correlation with Wuhan city has mainly influenced the spreading and the short-distance leapfrogging spatial patterns. The existence of direct flight from Wuhan city exhibited a positive effect on the long-distance leapfrogging spatial pattern. The number of population outflows has significantly affected the leapfrogging spatial pattern. The integrated spatial pattern was influenced by both primary and secondary epidemic outbreak sites. Thus, cities should pay great attention to traffic control during the epidemic as analysis has shown that the spatio-temporal patterns of epidemic spread in the respective cities can curb the spread of the epidemic from key links.
中国COVID-19疫情扩散的时空模式及影响因素
DOI:10.11821/dlxb202202012
[本文引用: 1]
在2020年全球暴发新型冠状病毒肺炎(COVID-19)疫情的背景下,揭示中国疫情扩散时空模式及影响因素对于科学制定防疫策略具有重要作用。针对2020年1月24日—3月18日期间中国COVID-19疫情从快速扩散到逐步控制的完整过程,基于累计确诊病例数据,以317个地级市为对象,建立疫情扩散时空模式判别模型,结合峰位置、半峰间距、峰度、偏度等参数,解析时空模式的基本特征;基于交通可达性、城市关联程度和人口流动构建多元Logistic回归模型,揭示时空模式的关键影响因素。结果显示:① 距武汉市直线距离588 km为判别疫情扩散4种空间模式的有效边界,综合同一空间模式下的时间过程类别,得到13类疫情扩散时空模式。② 蛙跳型的疫情扩散相对严重;除近距离蛙跳型以外,其余空间模式的疫情扩散时间过程差异明显;各种时空模式的新增确诊病例峰值大多为2020年2月3日;所有普通类城市的平均半峰间距约为14 d,与COVID-19病毒的潜伏期一致。③ 与武汉市的人口关联度主要影响蔓延型和近距离蛙跳型空间模式,与武汉市的通航状况对远距离蛙跳型空间模式具有正向影响,迁出人口数量对蛙跳型空间模式有显著作用,综合型空间模式受初级和次级疫情暴发地的双重影响。不同城市应根据自身的疫情扩散时空模式,在疫情期间高度重视交通管控,从关键环节遏制疫情扩散。
The short-term impact of COVID-19 epidemic on the migration of Chinese urban population and the evaluation of Chinese urban resilience
DOI:10.11821/dlxb202011017
[本文引用: 1]
The COVID-19 epidemic in 2020 has a severe impact on China's national economic and social development. Evaluating the short-term impact of the COVID-19 epidemic and the recovery of China's economy and society, as well as revealing its spatiotemporal characteristics, can provide a strong support for the economic situation research and urban restoration of the normalized epidemic prevention and control stage. Based on Baidu migration big data from January 13 to April 8 in 2020 and that of the same period in history, this paper constructs the Relative Recovery Index (RRI) and Recovery Gap Index (RGI). Furthermore, it reveals the daily characteristics, stage characteristics, and spatiotemporal patterns of the short-term impact of the COVID-19 epidemic at multiple scales. The results are as follows: (1) The outbreak did not affect the travel rush before the Spring Festival. The process after the Spring Festival experienced a recovery stagnation period, a rapid recovery period, and a slow recovery period. The overall degree of recovery nationwide rose from less than 20% during the stagnation period to about 60% at the end of the rapid recovery period. The slow recovery period began on March 3, with a recovery index of over 70%. It will take a long time to fully recover to the historical level. (2) The intercity activities on weekends and in holidays were significantly weakened, especially in the central and northeastern regions. (3) The impact of the epidemic on each region is significantly different, in terms of the RRI, the western region > eastern region > central region > northeastern region. (4) The degree of recovery varies significantly between cities. From the Spring Festival to April 8th, the spatial pattern was high in the south and low in the north. According to the severity of the epidemic, Guangzhou, Shenzhen and Chongqing are in the cluster of High confirmed case-High recovery; Hebei, Tianjin, Heilongjiang, Henan, Anhui and Hunan are in the cluster of Low confirmed case-Low recovery. (5) With the effective control of the epidemic, the recovery gap has shifted from the large-scale insufficiency of labor force in the urban agglomerations such as Beijing-Tianjin-Hebei, the Yangtze River Delta, and the Pearl River Delta into the insufficiency in the central cities and some provincial capital cities. The results of this paper show that the use of spatiotemporal big data for real-time impact assessment of major public health emergencies have good application prospects.
COVID-19疫情对中国城市人口迁徙的短期影响及城市恢复力评价
DOI:10.11821/dlxb202011017
[本文引用: 1]
新型冠状病毒肺炎(COVID-19)疫情对中国国民经济和社会发展产生剧烈冲击。科学评价中国受新冠疫情短期影响及恢复情况并揭示其时空特征,可为常态化疫情防控阶段的经济形势研判和城市恢复提供有力支撑。基于2020年1月13日—4月8日百度迁徙大数据,通过构建恢复指数(RRI)和恢复缺口(RGI)等指标,从多尺度揭示中国受COVID-19疫情短期影响的逐日特征、阶段特征以及时空格局。结果发现:① 疫情未影响春节前返乡迁徙,节后恢复经历恢复停滞期、快速恢复期、平稳恢复期,全国总体恢复程度由恢复停滞期不足20%上升至快速恢复期末60%左右,3月3日开始进入平稳恢复期,恢复指数达70%以上,完全恢复至历史同期水平仍需较长时间。② 疫情对周末和节假日城市间交往活动影响显著,中部和东北地区尤为明显。③ 疫情影响的区域差异性明显,相对恢复程度西部>东部>中部>东北地区。④ 城市间恢复程度差异显著,节后至4月8日呈现南高北低空间格局。结合疫情程度,广州、深圳、重庆处于高确诊高恢复聚类,河北、天津、黑龙江、河南、安徽、湖南处于低确诊低恢复聚类。⑤ 随着疫情有效控制,城市层面恢复缺口由京津冀、长三角、珠三角等城市群的大规模成片劳动力迁入缺口,转变为国家中心城市和部分省会城市的点状缺口。本文研究结果表明时空大数据在重大突发公共卫生事件实时影响评价方面具有较好应用前景。
Review on spatiotemporal analysis and modeling of COVID-19 pandemic
COVID-19疫情时空分析与建模研究进展
DOI:10.12082/dqxxkx.2021.200434
[本文引用: 1]
COVID-19疫情是进入21世纪以来最为严重的全球公共卫生事件,并成为不同学科共同关注的热点。根据文献计量学分析结果,从疫情开始直至近期,关于COVID-19疫情的文章已经超过13 000篇,相关研究除从医学及生物学角度探讨病毒致病机理、特效药物和疫苗研制之外,更多的是探索疫情的非药物防控方法。本文针对后者,从传播关系识别、疫情时空模式分析、疫情预测模型、疫情传播模拟、疫情风险评估和疫情影响评价6个方面梳理近期研究进展。传播关系识别的研究主要包括:聚集性疫情和传播关系的识别,其中,个体轨迹大数据已成为此类研究的关键。针对疫情的时空模式分析发现,疫情分布具有显著的时空异质性,而时空传播则呈现出典型的网络特征。针对疫情的预测仍主要依赖于动力学模型,而从宏观到微观的预测模型,人群流动的影响不容忽视,并成为模型预测精度的关键要素之一。针对疫情的情景模拟主要侧重于通过模拟手段评估交通限制、社区防控和医疗资源调配等措施的效果。在非药物的干预中,交通阻断和社区防控措施被证明是目前最有效的手段;医疗资源的保障和优化调配则是防控的基础;而复工复产的情景模拟显示,在防控措施到位的情况下,复工进程必须有序有节。针对疫情风险评估的研究,目前主要关注生物因素、自然因素和社会因素。具体地,疫情感染风险与个体是否具有基础性疾病关系密切,而感染病毒后的死亡率存在性别差异;在自然因素中,如温度、降水、气候等会影响疫情的传播,但影响有限;而社会因素中,除了人群流动和人口密度的影响外,社会不公平性所导致的就医条件差异也会对感染率产生显著影响。针对疫情对未来的影响,本文主要关注公众心理、自然环境和经济发展3个方面,即疫情对公众心理和经济的影响主要以负面为主,而对自然环境的影响则起正向作用。通过对现有研究的系统梳理,可以看出,大数据尤其是个体轨迹和群体大数据在非药物干预的各个方面均发挥了重要的作用;重大疫情的防控已经不是单一学科和手段所能解决的问题,需要多学科的交叉以及不同领域人员的协作;疫情期间各种防控措施的效果、影响因素等均已被明确的揭示,但疫情的空间溯源、精准预测以及对未来的影响仍然是未解的难题。
Cities as systems within systems of cities
DOI:10.1007/BF01942566 URL [本文引用: 1]
Cities and Complexity:Understanding Cities through Cellular Automata, Agent-Based Models and Fractals
The rise, fall, and revival process of allometric scaling analysis in urban studies
DOI:10.11821/yj2013060007
[本文引用: 1]
The allometric scaling analysis in urban studies originated from biology and general system theory.At first,it was employed to analyze the allometric relation between urban and rural population associated with urbanization.Before long,the studies on the scaling relation between urban area and population became the mainstream of the allometric analysis.The chief aim is to reveal the relationship between size and shape of cities.But a dimension conundrum arose.Urban area can be regarded as a 2-D measurement,and urban population used to be treated as a 3-D measurement.Thus,according to the principle of dimensional consistency,the scaling exponent of urban area and population should be 2/3. However,it does not conform to reality.Then,urban population was treated as a 2-D measurement.If this was true,the allometric scaling exponent should equal 1.However,this does not yet tally with the actual situation.Geographers and city scientists were placed in a dilemma whether to treat urban population size as a 2-D or a 3-D measurement because the observed scaling exponent values always come between 2/3 and 1.The geographical students failed to extricate themselves from the theoretical predicament before the introduction of the concept of fractional dimension.The rapid rise of fractal geometry and complexity theory results in the rejuvenation of alloemetric analysis of cities associated with scaling law.Now, allometry has been applied to urban form,urban ecology,urbanism,urban dynamics,and urban systems.All of the applications are the bases of studies on urbanization.One of the most significant research directions of allometry in urban studies in future may be the allometric scaling analysis in urbanization.
城市异速标度研究的起源、困境和复兴
Urban scaling law and its application
DOI:10.11821/dlxb202102001
[本文引用: 2]
The introduction of complexity science in urban geography has provided a new perspective to understand cities. Urban scaling law is one of the simple rules behind complex urban systems, which describes how urban indicators scale with urban population size within the system of cities. Social interaction-related urban indicators, such as GDP and innovation, super-linearly scale with urban population in a power law form, while infrastructure-related urban indicators, such as roads and gas stations, sub-linearly scale with population. Other urban indicators linearly scale with population, which are related to human individual needs, such as jobs and household electricity consumption. In this study, we first summarize the content and progress of urban scaling law during the past decade (2007-2020) from the following four aspects: the validation of urban scaling law, the explanation on the mechanism of urban scaling law, the application of urban scaling law, and the criticism of urban scaling law. We further compare the fundamental differences between the urban scaling law and urban allometric growth. Urban scaling law describes quantitative relationships between urban indicators and population size across cities, while urban allometric growth emphasizes the temporal growth of individual cities. Our analysis indicates that the cross-sectional urban scaling law cannot be applied to predict temporal trajectories of individual cities. Finally, we introduce the scale-adjusted metropolitan indicator (SAMI) for the evaluation of economic performance and urban land use efficiency in 291 Chinese cities, which is based on the theory of urban scaling law. The conventional evaluation of cities based on per capita indicators ignores the non-linear scaling relationship between urban indicators and population size. For example, the GDP per capita of large cities ranks high thanks to their advantages of population size. SAMI eliminates the influence of city size and can compare urban performance more objectively. Cities with higher SAMIs of GDP experience a higher efficiency in economic output (GDP) and they are concentrated in southeast coastal regions, middle reaches of the Yangtze River, and Xinjiang. On the contrary, cities in the northeastern China and Central China Plains experience a relatively low efficiency in economic output. Future studies are encouraged to focus on the mechanism of urban scaling law, the unified model for the evolving urban system across cities and over time, and the scaling law within cities.
城市标度律及应用
DOI:10.11821/dlxb202102001
[本文引用: 2]
城市标度律刻画了城市系统某一指标和人口规模的幂函数缩放关系,包括超线性(社会交互类指标)、次线性(基础设施类指标)和线性(个人需求类指标)3种标度关系。本文从城市标度律的验证、解释、应用和质疑4个方面总结梳理了2007—2020年间的研究进展,重点分析了城市标度律和城市时序发展的异速增长律的明显差异,单个城市时序发展不会遵循城市系统的截面标度律。城市规模修正指标为更加客观地评价城市表现提供了新思路。考虑城市规模效应后,2017年中国经济产出效率较高的城市主要位于东南沿海、长江中游和新疆,而东北和中原地区城市经济产出效率较低。城市标度律的机制解释、城市系统动态演化模型和城市内部标度律是未来值得关注的研究方向。
Urban scaling and the spatio-temporal characteristics of scaling exponents in China
DOI:10.11821/dlxb202012014
[本文引用: 2]
Urban scaling laws depict the nonlinear relationship between urban indicators and population size within an urban system, but its applicability and significance in China's urban system is not clear. This study applied the data of 275 prefecture-level cities in China to explore the scaling relationship between different urban indicators and population sizes. We also attempt to present an empirical analysis of spatio-temporal characteristics of urban scaling exponent (β) from 2000-2017 to enrich the understanding of urban scaling laws. The result shows that as a typical fast urbanizing country, China's urban development conforms to the urban scaling laws but presents some different characteristics from developed countries. There is a significant increasing return to population size of economic output brought by China's urban population agglomeration. Nevertheless, the economies of scale for land use, infrastructure and public service are supposed to be strengthened. Some infrastructure and living facilities indicators have a super-linear or linear relationship with the population size, which are contrary to the expected sublinear regime. The scaling exponents of education, medical and health care and other urban indicators are far below the sub-linear thresholds of developed countries, which reflects the uniqueness in a fast urbanizing country that large cities are given priority to infrastructure construction and the unbalanced development of different-sized cities. The spatial distribution characteristic of scaling exponent reflects the differences in the degree of coordination of urban development, with the most significant differences in Northeast China. We also analyzed the evolution of scaling exponents of major urban indicators over time. Economic increasing returns to population size effect of large cities in China was the most significant in 2009 before falling slightly. Urban land expansion in large cities has continued to accelerate since 2000 and still remains at a high level after 2008. It is urgent to control the extensive urban land expansion and improve land use efficiency, especially in large cities. This study on urban scaling in China contributes to fully understanding the characteristics and evolution of urban systems in the fast urbanizing country. This paper is supposed to provide a support for achieving a balanced regional development and implementing new urbanization development strategies as well.
中国城市标度律及标度因子时空特征
DOI:10.11821/dlxb202012014
[本文引用: 2]
城市标度律刻画了城市系统中城市要素与人口数量之间的规模缩放关系,但标度律在中国城市系统中的适用性和意义尚不明确。本文采用中国275个地级及以上城市数据,探究不同城市要素与人口规模的标度关系,并从时空维度探究标度因子的时空演化规律。结果表明:作为典型的快速城市化发展中国家,中国城市发展符合标度律,且呈现出与发达国家不同的特征:中国城市人口集聚带来的经济产出集聚效应显著,而土地利用、基础设施与公共服务的规模经济效应还有待增强。部分基础设施、生活设施要素与人口规模呈超线性或线性关系,与预期的次线性相悖,基础教育、医疗等要素的标度因子则远低于发达国家的次线性阈值,反映了公共资源向大城市聚集、不同规模城市发展不平衡等快速城镇化进程中城市系统的独特性。标度因子的区域分异反映城市发展协调程度差异,其中东北地区不同规模城市差异最为显著。主要城市要素标度因子随时间的变化表明,中国大城市的经济产出集聚效应在2009年最为显著,而后略有下降;中国大城市土地扩张总体上自2000年以来持续加速,2008年以后仍维持在较高水平,管控城市特别是大城市的外延式扩张、提高土地利用效率具有紧迫性。中国城市标度律研究有助于认知快速城市化地区城市系统特征和演化规律,为实现区域协调发展与落实新型城镇化发展战略提供支持。
Advances in fractal cities: A shift from morphology to network
分形城市研究进展: 从几何形态到网络关联
DOI:10.12082/dqxxkx.2020.200160
[本文引用: 1]
城市是人类文明最主要的聚集地,也是一个开放复杂演化巨系统,认识其空间复杂性成为城市科学研究的热点和前沿。城市研究正呈现“从位置和场所向关联和流,从物质空间向城市网络空间”的转向。人类对城市的认识也从“空间是机器”转向“城市有机生命体”。分形是大自然的语言和地理学第四代语言,是挖掘城市空间自组织规律的有效工具,在揭示城市有机体复杂演化机制方面发挥重要作用。目前分形城市研究以指标构建和实证分析为主,缺乏系统的梳理和回顾;内容上侧重几何分形,复杂城市网络视角下的结构分形研究薄弱。本文简要回顾了近30余年来分形城市研究的发展历程,梳理了分形城市研究脉络:从城市形态的几何分形到城市结构与关联的网络分形,从静态分形特征到动态异速生长,并展望了分形城市未来研究方向。
The origins of scaling in cities
DOI:10.1126/science.1235823
PMID:23788793
[本文引用: 1]
Despite the increasing importance of cities in human societies, our ability to understand them scientifically and manage them in practice has remained limited. The greatest difficulties to any scientific approach to cities have resulted from their many interdependent facets, as social, economic, infrastructural, and spatial complex systems that exist in similar but changing forms over a huge range of scales. Here, I show how all cities may evolve according to a small set of basic principles that operate locally. A theoretical framework was developed to predict the average social, spatial, and infrastructural properties of cities as a set of scaling relations that apply to all urban systems. Confirmation of these predictions was observed for thousands of cities worldwide, from many urban systems at different levels of development. Measures of urban efficiency, capturing the balance between socioeconomic outputs and infrastructural costs, were shown to be independent of city size and might be a useful means to evaluate urban planning strategies.
A unified theory of urban living
DOI:10.1038/467912a URL [本文引用: 1]
Simple spatial scaling rules behind complex cities
Growth, innovation, scaling, and the pace of life in cities
Humanity has just crossed a major landmark in its history with the majority of people now living in cities. Cities have long been known to be society's predominant engine of innovation and wealth creation, yet they are also its main source of crime, pollution, and disease. The inexorable trend toward urbanization worldwide presents an urgent challenge for developing a predictive, quantitative theory of urban organization and sustainable development. Here we present empirical evidence indicating that the processes relating urbanization to economic development and knowledge creation are very general, being shared by all cities belonging to the same urban system and sustained across different nations and times. Many diverse properties of cities from patent production and personal income to electrical cable length are shown to be power law functions of population size with scaling exponents, beta, that fall into distinct universality classes. Quantities reflecting wealth creation and innovation have beta approximately 1.2 >1 (increasing returns), whereas those accounting for infrastructure display beta approximately 0.8 <1 (economies of scale). We predict that the pace of social life in the city increases with population size, in quantitative agreement with data, and we discuss how cities are similar to, and differ from, biological organisms, for which beta<1. Finally, we explore possible consequences of these scaling relations by deriving growth equations, which quantify the dramatic difference between growth fueled by innovation versus that driven by economies of scale. This difference suggests that, as population grows, major innovation cycles must be generated at a continually accelerating rate to sustain growth and avoid stagnation or collapse.
Urban scaling in rapidly urbanising China
DOI:10.1177/00420980211017817 URL [本文引用: 1]
Scaling laws in intra-urban systems and over time at the district level in Shanghai, China
Assessment of multidimensional performance for Chinese cities based on urban scaling law
DOI:10.11821/dlyj020200537
[本文引用: 1]
Urban scaling laws reveal the universal non-linear scaling relationships between urban indicators and urban population size. However, most current urban assessments ignore this non-linear relationship and often use per capita indicators to compare cities of different sizes, which may bias the cognition of urban development. To address this problem, considering the non-linear scaling relationship between urban population size and urban indicators, an urban performance index (UPI) is constructed to correct the impact of the urban size and measure the degree to which the urban indicator actually exerted their expected abilities. Taking 9 urban indicators in multi-dimensions of urban development as examples, the performance of 9 dimensions in 2017 for 292 cities at prefecture level or above in China was measured, and the spatial differentiation and agglomeration characteristics were studied. The advantage of UPI and its policy implications are also discussed. The results show that: (1) All the nine urban indicators are in compliance with the urban scaling law, and eight of them have a non-linear scaling relationship with the urban population. It is feasible and necessary to measure urban performance from the perspective of scaling law. (2) The performance of urban comprehensive economy, commercial consumption and public finance is generally higher in the eastern region of China. The basic education in the northeast and the public transportation in the central and western regions perform relatively worse; the corresponding performance in areas with higher land and water endowments is not high; the ecological green space performance of most cities is low. Among major cities with a population of more than 6 million, Hangzhou, Shenzhen, and Tianjin have more balanced performance in all dimensions. (3) The comparison with the results of per capita indicators proves that the UPI can modify the impact of urban scale on urban assessment, which is a useful supplement to the total and per capita indicators. The assessment of urban performance based on the urban scaling law can provide clear guidance for the decision-making of urban population management and urban development, and at the same time provide more objective comparison lens for cities of different sizes. Our work is of significance to the implementation of China's new-type urbanization and national urban system planning.
标度律视角的城市效能测度及中国城市多维要素效能分析
DOI:10.11821/dlyj020200537
[本文引用: 1]
“城市标度律”(urban scaling laws)揭示了城市系统中城市人口和城市要素间普遍存在的非线性规模缩放关系,但目前大多数城市评价忽视了这种关系,常使用人均指标比较不同规模的城市,这会导致评价结果偏差。为此,考虑城市人口和城市要素间的非线性规模缩放关系构建了要素效能指数,用以修正城市规模的影响,度量城市要素实际发挥出预期能力的程度。以城市发展不同维度上的9个城市要素为例,分别测度了2017年中国292个地级以上城市各要素的效能,识别了各要素效能的空间差异和集聚特征,分析了要素效能指数的优势并讨论了结果的政策启示。结果表明:① 9个城市要素都符合“城市标度律”,其中8个要素与城市人口呈非线性规模缩放关系;从标度律的视角测度城市效能是必要而且可行的。② 城市综合经济、商业消费和公共财政效能普遍以东部沿海地区较高;东北地区的基础教育和中西部地区的公共交通效能较低;土地和水资源禀赋较高的地区对应的效能值并不高;大部分城市的生态绿地效能较低。600万人以上的城市中,杭州、深圳、天津的各维度效能表现较均衡。③ 与人均指标评价结果的对比证明要素效能指数能够修正人口规模对城市评价的影响,对常用的总量和人均指标是有益的补充。标度律视角下的城市效能测度能够给城市人口管理和城市要素发展的决策提供明确的指导方向,同时为不同规模大小的城市提供更客观的比较标准,对国家城镇体系规划和落实中国新型城市化战略具有积极意义。
Urban scaling of health outcomes: A scoping review
DOI:10.1007/s11524-021-00577-4 URL [本文引用: 1]
Scaling of mortality in 742 metropolitan areas of the Americas
Population size and urban health advantage: Scaling analyses of four major diseases for 417 US counties
DOI:10.1504/IJSSS.2018.089485 URL [本文引用: 1]
Explaining the prevalence, scaling and variance of urban phenomena
On the scaling patterns of infectious disease incidence in cities
Per capita incidence of sexually transmitted infections increases systematically with urban population size: A cross-sectional study
DOI:10.1136/sextrans-2014-051932
PMID:25921021
[本文引用: 1]
Rampant urbanisation rates across the globe demand that we improve our understanding of how infectious diseases spread in modern urban landscapes, where larger and more connected host populations enhance the thriving capacity of certain pathogens.A data-driven approach is employed to study the ability of sexually transmitted diseases (STDs) to thrive in urban areas. The conduciveness of population size of urban areas and their socioeconomic characteristics are used as predictors of disease incidence, using confirmed-case data on STDs in the USA as a case study.A superlinear relation between STD incidence and urban population size is found, even after controlling for various socioeconomic aspects, suggesting that doubling the population size of a city results in an expected increase in STD incidence larger than twofold, provided that all other socioeconomic aspects remain fixed. Additionally, the percentage of African-Americans, income inequalities, education and per capita income are found to have a significant impact on the incidence of each of the three STDs studied.STDs disproportionately concentrate in larger cities. Hence, larger urban areas merit extra prevention and treatment efforts, especially in low-income and middle-income countries where urbanisation rates are higher.Published by the BMJ Publishing Group Limited. For permission to use (where not already granted under a licence) please go to http://www.bmj.com/company/products-services/rights-and-licensing/
Growth patterns and scaling laws governing AIDS epidemic in Brazilian cities
Influenza and pneumonia mortality in 66 large cities in the United States in years surrounding the 1918 pandemic
COVID-19 thrives in larger cities, not denser ones
Urban scaling of COVID-19 epidemics
City size and the spreading of COVID-19 in Brazil
Early pandemic COVID-19 case growth rates increase with city size
Why pandemics, such as COVID-19, require a metropolitan response
Population density and spreading of COVID-19 in England and Wales
Scaling: Lost in the smog
DOI:10.1068/b4105c URL [本文引用: 1]
The definition of city boundary and scaling law
DOI:10.11821/dlxb201702003
[本文引用: 1]
Scaling laws are powerful reflectors of the variations of the output of urban economic activities and the number of infrastructures with urban population. However, the difference in spatial definition of cities and data sources by countries leads to different statistical results of scaling law. We aim to analyse the difference in this paper by calculating regression coefficients of scaling law at different spatial scales, combined with census data, urban statistical yearbook data and remote sensing data of China. The conclusions are shown as follows: (1) Scaling coefficients change with both spatial scales and data sources. For spatial scales, scaling law is more agreeable with the data of urban municipal districts than with those of the whole city area in China. As there is a large number of non-urbanized areas within cities; these regions do not meet the assumptions of scaling law model. For data source, remote sensing data have a better fitting result than urban statistical yearbook data. (2) Comparatively speaking, urban population agglomeration contributes more to economic growth in China than it does in the US, but China has lower energy consumption and land-use efficiency. For example, the Gross Regional Product (GRP) scaling indicator of China is 1.22, while it is 1.11 in the United States. (3) Population agglomeration contributes more to the economic growth in large cities than in small cities. This may explain the emerging trends of urban immigrants in large cities of China. However, for energy consumption, small and medium-sized cities are more efficient than large cities. In addition, this paper discusses the potential direction for urban scaling research from three aspects: establishing more effective statistical units, combining traditional survey with big data analysis, and exploring mechanics behind scaling models.
城市范围界定与标度律
DOI:10.11821/dlxb201702003
[本文引用: 1]
标度律作为城市发展的重要规律之一,反映了城市经济活动产值、基础设施数量等要素随城市人口规模的变动情况,在城市研究领域引起了广泛讨论。但由于不同国家的城市统计数据对应的空间范围各不相同,导致标度律系数受城市边界范围选取影响很大。本文通过比较中、美两国统计数据对应的空间范围,并结合普查、城市统计年鉴和遥感数据,计算了不同空间范围对应的标度律系数。结果表明:① 不同空间尺度和数据源得到的标度律系数有较大差异。就空间尺度而言,市辖区比市域范围的数据更符合标度律模型,因为中国城市市域范围内还存在大量的非城市化地区,并不符合标度律模型的适用条件;就数据源而言,遥感数据比城市统计年鉴数据有更好的拟合优度;② 与美国城市相比,中国城市人口集聚带来的经济增长率更高(标度律系数更高),市辖区人口每增加一倍,经济规模可增加122%,这一数字在美国是111%;而在家庭能源消耗(用水、用电)和土地利用方面,中国城市的效率更低;③ 从中国城市内部对比来看,大城市与中小城市在经济规模、土地利用方面的标度律(集聚效率)明显不同,人口集聚效应带来的大城市经济增长率、工资收入要远高于中小城市;能源消耗方面,中小城市比大城市更有效率。最后,本文还从建立更加有效的统计单元、传统统计数据与大数据结合、模型机制探索3个方面阐述了城市标度律未来可能的研究方向。
Removing spatial autocorrelation in urban scaling analysis
Scaling trajectories of cities
DOI:10.1073/pnas.1906258116
PMID:31235579
[本文引用: 1]
Urban scaling research finds that agglomeration effects-the higher-than-expected outputs of larger cities-follow robust "superlinear" scaling relations in cross-sectional data. But the paradigm has predictive ambitions involving the dynamic scaling of individual cities over many time points and expects parallel superlinear growth trajectories as cities' populations grow. This prediction has not yet been rigorously tested. I use geocoded microdata to approximate the city-size effect on per capita wage in 73 Swedish labor market areas for 1990-2012. The data support a superlinear scaling regime for all Swedish agglomerations. Echoing the rich-get-richer process on the system level, however, trajectories of superlinear growth are highly robust only for cities assuming dominant positions in the urban hierarchy.Copyright © 2019 the Author(s). Published by PNAS.
Evolution of urban scaling: Evidence from Brazil
