

1 引言
“胡焕庸线”是从黑龙江省黑河到云南省腾冲,大致为倾斜45°的一条人口分布直线,号称中国的“突变线”。本文所指的“胡焕庸线”西北半壁包括内蒙古自治区(不含赤峰市、通辽市、兴安盟)、甘肃省、宁夏回族自治区、新疆维吾尔自治区、青海省、西藏自治区、大兴安岭地区、陕西省榆林市、四川省阿坝藏族羌族自治州、甘孜藏族自治州、云南省迪庆藏族自治州和怒江傈僳族自治州,占全国总面积的43.4%;东南半壁是除西北半壁以外的全国部分,占全国总面积的56.6%[1-2]。采用高分遥感和GIS技术科学识别近80年来“胡焕庸线”东南半壁和西北半壁各种自然要素和人文要素的变化过程后发现,“胡焕庸线”是中国重要的功能分界线,包括中国重要的人口地理分界线[3]、重要的自然地理与生态环境分界线[4]、国家主体功能区与国家生态功能区分界线、中国新型城镇化主体区与非主体区分界线,也是中国经济社会发展不平衡不充分的分界线、中国农耕民族和游牧民族的交融线、人居环境适宜性与非适宜性分界线[5]。
2 “胡焕庸线”东西部城乡发展不平衡的人文要素认知
本文选取人口、经济、投资、能源、城镇化和社会六大人文要素,分析1950—2020年近70年间“胡焕庸线”东西部人文要素发展的不平衡态势。
2.1 人口要素认知:94∶6的人口分布格局稳中微变
“胡焕庸线”是中国重要的人口地理分界线,东南半壁与西北半壁常住人口比重长期稳定在94∶6,但有微弱的慢变化[6-7]。1953—2020年的67年间,“胡焕庸线”西北半壁人口由0.31亿人增至0.92亿人,人口年均微增速度为1.64%,年均增加91万人,相当于每年新建1座中等城市。西北半壁人口占全国人口的比重由1953年的5.2%微增到2010年的6.32%,再微增到2020年的6.52%,人口占比持续微增1.32个百分点,西北半壁人口增长始终快于东南半壁,1981年西北半壁人口平均自然增长率为19.3‰,是当年全国水平14.55‰的1.33倍,同期东南半壁平均值仅为14.31‰。到2020年西北半壁人口自然增长率平均值达到3.85‰,是全国水平1.45‰的2.66倍;而东南半壁平均值只有1.23‰,仍然低于全国水平。人口稠密区始终分布在华北平原、长江中下游平原、四川盆地、东南沿海、关中平原等地区,人口稀疏区的分布格局也相对稳定(图1)。西北半壁存在人口相对稠密区,包括兰州—西宁、天山北坡城市群等。
图1
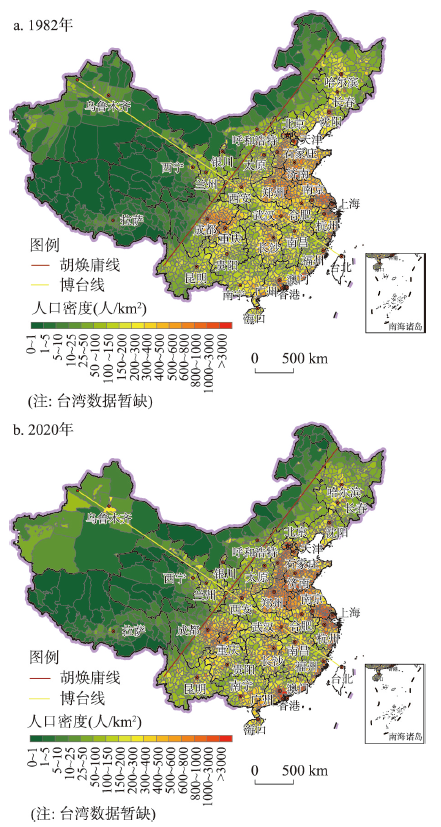
图1
1982年和2020年“胡焕庸线”两侧分县人口密度分布
Fig. 1
Population density distribution of counties on both sides of Hu Huanyong Line in 1982 and 2020
2.2 经济要素认知:95∶5的经济产出格局稳中微变
表1 1950—2020年“胡焕庸线”两侧经济总量变化(亿元)
Tab. 1
| 年份 | 1950 | 1960 | 1970 | 1980 | 1990 | 2000 | 2010 | 2020 | 历年平均增长 速度(%) |
|---|---|---|---|---|---|---|---|---|---|
| 东南半壁 | 653.6 | 1369.0 | 2144.7 | 4353.6 | 17904.1 | 96032.9 | 388533.0 | 965108.6 | 10.99 |
| 西北半壁 | 25.5 | 88.0 | 108.0 | 234.0 | 968.8 | 4247.2 | 24497.0 | 50877.6 | 11.47 |
| 合计 | 679.1 | 1457.0 | 2252.7 | 4587.6 | 18872.9 | 100280.1 | 413030 | 1015986.2 | 11.01 |
注:历年平均增长速度为年均名义GDP增长率。
图2
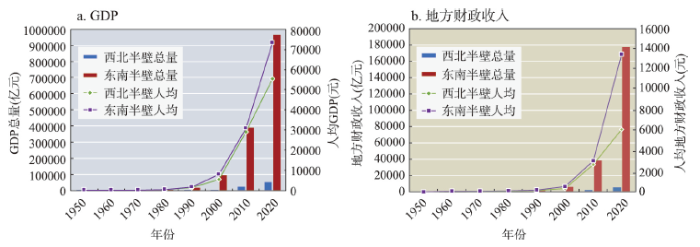
图2
1950—2020年“胡焕庸线”两侧主要经济指标变化示意图
Fig. 2
Diagram of main economic indicators on both sides of Hu Huanyong Line from 1950 to 2020
表2 1950—2020年“胡焕庸线”两侧经济总量占比变化(%)
Tab. 2
| 年份 | 1950 | 1960 | 1970 | 1980 | 1990 | 2000 | 2010 | 2020 | 占比变化幅度(%) |
|---|---|---|---|---|---|---|---|---|---|
| 东南半壁 | 96.25 | 93.96 | 95.21 | 94.90 | 94.87 | 95.76 | 94.07 | 94.99 | 微减1.26 |
| 西北半壁 | 3.75 | 6.04 | 4.79 | 5.10 | 5.13 | 4.24 | 5.93 | 5.01 | 微增1.26 |
| 两侧大致比例 | 96∶4 | 94∶6 | 95∶5 | 95∶5 | 95∶5 | 96∶4 | 94∶6 | 95∶5 | 基本稳定 |
| 合计 | 100 | 100 | 100 | 100 | 100 | 100 | 100 | 100 | - |
表3 1950—2020年“胡焕庸线”两侧地方财政收入变化(亿元)
Table 3
| 年份 | 1950 | 1960 | 1970 | 1980 | 1990 | 2000 | 2010 | 2020 | 历年平均增长 速度(%) |
|---|---|---|---|---|---|---|---|---|---|
| 东南半壁 | 34.8 | 401.8 | 464.4 | 849.3 | 1845.7 | 6134.9 | 38344.4 | 177303.0 | 12.97 |
| 西北半壁 | 1.4 | 27.7 | 15.5 | 26.2 | 99.0 | 271.2 | 2268.6 | 5610.9 | 12.58 |
| 合计 | 36.2 | 429.5 | 479.9 | 875.5 | 1944.7 | 6406.1 | 40613 | 182913.9 | 12.96 |
表4 1950—2020年“胡焕庸线”两侧地方财政收入占比变化(%)
Tab. 4
| 年份 | 1950 | 1960 | 1970 | 1980 | 1990 | 2000 | 2010 | 2020 | 平均占比(%) |
|---|---|---|---|---|---|---|---|---|---|
| 东南半壁 | 96.13 | 93.55 | 96.77 | 97.01 | 94.91 | 95.77 | 94.41 | 96.93 | 95.51 |
| 西北半壁 | 3.87 | 6.45 | 3.23 | 2.99 | 5.09 | 4.23 | 5.59 | 3.07 | 4.32 |
| 两侧大致比值 | 96∶4 | 94∶6 | 97∶3 | 97∶3 | 95∶5 | 95∶5 | 95∶5 | 97∶3 | 96∶4 |
(2)东南半壁与西北半壁人均经济指标绝对值差额在加速拉大。一是人均GDP增速基本一致(平均9.4%左右),但绝对值差额在以10.07%的速度加速拉大。1950—2020年的70年间,东南半壁人均GDP由124元增加到73225.2元,历年平均增长速度为9.54%,而西北半壁人均GDP由112.3元增加到55301.7元,历年平均增长速度为9.26%,两侧人均GDP增速基本一致(表5),西北半壁与东南半壁人均GDP比值也在缓慢降低,由1950年的0.83降低到2020年的0.76(表6),但西北半壁与东南半壁人均GDP绝对值差额在以年均10.07%的速度拉大,由1950年的21.7元拉大到2020年的17923.5元(表7)。
表5 1950—2020年“胡焕庸线”两侧人均经济指标变化
Tab. 5
| 年份 | 1950 | 1960 | 1970 | 1980 | 1990 | 2000 | 2010 | 2020 | 历年平均增长 速度(%) | |
|---|---|---|---|---|---|---|---|---|---|---|
| 东南 半壁 | 人均GDP(元) | 124.0 | 219.0 | 273.6 | 468.5 | 1665.4 | 8076.0 | 30924.5 | 73225.2 | 9.54 |
| 人均地方财政收入(元) | 6.6 | 64.3 | 59.3 | 91.4 | 171.7 | 515.9 | 3051.9 | 13452.4 | 11.50 | |
| 人均固定资产投资(元) | - | - | - | 92.7 | 395.6 | 2615.3 | 18554.9 | 37139.3 | 16.16 | |
| 西北 半壁 | 人均GDP(元) | 112.3 | 238.5 | 234.3 | 405.0 | 1419.2 | 5423.5 | 28984.3 | 55301.7 | 9.26 |
| 人均地方财政收入(元) | 5.7 | 75.0 | 33.7 | 45.3 | 145.0 | 346.3 | 2684.2 | 6098.8 | 10.48 | |
| 人均固定资产投资(元) | - | - | - | 85.0 | 386.3 | 2322.6 | 18274.4 | 41059.0 | 16.71 | |
表6 1950—2020年“胡焕庸线”西北半壁与东南半壁人均经济指标比值变化
Tab. 6
| 年份 | 1950 | 1960 | 1970 | 1980 | 1990 | 2000 | 2010 | 2020 | 指标比值变化趋势 |
|---|---|---|---|---|---|---|---|---|---|
| 人均GDP | 0.83 | 1.09 | 0.86 | 0.86 | 0.85 | 0.67 | 0.94 | 0.76 | 微降 |
| 人均地方财政收入 | 0.86 | 1.17 | 0.57 | 0.50 | 0.84 | 0.67 | 0.88 | 0.45 | 降低 |
| 人均固定资产投资 | - | - | - | 0.92 | 0.98 | 0.89 | 0.98 | 1.11 | 提高 |
表7 1950—2020年“胡焕庸线”两侧人均经济指标绝对值差额变化
Tab. 7
| 年份 | 1950 | 1960 | 1970 | 1980 | 1990 | 2000 | 2010 | 2020 | 绝对值差额 拉大速度(%) |
|---|---|---|---|---|---|---|---|---|---|
| 人均GDP(元) | 21.7 | -19.5 | 39.3 | 63.5 | 246.2 | 2652.5 | 1940.2 | 17923.5 | 10.07 |
| 人均地方财政收入(元) | 0.9 | -10.7 | 25.6 | 46.1 | 26.7 | 169.6 | 367.7 | 7353.6 | 13.74 |
| 人均固定资产投资(元) | - | - | - | 7.7 | 9.3 | 292.7 | 280.7 | -3919.7 | - |
二是人均地方财政收入增速基本一致(10%~11%之间),但绝对值差额在以13.74%的速度加速拉大。1950—2020年的70年间,东南半壁人均地方财政收入由6.6元增加到13452.4元,历年平均增长速度为11.50%,而西北半壁由5.7元增加到6098.8元,历年平均增长速度为10.48%,西北半壁与东南半壁人均地方财政收入的比值在缓慢降低,由1950年的0.86降低到2020年的0.45,西北半壁与东南半壁人均地方财政收入的绝对值差额在以历年平均13.74%的速度加速拉大,由1950年的0.9元拉大到2020年的7353.6元。
2.3 投资要素认知:94∶6的投资格局稳中微变
“胡焕庸线”东南半壁与西北半壁投入占比基本稳定在94∶6左右,投入增速基本一致(17%~18%)。从全社会固定资产投资增长速度和占比变化分析,1980—2020年40年间,“胡焕庸线”东南半壁和西北半壁全社会固定资产投资历年平均增长速度分别为17.18%和18.07%(表8),增速基本一致;而东南半壁和西北半壁全社会固定资产投资占比长期稳定在94∶6(表9)。人均全社会固定资产投资增速基本一致(16%左右),西北半壁后来居上,实现反超。1980—2020年东南半壁人均全社会固定资产投资由92.7元增加到37139.3元,历年平均增长速度为16.16%,而西北半壁人均全社会固定资产投资由85元增加到41059.0元,历年平均增长速度为16.71%,两侧人均全社会固定资产投资增速基本一致。2020年西北半壁人均全社会固定资产投资超过东南半壁,二者比值由1980年的0.92提高到2020年的1.11,二者人均绝对值差额西北半壁超过东南半壁3919.7元。
表8 1980—2020年“胡焕庸线”两侧投资总量变化
Tab. 8
| 年份 | 1980 | 1985 | 1990 | 1995 | 2000 | 2005 | 2010 | 2016 | 2020 | 历年平均增长速度(%) | |
|---|---|---|---|---|---|---|---|---|---|---|---|
| 东南 半壁 | 全社会固定资产 投资(亿元) | 861.8 | 2378.4 | 4253.3 | 19050.7 | 31098.9 | 83215.7 | 233122.0 | 567777.7 | 489496.0 | 17.18 |
| 实际利用外资 (亿美元) | 7.39 | 47.6 | 102.9 | 481.33 | 593.60 | 638.1 | 1088.2 | 1213.1 | 1417.9 | 14.04 | |
| 西北 半壁 | 全社会固定资产 投资(亿元) | 49.1 | 164.8 | 263.7 | 968.6 | 1818.8 | 5557.9 | 18561.8 | 38688.3 | 37774.3 | 18.07 |
| 实际利用外资 (亿美元) | 0.0 | 0.6 | 1.2 | 4.9 | 9.3 | 17.0 | 43.8 | 46.9 | 25.8 | 11.34 | |
| 全国 合计 | 全社会固定资产 投资(亿元) | 910.9 | 2543.2 | 4517 | 20019.3 | 32917.7 | 88773.6 | 251683.8 | 606466 | 527270.3 | 17.24 |
| 实际利用外资 (亿美元) | 7.39 | 48.2 | 104.1 | 486.23 | 602.9 | 655.1 | 1132 | 1260 | 1443.7 | 14.10 | |
表9 1980—2020年“胡焕庸线”两侧投资占比变化(%)
Tab. 9
| 年份 | 1980 | 1985 | 1990 | 1995 | 2000 | 2005 | 2010 | 2016 | 2020 | 历年平均 占比(%) | |
|---|---|---|---|---|---|---|---|---|---|---|---|
| 东南半壁 | 全社会固定资产投资 | 94.61 | 93.52 | 94.16 | 95.16 | 94.47 | 93.74 | 92.62 | 93.62 | 92.84 | 93.86 |
| 实际利用外资 | 100 | 98.76 | 98.85 | 98.99 | 98.46 | 97.40 | 96.13 | 96.28 | 98.21 | 98.12 | |
| 西北半壁 | 全社会固定资产投资 | 5.39 | 6.48 | 5.84 | 4.84 | 5.53 | 6.26 | 7.38 | 6.38 | 7.16 | 6.14 |
| 实际利用外资 | 0 | 1.24 | 1.15 | 1.01 | 1.54 | 2.60 | 3.87 | 3.72 | 1.79 | 1.88 | |
从实际利用外资增长速度和占比变化分析(表9),1980—2020年40年间,“胡焕庸线”东南半壁和西北半壁实际利用外资历年平均增长速度分别为14.04%和11.34%,东南半壁快于西北半壁;而东南半壁和西北半壁实际利用外资占比基本达到98.21∶1.79。
2.4 能源要素认知:91∶9的能源消费格局稳中微变
表10 1980—2020年“胡焕庸线”两侧电力消费量变化(亿kW·h)
Tab. 10
| 年份 | 1980 | 1985 | 1990 | 1995 | 2000 | 2005 | 2010 | 2016 | 2020 | 历年平均增长 速度(%) |
|---|---|---|---|---|---|---|---|---|---|---|
| 东南半壁 | 2782.4 | 3795.6 | 5762.9 | 9313.0 | 12490.0 | 22955.1 | 37898.9 | 50459.7 | 65288.1 | 8.21 |
| 西北半壁 | 223.9 | 322.0 | 467.5 | 710.4 | 981.3 | 1985.3 | 4035.6 | 7560.3 | 9925.9 | 9.94 |
| 合计 | 3006.3 | 4117.6 | 6230.4 | 10023.4 | 13471.3 | 24940.4 | 41934.5 | 58020 | 75214.0 | 8.38 |
表11 1980—2020年“胡焕庸线”两侧电力消耗量占比变化(%)
Tab. 11
| 年份 | 1980 | 1985 | 1990 | 1995 | 2000 | 2005 | 2010 | 2016 | 2020 | 平均占比(%) |
|---|---|---|---|---|---|---|---|---|---|---|
| 东南半壁 | 92.55 | 92.18 | 92.50 | 92.91 | 92.72 | 92.04 | 90.38 | 86.97 | 86.80 | 91.01 |
| 西北半壁 | 7.45 | 7.82 | 7.50 | 7.09 | 7.28 | 7.96 | 9.62 | 13.03 | 13.20 | 8.99 |
| 两侧大致比值 | 93∶7 | 92∶8 | 93∶7 | 93∶7 | 93∶7 | 92∶8 | 90∶10 | 87∶13 | 87∶13 | 91∶9 |
2.5 城镇化要素认知:95∶5的城镇数量格局稳定不变
中国95%以上的新型城镇化主体区城市群、83%以上的新型城镇化试点区、所有国家中心城市、90%以上的设市城市、95.46%的建制镇集中在东南半壁,因此“胡焕庸线”是中国新型城镇化主体区与非主体区的分界线。1980—2020年的40年间,“胡焕庸线”东南半壁和西北半壁城市群发育个数没有改变,东南半壁集中了中国19个城市群中的15个,而西北半壁只有4个。西北半壁城市群面积长期占全国城市群的15%~16%左右,人口长期占3.5%左右,城镇人口长期占4%左右,市辖区城市建设用地长期占5%~6%,经济总量长期占3%~4%左右,全社会固定资产投资占3%~4%左右,全社会劳动力占2%~3%左右,实际利用外资占2%左右,社会消费品零售总额和粮食总产量占3%左右,移动互联网用户数和国际互联网用户数占3%左右,高等学校在校学生数和医生数占4%~5%左右。“胡焕庸线”两侧城市规模等级差异显著,西北侧没有超大城市与特大城市。2008—2017年间“胡焕庸线”两侧城市化水平格局东南侧高于西北侧[8]。
2.6 社会要素认知:主要均量指标的绝对差距加速拉大
1980—2020年间各项指标分析表明,“胡焕庸线”东南半壁教育资源始终占全国93%,而西北半壁占7%左右;东南半壁技术创新能力指标占全国98%,而西北半壁仅占2%左右,东南半壁综合创新指数高于西北半壁,呈“东强西弱、东稳西动”格局。“胡焕庸线”城镇居民人均可支配收入相对差距呈缩小趋势,但绝对差额以28.9%的速度加速拉大;农村居民人均可支配收入相对差距呈缩小趋势,但绝对差额以16.4%的速度加速拉大;城镇在岗职工平均工资绝对差距在波动中以16.2%的速度加速拉大;交通路网密度绝对差距以历年平均4.77%的速度加速拉大;教育资源(每万人在校大学生数)绝对差距以历年平均3.69%的速度加速拉大;医疗资源(人均床位数)绝对差距缩小至西北半壁超过东南半壁。
3 “胡焕庸线”微突破的实质与东西部城乡发展不平衡的演变趋势
3.1 “胡焕庸线”实现“微突破”的实质与西部地区增速增量提质发展新路
“胡焕庸线”是一条受制于自然条件刚性约束的人口与经济社会发展不平衡线,当自然条件不改变时,这条线将无法实现突破,只能遵循自然规律,敬畏自然、尊重自然,保护自然。但从1950—2020年间“胡焕庸线”两侧各项人口与经济社会发展指标的变化态势来看,这条线两侧的各项经济社会指标不是固定不变的,而是呈现出缓慢微增或微减态势,甚至部分自然要素如温度、降水、湿度也随着全球气候变暖而发生着微小的变化,这就为“微突破”提供了可能性。
微突破的实质是指在不违背自然规律的前提下,从自然条件刚性约束中通过各种技术与政策努力慢慢突破一点点来,实现弹性限度内“小而慢”的微小突破,1950—2020年的近70年间各项指标占比变化量不超过5%,占比变化速度不超过1%,这是一个难度相当大的漫长过程。
微突破的路径就是要在现代化高新技术、新型生产方式、新的商业模式、现代资本运作和科学政策引导下,通过西部农业现代化、新型城镇化、新型工业化、信息化与绿色化五化协同发展,实现东西部共同富裕,而不是突破自然因素,在西部大举农业生产,更不是人口的大量西部迁移。“微突破”是缩小东西部城乡发展差距、捍卫国防安全、保障社会稳定的战略选择。西部边境线需有人守护,需要固守边疆,保障国家安全。
微突破的实质内涵告诉我们,西北半壁不能走全国“一刀切”的经济发展政策、财政税务政策和环境保护政策,更不能走减速减量发展之路,而是要从保障国家安全、国家生态安全战略高度,走出一条不同于东南半壁的“快而好、特而精、富而美、安而稳”的增速增量提质发展新路子,通过“胡焕庸线”的微突破,在将西北半壁绿水青山转化为金山银山的同时,将东西部发展差距缩小到合理范围内。
在“胡焕庸线”所承载的多功能复合分界线中,可将其分为长期不可破的刚性保护线和长期微突破的弹性发展线两大类。其中,长期不可破的刚性保护线包括:自然地理环境分界线(包括10~12 ℃年均气温分界线、300 mm等降水量线、地势第二、三级阶梯分界线、脆弱生态景观分界线和水资源线等)、国家主体功能区分界线、季风农业气候区分界线等,不但不能破,而且还需要进一步加强保护力度[9-10]。长期微突破的弹性发展线包括人口分界线、新型城镇化主体区分界线、经济社会发展不平衡不充分的分界线[11]、人居环境适宜度分界线和民族交融线等,需要在资源环境承载力的弹性限度内通过倾斜政策投入,适度转移人才和推进新型城镇化,改善人居环境。需要在综合国力允许的条件下,从保障国家安全和长久稳定的角度在内外资投入、重点项目布点、边疆基础设施建设、科技教育、基本公共服务均等化等方面实现大突破,近期实现与东南半壁同速同等同标同量,远期实现西北半壁各项均量指标超越东南半壁水平的目标[12]。
微突破需要因线制宜,宜破则破。为推动东西部实现更平衡更充分发展需要解决“五转两保障”共7个相互联系相互制约的重大问题,包括人口转移、技术转移、产业转型、适度调水、补偿转移和提质保障、安全保障问题。其中适度的人口转移是关键,人可以带技术、带产业,实现人移产业和人移技术,适度调水转移是生命线,无水就没有一切,五大问题形成了一个环环相扣的转移链和破解链,关键环节无法突破,则微突破“胡焕庸线”将难上加难。西北半壁发展的关键在于质量,在于安全。解决上述重大问题,需通过西北半壁的更大更快发展,拉动与东南半壁的更平衡更充分发展。
3.2 微突破背景下“胡焕庸线”东西部城乡发展不平衡趋势
通过微突破,到2049年的未来近30年时间里,需要通过破解“胡焕庸线”,最大限度地缩小东西部发展差距,解决中国经济社会发展不平衡不充分的问题,这是中国基本实现现代化的关键。而要实现这一目标,需要基于过去1950—2020年的70年间人口与各项经济社会指标的历年平均增长速度,并考虑技术进步、投资与产业转移等多重因素,预计出到2035年和2049年“胡焕庸线”东西部城乡发展不平衡的演变趋势,结果如表12所示。
表12 “胡焕庸线”西北半壁主要经济社会发展指标微突破一览表(%)
Tab. 12
| 功能分界线 | 1950—2020年 | 2025年 | 2030年 | 2035年 | 2049年 | 微突破程度 | |
|---|---|---|---|---|---|---|---|
| 历年平均 | “十四五” | “十五五” | 基本实现 现代化 | 建国100 周年 | |||
| 面积占比 | 43.4 | 43.4 | 43.4 | 43.4 | 43.4 | 零突破 | |
| 中国重要的人 口地理分界线 | 人口占比 | 6.0 | 7.0 | 7.5 | 9.0 | 10.0 | 可新增4500万~5000万人 |
| 国家城镇化主 体区分界线 | 国家新型城镇化主 体区占比 | 3.5 | 4.5 | 5.0 | 5.0 | 5.0 | 微突破 |
| 中国经济发展 不平衡分界线 | 经济总量比重 | 5.0 | 6.92 | 7.94 | 8.98 | 10.0 | 微突破 |
| 经济增长速度 | 11.5 | 13.0 | 13.0 | 13.0 | ≥ 10.0 | 以快于东南半壁3%速度增长 | |
| 地方财政收入比重 | 4.3 | 5.5 | 6.5 | 7.5 | 10.0 | 微突破 | |
| 全社会固定资产投 资比重 | 6.10 | 7.92 | 8.85 | 9.93 | ≥ 10.0 | 以快于东南半壁3%速度增长 | |
| 实际利用外资比重 | 1.9 | 3.5 | 5.0 | 6.5 | 10.0 | 微突破 | |
| 能源消费比重 | 9.0 | 9.2 | 9.4 | 9.6 | 10.0 | 微突破 | |
| 中国社会发展 不平衡分界线 | 人均GDP增长速度 | 9.3 | 11.0 | 11.0 | 11.0 | ≥ 10.0 | 以快于东南半壁2%速度增长 |
| 城镇居民人均可支 配收入拉大速度 | 28.9 | 20.0 | 15.0 | 10.0 | ≤ 10.0 | 以快于东南半壁2%速度增长 | |
| 农村居民人均可支 配收入拉大速度 | 16.4 | 14.0 | 13.0 | 12.0 | ≤ 10.0 | 以快于东南半壁3%速度增长 | |
| 教育资源绝对差距 缩小速度 | -3.7 | 2.0 | 5.0 | 7.5 | ≥ 10.0 | 微突破 | |
3.3 2035年基本实现现代化的不平衡发展趋势
2035年是中国确定的基本实现现代化和基本建成美丽中国的重要历史时期。预计到2035年底,西北半壁人口占比争取达到9.0%,经济总量占比争取达到8.98%,经济增长速度保持在13%以上,全社会固定资产投资占比争取达到9.93%,地方财政收入占比争取超过7.5%,实际利用外资占比争取达到6.5%,能源消费比重争取控制在7.5%,人均GDP增速争取超过11%,城镇居民人均可支配收入绝对差额拉大速度争取控制在10%以内,农村居民人均可支配收入绝对差额拉大速度争取控制在12%以内,教育资源绝对差距缩小速度为7.5%。通过上述指标的微突破,为缩小东西部发展不平衡不充分差距做出实质性贡献,为基本实现现代化奠定扎实的发展基础。
3.4 2049年中华人民共和国成立100周年的不平衡发展趋势
2049年是中华人民共和国成立100周年的重要历史时期。预计到2049年底,需微突破“10个10%”:西北半壁人口占比争取达到并稳定在10.0%,经济总量占比争取达到10.0%,经济增长速度争取大于10%以上,全社会固定资产投资占比争取达到并超过10%,地方财政收入占比争取达到10.0%,实际利用外资占比争取达到10.0%,能源消费比重争取控制在10.0%,人均GDP增速大于11%,城镇居民人均可支配收入绝对差额拉大速度争取控制在10%以内,农村居民人均可支配收入绝对差额拉大速度争取控制在10%以内,教育资源绝对差距缩小速度超过10.0%。通过上述指标的微突破,将中国东西部发展不平衡不充分差距调控到合理区间,促进东西部地区和南北地区共同繁荣。
4 缩小“胡焕庸线”东西部城乡发展差距与沿博台线微突破的策略
缩小“胡焕庸线”东西部城乡发展差距可走“微突破”之路,在微突破中,需要处理好六大重要关系,即刚性的“不变”与弹性的“变”的辩证关系,数量型突破与质量型突破的关系,地理环境决定论和人定胜天论的辩证关系[13-14],有限问题求解和有限目标突破的关系,“人破”和“水破”的关系,“单线分割”与“多线施策”的关系。在“多线施策”中,其中垂直于“胡焕庸线”的博台线(从新疆博乐市至台湾台北市的西北—东南走向的直线)是“微突破”“胡焕庸线”的另一条路径[15],既然“胡焕庸线”可以实现微突破,可沿着博台线形成的带状区域布局人口、产业、基础设施等,另辟新径推动东西部城乡发展向着相对均衡方向发展。这里的博台线西南半壁与东北半壁面积分别占59∶41,而两侧人口占比约为45∶55,经济总量占比约为41∶59,并分别向50∶50的平衡格局演变,主要经济指标都逐步趋向1∶1的均衡发展格局,是促进东中西部、南北协调发展、解决地区发展不平衡不充分的重要分界线,也是连接“一带一路”双核心区的战略扁担线和综合交通运输通道支撑连接的实体线,博台线对缩小“胡焕庸线”东西部发展差距、南北发展差距、推动国家区域协调均衡发展具有不可替代的重要作用[16-17]。博台线是破解“胡焕庸线”缩小东西部发展差距的新路径,沿博台线提出微突破“胡焕庸线”的如下策略。
4.1 优化西北半壁人口民族结构,特殊施策引导人口沿博台线微布局
① 开人源。制定生育奖励政策,争取到2030年西北半壁人口增加量达到2000万人,到2049年达到3500万人左右,逐步激励引导人口适度向西北半壁有序流动;加大兵团人口集聚总量,争取年均新增30万人;加大内地人口向西北半壁沿博台线适度迁移。② 汇人流。吸纳外地人口和人才向博台线自然条件较好的地区及其周边地区如天山北坡城市群、兰西城市群、宁夏沿黄城市群、呼包鄂榆城市群、喀什城市圈、拉萨城市圈等西北半壁国家新型城镇化的空间主体区和经济发展战略核心区集聚;引导本地人口及部分内地人口向边境地区集聚;限制或禁止采取生态移民方式将边境地区的人口转移到中心城市和县城。③ 引人才。采取高标准、高待遇、优质优价优酬、不求所有、但求所为等灵活方式,制定优惠政策吸引国内外优秀人才到西北半壁工作,建立目标考核责任制。④ 优结构。从社会稳定角度分析,可采取特殊政策将东南半壁人口少量迁移到西北半壁,逐步改变西北半壁少数民族人口比重偏大带来的社会不稳定风险。
4.2 加快技术引进转移,特殊施策引导高技术产业沿博台线微布局
① 引进高新技术和先进实用技术,寻求技术突破。高新技术的发展与应用在很大程度上不受自然条件和资源禀赋的限制,也不受资源环境承载力的过多限制。借鉴美国依靠高新技术缩小东西部发展差距的成功经验,采取特殊优惠政策引导全球大数据技术、云计算技术、智能技术、绿色能源技术、互联网信息技术等布局到西北半壁,在西部地区建立若干个具有全国和国际影响力的高新技术产业高地,提高西北半壁资源加工转化的滚动增值效益。② 加大西北半壁沿博台线建设国家级新区力度,在加大已有的西咸新区、兰州新区等国家级新区投入力度的基础上,探索建设乌鲁木齐天山新区、酒泉—嘉峪关新区、银川滨河新区、西宁新区等的可能性。③ 沿博台线加大西北半壁各类国家高新技术产业开发区、国家级经济技术开发区、国家级现代农业示范园区、国家级自主创新示范区、国家重点开放开发试验区、国家级边境经济合作区等等的建设力度,把其建成破解“胡焕庸线”、缩小东西部城乡发展差距、提升发展质量的重要平台,逐步沿博台线提升西北半壁产业发展的集中度。
4.3 优化西北半壁固边型城镇体系结构,引导城镇化沿博台线微布局
① 构建由城市群—中心城市—边境城镇构成的固边型城镇体系,加大对西北半壁沿博台线天山北坡城市群、兰西城市群、宁夏沿黄城市群和呼包鄂榆城市群4大城市群发展力度,以城市群为基础,进一步发展壮大西北半壁中心城市;推进西北半壁边境城镇带建设,形成“核心城市(梳把)—边境城市(梳齿尾)—边境口岸(梳齿尖)”的梳子状城镇体系。② 从稳疆固藏的战略高度,探索在南疆东部新建若羌地级大城市的可能性。争取用10年时间将若羌建成常驻人口达到50万人的中等城市,作为内地进入南疆的第一门户。③ 新增一批建制镇[18-19]。考虑在新疆南部绿洲地区、塔里木盆地工矿地区、阿里地区等新设一些建制城镇。同时建议实行“团镇合一”,将兵团团场改制为建制镇,推动兵团城镇化进程和人口集聚效应。④ 实施“据点式”和“星星点灯”式结合的城镇布局模式。一方面从高质量发展角度,采用“据点式”城镇化发展模式,优先培育兰州—西宁地区、宁夏沿黄地区、天山北坡地区、拉萨—日喀则、喀什等地区成长为国家级城市群或城市圈,大幅提升城市群及中心城市的经济与人口集中度,发挥规模经济效应[20]。另一方面从稳疆固边角度,建议采取“星星点灯”的城镇化模式,积极发展分布在西北半壁的各类小城镇,形成“星星点灯”式的散点状布局模式。
4.4 推进产业沿博台线转型转移,特殊施策引导经济社会高质量发展
① 调整西北半壁产业结构,重点沿博台线推动产业结构由资源密集型转为技术密集型,加大知识密集型产业投入比重,摆脱资源开发的老路依赖;② 处理好产业选择中“化为乌有”和“无中生有”的关系,沿博台线大力发展“互联网+”等“无中生有”产业;③ 提升西北半壁资源利用效率,建设一批高质量发展试验区。建议在南疆建设社会高质量发展综合试验区,在北疆建设能源资源高质量加工试验区,在兰州建立黄河上游多民族高质量发展试验区,在银川建立内陆开放高质量发展试验区,在拉萨建立高原高质量发展试验区,在边境地区建立边境高质量发展试验区。④ 创新西北半壁社会发展模式,大力推进西北半壁教育、医疗、卫生、社会保障、疾病防控等基本公共服务的均等化,确保西北半壁人均GDP、人均固定资产投资、人均地方财政收入、城镇居民人均可支配收入、农村居民人均可支配收入、人均受教育程度等等均量指标在近期内赶上东南半壁,在中远期超过东南半壁,让生活在西北半壁的居民有获得感和幸福感。
4.5 完善西北半壁生态补偿转移机制,转变西部大开发战略为西部精深开发战略
① 加大对西北半壁生态补偿转移支付力度,提高在西北半壁重点生态功能区内转移支付资金额度,由过去的项目、人才对口支援和帮扶转变为生态环境补偿机制的对口补偿和对口转移支付。科学提升西北半壁生态补偿标准,设立西北半壁生态补偿专项基金,推进建设西北半壁国家公园群,探索制定东南半壁向西北半壁的横向生态补偿政策,通过建立准市场运作的跨区域水权市场和政府生态购买制度,推动地区间建立横向生态补偿制度。② 超前建设西北半壁边境城镇发展带,设立边境基础设施专项资金,拓展边境地区向外发展空间;提高边民补贴标准,改善护边员生活条件;推进科学固边,实施“科学+”的富民强边与绿色发展新范式,使西北半壁广大边民继续成为神圣国土的坚强守卫者。③ 重新审视西部大开发战略实施成效,实施西部“精深”开发战略。过去的西部大开发战略实施做足了“大”的文章,大大改善了西北半壁基础设施和公共服务设施,缩小了西北半壁与东南半壁在基础设施和公共服务设施方面的差距,发挥了重要作用,做出了重大贡献。新形势下结合“一带一路”倡议,建议实施西部再开发战略,做足“深”和“精”的文章,推进西部“深”开发和西部“精”开发,推动西北半壁经济社会高质量发展迈上新台阶。
参考文献
Population distribution in China-with statistics and density map
DOI:10.11821/xb193502002
[本文引用: 1]

China is the most populous country of the world.Besides her great numberof population she has also the most densely inhabited regions which are notcomparable with any other country of the world.
中国人口之分布: 附统计表与密度图
DOI:10.11821/xb193502002
[本文引用: 1]
年来中外学者,研究中国人口问题者,日见其多,中国人口是否过剩,国境以内,是否尚有大量移民之可能,此实当今亟须解答之间题,各方对此之意见,甚为纷歧;或则谓中国人口,实已过剩,此可由社会生计艰难,失业问题严重,以及海外侨民之多可以证之;或则谓中国人口,实未过剩,以全国面积除全国人口,计算其密度,较之欧西诸国,尚不及远甚,国境西北部,地旷而人稀,将来实大有移民之可能.
The distribution, regionalization and prospect of China's population
中国人口的分布、区划和展望
DOI:10.11821/xb199002002
PMID:12284413
[本文引用: 1]
我国地势西高东低。东部第一台阶为湿润的平原和丘陵,人口稠密。第二台阶分布在中部和西北部,大部为干旱半干旱气候。西南部的青藏高原属高寒气候,人口稀少。一条分界线东北起于黑龙江省的黑河,西南至云南省的腾冲。此线以东居住着全国96%的人口。以西居住着4%的人口。作者把全国分为八大人口区。在未来岁月里,我国人口分布的总格局不会有很大改变。
Hu huanyong's contribution to the development of geography in China
胡焕庸大师对发展中国地理学的贡献
The ideological origins and geographical demarcation significance of Hu Huanyong Line
DOI:10.11821/dlxb202106001
[本文引用: 1]
In the early 20th century, China was faced with domestic crisis and foreign invasion, and the man-land contradictions were unprecedented fierce. Geographers pondered and explored the issues of national fortune such as China's population status, northwest exploitation and internal migration, thus China's population geography emerged as the times required. "The distribution of population in China" published by Hu Huanyong in 1935 is a symbol of maturity of China's population geography. The Hu Huanyong Line (also known as Hu Line) proposed in this paper, which he originally called the Aihui-Tengchong Line, is a significant geographical demarcation of China's population. The existence and stability of the Hu Line have been repeatedly verified by census data, and its scientific principles have also been revealed and explained by the academic circles from aspects of nature, economy, social culture, etc. This paper points out that grain and employment are the two hidden logics behind the Hu Line. The Hu Line is becoming a crucial national geographic demarcation, which has an increasingly essential impact on the cognition and analysis of China's national conditions. Recent research on the Hu Line has been widely extended in various fields and meanings, and there arose some amendments and adaptations of the line in practice. Under the influence of "Premier Li Keqiang's three questions", whether the Hu Line can be broken through has become an academic hot spot. This paper holds that it is more important to create more opportunities of the northwest region than to increase the share of population so as to balance regional development.
胡焕庸线的学术思想源流与地理分界意义
DOI:10.11821/dlxb202106001
[本文引用: 1]
20世纪早期,中国面临内忧外患、人地关系矛盾空前剧烈,地理学家对于中国人口国情、西北开发及国内移民等关乎国运问题的思考与探索,孕育了中国的人口地理学。1935年胡焕庸发表的“中国人口之分布”是中国人口地理学走向成熟的标识,文中提出的“瑷珲—腾冲线”即“胡焕庸线”,是中国人口地理的重要分界线。胡焕庸线的存在性与稳定性被人口普查等现实数据反复验证,其科学原理也被学术界从自然、经济、社会文化等方面加以揭示和阐释。本文指出食物与就业是胡焕庸线潜在的两大逻辑。胡焕庸线正在成为一条重要的国家地理分界,对认知与分析中国国情产生越来越重要的影响。近年来胡焕庸线的研究有了广泛引申,并衍生出多个领域、多种意义下的胡焕庸线,在应用层面上还出现了对该线的修正与变通。在“总理三问”的影响下,胡焕庸线能否突破成为一个学术热点,本文认为重要的不是增加西北人口份额,而是让西北地区获得更多发展机会,促进区域均衡发展。
Cognizing population density demarcative line(hu huanyong-line) based on space technology
基于空间信息认知人口密度分界线: “胡焕庸线”
Spatial heterogeneity and its changes of population on the two sides of Hu Line
DOI:10.11821/dlxb201701012
[本文引用: 1]
Hu Line uncovers one of China's most important characteristics of population paper distribution: East is dense, while west is sparse. Different from most previous research, this paper examined the differentiation and changes of population distribution on both sides of Hu Line from a perspective of spatial stratified heterogeneity instead. Geodetector was employed based on the spatial database of China's census data of 1953, 1982, 1990, 2000 and 2010 to reconfirm spatial position of Hu Line and analyzed changes of spatial stratified heterogeneity of population between southeast and northwest sides of Hu Line in different periods. Changes of population distribution since the founding of New China were found and the reasons for these changes were discussed. Major findings include: (1) From the spatial stratified heterogeneity perspective, Hu Line could be improved and optimized, at least, in some periods. Although the ratio of total population on both sides of Hu Line has roughly been kept at 94:6 since 1953, spatial stratified heterogeneity of population between the two sides (the southeastern side: the northwestern side) increased when Hu Line moves to south slightly in 1953, 2000 and 2010, which means population distribution was more homogeneous within either southeastern or northwestern region and heterogeneity was more remarkable between the two regions. (2) Heterogeneity decreased gradually since the reform and opening up. We found characteristics of population distribution converged on the two sides, especially since the 1990s when convergence between the two sides became apparent. This finding is significantly different from the conclusion of "remain unchanged" from most literatures. The reasons why heterogeneity reduced were: pattern of population distribution on the southeastern side changed from relatively even distribution among cities before 1990 to agglomeration in a few huge cities after 2000, while the degree of spatial agglomeration of population decreased slightly after the reform on the northwestern side. These changes have been confirmed by the analysis from cumulative distribution function and Gini coefficient. (3) On the whole, the effect of economic factors on population distribution has become more and more important, while the effect of natural environment and institution reduced. Combined effect from economic development, natural environment and institution resulted in two opposite directions of changes of population spatial distribution on the two sides. It should be emphasized that although general effect of natural environment has decreased, some natural factors, such as Three Gradient Terrains, still have significantly influence on population distribution in China.
胡焕庸线两侧人口的空间分异性及其变化
DOI:10.11821/dlxb201701012
[本文引用: 1]
胡焕庸线作为人地关系的重要地理大发现之一,揭示了中国人口分布东密西疏的重要特征,是人文与经济地理学对社会的重要贡献之一。本文采用地理探测器等定量方法,以人口普查数据为基础,对胡焕庸线两侧人口分布的分异性特征进行了深入讨论,并尝试解释中国人口分布特征变化的原因及其机制。结果表明:① 胡焕庸线作为中国最重要的人口分界线仍基本保持稳定,但从空间统计学分异特征来看该分界线仍可进一步优化调整;② 胡焕庸线两侧内部人口集聚模式发生着明显变化,东南半壁人口分布由改革开放之前和初期的相对均衡状态,转变为以长三角、珠三角等少数区域为中心的集聚模式;而西北半壁人口分布的集聚程度则趋于下降;③ 从人口空间分布的影响因素看,尽管总体上,经济发展类因素对于人口空间分布影响不断增强,但三大阶梯等自然地理本底条件依然对中国人口分布有着重要影响。
The Geographical Pattern of Population and the Future of Urbanization in China: A symposium to commemorate the 80th anniversary of the discovery of Hu Huanyong Line was held in Shanghai
中国人口地理格局与城市化未来: 纪念胡焕庸线发现80周年学术研讨会在上海举行
Research on the suitability of population distribution at the county level in China
DOI:10.11821/dlxb201406001
[本文引用: 1]
The relationship between population distribution and resources, environment, social and economic development has attracted much attention for a long time. This paper set up an index system and some models for the assessment of the coordination between population and resources, environment, social and economic development. Then it used the index system and models to evaluate this coordination quantitatively at the county level. Based on this, the suitability and restriction of population distribution at the county level was graded and classified respectively, and its spatial and temporal patterns as well as regional characteristics were also revealed quantitatively. The results showed that: (1) population distribution was generally coordinated with human settlements environment in more than 3/5 of counties in China in 2010, which meant that population distribution was highly consistent with the natural suitability of human settlements environment at the county level; (2) population growth was merely not restricted by water and land resources in about half of counties in China in 2010, indicating that population distribution had medium coordination with the suitability of water and land resources; (3) population distribution was generally coordinated with social and economic development in more than 3/5 of counties in China in 2010, suggesting that population distribution was highly consistent with social and economic development; (4) the suitability degree of population distribution was larger than 60 in about 3/5 of counties in China in 2010, which showed that the relationship between population, resources, environment and development was coordinated or relatively coordinated; (5) as for the coordination between population, resources, environment and development at the county level, the eastern region was the best, the central region ranked second and the western region was the worst; (6) the suitability degree of population distribution at the county level could be identified into four grades, including basic coordination, relative coordination, under coordination and urgent need for coordination and 10 restricted classes.
基于分县尺度的中国人口分布适宜度研究
DOI:10.11821/dlxb201406001
[本文引用: 1]
以人口空间分布及其与资源环境和社会经济协调性评价为核心,提出了一整套人口与资源环境和经济社会发展协调水平评价的指标体系与模型方法;以分县为基本单元,定量评价了2010 年中国人口与资源环境和社会经济发展的协调性和协调程度;根据人口分布适宜度高低和限制性差别,划分了中国分县人口分布适宜等级和限制类型,定量揭示了中国不同地区人口与资源环境和社会经济协调发展的时空格局和地域特征。研究表明:① 2010 年中国有3/5 以上的县(市、区) 人口分布与人居环境基本适宜,中国分县人口分布与人居环境自然适宜性保持了高度一致性;② 2010 年中国有1/2 以上的县(市、区) 人口发展基本不受水土资源约束,分县人口分布与水土资源适宜性处于中等水平;③ 2010 年中国有超3/5 的县(市、区) 人口与社会经济发展基本协调,人口分布的社会经济协调性良好;④ 2010 年中国近3/5 的县(市、区) 人口分布适宜度在60 以上,人口资源环境与发展处于基本协调或相对协调状态;⑤2010 年中国分县人口资源环境与发展的协调程度东部优于中部、中部优于西部;⑥ 2010 年中国分县人口分布适宜度可划分为人口资源环境与发展基本协调、相对协调、有待协调和亟待协调4个适宜等级与10 个限制类型。
Research on land resources restriction on population distribution in China, 2000-2010
DOI:10.11821/dlyj201408001
[本文引用: 1]
Population, resources, environment and development are the most important global issues the world is facing today. With population surge, the consequents such as shortage of resources, environmental pollution and other issues are increasingly attracting attention. As an important theme of regional sustainable development, the relationship between population distribution and resources, environment, and socio-economic development has attracted much attention for a long time. The resources restriction on population distribution becomes more significant for population growth in China, especially the land resources. This paper established a series of index system and models for evaluating land resources restriction on population distribution. The spatial-temporal features of land resources restriction on population distribution in China were assessed comprehensively in recent ten years at national, provincial and county scales. The limited degree, spatial pattern and changing law of land resources restriction on population pattern were also revealed quantitatively. The results showed that: (1) At the national level, the carrying capacity of land resources has been enhanced since 1949. The limited degree of land resources on population distribution in China declined during 2000-2010, down to 34.50 from 42.87. (2) At the provincial level, the relationship between population and grain production in China was improved from 2000 to 2010. The land resources restriction on population distribution had significant differences on provincial scale, and most of provinces were in low level. The restriction degree of land resources on population distribution overall showed a downward trend at the provincial level during 2000-2010. (3) At the county level, the relationship between population and grain production tended to be harmonious from 2000 to 2010. About 60% and 70% of the counties in China were not affected by land resources restriction respectively in 2000 and 2010. The restriction degree of land resources on population distribution was overall in low level at the county level and showed a downward trend in recent ten years. The basic spatial pattern of land resources restriction on population distribution showed that the eastern region surpassed the western region, that the southern region was superior to the northern region, and Yellow River Basin was higher than Yangtze River Basin.
中国人口分布的土地资源限制性和限制度研究
DOI:10.11821/dlyj201408001
[本文引用: 1]
以人口分布的土地资源限制性评价为核心,建立土地资源限制性与限制度模型,从全国、分省、分县等三个不同尺度,全面评估近10年中国人口分布的土地资源限制度及其时空耦合规律,定量揭示中国人口分布的土地资源限制程度及其空间格局与变化规律。结果表明:① 1949年以来中国的土地资源承载力趋于增强; 2010年与2000年相比,人口分布的土地资源限制度由42.87下降到34.50,土地资源限制度在降低。② 分省的人粮关系趋于好转,大多省份人口分布的土地资源限制度处于较低水平; 2010年与2000年相比,分省人口分布的土地资源限制度整体呈降低趋势。③ 2000-2010年分县粮食盈余地区在增加,人口超载地区在减少,人粮关系趋于改善; 2010年和2000年相比,基本不受土地资源限制的分县单元由60.27%增至70.63%,基于人口分布的土地资源限制度整体较低,且近10年呈降低趋势;土地资源限制度整体上东部强于西部、南部强于北部、泛黄河流域强于长江流域。
China 2050: Climate scenarios and stability of Hu-Line
中国2050: 气候情景与胡焕庸线的稳定性
Academic debates on Hu Huanyong population line
DOI:10.11821/dlyj201605001
[本文引用: 1]
Hu Huanyong, a famous geographer, discovered a divide of population geography in China in 1935 (hereinafter referred to as the Hu Line), which was an important achievement in the development of the discipline of geography in China, and was widely accredited and cited. In November, 2014, Premier Li Keqiang raised a question about the Hu Line, when he visited the exhibition of sciences of human settlements in the National Museum of China. This question is whether the Hu Line can be broken or not again caused a stir. Hereby we invited some geographers to have academic discussion on this question, aiming to demonstrate their understanding and reflection on the Hu Line from different perspectives. Thus, the scientific value and practical significance of the Hu Line are deepened, and furthermore, the Hu Line can provide reference for the implementation and regional planning of the new-type urbanization in China.
关于“胡焕庸线能否突破”的学术争鸣
DOI:10.11821/dlyj201605001
[本文引用: 1]
著名地理学家胡焕庸先生于1935年提出中国人口地理的重要分界线(简称“胡焕庸线”),被广泛认可和引用,是中国地理学发展的重要成果。2014年底,李克强总理参观人居科学研究展时,高度关注胡焕庸线,并提出了胡焕庸线能否突破的问题。胡焕庸线因而再度引起争论和热议。据此,组织了一些地理学者围绕该问题进行学术讨论,力图从不同层面展现学者们对胡焕庸线的理解与反思,从而深化胡焕庸线的科学价值和现实意义,进而指导中国新型城镇化战略的实施和区域实践。
Hu Huanyong's geostrategic thought and its monumental contributions
DOI:10.11821/dlxb202202001
[本文引用: 1]
Hu Huanyong is one of the founders of modern Chinese human geography, a pioneer of geopolitical research and an outstanding thinker of geostrategy. This paper evaluates Hu Huanyong's geostrategic thought in the context of the changing international geopolitical environment in which China has embarked upon its path of national development. Hu Huanyong is believed to be the pioneer and visionary geographer who has long-term influence on China's geopolitical research and the formulation of China's geostrategy. He is credited for his systematic demonstration of the Chinese sovereignty over the islands in the South China Sea, namely the Nansha Qundao, Dongsha Qundao, Zhongsha Qundao, and Xisha Qundao, particularly his first naming of Nansha Qundao. He is ahead of his times with his comprehensive study of China's geopolitical environment, his prediction of the inevitable Japanese invasion into China and armed conflicts between Japan and the US, and his call for special attention to border governance and national security and defense. He has strongly advocated the recovery of the Ryukyu Islands, stressed the role that geographers play as the vanguards of China's territorial development, and called for a better integration of geography with national defense education. The paper concludes with an observation of the great significance to inherit and carry forward Hu Huanyong's geostrategic thought in the current global geopolitical environment characterized by unprecedented changes of the world in a century and the great rejuvenation of the Chinese nation.
胡焕庸的地缘战略思想及其时代价值
DOI:10.11821/dlxb202202001
[本文引用: 1]
胡焕庸是著名地理学家、地理教育家,中国人文地理学奠基人之一、地缘政治研究先驱和杰出的地缘战略家。本文首次系统梳理胡焕庸鲜为人知的地缘战略研究成果及学术思想,发掘其在当今复杂国际地缘政治形势下的时代价值。胡焕庸以时代问题为导向,以历史使命为驱动,发表诸多地缘战略研究成果,为后世留下许多经典隽永的学术思想,包括系统论证南海诸岛属于中国,并首次命名南沙群岛,全面分析中国发展的地缘安全形势,预判日本侵华企图及美日冲突的必然性,重视边疆治理与国防建设,多次强烈呼吁收回琉球群岛,强调地理学家是国家开疆拓土先锋,倡导地理学与国防教育结合等。在世界百年未有之大变局和中华民族伟大复兴的时代背景下,传承和弘扬胡焕庸的地缘战略思想,尤具现实意义。
A study of environmental determinism from the perspective of "hu huanyong line"
从胡焕庸人口线看地理环境决定论
Study on the stability of Hu Line and different spatial patterns of population growth on its both sides
DOI:10.11821/dlxb201504004
[本文引用: 1]
The Hu Line for population distribution in China has been regarded as one of the greatest geographical discoveries in China because it reveals the significant spatial characteristics of China's human-land relationship. Thus, the stability and significance for spatial development of Hu Line have become a major concern after the dramatic economic and social changes since China's reform and opening-up in 1978. With the support of GIS, this paper conducts a statistical analysis and systematic investigation on the stability and spatial patterns of population growth on both sides of Hu Line by constructing the spatial database of China's census data from 1982 to 2010 and initiating a new method for identifying the spatial patterns of population growth. The findings are as follows: (1) The Hu Line has been rather stable, while a new tendency of population change has emerged. On the whole, the ratio of population on both sides of Hu Line has roughly been kept at 94:6 (the southeastern side: the northwestern side) in the last 30 years. However, the proportion of population on the southeastern side of Hu Line has been slightly decreasing, while that on the northwestern side of Hu Line has been slightly increasing, which is benefited from its higher rate of natural population growth. (2) The spatial patterns of population growth on both sides of Hu Line were quite different. The agglomeration degree of population distribution on the southeastern side of Hu Line increased greater. The areas with negative population growth rate have rapidly expanded, mainly located south of the Qinling Mountains - Huaihe River line and the northeastern China, while the areas with the fast population growth rate concentrated in the areas such as the Yangtze River Delta, the Pearl River Delta and Beijing-Tianjin metropolitan region. Thus, the spatial pattern of population growth on the southeastern side of Hu Line presented an aggregating and diffusion mode of Matthew effect. (3) The spatial pattern of population growth on the northwestern side of Hu Line could be referred as the relative balance type. In this region, the positive rate of population growth and the lower agglomeration degree of population have been identified. There were lots of ethnic groups located on the northwestern side of Hu Line, and they generally lived dispersedly but with a higher rate of natural population growth due to preferential population policy. However, there were also some areas with negative rate of population growth on the northwestern side of Hu Line and they were mainly distributed close to the Hu Line and new Eurasia Land Bridge. (4) In the future, the spatial patterns of population growth on both sides of Hu Line will continue to change. On the southeastern side of Hu Line, the capacity of population agglomeration for those small and medium-sized cities and towns should be enhanced. As for the northwestern side of Hu Line, the emphasis should be placed on promoting its urbanization and enhancing the capacity of population agglomeration for major cities.
“胡焕庸线”的稳定性及其两侧人口集疏模式差异
DOI:10.11821/dlxb201504004
[本文引用: 1]
“胡焕庸线”是反映中国人地关系的重要地理发现之一。在当今中国经济社会背景下,“胡焕庸线”所表达地理意义及其对城镇化发展的指导作用受到广泛关注。在GIS的支持下,构建了改革开放以来4次人口普查的县级空间数据库,提出人口时空扩张的识别方法,对“胡焕庸线”两侧的人口数量、集疏格局进行统计、分析,主要得出以下结论:① “胡焕庸线”两侧人口数量94:6的大数一直相对稳定,但东南半壁人口持续微减、西北半壁人口持续微增。得益于较高的自然增长率,西北半壁具有较高的人口增长速度。② “胡焕庸线”两侧呈现出迥然不同的人口集疏模式。东南半壁人口集中化程度提升较快,负增长区在“秦岭—淮河”以南、东北等地区大面积扩张、人口正增长优势逐步极化到长三角、珠三角、京津等少数地区,呈现“马太效应”式的集疏模式。主要是由于东南半壁内部区域经济差异及快速城镇化带来的剧烈人口流动。③ 西北半壁则呈现“相对均势”的人口集疏模式,多数地区的人口普遍表现为正增长,但是空间分布广袤、增长不集中,人口集中化程度提升缓慢。主要是由于少数民族“多分散、少聚居”造成了自然增长优势的不集中。然而均势是相对而不是绝对的,同样存在一定的负增长区,主要分布在“胡焕庸线”和“新欧亚大陆桥”两条带上。④ 未来时期,“胡焕庸线”两侧的人口分布及集疏格局将进一步演化,东南半壁应关注内陆腹地及中小城镇对人口的吸纳作用,西北半壁应关注将分散的人口增长优势向少数城镇进行集聚,以期为人口地理学研究以及城镇化发展提供参考。
Bole-Taipei Line: The important function and basic conception as a line for regional balanced development
DOI:10.11821/dlxb202002001
[本文引用: 1]
Promoting regional coordinated development strategy is one of the most important strategies in the new period of China. Faced with the reality of unbalanced and insufficient regional development in China, it is objectively necessary to construct one or more main axes supporting the coordinated and balanced development of regions to become the identification line representing the pattern of coordinated regional development. The results show that the Bo-Tai line, the northwest-southeast axis connecting Bole of Xinjiang and Taipei of Taiwan, can be built into a national development backbone line and regional balanced development line, just perpendicular to the Hu Line. In 2016, the area of southwest half and northeast half of Bo-Tai Line accounts for 59:41, while the population accounts for 45:55, the economic aggregate accounts for 40:60, the per capita GDP ratio accounts for 44:56, the population density ratio accounts for 38:62, the economic density ratio accounts for 32:68, and the urbanization level ratio accounts for 48:52. The main average indicators gradually tend to present a balanced development pattern. Further analysis shows that Bo-Tai Line is a strategic shoulder pole connecting two core zones of the Belt and Road, and is the peaceful reunification line of China's national tranquility and Taiwan's return. The Bo-Tai Line is also a solid line supported and connected by comprehensive transportation channels and a Pipa type symmetrical line for the development of cities and urban agglomerations. It is the backbone of the two-way opening up and the linkage development line between land and sea. It is also an important dividing line that promotes the coordinated development of the eastern, central and western regions, and addresses the imbalance and inadequacy of regional development. The Bo-Tai Line plays an irreplaceable strategic role in promoting the coordinated and balanced regional development. It is suggested that the construction of Bo-Tai Line should be included in the national development strategy, and the development strategic plan of Bo-Tai Line should be formulated to fully release the multiple potential functions. We should build three strategic support points (the northwest endpoint, the central strategic node and the southeast endpoint), carry out a comprehensive scientific investigation of the Bo-Tai Line, and strengthen the scientific cognition and publicity, and promote China's development in a higher-level, higher-quality, more coordinated, safer and more civilized direction. And we should make the Bo-Tai Line known to China and the world, and let the Bo-Tai Line truly become the backbone of the great rejuvenation of the Chinese nation.
博台线: 中国区域发展均衡线的重要功能与建设构想
DOI:10.11821/dlxb202002001
[本文引用: 1]
推动区域协调发展战略是中国新时期的重大战略之一,面对中国区域发展不平衡不充分的现实,客观上需要构筑一条或多条支撑区域协调均衡发展的主轴线,成为表征区域均衡发展格局的标志线。反复审视中国区域发展版图并计算发现,垂直于胡焕庸线的博台线(连接新疆博乐市与台湾省台北市的西北—东南走向的轴线)可建成中国区域发展均衡线。2016年博台线西南半壁与东北半壁国土面积占比为59:41,而两侧人口占比约为45:55,经济总量占比约为41:59,并分别向50:50的平衡格局演变;两侧人均GDP比值为44:56,人口密度比值为38:62,经济密度比值为32:68,城镇化水平比值为48:52,主要均量指标都逐步趋向1:1的均衡发展格局。进一步分析发现,博台线是连接“一带一路”双核心区的战略扁担线,是国家安宁和台湾回归的祖国和平统一线,是综合交通运输通道支撑连接的实体线和国家城市与城市群发展的琵琶型对称线,也是双向对外开放的中坚线、海陆联动发展的对接线,更是促进东中西部、南北协调发展、解决地区发展不平衡不充分的重要分界线,博台线对推动国家区域协调均衡发展具有不可替代的重要功能与战略作用。建议将博台线建设纳入国家发展战略,制定博台线发展战略规划,充分释放博台线承载的多重潜在功能,突出建设博台线上西北端点、中部战略节点和东南端点三大战略支撑点;开展对博台线的综合科学考察,加大对博台线的科学认知与宣传力度,让中国认识博台线,让世界了解博台线;把博台线建成国家发展的战略脊梁线,让博台线成为破解胡焕庸线、缩小地区发展差距的新路径。
The Bo-Tai Line: Establishing the concepts of a balanced regional development line and a national development backbone
DOI:10.1007/s11442-021-1874-4
[本文引用: 1]
Promoting regional coordinated development strategy is one of the important strategies in the new period of China. Faced with the reality of unbalanced and insufficient regional development in China, it is objectively necessary to construct one or more main axes supporting the coordinated and balanced development of regions to become the identification line representing the pattern of coordinated regional development. The results show that the Bo-Tai line, the northwest-southeast axis connecting Bole of Xinjiang and Taipei of Taiwan, can be built into national development backbone line and regional balanced development line, just perpendicular to Hu Line. In 2016, the area of southwest half and northeast half of Bo-Tai Line accounts for 60%: 40%, while the population accounts for 45%: 55%, the economic aggregate accounts for 40%: 60%, the per capita GDP ratio accounts for 44%: 56%, the population density ratio accounts for 38%: 62%, the economic density ratio accounts for 32%: 68%, and the urbanization level ratio accounts for 48%: 52%. The main average indicators are gradually tending to balanced development pattern. Further analysis shows that Bo-Tai Line is a strategic shoulder pole connecting two core zones of “the Belt and Road”, and is the peaceful reunification line of China’s national tranquility and Taiwan’s return. Bo-Tai Line is also a solid line supported and connected by comprehensive transportation channels and a Pipa type symmetrical line for the development of cities and urban agglomerations. It is the backbone of the two-way opening up and the linkage development line between land and sea. It is also an important dividing line that promotes the coordinated development of the eastern, central and western regions, and addresses the imbalance and inadequacy of regional development. Bo-Tai Line plays an irreplaceable strategic role in promoting the coordinated and balanced regional development. It is suggested that the construction of Bo-Tai Line should be included in the national development strategy, and the development strategic plan of Bo-Tai Line should be formulated to fully release the multiple potential functions. We should build three strategic support points: the northwest endpoint, the central strategic node and the southeast endpoint; carry out a comprehensive scientific investigation of the Bo-Tai Line, and strengthen the scientific cognition and publicity; promote China’s development in a higher- level, higher-quality, more coordinated, safer and more civilized direction. Let Chinese know about the Bo-Tai Line, let the world know about the Bo-Tai Line, and let the Bo-Tai Line truly become the backbone of the great rejuvenation of the Chinese nation.
Analysis of the Bole-Taipei Line as the divide for regional coordinated development: Evidence from greenhouse gas emissions of Chinese cities
DOI:10.11821/dlxb202112015
[本文引用: 1]
As the international political and economic situation has been undergoing profound changes, achieving regional coordinated development is essential for China to form a new development pattern dominated by the domestic economic cycle. The Bole-Taipei Line, which is perpendicular to the Hu Huanyong Line and is proposed by Professor Fang Chuanglin in February 2020, has the potential to be an appropriate representative of the coordinated and balanced line of China's regional development. By investigating the spatio-temporal distribution of greenhouse gas emissions among 338 Chinese cities from 2005 to 2015, and making use of the Theil index and the Gini coefficient that are appropriate for measuring the spatial equality on both sides of the Bole-Taipei Line and within the southwest and northeast parts, respectively, this paper attempts, for the first time, to underpin the scientific basis of the Bole-Taipei Line as China's regional coordinated development line. We find that: (1) Overall emissions of the carbon dioxide (CO2), methane (CH4), nitrous oxide (N2O) and fluorinated greenhouse gas show a balanced distribution on both sides of the Bole-Taipei Line, and there are small regional differences in sectoral CO2 emission intensity and per capita CO2 emissions. (2) There is a generally balanced distribution of greenhouse gas emission intensity and per capita emissions, as well as the sectoral CO2 emission intensity and per capita emissions within the southwest and northeast parts of the Bole-Taipei Line. The industrial and agricultural sectors serve as the major emitters of greenhouse gases and therefore require a low-carbon transition towards a more balanced distribution of greenhouse gas emissions on both sides of the Bole-Taipei Line. In conclusion, the greenhouse gas emissions as a measure of the magnitude of human activities on both sides of the Bole-Taipei Line are relatively balanced, which has justified the scientific robustness and rationality of the Bole-Taipei Line as a strategic line for socioeconomic development, and provided novel insights into China's regional coordinated development.
博台线作为中国区域发展均衡线的佐证分析: 以城市温室气体排放为例
DOI:10.11821/dlxb202112015
[本文引用: 1]
国际政治经济形势正在发生深刻变化,实现区域协调均衡发展对于形成以国内大循环为主的新发展格局至关重要。方创琳于2020年2月提出垂直于胡焕庸线的博台线可以表征中国区域发展的均衡格局。本文通过对中国338个地级市的温室气体排放水平进行分析,旨在论证博台线作为中国区域发展均衡线的合理性和可能性。结果显示:① 2015年二氧化碳(CO<sub>2</sub>)、甲烷(CH<sub>4</sub>)、氧化亚氮(N<sub>2</sub>O)和含氟温室气体总量以博台线为界呈南北对称的空间分布格局,且博台线两侧各类温室气体的排放强度和人均排放量分布基本均衡,各产业部门CO<sub>2</sub>排放强度和人均排放量的区域差异均较小;② 博台线西南半壁和东北半壁内各类温室气体排放在GDP和人口维度上总体呈均衡分布态势,且各部门CO<sub>2</sub>排放强度和人均排放量的空间分布也较为均衡。总体而言,博台线两侧表征人类活动强度的温室气体排放水平较为均衡,一定程度上反映出其作为中国区域发展战略均衡线的科学性与合理性。
Breaking through the Hu Huanyong Line: New urbanization boosts the balance of land space utilization quality
DOI:10.1126/science.67.1724.39 URL [本文引用: 1]
突破胡焕庸线: 新型城镇化助推国土空间利用质量的均衡
The population distribution and trend of urbanization pattern on two sides of Hu Huanyong population line: A tentative response to Premier Li Keqiang
DOI:10.11821/dlxb201602001
[本文引用: 1]
In November, 2014, Premier Li Keqiang raised a problem about Hu Huanyong population line (hereinafter referred to as "Hu line"), when visiting the exhibition of sciences of human settlements in National Museum of China, which was called "Premier's Question" by the press. Hence, Hu line has become a highlight currently, and aroused great controversy and different views. Aiming at such dilemma of cognition, this paper gives a general review of the origins of Hu line, which was put forward by the famous population geographer Hu Huanyong in 1935, under the background of a debate on the surplus of domestic population. Based on population census data and GIS platform, the paper analyzes the change of population scale, proportion and density in both southeast and northwest sides of Hu line. The results indicate that the population urbanization and migration do not change the pattern of population distribution determined by Hu line. On such basis, the pattern that the population density of southeast part is large, while that of northwest part is relatively small will not radically change over a longer period, and the pattern that urban agglomeration is mainly located in southeast part as well. The long-term existence of Hu line depends on integrated physical geographical conditions, like climate. At the meantime, this paper argues that the core issue of the Premier's concern is solvable, by positive policy guidance and reasonable spatial organization. It is definitely promising for western China to realize a higher level of modernization and a better quality of urbanization, and central region as well.
胡焕庸线两侧的人口分布与城镇化格局趋势: 尝试回答李克强总理之问
DOI:10.11821/dlxb201602001
[本文引用: 1]
2014年11月底,李克强总理在国家博物馆参观人居科学研究展时,向社会和科学界提出了关于"胡焕庸线"的问题,很多媒体称之为"总理之问","胡焕庸线"也因此成为时下受到高度关注的一个热词,就此开展了热烈讨论并提出了截然不同的见解.针对这样的认识困境,本文首先梳理了胡焕庸线的由来,是由著名人口地理学家胡焕庸先生于1935年提出,提出的背景是当时对国内人口是否过剩的大讨论.基于"一普","五普"和"六普"等人口数据和ArcGIS平台,分析了胡焕庸线东南半壁和西北半壁的人口规模,比重和密度变化,数据显示人口城镇化和人口迁移并没有改变胡焕庸线确定的人口分布格局.据此提出胡焕庸线揭示的人口东密西疏格局在较长时期不会发生根本性变化,城市群主要位于胡焕庸线东南半壁的格局在较长时期也不会发生变化,胡焕庸线不可破的原因是由气候等综合自然地理条件决定的.同时,本文认为总理关心的核心问题是"有解"的,通过积极的政策引导和合理的空间组织,西部地区完全可以实现更高水平的现代化和更好质量的城镇化,中部亦然.
Can new urbanization break through the Hu Huanyong Line? Further discussion on the geographical connotations of the Hu Huanyong Line
DOI:10.11821/dlyj201605002
[本文引用: 1]
The Hu Huanyong Line, which is also called the Aihui-Tengchong Line, is drawn by Hu Huanyong and marks a striking difference in the distribution of China's population. It has been accepted and used for the last 81 years, and has had a considerable influence on Chinese population distribution research at home and abroad. With rapid new urbanization, research on the Hu Huanyong Line has increased sharply. In the context of new urbanization, an urgent question for us is how to understand the Hu Huanyong Line accurately. As a divide between the distribution patterns of the population in China, the Hu Huanyong Line has not changed substantially in the past 81 years. It represents a divide not only for the ecological environment, but also for climate. There are mainly prohibited development areas and restricted development areas in the Major Function Oriented Zones Planning west of the Hu Huanyong Line. It is not only the region east of the Hu Huanyong Line, but also includes some parts of the central and western regions of China. The formation of the line was the result of long-term interactions between the natural environment, economic development and social and historical conditions. Therefore, it would not be changed by what we think and do to break through. New urbanization emphasizes that the rural population migrates to the towns and cities nearby, rather than a large-scale transfer of population. Due to a local transfer of 100 million people in the central and western regions, new urbanization will accelerate the process of the population gathering in these regions. New urbanization has a significant impact on the population structure of different sizes of cities and towns, but little effect on the national spatial pattern. It is healthy urbanization in harmony with nature, therefore, rational thinking is required during the process of new urbanization, in order to optimize the spatial distribution pattern of urbanization. Pushed by the two-child policy issued recently, the population in the eastern and central China is predicted to increase with the western region increasing slowly due to the unbalanced population birth policy. With the implementation of the Belt and Road Initiative, urbanization in the western region will accelerate, opening up and expanding border cities, thus posing new challenges to the population distributed either side of the Hu Huanyong Line.
新型城镇化能否突破“胡焕庸线”: 兼论“胡焕庸线”的地理学内涵
DOI:10.11821/dlyj201605002
[本文引用: 1]
“胡焕庸线”提出80年来,在国际上产生深远影响。随着中国新型城镇化进程的全面推进,对胡焕庸线的研究急剧升温。在新的历史背景下,如何客观看待胡焕庸线成为亟待解决的一个问题。研究认为:胡焕庸线不仅是中国人口分布的分界线,也是重要的自然生态界线,这条界线的形成不以人的意志为转移,不宜人为去“打破”。同时,在新型城镇化背景下,应该树立理性思维,稳妥有序地推进城镇化进程,不断优化城镇化的空间分布格局。在全面放开二孩的新政策推动下,由于中国区域人口政策的差异性,东部和中部地区的人口有望实现较为明显的增长,西部地区增长相对缓慢,由此可能对胡焕庸线两侧的人口空间格局产生一定的影响。
