

1 引言
知识经济时代的城市群正从经济中心向创新高地转变,城市群的创新内涵在新时期再次得到关注。实际上,城市群的早期界定就特别强调其创新特征,1961年Gottmann就提出城市群具有新趋势、新知识和创新的孵化器功能[1],这种功能对惯习与稳定性是一种挑战,能使城市群充满活力、增加全球竞争力。然而,过去对城市群创新的关注集中在以企业和机构为主体的创新集群方面,以城市为主体的创新网络研究较少。伴随着交通和通讯技术的革新及应用,城市间知识信息转移共享的成本大大降低,一方面城市群内部城市间的知识交流与合作创新大幅增加[2],另一方面城市群对外部创新资源的凝聚力和知识外部性得到增强,使城市群成为国家甚至全球创新要素流的凝聚地[3]。在中国国家创新驱动发展战略和城市群战略的同步实施,要求中国的城市群应肩负起国家创新发展的使命。中共中央国务院2014年印发的《国家新型城镇化规划(2014—2020年)》,把城市群作为国家新型城镇化的主体形态;2016年印发《国家创新驱动发展战略纲要》,提出要整合创新资源,打造区域协同创新共同体,统筹和引领区域一体化发展;之后陆续出台的《长江三角洲城市群发展规划》《京津冀协同发展规划纲要》和《粤港澳大湾区发展规划纲要》等都极为重视创新发展,并制定了科技创新奋斗目标。2021年初国家“十四五”规划和2035年远景目标纲要提出选择有条件的地方建设区域科技创新中心,作为国家创新发展战略进入第二阶段迈向世界科技强国的重大战略部署,这也给中西部地区的城市群创新发展赋予了时代使命。国内城市群研究学者非常重视城市群创新功能,姚士谋等关注到高技术产业及其集群会推动城市群地域结构的变化[4];方创琳等将创新共同体纳入城市群共同体内涵[5];樊杰将建设城市群科技创新体系纳入《城市群规划编制技术规程》[6]。城市群创新研究已经得到广泛关注,更会成为未来关注的焦点和热点。
“多中心性”和“多中心主义”作为理解城市区域空间结构的新手段和新视角,也为城市群创新格局与创新网络研究提供了新思路。知识多中心性被定义为一个区域的知识生产及区域内外知识合作的多中心结构[7],是区域多中心性在知识创新方面的一种表征,体现了区域内知识创新空间的一种平衡关系。知识多中心性在城市群区域的表现最为突出,相关学者以美国东北部城市群[8]、长三角城市群[9]和粤港澳大湾区城市群[10-11]等创新水平较高的城市群为案例,运用城市科技论文生产与城市间合作发表论文数据,开展了城市群科学知识多中心性的相关研究,发现这些城市群基本上都朝着科学知识多中心性更高的方向发展。然而,当前研究一方面偏重科学知识多中心性的探讨,对技术知识的多中心性研究不足,而在城市群强调产业转型升级和高质量发展的当下,技术创新相比科学创新对城市群创新发展的作用更加紧迫、关系更为紧密;另一方面,全国多个城市群发展水平迥异、发展阶段不一,仅对少数几个发达城市群开展案例研究,缺乏对全国城市群知识多中心性长时段演化的对比研究,难以总结提炼规律。因此,本文选择中国19个城市群,运用专利数据开展城市群技术知识多中心性的演化研究,目的是探讨3个方面的问题:19个城市群技术知识的多中心性如何演化?城市群技术多中心性其他如何演替?城市群形态和功能技术多中心性对创新产出的影响有何差异?通过这些问题的研究,揭示城市群技术知识多中心性的演化规律,为国家城市群提升创新能力和建设世界科技强国提供研究支撑。
2 城市群创新多中心性研究综述
伴随着城市之间频繁的物质流动和要素交换,城市区域演变为动态复杂的网络化系统,在集聚—分散的双重驱动下呈现出更加多中心的特征[12],“多中心主义”(polycentricism)和“多中心性”(polycentricity)已经成为理解城市区域空间结构的重要工具。早在1999年,欧洲空间发展规划(ESDP)[13]便将多中心发展列为一项政策目标。20世纪末,多中心性作为一种规划理念进入中国,随后一些特大城市区域的空间发展规划开始采用多中心战略,旨在促进更可持续的均衡发展[14]。多中心发展模式被认为会产生经济上更有竞争力、社会上更有凝聚力、环境上更可持续的城市区域[15⇓⇓-18]。近年来,多中心性理念得到越来越多城市区域研究和规划界学者的关注。
在传统方法中,多中心性的衡量往往基于静态和形态学方法,由城市本身的属性特征来刻画,主要考虑区域内的经济活动、人口/就业规模和土地利用的空间分布[15,21⇓ -23]。随着城市系统分析中“网络范式”的兴起[24-25],城市的重要性日益体现在由人流、物流、信息流、知识流等介质建构的城市网络中的节点地位[7,26 -27],仅从形态学的视角衡量多中心性而忽略城市之间的相互作用难以全面理解多中心的本质内涵。目前,从形态和功能两个维度共同研究多中心空间组织模式已成为一种趋势[12,28 -29]。针对知识创新而言,知识形态多中心性反映城市群内部各城市知识创新产出水平的差异,高形态多中心性指城市群内各城市的知识生产相对均衡发展;功能多中心性则反映群内各城市同群内外其他城市开展知识合作的差异,高功能多中心性意味着知识联系在城市之间是多向和均匀分布的。
城市群作为多个空间相邻、联系紧密的城市组成的有机系统,能够在区域范围内整合创新资源,通过协同发展弥补单个城市创新竞争力的不足[30-31]。由于知识转移通道和共享需求大大增加,城市间知识交流与创新合作不断强化,创新网络在城市群空间上的凝聚逐步显现,城市群知识多中心性研究也开始受到城市地理和创新地理学者的关注[11-12,32]。譬如,陆天赞等研究发现美国东北部城市群创新网络“多中心、多节点、多层次”的复杂关联网络特征非常明显,创新合作的近域联系与跨区域联系结合比其他城市群更加明晰[8];Li等对长三角城市群的知识多中心性及其演化进行了探讨,发现长三角城市群的知识生产和知识合作正走向更加多中心的空间结构[7];李建成等研究表明长三角城市群科学知识网络从“以三角结构为中心演化为多边形结构为中心的格局”[9];马海涛等对粤港澳大湾区知识多中心的研究证实了多中心性演化的尺度敏感性和地理邻近影响机制[10-11]。除了对创新能力较强的城市群进行案例研究之外,近期相关学者对中国19个城市群的知识形态多中心性与功能多中心性进行测算与对比研究,发现了空间异质性特征,并分类提出了城市群合作创新路径[33-34]。然而,上述研究均是采用期刊数据库中的论文发表和论文合作数据,属于科学知识的范畴,对技术知识的多中心性研究尚没有引起足够重视。
对于城市群知识多中心性的研究,多基于城市群内部知识生产的形态格局探讨“孵化器”(incubator)功能,以及基于城市群内部知识流动和创新网络探讨“轮轴”(hub)功能,少有研究关注城市群作为连接区域内外的“门户”(gateway)功能。城市在区域间知识合作网络中的地位与区域内部知识合作网络中的地位具有相同的重要性,应当受到同等重视。实际上,功能多中心性除了表现为城市群内部知识的高度流动之外,还包含城市群对外的知识转移流动和创新合作。Li等对长三角城市群的知识多中心性研究以及Ma等对粤港澳大湾区城市群的知识多中心性研究[3,11],都发现城市群内有多个城市在国家尺度和全球尺度扮演了知识合作的“门户”功能,而且这种趋势还在增加。因此,本文将各城市的技术知识生产能力(专利申请总量)作为“孵化器”功能的代理变量,以城市群内部城市之间的技术合作强度(专利合作申请量)表示“轮轴”功能,城市群内部城市与群外城市之间的技术合作强度(专利合作申请量)代表“门户”功能。
当前对城市群创新网络多中心性研究已经具有良好的理论和方法基础,然而还存在几个问题尚未解决:① 科技创新包含科学和技术两大类,其中科学是创造知识的研究活动,它所解决的主要是认识世界的问题,要回答“是什么”和“为什么”;而技术则是发明和创造操作的办法、技巧以及相应的物质手段,回答的是“做什么”和“怎样做”。目前研究多基于论文数据研究城市群科学知识的多中心性,对技术知识的多中心性缺少关注,而城市群技术知识多中心性的发展对城市群产业转型升级和高质量发展具有更直接的作用,亟需开展研究。② 对城市群知识多中心性的研究多是案例现状研究,选择一个或少数几个城市群;然而城市群知识多中心性规律的把握需要长时段、多城市群的对比研究,本文将选择中国19个城市群开展跨度2000—2019年的多中心性演化研究。③ 城市群知识多中心性与创新产出的关系如何,是一个广受关注却少有研究的话题。现有城市创新网络对创新绩效的研究多侧重于多维邻近性视角[11],忽视了网络内在结构的影响,而实际上网络结构同主体节点一样,作为城市群创新系统的两大特征,共同决定了创新网络的整体竞争力[35-36]。综上,开展多城市群技术知识多中心性的研究非常有必要。
3 研究对象与方法
3.1 研究对象
图1
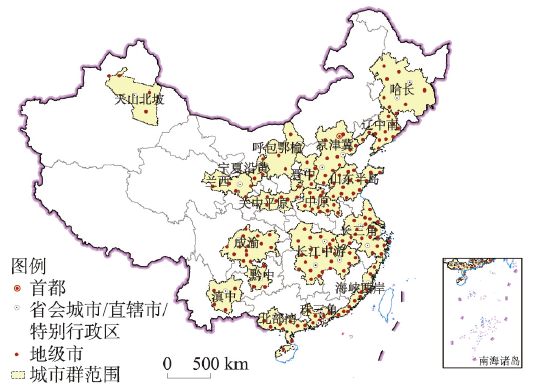
图1
中国19个城市群范围
注:基于自然资源部标准地图服务网站审图号为GS(2020)4630号的标准地图制作,底图边界无修改。
Fig. 1
19 urban agglomerations in China
3.2 数据来源
研究数据为2000年、2005年、2010年、2015年、2019年中国293个地级城市的专利申请量以及两两城市间的专利合作申请量。由于本文研究重点探讨城市间的技术合作联系及其演化,因此没有采用更能反映创新能力但公布期会滞后多年的授权专利,这样也可照顾到中西部创新较为滞后的城市群。专利数据来自IncoPat全球专利数据库(www.incopat.com),在所选的5个年份共获得3446898个合作申请专利信息,包含约20多万个创新主体;运用专利的地址信息将创新主体归并入所属地级市,进而建立起这些城市间的技术知识合作关系。这种关系既包括城市群内部城市间的专利合作关系(117817个),也包括城市群同外部城市的专利合作关系(396581个)。
3.3 研究方法
本文采用网络建构、网络分析、多中心性测度、类型划分、函数拟合、工具变量法和面板门槛分析等多种研究方法,其中采用城市间合作专利数建立城市间技术知识合作无向多值关系网络[2],运用Ucinet软件计算城市度数中心度,运用二分法进而类型划分等。下面重点说明多中心性的测算方法、多中心性创新效应的工具变量法和面板门槛模型。
3.3.1 多中心性测度方法
式中:PM表示城市群技术知识的形态多中心度,取值范围从0(绝对单中心)到1(绝对多中心);σM代表该城市群内各城市专利申请总量的标准差;σM max为极值状态下两城市专利申请量的标准差,即将其中一个城市的专利申请量为零,另一个城市的专利申请量设为观测值的最大值。
功能多中心的计算公式为:
式中:PF代表城市群技术知识的功能多中心度,取值范围从0(绝对单中心)到1(绝对多中心)。σF和σF max的计算方式与σM和σM max类似,不同的是使用的数据为城市的合作申请专利量;Δ为城市间专利合作的网络密度,引入该指标的目的在于确保在城市之间不存在专利合作的情况下,功能多中心性的取值为0[36],Δ是实际存在的关系数与完整网络理论上可能存在的所有关系数的比值。
3.3.2 工具变量法
用于测度城市群多中心性对城市创新产出的影响。当解释变量与扰动项相关时,一般考虑使用工具变量法。上一期的技术知识多中心性与内生变量X(当前的技术知识多中心性)相关而与Y(专利申请量)不相关,因此将滞后内生变量作为工具变量,使用工具变量法进行回归分析。公式如下:
式中:i表示城市;t为年份;PAT为专利申请量;FOM为形态多中心水平;FUM为功能多中心水平;UNV为高等学校在校人数;GOV为政府研发经费投入;FPG为外资占GDP比例;PGDP为人均GDP水平;β0和α0为常量;eit表示残差;β1、β2、β3、β4、α1、α2、α3、α4为待定系数。模型中仅选择了一个工具变量,模型设定检验选择不可识别检验和弱工具变量检验,不需要进行过度识别约束检验和“多余”工具变量的检验。
3.3.3 面板门槛模型
用于估计城市群技术知识多中心性对创新产出的影响是否存在门槛效应。根据Hansen提出的门槛回归理论,门槛回归模型可以进行以门槛值划分两组样本的模型估计参数是否相同的显著性检验。对于处于不同发展阶段的城市群而言,在集聚经济和集聚不经济的共同作用下,技术知识生产的多中心结构可能会对创新产出产生不同的影响,因此本文构建了城市群技术知识形态多中心性与创新产出的门槛模型:
式中:γ1、γ2分别为门槛变量在qit>τ和qit ≤ τ时解释变量对被解释变量的影响系数。
4 结果分析
中国城市(群)技术知识生产与合作格局演化图如图2所示,展示了19个城市群内部所有城市多年的专利申请量、城市间专利合作量,以及城市群城市同外部城市的专利合作量与城市的对外合作总量。在此基础上,对城市群技术知识多中心性的时空演化过程、类型演变趋势和创新产出效应进行了研究。
图2
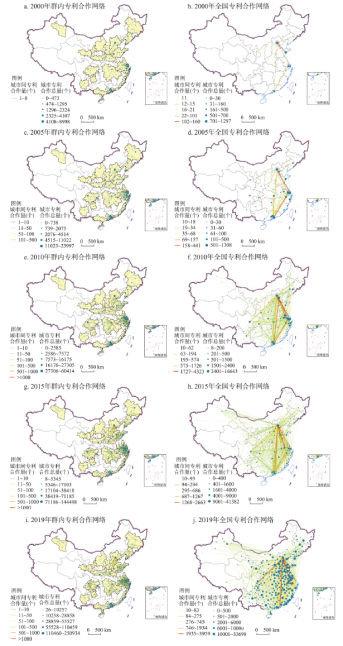
图2
2000年、2005年、2010年、2015年、2019年中国城市(群)技术知识生产与合作格局演化
注:基于自然资源部标准地图服务网站审图号为GS(2020)4630号的标准地图制作,底图边界无修改。
Fig. 2
Evolution of technological knowledge production and cooperation in Chinese cities (urban agglomerations)
4.1 城市群多中心性时空演化过程
4.1.1 形态多中心性
中国19个城市群技术知识生产的集中化程度呈现明显差异,最高的长江中游城市群2019年形态多中心性高达0.617,最低的宁夏沿黄城市群2000年仅为0.222(表1)。从总体空间格局上看,城市群技术知识形态多中心性不存在明显的空间规律,东、中、西部的城市群都存在或高或低的形态多中心性。从城市群自身演化上看,形态多中心性变动幅度总体不大,但变动趋势差别较大,既有先降后升的“U”型(如长江中游城市群)、也有先升后降的倒“U”型(如珠三角城市群)、又有“W”型(如成渝城市群)或“N”型(如宁夏沿黄城市群)(表1)。为了把握城市群技术知识形态多中心性演化的总体特征,计算19个城市群多中心性的均值,可见总体上城市群形态多中心性呈现先降后升再微弱下降的变动特征,与功能多中心性呈现持续递增的态势明显不同(图3),表明中国城市群内部城市的技术知识生产格局经历了从集中到分散再到集中的发展过程,这一过程与城市群整体技术创新能力的提升相伴发生。城市群创新发展初期,城市间技术生产能力差异很大,主要集中在中心城市;之后在中心城市的带动下,边缘城市技术生产能力增强,推动城市群技术知识向多中心发展;然而伴随着技术革新和产业升级,技术生产中心城市再一次承担起城市群技术创新核心功能,引领城市群适应新产业需求和新科技变革。图3中显示第二次集中的程度相比第一次要弱,这是由于城市技术发展的多样化和持续的累积,技术生产的集中程度难以像前面阶段那样高,而且还会再一次转向多中心发展。
表1 2000年、2005年、2010年、2015年、2019年中国城市群技术知识形态多中心性
Tab. 1
| 城市群 | 2000年 | 2005年 | 2010年 | 2015年 | 2019年 |
|---|---|---|---|---|---|
| 长三角城市群(YRD) | 0.617 | 0.605 | 0.482 | 0.480 | 0.483 |
| 珠三角城市群(PRD) | 0.239 | 0.392 | 0.413 | 0.423 | 0.390 |
| 京津冀城市群(BTH) | 0.479 | 0.459 | 0.467 | 0.454 | 0.468 |
| 长江中游城市群(MYR) | 0.582 | 0.536 | 0.605 | 0.607 | 0.610 |
| 成渝城市群(CHC) | 0.503 | 0.464 | 0.537 | 0.513 | 0.506 |
| 辽中南城市群(CSL) | 0.424 | 0.406 | 0.424 | 0.372 | 0.325 |
| 山东半岛城市群(SDP) | 0.459 | 0.393 | 0.438 | 0.395 | 0.440 |
| 海峡西岸城市群(WTS) | 0.492 | 0.481 | 0.486 | 0.483 | 0.496 |
| 哈长城市群(HAC) | 0.450 | 0.443 | 0.439 | 0.437 | 0.439 |
| 中原城市群(CPL) | 0.463 | 0.383 | 0.347 | 0.428 | 0.428 |
| 关中平原城市群(GZP) | 0.397 | 0.392 | 0.385 | 0.424 | 0.287 |
| 北部湾城市群(GXB) | 0.369 | 0.366 | 0.383 | 0.483 | 0.451 |
| 天山北坡城市群(TSM) | 0.232 | 0.238 | 0.260 | 0.262 | 0.256 |
| 晋中城市群(CSX) | 0.307 | 0.297 | 0.302 | 0.372 | 0.345 |
| 呼包鄂榆城市群(HBY) | 0.281 | 0.267 | 0.319 | 0.283 | 0.284 |
| 滇中城市群(CYN) | 0.379 | 0.381 | 0.402 | 0.385 | 0.389 |
| 黔中城市群(CGZ) | 0.300 | 0.225 | 0.360 | 0.417 | 0.506 |
| 兰西城市群(LAX) | 0.356 | 0.382 | 0.366 | 0.367 | 0.366 |
| 宁夏沿黄城市群(NYR) | 0.222 | 0.282 | 0.254 | 0.234 | 0.311 |
图3
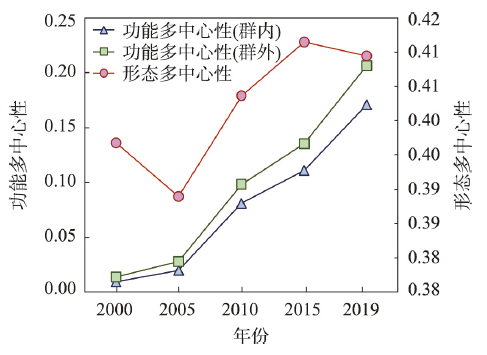
图3
中国城市群技术知识形态和功能多中心性比较(5年所有城市群的均值)
Fig. 3
The comparison of morphological and functional polycentricity of technological knowledge in Chinese urban agglomerations (five-year mean value)
4.1.2 功能多中心性
在聚焦中国内部技术创新格局的前提下,城市群功能多中心性需要从两个维度来探讨,一是从城市群内部的城市间技术合作关系探讨群内功能多中心性,来反映各城市融入城市群技术创新网络的均衡程度;二是从城市群对外技术合作关系来探讨群外功能多中心性,来反映是单一城市还是多个城市承担了城市群对外技术联系的“门户”角色。从功能多中心性计算结果看,不管是群内还是群外,一个共同的特点是所有城市群在2000—2019年间都经历了从低到高的快速发展过程,多数城市群在5个年份都表现出持续递增的态势,仅有少数城市群在中间年份有微小下降,但总体增长的趋势非常明显(表2)。
表2 2000年、2005年、2010年、2015年、2019年中国城市群技术知识功能多中心性
Tab. 2
| 城市群 | 2000年 | 2005年 | 2010年 | 2015年 | 2019年 | |||||||||
|---|---|---|---|---|---|---|---|---|---|---|---|---|---|---|
| 群内 | 群外 | 群内 | 群外 | 群内 | 群外 | 群内 | 群外 | 群内 | 群外 | |||||
| 长三角城市群 | 0.046 | 0.010 | 0.095 | 0.023 | 0.183 | 0.047 | 0.193 | 0.054 | 0.227 | 0.087 | ||||
| 珠三角城市群 | 0.055 | 0.013 | 0.087 | 0.025 | 0.290 | 0.050 | 0.248 | 0.061 | 0.232 | 0.079 | ||||
| 京津冀城市群 | 0.025 | 0.018 | 0.055 | 0.029 | 0.160 | 0.044 | 0.195 | 0.064 | 0.273 | 0.078 | ||||
| 长江中游城市群 | 0.002 | 0.005 | 0.013 | 0.009 | 0.041 | 0.022 | 0.064 | 0.026 | 0.069 | 0.034 | ||||
| 成渝城市群 | 0.001 | 0.005 | 0.020 | 0.004 | 0.075 | 0.016 | 0.103 | 0.024 | 0.165 | 0.039 | ||||
| 辽中南城市群 | 0.012 | 0.006 | 0.023 | 0.009 | 0.033 | 0.016 | 0.111 | 0.016 | 0.150 | 0.030 | ||||
| 山东半岛城市群 | 0.014 | 0.006 | 0.034 | 0.008 | 0.132 | 0.023 | 0.245 | 0.039 | 0.283 | 0.049 | ||||
| 海峡西岸城市群 | 0.000 | 0.002 | 0.007 | 0.009 | 0.063 | 0.010 | 0.119 | 0.026 | 0.144 | 0.028 | ||||
| 哈长城市群 | 0.018 | 0.004 | 0.006 | 0.002 | 0.024 | 0.009 | 0.069 | 0.015 | 0.080 | 0.023 | ||||
| 中原城市群 | 0.000 | 0.003 | 0.031 | 0.004 | 0.074 | 0.014 | 0.139 | 0.018 | 0.170 | 0.037 | ||||
| 关中平原城市群 | 0.000 | 0.004 | 0.002 | 0.007 | 0.058 | 0.016 | 0.025 | 0.018 | 0.079 | 0.028 | ||||
| 北部湾城市群 | 0.002 | 0.002 | 0.000 | 0.004 | 0.027 | 0.007 | 0.108 | 0.015 | 0.118 | 0.028 | ||||
| 天山北坡城市群 | 0.000 | 0.001 | 0.000 | 0.002 | 0.003 | 0.004 | 0.069 | 0.005 | 0.102 | 0.019 | ||||
| 晋中城市群 | 0.000 | 0.003 | 0.000 | 0.001 | 0.048 | 0.009 | 0.034 | 0.011 | 0.258 | 0.017 | ||||
| 呼包鄂榆城市群 | 0.000 | 0.001 | 0.000 | 0.002 | 0.000 | 0.012 | 0.000 | 0.021 | 0.276 | 0.038 | ||||
| 滇中城市群 | 0.000 | 0.002 | 0.000 | 0.004 | 0.142 | 0.008 | 0.176 | 0.014 | 0.180 | 0.016 | ||||
| 黔中城市群 | 0.000 | 0.000 | 0.004 | 0.003 | 0.113 | 0.005 | 0.109 | 0.013 | 0.194 | 0.015 | ||||
| 兰西城市群 | 0.000 | 0.003 | 0.000 | 0.007 | 0.000 | 0.010 | 0.063 | 0.012 | 0.085 | 0.012 | ||||
| 宁夏沿黄城市群 | 0.000 | 0.000 | 0.000 | 0.001 | 0.070 | 0.002 | 0.039 | 0.005 | 0.165 | 0.011 | ||||
注:群内是指城市群内部城市间开展技术知识合作的功能多中心性,群外是指城市群同国家内部城市群外部城市开展技术知识合作的功能多中心性。
在群内功能多中心性方面,有多个城市群在不同年份存在零值现象,表明这些城市群尚未建立起技术合作关系,但零值现象不断减少,从2000年10个减少到2005年7个,再到2010年2个和2015年1个。另一方面多中心性数值增加明显,增加最少的是长江中游城市群,反映出该城市群内部城市间的技术合作关系发展程度与理想值之间存在较大差距,这与该城市群跨三省、包含城市较多且区域创新系统不健全有关[38];增加最多的是呼包鄂榆城市群,作为西部发展水平不太高的城市群具有如此明显的增幅,表明中西部城市群近年来也非常重视城市间的协同创新[39],也有较好的表现,当然该城市群仅有4个地级市组成,也是造成群内功能多中心性结果偏高的重要原因。珠三角城市群在2010年达到峰值,而且在中国所有城市群中具有最高的群内功能多中心性,但2015年和2020年又表现出微小下降,表明珠三角城市群又进入新一轮技术创新网络结构的调整,核心城市再次发挥群内技术创新的引领带动作用。总体而言,中国城市群内部城市间技术联系普遍增强,网络均衡性大大提升,但未来群内功能多中心性也有可能会像珠三角城市群一样出现波动,因此只有通过长期分析和多城市群对比才能准确识别其内部创新网络结构特征。
在群外功能多中心性方面,呈现出两个重要特征。一个特征是所有城市群的群外功能多中心性数值2000—2019年间均得到普遍提升,表明城市群同外部建立技术合作的城市不断增加,多个城市代替少数城市承担起城市群的技术“门户”作用,这一特征与群内功能多中心性较为一致。其中,增长最明显的是长三角城市群,2019年比2000年增加了0.077,主要是受上海、南京、杭州和合肥4个省会城市或直辖市具有较强的对外技术合作能力影响;而增长最小的是宁夏沿黄城市群,20年间仅增加了0.011,表明城市群技术“门户”城市比较单一,核心城市之外的城市尚未同外部建立起较强技术合作。另一个特征是群外功能多中心性表现与城市群总体发展水平较为一致,发展水平较好的城市群往往存在较高的群外功能多中心性,而且多中心性的增长也更为明显。比如长三角、珠三角、京津冀三大国家级城市群明显高于其他城市群,东、中、西部城市群也总体呈现梯度递减趋势,而形态多中心性和群内功能多中心性并没有表现出这一特征(表2)。
从19个城市群对比来看,长三角、珠三角、京津冀和山东半岛城市群同时具备较高的群内和群外功能多中心性,城市群内外联系的通道均比较发达,既可以有效整合城市群内部创新要素和资源,又可以与外部进行广泛技术和信息交流,有助于实现“本地蜂鸣—全球管道”的耦合效应[40]。有些城市群寻求技术创新合作的外向型特征显著,多个中心城市与城市群外部城市建立了更为密切的技术联系,倾向于接受群外城市的异质性技术知识,但在城市群内部技术创新合作网络中的地位并不突出,一定程度抑制了流入技术知识的本地溢出效应,降低了外部技术知识对城市群创新的贡献[41],如长江中游、成渝、中原等城市群;这几个城市群应加强群内城市间技术交流合作,将外部多样化技术与本地技术充分结合并在群内广泛传播,作为未来创新发展中的努力方向。部分城市群的群内多中心性位序高于群外多中心性,说明该城市群更倾向于在群内节点城市间建立技术创新联系,与城市群外部城市的创新联系渠道相对单一,如晋中、呼包鄂榆、黔中、宁夏沿黄等城市群,这些城市群涉及城市相对少,城市群内部能够建立一定的合作关系,但创新能级较低导致能够发挥对外技术合作功能的城市较少。此外,还有城市群的群内和群外功能多中心性均较低,这类城市群大多整体技术创新能力相对滞后,除中心城市外,其余城市的内外创新联系均十分微弱,如兰西、天山北坡、哈长和关中平原等城市群。
基于上述分析,进一步总结城市群技术知识多中心性发展的阶段规律。根据城市在城市群内部技术知识生产与合作地位的高低,将城市划分成核心城市、中心城市和边缘城市3类,城市群内部城市的技术知识生产和合作格局不断发生变化,每个阶段所对应的形态和功能多中心性也随之变化(图4)。形态多中心性曲线反映了知识生产格局会从集中到分散向下一个集中分散过程演进,在中心城市的辐射带动下,城市群内继续形成多个中心城市,但再集中再分散会建立在上一次集中分散基础上,幅度会降低。而功能多中心性曲线反映了知识合作格局呈现出持续递增的态势,不同的城市之间基于“互补”或“合作”关系不断建立技术创新联系,城市群内部逐渐形成多向互动、有机联系的技术创新网络,城市群外部技术联系从核心城市承担主要联系职能发展成多个城市共同承担对外联系职能。未来高创新能力的城市群在形态和功能上都会逐渐向多中心结构演化。
图4
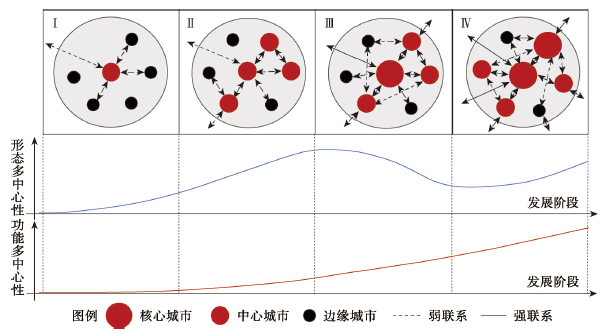
图4
城市群知识多中心性发展阶段规律示意图
Fig. 4
Schematic diagram of the development stages of knowledge polycentricity in urban agglomerations
4.2 城市群多中心性类型演替特征
城市群多中心性单方面的演化过程分析难以综合判断城市群多中心性发展程度及在国家中的相对地位,类型划分有助于对这些方面开展深入研究。参考相关学者对多中心性的类型划分方法[33,42],依据城市群技术知识的形态多中心性和功能多中心性,按照二分法分类的基础方法,取当年所有城市群的均值,将所有城市群划分成4种类型,分别为第一象限的高形态—高功能型(H-H)、第二象限高形态—低功能型(H-L)、第三象限低形态—低功能型(L-L)、第四象限低形态—高功能型(L-H)。H-H型代表城市群技术知识生产分散在多个城市,而且多个城市又承担起技术知识合作功能;H-L型代表城市群技术知识生产分散,但合作功能集中在少数城市;L-L型代表城市群技术知识生产与合作都集中在少数城市;L-H型代表城市群技术知识生产较为集中,但合作分散到多个城市。
图5
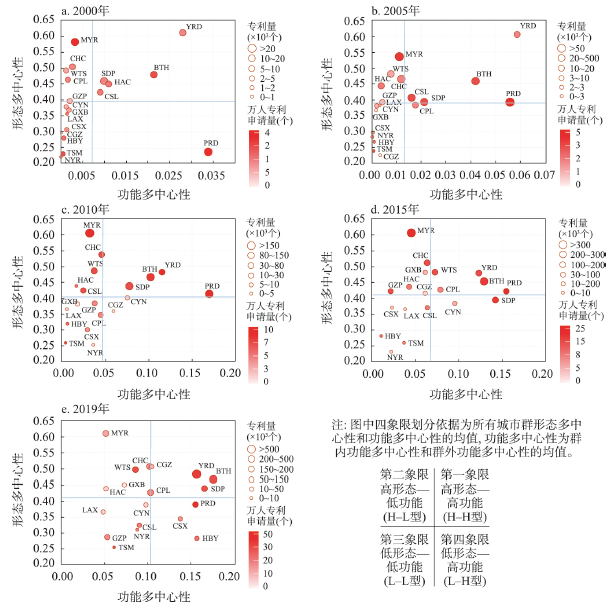
图5
2000年、2005年、2010年、2015年、2019年中国城市群多中心性类型演变
注:城市群简称参照
Fig. 5
The evolution of polycentric pattern of Chinese urban agglomerations in 2000, 2005, 2010, 2015, and 2019
图6
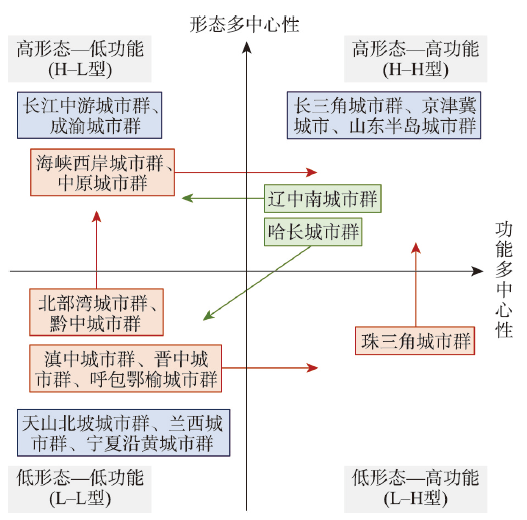
图6
2000—2019年中国城市群多中心性类型迁移趋势
Fig. 6
The evolution trends of polycentric types of technological knowledge in Chinese urban agglomerations from 2000 to 2019
(1)城市群技术知识生产能力展现出加快发展的态势。从图5中可以看出,不管是专利量还是万人专利申请量,从2000年到2019年都表现出指数式增长,表明中国城市群已经具有技术创新的孵化器功能,有越来越多的专利产生。
(2)功能多中心性呈现整体向高水平方向推进。在2000年的时候,城市群集中分布在低功能多中心性一侧,之后各年份不断有城市群向高功能多中心性一侧推移,到2019年时已经呈现出分布均匀的格局;所有城市群功能多中心性的均值也从2000年的0.007持续增加到2019年的0.207。这表明2000—2019年间中国城市群城市间的技术知识合作得到了快速的发展,城市群内部的技术合作网络化“轮轴”城市和对外技术“门户”城市不断增多。相比来看,形态多中心性均值多年徘徊在0.4上下,不存在方向性趋势。
(3)城市群的创新能力与多中心性存在较大一致性。结合城市群的多中心性象限分布与创新产出水平(专利量和万人专利申请量),可以看到拥有较高技术知识生产规模和强度的城市群,往往会具有较高的功能多中心性或形态多中心性。创新能力低的H-L型城市群最不理想,城市群既没有技术创新能力突出的核心城市引领带动,也没有与其他城市建立紧密的内外联系,这类城市群(如黔中、哈长、北部湾等城市群)需要通过培育核心城市引导创新要素集聚,进而带动城市群区域创新系统建设,推动城市群创新发展。
(4)有些城市群多年始终处于同一类型。比如,长三角、京津冀和山东半岛城市群始终是H-H型,长江中游和成渝城市群始终是H-L型,天山北坡、兰西和宁夏沿黄城市群始终是L-L型。虽然同为H-H型,但城市群位置的象限内变动也反映出城市群在技术创新方面的发展方向,2000年、2005和2010年长三角城市群功能多中心性一直高于京津冀城市群,但2015年京津冀城市群反超长三角城市群,并在2019年攀升到中国城市群功能多中心性首位,表明2014年开始国家力推的京津冀协同发展战略有力推动了京津冀城市群的技术创新协同发展[43-44],这一客观结果与相关研究用修正的引力模型模拟得出的京津冀城市群极核式结构并不一致[45]。此外,另一个值得关注的是山东半岛城市群在形态多中心性相对位置基本不变的情况下,功能多中心性呈现出明显的向高值区移动态势,然而当前对山东半岛城市群创新网络的研究却非常缺乏。长江中游城市群功能多中心性很低,但形态多中心性却一直很高,表明长江中游城市群虽然是五大国家级城市群之一,但城市间技术协同创新关系发展却非常滞后,这是需要重点关注的问题。
(5)多个城市群类型发生了正向迁移。海峡西岸城市群和中原城市群在高位形态多中心性的情况下,2000—2019年间功能多中心性从第二象限转移到第一象限;滇中、晋中和呼包鄂榆城市群在低位形态多中心性的情况下,从第三象限转移到第四象限;表明这些城市群城市间技术合作关系得到了较大发展。北部湾和黔中城市群在低位功能多中心性情况下,从第三象限转移到第二象限;珠三角城市群在高位功能多中心性情况下,从第四象限转移到第一象限;表明这些城市群技术知识生产格局从集中走向分散。
(6)仅有东北地区的两个城市群发生了逆向迁移。辽中南城市群从H-H型转移到H-L型,表明辽中南城市群核心城市在城市间技术合作中的作用持续增强。哈长城市群从H-H型转移到H-L型,再转移到L-L型,表明哈长城市群核心城市不仅在技术合作中的作用在增强,而且技术生产也越来越趋向集中。当然,这种转移并不能表明城市群创新发展的逆行,但却说明东北地区协同创新发展的确存在较大问题,至少从专利产出规模和强度看,他们在中国的地位下降明显,需要在未来创新发展中加以重视。
4.3 城市群多中心性创新产出效应
上文城市群技术知识多中心性时空演化和类型更替直观展示了多中心性演变特征,这里将使用模型定量揭示多中心性演化内在规律。为揭示城市群形态多中心性与城市创新绩效的统计关系,分别对形态多中心性与专利申请量进行一次函数和二次函数拟合。在四象限一次函数拟合图中(图7),一二象限(形态多中心性高)为负相关,三四象限(形态多中心性低)为正相关。而且,功能多中心性对斜率有影响,三四象限斜率都为正值,但功能多中心性高的第四象限斜率更大,正相关更强,这表明城市群在技术知识生产偏向集中化的情境下,技术合作关系分散化更能增进技术生产分散化的群体创新能力。一二象限都为负值,但功能多中心性高的第一象限斜率更小,负相关更强,这表明城市群在技术知识生产偏向分散化的情境下,技术合作关系分散化会导致技术生产分散化的群体创新能力下降更快。简言之,城市群形态多中心性的创新效应会受到功能多中心性的潜在影响。在二次函数拟合中(图8),显示出形态多中心性与取对数后的专利申请数呈现明显的倒“U”型关系,且当城市群技术知识的形态多中心性在0.5附近时,城市创新产出(专利申请数量)达到最大值。
图7
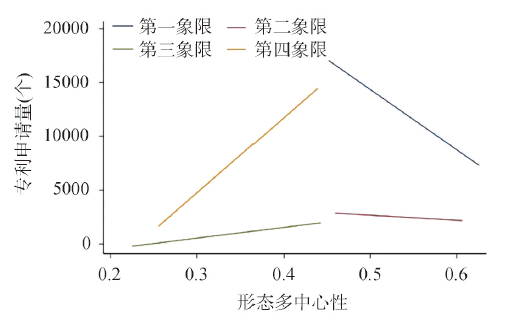
图7
形态多中心性与专利申请量一次函数拟合图
Fig. 7
Linear fitting diagram of morphological polycentricity and the number of patent applications
图8
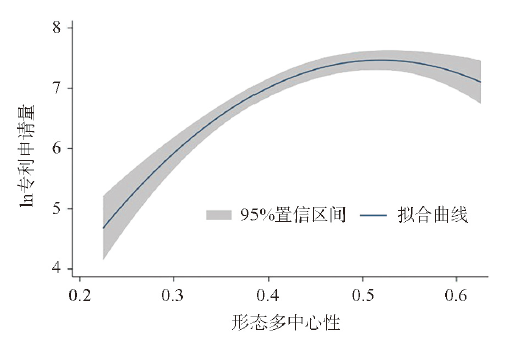
图8
形态多中心性与专利申请量二次函数拟合图
Fig. 8
Quadratic function fitting diagram of morphological polycentricity and the number of patent applications
根据上述函数拟合结果,分别对一二象限(形态多中心性高)、三四象限(形态多中心性低)、一四象限(功能多中心性高)、二三象限(功能多中心性低)以及总体样本进行面板工具变量回归分析。以形态多中心性和功能多中心性为核心变量,将核心变量滞后期作为工具变量,构建了非平衡短面板模型。在控制变量的选择上,参考相关研究[46⇓-48]并经过多次尝试,最终选择了政府研发投入(GOV)、高校在校学生数(UNV)、外资占GDP比重(FPG)、人均GDP(PGDP)等指标,分别代表政府支持、人才基础、开放程度和发展水平。表3展示了回归结果,其中模型1~4分别是对应一二象限、三四象限、一四象限、二三象限,模型5和模型6对应总体样本(表3),可以看出:① 形态多中心性(FOM)与专利申请量在一二象限呈现显著负相关,而在三四象限呈现显著正相关,这与一次函数模拟结果一致。② 功能多中心性(FUM)与专利申请量呈现稳定且显著正相关,表明城市间技术知识合作关系的分散化会促进城市群整体的创新产出,加强城市的对外技术合作能力有助于提升城市群整体创新能力,再一次证实了发展城市群内和城市群间创新合作网络的重要性。③ 政府研发投入(lnGOV)、高校在校学生数(lnUNV)、人均GDP(lnPGDP)都与专利申请量呈现稳定且显著的正相关关系,而外资占GDP比重(FPG)仅在一二象限和二三象限呈现出显著的正相关关系,在三四象限、一四象限、总体样本中都没有显著的相关性。外资对发展中国家内部技术创新扩散的负向作用已经被多个研究证实[46⇓⇓-49],研究表明外资只有在城市群知识生产分散化的情况下才可能有助于城市群创新产出,因此需要清晰认识外资对区域创新的作用;这一结果或许与没有考虑同国外开展技术知识合作有关,但至少说明试图通过引进外资来提升城市的技术创新水平,对多数城市而言难以实现。
表3 两阶段最小二乘法回归结果
Tab. 3
| 样本 | 一二象限 (模型1) | 三四象限 (模型2) | 一四象限 (模型3) | 二三象限 (模型4) | 全样本 (模型5) | 全样本 (模型6) |
|---|---|---|---|---|---|---|
| FOM | -5.314*** | 7.101*** | 2.956*** | |||
| FUM | 15.063*** | 21.467*** | 9.586*** | |||
| lnGOV | 0.143*** | 0.176*** | 0.302*** | 0.094** | 0.228*** | 0.167*** |
| FPG | 30.545* | 0.104 | 0.487 | 50.242*** | 0.329 | -1.255 |
| lnUNV | 0.361*** | 0.354*** | 0.152** | 0.515*** | 0.350*** | 0.375*** |
| lnPGDP | 0.841*** | 0.745*** | 0.276* | 0.344*** | 0.679*** | 0.290*** |
| 常数 | 8.992*** | 3.128*** | 4.756 | 4.982*** | 4.853*** | 5.686*** |
| 样本数量 | 345 | 341 | 270 | 416 | 686 | 686 |
| Centered R2 | 0.688 | 0.713 | 0.101 | 0.740 | 0.667 | 0.687 |
| 弱工具变量检验 | 352.586*** | 264.191*** | 110.154*** | 261.257*** | 2248.942*** | 851.865*** |
| 不可识别检验 | 175.889*** | 150.351*** | 79.490*** | 161.909*** | 526.734*** | 381.482*** |
注:*表示p < 0.1,**表示p < 0.05,***表示p < 0.01。
表4 两阶段最小二乘法稳健性检验回归结果
Tab. 4
| 样本 | 一二象限 (模型7) | 三四象限 (模型8) | 一四象限 (模型9) | 二三象限 (模型10) | 全样本 (模型11) | 全样本 (模型12) |
|---|---|---|---|---|---|---|
| FOM | -6.824*** | 8.621*** | 1.777** | |||
| FUM | 21.39*** | 17.504*** | 10.647*** | |||
| lnGOV | 0.045 | 0.158*** | 0.026 | 0.157** | 0.174*** | 0.168*** |
| FPG | 64.578** | -14.111*** | -32.35 | -16.201*** | -15.592*** | -13.975*** |
| lnUNV | 0.406*** | 0.398*** | 0.336** | 0.41*** | 0.412*** | 0.352*** |
| lnPGDP | 0.509*** | 0.914*** | 0.467 | 0.099 | 0.505*** | 0.228* |
| 常数 | 10.299*** | 2.346** | 2.458** | 5.504*** | 5.739*** | 5.607*** |
| 样本数量 | 186 | 166 | 137 | 215 | 352 | 352 |
| Centered R2 | 0.441 | 0.594 | . | 0.556 | 0.443 | 0.471 |
| 弱工具变量检验 | 1220.87 | 89.681 | 28.439 | 167.578 | 1737.858 | 302.223 |
| 不可识别检验 | 162.101 | 59.624 | 24.437 | 95.675 | 293.555 | 164.114 |
注:*表示p < 0.1,**表示p < 0.05,***表示p < 0.01。
使用门槛效应模型确定城市群技术知识形态多中心性与城市创新产出的倒“U”型关系的拐点值。以城市专利申请量作为被解释变量,城市群技术知识形态多中心性水平作为核心变量和门槛变量,用Bootstrap方法抽签400次,结果如表5所示。单门槛结果显著,而双重门槛检验结果则不显著,门槛估计值为0.438,即在形态多中心性值小于0.438时,城市群技术知识形态多中心性与城市创新产出正相关;当形态多中心性值大于0.438时,城市群技术知识形态多中心性与城市创新产出负相关。
表5 门槛效果显著性检验
Tab. 5
| 门槛数 | RSS | MSE | F值 | P值 | 10% | 5% | 1% | 门槛值 |
|---|---|---|---|---|---|---|---|---|
| 单一门槛 | 201.261 | 0.241 | 34.96 | < 0.000 | 10.181 | 12.206 | 17.930 | 0.438 |
| 双重门槛 | 195.883 | 0.234 | 22.95 | 0.112 | 33.330 | 51.797 | 73.223 | 0.413 |
为了检验门槛结果的稳健性,以上述估计的门槛值0.438作为界限对样本进行分类回归。模型13、15、17结果表明(表6),当形态多中心性小于门槛值时,城市群技术知识形态多中心性与城市创新产出在1%水平上显著正相关;模型14、16、18结果表明(表6),当形态多中心性大于门槛值,城市群技术知识形态多中心性与城市创新产出在1%水平上显著负相关,即城市群技术知识的形态多中心性与城市创新产出呈现出以0.438为拐点的倒“U”型关系。这说明表6中门槛值估计结果是稳健的。门槛值的确定,可为城市群创新战略制定和创新空间布局提供参考。依此判断,长江中游、成渝、海峡西岸和黔中等城市群当前形态多中心性偏高,应强化核心城市的技术创新能力,提升在城市群中的技术生产地位;而天山北坡、晋中、呼包鄂榆、兰西和宁夏沿黄等城市群当前形态多中心性偏低,则应注重培育新的技术创新中心城市,分担核心城市的技术生产职能。依据门槛值进行城市群技术产出空间格局的调整,有利于总体提升城市群的技术创新效应。
表6 门槛效应稳健性检验
Tab. 6
| 样本 | 普通最小二乘法 | 两阶段最小二乘法 | 面板工具变量 | |||||
|---|---|---|---|---|---|---|---|---|
| 小于门槛值 (模型13) | 大于门槛值 (模型14) | 小于门槛值 (模型15) | 大于门槛值 (模型16) | 小于门槛值 (模型17) | 大于门槛值 (模型18) | |||
| FOM | 7.588*** | -3.212*** | 9.16*** | -1.98*** | 9.16*** | -5.478*** | ||
| lnGOV | 0.162*** | 0.208*** | 0.147*** | 0.216*** | 0.147*** | 0.142*** | ||
| FPG | -0.248 | 31.415** | -0.399 | 30.297** | -0.399 | -24.149* | ||
| lnUNV | 0.342*** | 0.365*** | 0.344*** | 0.364*** | 0.344*** | 0.155*** | ||
| lnPGDP | 0.792*** | 0.677*** | 0.811*** | 0.662*** | 0.811*** | 0.919*** | ||
| 常数 | 2.975*** | 7.94*** | 2.369*** | 7.322*** | 2.369*** | 9.279*** | ||
| 样本数量 | 300 | 386 | 300 | 386 | 300 | 386 | ||
| R2 | 0.7113 | 0.6767 | 0.7091 | 0.6748 | 0.744 | 0.805 | ||
注:*表示p < 0.1,**表示p < 0.05,***表示p < 0.01。
5 结论与讨论
本文运用中国城市专利申请和城市间专利合作数据,对中国19个城市群的技术知识多中心性开展了时空格局演化、类型演替趋势与创新产出效应的定量研究,主要结论为:
(2)在对多中心性类型演替趋势方面,发现4种类型的城市群多年间发生了较多位移。位移方向以正向位移居多,珠三角、北部湾和黔中城市群向高形态多中心性移动,中原、海峡西岸、滇中、晋中、呼包鄂榆等城市群向高功能多中心性移动,仅有东北地区的哈长和辽中南城市群出现了“逆行”现象。虽然形态和功能多中心性高低难以反映创新水平,但结合创新水平看多中心性类型的演替,可基本判断城市群多中心性与创新水平的关系。正向移动证明中国城市群2000—2019年在技术创新方面总体实现了较快发展。
按照国家创新发展战略布局,除了加快建设京津冀、长三角和粤港澳三大城市群支撑北京、上海和粤港澳三大国际科技创新中心之外,还要加快布局和建设一批区域科技创新中心,推动国际和区域科技创新中心互动发展,共同支撑世界科技强国建设和双循环新发展格局。本文认为,依托城市群推动区域科技创新中心建设将是符合中国国情的一条捷径。基于对城市群技术知识多中心性的研究发现,结合前期对科学知识多中心性的研究结果,认为对城市群知识创新空间格局的评价要科学严谨,城市群创新空间差异过大或过于分散并不能与城市群整体创新能力建立直接关系,需要在城市群发展阶段和动态视角下综合判断。建议在城市群知识创新多中心性规律科学认知的基础上,深入研究特定城市群的科技创新格局和演化过程,编制城市群科技创新专项规划,制定适合城市群自身发展阶段的空间布局和发展方案。当然,不管科技创新空间如何布局,采用积极的政策措施鼓励所有城市开展对外科技合作与协同创新,是提升城市群整体创新水平的必然路径。
城市群创新多中心性是一个复杂问题,尚有很多研究需要持续推进。仅用5年截面数据,虽然可以揭示总体规律,但未来还会考虑使用2000—2019年的面板数据,进一步提高模型精准度。城市群创新多中心,还需要加强与科学知识多中心性的对比,继续探索多类型创新合作,便于总结提炼城市群创新多中心性的内在规律。仅是对中国城市群多年间的变化模拟分析,不足以固化成城市群创新多中心性的规律,还需要对全球城市群开展综合研究,才能总结一般规律,但这一研究需要克服数据难题。此外,城市群创新多中心性与交通、经济、人口、就业等多中心性的关系如何?研究建立城市群多要素的多中心性关系框架,对城市群高质量发展会具有重要作用。这些问题都值得今后持续关注和深化研究。
致谢:
感谢2020—2021年度“中国科学院大学生创新实践训练计划”小组余蕾、唐鑫瑜、刘玉、肖真、宋于硕等同学在合作专利数据处理过程中付出的艰辛努力。
参考文献
The theoretical construction and network simulation of intercity innovative relationships in knowledge flow space
DOI:10.11821/dlxb202004004
[本文引用: 2]

The interactive relationships between cities in the knowledge economy era have attracted much attention. Researchers have applied a range of methods to explore intercity innovative relationships and associated network characteristics. It nevertheless remains unclear just how intercity innovative relationships can be theoretically constructed based on knowledge flow space and how further scientific simulation methods can be designed. Research questions in this area have rarely been explored in detail, an issue which has inevitably placed obstacles on further exploration. A framework for the theoretical construction of intercity innovative relationships is presented in this study; the basis for this research is that an intercity innovation network is essentially a 'soft network', distinct from a 'hard network'. These interconnections are founded on a subjective relationship construction process and therefore necessitate scale transformation from 'point-point' connections between innovative subjects in different cities with respect to 'city-city' interactions. At the same time, this transformation process is prone to exaggerations and deviations from objective intercity innovative relationships and therefore exerts considerable influence on the accuracy of results such that constructions must be entirely theoretical. Four construction methods for intercity innovative relationships and network simulation are summarized in this study, including an intercity undirected network based on cross-city co-operations between scientific and technological achievements, an intercity directed network based on the cross-city transfer of scientific and technological achievements, an intercity innovation network based on the cross-city flow of high-end talents, and an intercity innovation network based on the multi-city distribution of innovative enterprises and institutions. Simulation tests were then undertaken using relevant data to reflect aspects of these relationships. The results of this analysis are conducive to further exploration of global and regional innovative spatial patterns from the perspective of urban geography and intercity relationships and provide a theoretical and methodological foundation for further research on intercity innovation networks.
知识流动空间的城市关系建构与创新网络模拟
DOI:10.11821/dlxb202004004
[本文引用: 2]
知识经济时代城市间的创新关系是新时代城市间相互作用关系的新内涵,研究者尝试采用各种方法探索城市间创新关系及其网络特征。然而,如何从理论上建构知识流动空间的城市间创新关系?如何设计更加合理的城市间创新网络模拟方法?这些问题却少有专门探讨。基于相关研究,本文提出了城市间创新关系构建的理论框架,认为城市间创新网络本质上是区别于“硬网络”的“软网络”,是一种主观的关系建构过程,需要经过异城创新主体间的点—点关系向城—城之间关系的尺度转换,这一转换过程容易发生夸大或偏离城市间客观存在的创新关系,对结果的精确度产生很大影响,应对关系建构给予充分理论论证;本文论述了4种城市间创新关系建构和网络模拟方法,包括科技成果异城合作的城市间无向网络构建方法、科技成果转让转移的城市间有向网络构建方法、高端人才跨城移动的城市间创新网络建构方法和创新企业机构多城分布的城市间创新网络建构方法,并运用相关数据进行了模拟试验与结果展示,来反映城市间创新关系的不同方面。本研究有助于推动从城市地理学视角和城市关系的维度探讨全球/区域的创新空间格局,为城市间创新网络研究提供理论和方法支撑。
DOI:10.1177/0042098016656971 URL [本文引用: 3]
Spatial system of "urban agglomeration" in district development
区域发展中“城市群现象”的空间系统探索
New structure and new trend of formation and development of urban agglomerations in China
DOI:10.13249/j.cnki.sgs.2011.09.1025
[本文引用: 1]
Based on the basic judgment of identification standards and spatial structure of urban agglomerations in China, this paper considered that "15+8" spatial structure system comprised of 15 compliance and 8 non-compliance of urban agglomerations was the present structure of formation and development of urban agglomerations in China. The main conclusions were as follows. Firstly, analyzing the "three high" characteristic comprised of high-density cluster, high-speed growth, high-intensity operation of urban agglomerations in China, this paper put forward: 1) "Four Low" problems containing low development degree, low input-output efficiency, low compact degree, low resources and environmental protection degree, 2) "Four Competition" problems comprised of blindly competing for national strategies regardless of own condition to strive for national pilot area, expanding their power regardless of the red line to trigger a large-scale land to construct cities, leading to the so-called high degree of integration with competing for construction repeatedly regardless of cooperation, breeding area deprivation with drawing up high goals careless for the resources and environmental capacity; 3) "Four-off" problems containing excessive intervention of government and administration, high estimated of the development prospects, dense negative effect of the clustering size, large development gap and 4) "Five Missing" problems comprised of lack of unified identification standard of urban agglomerations, lack of standardized statistical data, lack of centralized management with specific authorities, lack of accepted planning approach and implementation institution, lack of planning legal status of urban agglomerations. Secondly, this paper brought forward the overall development strategy and construction goals of urban agglomerations in China and thought that it would form national urban agglomerations spatial structure system comprised of 23 urban agglomerations, 6 urban agglomerations gathering area and "π" shaped urban agglomerations continuous band. Finally, some policy support mechanism and countermeasures suggestions for the construction of urban agglomerations in China were put forward: 1) to formate a national-level and local-level coordinated development management committee of urban agglomerations, public finance mechanisms and public financial reserve system for urban agglomerations, 2) to revise Town and Country Planning Act or to introduce Regional Planning Act which will add the content of urban agglomerations planning and draft treaty for cooperation of urban agglomerations, 3) to introduce Urban Agglomerations Planning Approval Approach and Urban Agglomerations Planning Implementation Management Ordinance and to build urban agglomerations planning implementation institution, 4) to introduce technical guide to guide scientific planning for urban agglomerations and to strengthen resources and environmental protection capacity and sustainable development capacity of urban agglomerations, 5) relying on the rapid land-axis and speeding up to construct the 7 918 national highway network and "four vertical and four horizontal" high-speed railway network for improving rapid transit system of urban agglomerations, and 6) to specify standards of statistical data and compile and publish Statistical Yearbook of Urban Agglomerations in China.
中国城市群形成发育的新格局及新趋向
Spatial organization pathway for territorial function-structure: Discussion on implementation of major function zoning strategy in territorial spatial planning
DOI:10.11821/dlyj020190865
[本文引用: 1]
The spatial organization law of territorial function-structure is the basic theoretical problem of human-earth system coupling research, as well as the basic theory of carrying out territorial spatial planning and shaping sustainable geographical pattern. Starting from the discussion of geography on the repetition, prediction, regulation and optimization of geographical processes, this paper explains that the spatial governance system is an important way for modern geography to regulate and optimize the sustainable geographical processes and patterns. The spatial and temporal evolution characteristics of the spatial structure of territorial function composed of ecological-life-production (also known as three living spaces) are adopted to express the spatial order law of territorial function - structure, and explain some spatial organization goals, e.g., the coordination between territorial function and natural geographical environment, the minimization of various functions and conflicts between different units in the same region, the effective transmission of territorial functions in different spatial scales, and the maximization of comprehensive benefits in a long time scale. On the one hand, from the perspective of sustainability, the concept of four attributes of natural elements -- resources, environment, ecology and disasters -- is proposed. Through the integration of the four attributes, the natural carrying capacity is constructed, and the function of the original value, remaining value and potential value of carrying capacity in spatial planning is analyzed, so as to form the basic method of analyzing spatial organization from bottom to top. On the other hand, starting from new spatial equilibrium, the basic method of top-down spatial organization analysis is formed based on the territorial functional suitability of carrying capacity, integrated position and spatial structure parameters. Furthermore, the basic and strategic values of the major function zoning formed by the two methods for spatial organization and planning are discussed, and a new idea of separation and interrelation of the zoning, strategy, system with planning of utilization is proposed. With the implementation of the strategy of major function zoning as the main line, the spatial scale-down conduction of major functions as the core scientific problem, and the key constraint parameters as the control indicators of spatial structure, this paper discusses the database and territorial function pedigree, functional and scale-dependent carrying capacity evaluation method and model, and the construction framework of "Three Zones and Three Lines" (Three Zones represent ecological space, agricultural space, and urban space; Three Lines represent ecological conservation redline, permanent capital farmland, and urban development boundary), and demonstrates the way to implement the strategy of major function zoning in spatial planning. Finally, the paper puts forward some suggestions that geography should strengthen the construction of scientific and technological support system, e.g., the basic theory, method and technology of large and medium spatial scale (regional) territorial spatial planning.
地域功能—结构的空间组织途径: 对国土空间规划实施主体功能区战略的讨论
DOI:10.11821/dlyj020190865
[本文引用: 1]
地域功能-结构的空间组织规律是人地系统耦合研究的基本理论问题,也是开展国土空间规划、塑造可持续地理格局的基础理论。从地理学对地理过程的重复、预测、调控、优化的讨论入手,阐释了空间治理体系是现代地理学用于调控和优化可持续地理过程与格局的重要途径。采用生态-生活-生产等三生空间构成的地域功能空间结构呈现的时空演变特征,表达了地域功能-结构的空间有序性法则,阐释了地域功能与自然地理环境相协调、同一地域单元各类功能及不同单元之间冲突最小化、地域功能在不同空间尺度有效传导、以及长时间尺度综合效益最大化等空间组织目标。从可持续性出发,建立自然要素的资源、环境、生态和灾害四大属性的概念,并通过四大属性集成构成自然承载力,分析承载力的原值、余量和潜力在空间规划中的作用,形成自下而上解析空间组织的基本方法。从新空间均衡出发,基于承载力、融入位置和空间结构参量后构成的地域功能适宜性,形成自上而下解析空间组织的基本方法。进而讨论了集成两种方法形成的主体功能区具备的对空间组织与规划的基础价值和战略价值,提出主体功能区的区划、战略、制度和规划用途分离及相互关联的新思路。以实施主体功能区战略为主线、以空间降尺度传导主体功能为核心科学问题、以关键约束参数为空间结构控制性指标,讨论了数据库与地域功能谱系、功能和尺度依赖的承载力评价方法与模型库、“三区三线”的建构框架,论证了空间规划实施主体功能区战略的途径,提出地理学应着力加强大、中空间尺度(区域性)国土空间规划基础理论和方法、强化技术等科技支撑体系建设的建议。
Knowledge polycentricity and the evolving Yangtze River Delta megalopolis
DOI:10.1080/00343404.2016.1240868 URL [本文引用: 4]
International comparison of creative cities cluster: An analysis of social network and spatial organization on innovative collaboration: International comparison of creative city cluster between the Bosnywash megalopolis and the Yangtze River Delta region
网络关系与空间组织: 长三角与美国东北部城市群创新合作关系的比较分析
Dynamic evolution of scientific knowledge network in the Yangtze River delta
长三角城市群科学知识网络动态演化分析
The evolution and mechanisms of megalopolitan knowledge polycentricity of Guangdong-Hong Kong-Macao Greater Bay Area
DOI:10.11821/dlxb201812003
[本文引用: 3]
The concept of megalopolis, since its original inception six decades ago, has inspired many new terms that mainly describe large-scale urbanized forms such as megaregions and polycentric urban regions. However, recent studies have increasingly focused on the two key functions that megalopolises act as an incubator of new ideas and trends and as a hub that articulates knowledge exchange at the megalopolitan, national, and global scales. While the recent studies have mainly analyzed the functional aspects of megalopolis based on China's Yangtze River Delta region, this paper investigates the evolving process and mechanisms of knowledge collaboration within and beyond Guangdong-Hong Kong-Macao Greater Bay Area (GBA) - one of the most promising and vibrant megalopolises in China. In addition, the GBA megalopolis is unique because it contains Hong Kong and Macao, which have a different political system from China's mainland. Drawing upon a dataset of publications that were indexed in Web of Science Core Collection during the 1990-2016 period, this paper uses the Gini coefficient to measure the degree of knowledge polycentricity of the GBA megalopolis. Here, knowledge polycentricity is further classified into attribute polycentricity of knowledge production and functional polycentricity of knowledge collaboration within and beyond the GBA megalopolis. Whereas the attribute polycentricity refers to the distribution inequality of the total publications of GBA cities, the functional polycentricity represents the distribution inequality of GBA cities' knowledge collaboration at different geographical scales. Our empirical results show: (1) knowledge production of the GBA megalopolis as a whole has experienced a robust and continuous growth. The degrees of both attribute polycentricity and functional polycentricity have also been on the increase in general, although there are some fluctuations in early years and some deviations in recent years. During the ten years after Hong Kong and Macao returned to China (the 2000-2010 period), the degree of knowledge polycentricity of the GBA megalopolis especially enjoyed the fastest rise; (2) The degree of functional polycentricity decreased with the expansion in the geographical scales at which it is measured, confirming the findings of previous studies that functional polycentricity is scale-dependent. Moreover, we find that the degree of functional polycentricity becomes more fluctuated at the global scale while it tends to increase continuously at the megalopolitan scale; (3) The evolving process of knowledge polycentricity of the GBA megalopolis is influenced by institutional proximity, geographical proximity and status proximity between cities. Specifically, the mobility of researchers, the collaboration of universities and research institutes, and the coordination of local governments are three major forces promoting the evolution of knowledge polycentricity of the GBA megalopolis. Overall, the increasing knowledge polycentricity would be of significance for the GBA megalopolis to form a knowledge-driven region of collective collaboration.
粤港澳大湾区城市群知识多中心的演化过程与机理
DOI:10.11821/dlxb201812003
[本文引用: 3]
基于1990-2016年“Web of Science”核心合集所收录的科研论文合著数据,借助基尼系数测度属性和功能多中心性的方法,对粤港澳大湾区城市群的知识多中心性及其知识网络的演化进行了研究。结果发现:① 伴随着粤港澳大湾区城市群知识生产总量的持续增长,其多中心性程度呈现出阶段性、阶梯式提升的特征,分别经历了波动、增长和分化的发展阶段,港澳回归后的2000-2010年间是多中心性快速增长的重要阶段。② 粤港澳大湾区城市群在区域、国家和全球尺度上的功能多中心性程度随着尺度增加逐级递减,进一步证实了功能多中心性的尺度规律性;而且发现了多中心在演化中的尺度敏感性,全球尺度上的多中心性会存在不确定的峰值,而区域尺度上的多中心性可能会持续增加。③ 城市群多中心的演化是受制度接近、地理接近和等级接近影响,在研究人员移动、科研单位联动和政府政策推动及其行动主体间的相互作用下实现的,多中心程度的增加有助于推动粤港澳大湾区城市群构建科研协同创新共同体。
DOI:10.1177/0042098020942665 URL [本文引用: 6]
Information technology and urban form: Challenges to smart growth
DOI:10.1177/0160017604273624 URL [本文引用: 3]
The polycentric urban region: A closer inspection
DOI:10.1080/003434042000211114 URL [本文引用: 2]
Closing the gap: Territorial cohesion through polycentric development
Regional polycentricity: An indicator framework for assessing cohesion impacts of railway infrastructures
DOI:10.1080/09654313.2016.1142506 URL [本文引用: 1]
Measuring functional polycentricity developments using the flow of goods in Iran: A novel method at a regional scale
DOI:10.1080/12265934.2018.1556114 URL [本文引用: 1]
Polynucleation and economic development: The Randstad
DOI:10.1080/09654319808720474 URL [本文引用: 1]
A changing demographic regime and evolving poly centric urban regions: Consequences for the size, composition and distribution of city populations
DOI:10.1080/00420980120035277 URL [本文引用: 1]
A theoretical framework and methodology for characterising national urban systems on the basis of flows of people: Empirical evidence for France and Germany
DOI:10.1080/00420980701518990 URL [本文引用: 1]
The causal relationship between employment and business networks in US cities
DOI:10.1111/j.1467-9906.2010.00538.x URL [本文引用: 1]
Hard and soft networks for urban competitiveness
DOI:10.1080/00420980220128381 URL [本文引用: 1]
Polycentric development and the role of urban polycentric planning in China's mega cities: An examination of beijing's metropolitan area
Polycentric urban development in China: A multi-scale analysis
DOI:10.1177/2399808317690155 URL [本文引用: 1]
Study on urban agglomeration: Progress and prospects
DOI:10.11821/yj2011050001
[本文引用: 1]
Urban agglomeration is a complex with the central city as the core surrounded by two or more cities. It is the objective reflection of the economic growth and social development as well as industrial layout in a region. It has also become a main form of urbanization in developed countries. In fact, the "urban agglomeration" concept in China is the characteristics of a noun, no equivalence in foreign countries. In Western literature, the "urban agglomeration" means "urban cluster", that is, a big city and its surrounding satellite towns in remote sensing image formed the connected irregularities each other, and the spatial range includes "urbanization area (UA)" and "metropolitan area (MA)". Sometimes, some of metropolises connected each other are also called as urban agglomeration. United Nations gave a definition of urban agglomeration as follows: "Comprises a city or town proper and also the suburban fringe or thickly settled territory lying outside, but adjacent to, its boundaries. A single large urban agglomeration may comprise several cities or towns and their suburban fringes." Therefore, urban agglomeration in the Western concept includes the cities, towns and urban-region outlying areas. "Urban agglomeration" in China refers to geographical concepts of a group of major cities which are similar and interactions among administrative, transportation, economic, and social fields. In the 21st century, thanks to China's entry into the World Trade Organization, a national coastal urban agglomeration has become the main region for the national trade economy, export and the "world manufacturing bases". Urban agglomeration as an important urban spatial pattern was a unique choice to promote the process of urbanization in China. This article reviewed some progress in studies of urban agglomeration, such as the concept of urban agglomeration, overseas research of urban agglomeration, early researches of Chinese urban agglomeration and studies on Chinese urban agglomeration as a national strategy. This paper has prospects for the studies of Chinese urban agglomeration in the future. It argued that there is more complex mechanism for the rise and development of the Chinese urban agglomeration than those in Western developed countries, so that the relevant researches need innovations.
城市群研究进展与展望
Influence of urban agglomeration economic cooperation on regional coordinated development: Based on comparison between Beijing-Tianjin-Hebei and Shanghai-Jiangsu-Zhejiang
DOI:10.13249/j.cnki.sgs.2018.04.011
[本文引用: 1]
In essence, regional coordinated development is the process of the interaction of urban economy and the strengthening of economic relations between urban agglomerations. From the perspective of the economic relation, compared Beijing-Tianjin-Hebei with Shanghai-Jiangsu -Zhejiang, the article finds that Shanghai-Jiangsu-Zhejiang is superior to Beijing-Tianjin-Hebei in both the echelon structure of the economic development and economic relation with the central city. In Shanghai-Jiangsu-Zhejiang, there is the reasonable hierarchical formation: Shanghai's radiation has contributed to the rise of the surrounding subcentres, and Nanjing, Suzhou, Hangzhou, Ningbo as the subcentres, also drive the development of the surrounding cities. However, In Beijing-Tianjin-Hebei, there is obvious disparity in the urban comprehensive strength, and all cities maintain close ties with Beijing. As the core city, Beijing’ siphon effect is much greater than the diffusion effect. The polarization effect is so much that although it brings a great deal of factor supply to Beijing, it aggravates Beijing’ urban burden and weakens the radiation effect and driving capacity of other central cities such as Tianjin, Shijiazhuang and Tangshan. Changing the state of Beijing-Tianjin-Hebei urban agglomerations, simply relying on household registration restrictions or industry forced relocation, etc. is not enough. “Easing” and “cultivating”simultaneously are very important. So, taking the Xiongan New Area planning and construction as the opportunity, adjusting the Beijing-Tianjin-Hebei regional space development strategy and industry structure, fostering innovation driven development new engines, creating a new model of city management, changing the “one city dominant” development mode, enhancing the attractiveness of the urban agglomerations, is the current important route.
论城市群经济联系对区域协同发展的影响: 基于京津冀与沪苏浙的比较
DOI:10.13249/j.cnki.sgs.2018.04.011
[本文引用: 1]
区域协同发展的过程,本质是经济领域相互作用,城市群经济联系不断增强的过程。从经济联系的视角通过对京津冀城市群与长三角地区沪苏浙城市群的对比分析发现,无论是从经济发展的梯次结构还是与中心城市的经济联系,沪苏浙地区都优越于京津冀。立足现实,深化对这一问题的思考,借助雄安新区的规划与建设,就改变京津冀城市群中北京“一城独大”式的发展模式以及带来的一系列负效应,构筑梯次良好、经济互通密切的城市空间布局提出对策建议。
To build learning network of industry cluster: An actor network theory perspective
行动者网络理论视角下的产业集群学习网络构建
Applying social network analysis in economic geography: Framing some key analytic issues
DOI:10.1007/s00168-008-0258-3 URL [本文引用: 1]
Analyzing polycentric urban development in China: Evidence from intercity knowledge collaboration
DOI:10.18402/resci.2021.05.03
[本文引用: 3]
Against the backdrop of new urbanization and high-quality development, the spatial structure of urban agglomerations and their polycentric development have become a hot issue in urban studies. Based on the publication data of Chinese scholars from 2012 to 2016 derived from the Web of Science (WOS), this research assessed the knowledge morphological polycentricity and functional polycentricity of 19 urban agglomerations in China by employing Taylor’s polycentricity measurement through the lens of scientific knowledge output and knowledge collaboration network. After quantifying and analyzing the development status, this research explored the determinants of polycentric urban development in China and made some policy recommendations for future development. The results show that: (1) There exists an obvious spatial heterogeneity in both knowledge resources distribution and the knowledge collaboration patterns among different urban agglomerations. The polycentric development of urban agglomerations in the east is better than their central and western counterparts. The overall development of morphological and functional polycentricities is consistent. (2) Urban agglomerations can be divided into four categories: Ⅰ. urban agglomerations with both morphologically and functionally polycentric development, which is typical for the Yangtze River Delta urban agglomeration; Ⅱ. urban agglomerations with morphologically monocentric but functionally polycentric development consisting of the Pearl River Delta urban agglomeration; III. urban agglomerations with both morphologically and functionally monocentric development, which is typical for the northern Ningxia urban agglomeration along the Yellow River; IV. urban agglomerations with morphologically polycentric but functionally monocentric development consisting of the Chengdu-Chongqing urban agglomeration. (3) The knowledge polycentric development of China’s urban agglomerations is driven by both market and policies. For urban agglomerations with the development of knowledge morphological monocentricity, emphasis should be put on the scientific planning and layout of knowledge innovation resources; for those with relatively functionally monocentric development, local governments need to break the barriers of knowledge flows and form a diversified collaboration and sharing mechanism.
中国城市群知识多中心发展评价
DOI:10.18402/resci.2021.05.03
[本文引用: 3]
在新型城镇化和高质量发展背景下,城市群的空间结构及其多中心发展成为城市研究的热点议题。本文基于Web of Science(WOS)数据库中国学者2012—2016年的论文发表数据,采用Taylor的多中心性测度,从知识规模和知识网络层面,对中国19个城市群知识形态多中心与功能多中心进行量化,进而分析不同城市群知识多中心的发展状况、原因及对策,主要结论如下:①中国城市群的知识规模分布和知识合作格局均具有较强的空间异质性,东部城市群知识多中心发育优于中西部城市群,城市群形态与功能多中心发展整体匹配度高。②以中国19个城市群知识形态和功能多中心度的平均值为界,可将城市群分为4类:Ⅰ知识形态与功能均相对多中心发展的城市群,以长三角城市群最为典型;Ⅱ知识形态相对单中心但功能相对多中心发展的城市群,如珠三角城市群;Ⅲ知识形态与功能均相对单中心发展的城市群,以宁夏沿黄城市群最为典型;Ⅳ知识形态相对多中心但功能相对单中心发展的城市群,如成渝城市群。③中国城市群知识多中心发展是市场驱动和政策引导共同作用的结果,对于知识形态相对单中心发展的城市群,需重点加强知识创新资源的合理规划与布局;对于知识功能相对单中心发展的城市群,需积极打破知识流通壁垒,形成多元合作共享机制。
The knowledge polycentricity of China's urban agglomerations
Network capital, social capital and knowledge flow: How the nature of inter-organizational networks impacts on innovation
DOI:10.1080/13662716.2012.669615 URL [本文引用: 1]
Functional polycentricity: A formal definition in terms of social network analysis
DOI:10.1080/00420980701518941 URL [本文引用: 2]
Research on technology innovation cooperation network in the middle reaches of Yangtze River urban agglomeration from the perspective of gradient theory
梯度理论视角下的长江中游城市群技术创新合作网络研究
High-quality development assessment and spatial heterogeneity of urban agglomeration in the Yellow River Basin
黄河流域城市群高质量发展评估与空间格局分异
'Buzz-and-pipeline' dynamics in Chinese science: The impact of interurban collaboration linkages on cities' innovation capacity
DOI:10.1080/00343404.2021.1906410 URL [本文引用: 1]
Chinese inter-city innovation networks structure and city innovation capability
DOI:10.11821/dlyj201707009
[本文引用: 1]
In recent years, the emergence of the network paradigm has led to a large and growing body of scholarly research in economic geography focused on analysing the impact of innovation networks structures on knowledge flows and innovation outcomes. From a theoretical perspective, this paper aims to consider the link between networks, knowledge and innovation. Using the notion of 'network capital', whereby networks are considered to potentially offer benefits to network actors in terms of knowledge they are able to access, our paper takes 292 prefecture-level cities as the object, by using Ucinet, ArcGIS. We analyze the inter-city innovation networks structure and measure the innovation networks capital indirectly based on a unique co-patent dataset issued by the State Intellectual Property Office of P.R.China in 2014. The main findings of this study are drawn as follows: (1) The structure of the overall innovation linkages across 292 prefecture-level cities in China features 'small-world' network properties, whereby dense clusters of network actors are linked to other clusters via a relatively small number of bridging links. The city degree distribution of innovation networks is characterized by dissortative, whereby the inter-city innovation networks present a preferential attachment rule when the cities choose their innovation cooperation partners. The results demonstrate that the key nodes of innovation networks and innovative urban agglomerations can effectively improve knowledge spillovers and the value cities gain from networks. (2) The networks structure is diamond-shaped and anchored by four major metropolitan areas (Beijing-Tianjin in the North; Nanjing-Shanghai, East; Guangzhou-Shenzhen, South; Chengdu, West), which reveals a significant spatial heterogeneity. The spatial pattern of city innovation capability is degressive gradient from east to west and the high level innovation cities are in the obviously centralized distribution. The levels of city innovation capability show consistent spatial heterogeneity law with the 'structural network capital', which refers to the advantages accrued based on the structural position of cities within innovation networks. (3) The analysis strongly suggests that the centralities and structural holes of cities within innovation networks are significantly associated with the overall innovation performance of the respective cities at 0.01 confidence level. It is concluded that network structures, and resulting stocks of 'structural network capital', influence city innovation capability, indicating that network capital may be an important indicator of city innovation capability. The results of this study may provide reference for the construction of innovative cities and inter-regional innovation networks.
中国城市创新网络结构与创新能力研究
DOI:10.11821/dlyj201707009
[本文引用: 1]
网络范式的兴起引起了经济地理学者对于同网络结构相关的知识流动和创新产出的关注。基于“网络资本”视角,以国家知识产权局2014年中国292个地级以上城市间合作发明专利信息为原始数据,借助Ucinet、ArcGIS、SPSS等分析工具,刻画中国城市创新网络结构,间接测度创新网络资本,评价城市创新能力,进而对网络资本与城市创新关系进行探讨。研究表明:① 城市创新网络具有小世界特征和择优连接性,培育网络中心城市和创新城市群有益于优化创新网络结构,增加网络资本;② 城市创新网络空间格局呈现京津、宁沪、广深、成都等核心节点构成的菱形结构,城市创新能力空间格局与“结构性网络资本”空间分布较为一致;③ 网络资本与城市创新在0.01的水平上显著相关,据此认为,网络结构以及由此产生的网络结构资本影响城市创新能力。研究结论可为创新型城市建设和跨区域创新网络构建提供一定的参考。
Measuring polycentric urban development in China: An intercity transportation network perspective
DOI:10.1080/00343404.2015.1004535 URL [本文引用: 1]
Spatial evolution and organization of urban agglomeration innovation network: A case study of Beijing-Tianjin-Hebei urban agglomeration
城市群创新网络的空间演化与组织: 以京津冀城市群为例
Coupling process and mechanism of urbanization and innovation in Beijing-Tianjin-Hebei Urban Agglomeration
DOI:10.11821/dlyj020181155
[本文引用: 1]
Urban agglomeration is not only the main form of new urbanization, but also the incubator of innovation. Theoretically, there is a complex interaction between urbanization subsystem and innovation subsystem in urban agglomeration. The Beijing-Tianjin-Hebei urban agglomeration is a national-level urban agglomeration designated by the national new urbanization planning, and it takes "the new engine of national innovation-driven economic growth" as its core function positioning. Therefore, exploring the coupling relationship between urbanization process and innovation and development of Beijing-Tianjin-Hebei urban agglomeration is beneficial to understand the relationship between urbanization and innovation and the development of this urban agglomeration. The comprehensive evaluation index system of urbanization and innovation is constructed by combing the internal theoretical relationship between two subsystems of urbanization and innovation. With the help of coupling coordination degree model and geo-detector factor detection method, this paper analyzes the evolution process and mechanism of coupling coordination relationship between urbanization and innovation in the Beijing-Tianjin-Hebei urban agglomeration. The findings: (1) The comprehensive level of urbanization and innovation in the study area presents a trend of steady growth, and the coupling and coordination relationship between urbanization and innovation also develops in a good direction on the whole, but the comprehensive level and coupling relationship are different in space. Specifically, the gap between the high level of Beijing and Tianjin and the overall low level of 11 cities in Hebei is obvious. (2) The Beijing-Tianjin-Hebei urban agglomeration has been characterized by the coupling coordination type of innovation lag since 2007. Moreover, most of the cities in recent years show the type of coupling coordination of innovation lag, which can be clearly concluded that the main reason for the coupling coordination level of this urban agglomeration in the past period of time is that the innovation level is relatively inadequate to support the urbanization. (3) The interaction between urbanization and innovation in the Beijing-Tianjin-Hebei urban agglomeration is very significant, especially the impact of economic urbanization and social urbanization on innovation, and the impact of innovation resources on urbanization is more prominent. It is also found that the role of innovation ability in promoting urbanization is relatively inadequate during the study period. In the future, the key direction of promoting the coordination level of urbanization and innovation coupling in the Beijing-Tianjin-Hebei urban agglomeration is to accelerate the improvement of urban agglomeration and the comprehensive level of innovation in each city.
京津冀城市群城镇化与创新的耦合过程与机理
DOI:10.11821/dlyj020181155
[本文引用: 1]
城市群是国家新型城镇化的主体形态,也是创新的孵化器;城市群区域的城镇化子系统与创新子系统之间理论上存在复杂交互关系。京津冀城市群是国家新型城镇化规划确定的国家级城市群,并将“全国创新驱动经济增长新引擎”作为其核心功能定位,因此有必要探索京津冀城市群的城镇化过程与创新发展之间的耦合关系,这对理解城镇化与创新之间的关系和京津冀城市群的发展问题都有裨益。通过梳理城镇化与创新两个子系统之间的内在理论关系,构建城镇化与创新的综合评价指标体系,借助耦合协调度模型和地理探测器因子探测方法,分析京津冀城市群城镇化与创新两子系统之间的耦合协调关系演变过程及作用机理。研究发现:① 京津冀城市群城镇化和创新的综合水平都呈现稳步增长的趋势,城镇化与创新的耦合协调关系总体向好的方向发展,但综合水平和耦合关系的空间差异都较大;② 创新滞后是京津冀城市群城镇化与创新耦合协调水平提升的关键阻力,近年京津冀城市群地区及多数城市表现为创新滞后的耦合协调类型;③ 京津冀城市群城镇化与创新的交互影响非常显著,特别是经济城镇化和社会城镇化对创新的影响、创新资源对城镇化的影响表现比较突出。
Innovation linkage network structure and innovation efficiency in urban agglomeration: A case of the Beijing-Tianjin-Hebei, the Yangtze River Delta and the Pearl River Delta
DOI:10.13249/j.cnki.sgs.2020.11.008
[本文引用: 1]
Based on the modified Gravity Model, SNA method, DEA (Data Envelopment Analysis) model and Tobit model, this article analyzes the effect of spatial structure of the innovation linkage network on the innovation efficiency in cities. The main findings of this study are drawn as follows: 1) The innovation linkage showed a radial expansion with the core of Beijing-Tianjin in the Beijing-Tianjin-Hebei (BTH), and a diamond-shaped structure in the Yangtze River Delta (YRD), and in the Pearl River Delta (PRD), the innovation linkage presented a spatial pattern with the cities on both sides of the Pearl River estuary as the core and other cities as important nodes. 2) The innovation linkage network had a polar core development and the innovation linkage highly depended on the core cities in the BTH, but in the YRD and the PRD, the innovation linkage network showed the balanced development from single-center driving to multi-center driving. In addition, the innovation linkage networks in the BTH and PRD were characterized by the ‘small world’. 3) Tobit regression results showed that the central position, betweenness position, occupying capacity of structural holes and agglomeration had different effects on the innovation efficiency in the three urban agglomerations.
城市群创新联系网络结构与创新效率研究: 以京津冀、长三角、珠三角城市群为例
DOI:10.13249/j.cnki.sgs.2020.11.008
[本文引用: 1]
引入修正引力模型、社会网络分析方法、DEA模型以及Tobit模型,探讨2001—2015年京津冀、长三角、珠三角三大城市群的创新联系网络结构对创新效率的影响。研究表明:① 创新联系格局方面,京津冀城市群呈现以“京津”为核心的放射状发展特征,长三角城市群呈现以“Z”字形为主轴的类钻石型空间格局,珠三角城市群形成了以珠江口两侧城市为核心、其他城市为重要节点的空间格局;② 在创新联系网络结构特征方面,京津冀城市群呈极核式发展,群内创新联系高度依赖于核心城市,长三角和珠三角城市群由单中心驱动转变为多中心驱动,呈均衡发展特征,京津冀和珠三角城市群创新联系网络具有“小世界”网络特征;③ Tobit模型回归结果显示,三大城市群中,城市节点在城市群创新联系网络中的中心位置、中介地位、对结构洞的运用能力和集聚程度对其创新效率的影响存在差异。
Connectivity characteristics for city networks in China based on innovative enterprises
DOI:10.11821/dlxb202104005
[本文引用: 2]
Improving the connectivity of multi-sector enterprises at a cross-regional level can enhance knowledge and technology transfer and stimulate innovation and synergies among cities. Therefore, the study of city networks, which comprise a large number of multi-sector enterprises, can provide an important knowledge base for innovation and development at the regional and national levels. Based on an evaluation of innovative enterprises in China by authoritative institutions, data were collected on 1778 multi-sector enterprises, which included details on the headquarters, the branches (a total of 30,625) and the locations. A city-based network for the country was established, using the data for the multi-sector linkages and a model for the headquarters-branches, to explore the network connectivity characteristics via social network analysis, the GIS method and the spatial interactive model. The results showed that (1) although the network covered 353 cities across China, the spatial distribution of the network was extremely uneven. For instance, a diamond-shaped connectivity pattern emerged gradually as the network hierarchy decreased. The Beijing-Tianjin-Hebei region, the Yangtze River Delta and the Pearl River Delta were found to be the three key hubs of the network. (2) The intercity linkages between innovative enterprise sectors (innovative enterprise flows), had a clear administrative center and a provincial boundary effect. Moreover, the innovative enterprises were strongly attracted to the municipalities and provincial capitals. Beijing was at the heart of the network, followed by Shanghai and Shenzhen. (3) Differences existed in regional connectivity. There was a striking difference between the eastern region and the central-western region. The former had a high connectivity with respect to both the internal and the external networks, while the latter had lower connectivity for the internal network but a higher connectivity at the external level. At the same time, although the network structures for all the three eastern megalopolises showed strong cohesion, their connectivity characteristics were quite different. (4) The input and output of innovative enterprise flows were to varying degrees influenced by the indicator attributes for each city, and these in turn were related to the administrative hierarchy, the economic strength and the innovative environment of the region, as well as proximity indicators, which were related to geographical, technological and institutional factors. Foreign capital was not conducive to innovative enterprise flows and to the formation of innovative intercity company-based networks in China.
基于创新企业的中国城市网络联系特征
DOI:10.11821/dlxb202104005
[本文引用: 2]
多部门创新企业的跨城布局能够增进城市间的知识流动与创新联系,大量创新企业部门关联构成的城市网络是理解国家创新格局的重要认知基础。本文运用1778家国家级创新企业部门关联数据和“总部—分支机构”方法建立中国城市间有向关系矩阵,借助社会网络分析、GIS技术及空间交互模型方法,对创新企业建构的中国城市网络联系特征进行分析。结果发现:① 基于创新企业的中国城市网络联系覆盖广但极不均质,菱形联系格局在次级网络中逐步显现,京津冀、长三角和珠三角城市群是网络联系的核心枢纽。② 城市间创新企业流具有明显的行政中心指向特征与省级边界效应,直辖市及省会城市对创新企业流具有较强吸引力,北京是网络联系最强核心,上海和深圳次之。③ 城市网络区域异质性突出,东部区域“内联外控”与中、西部区域“内弱外强”的联系格局呈现鲜明对比,东部区域内沿海三大城市群网络的联系结构也存在较大差异。④ 城市的行政等级、经济水平和创新环境等属性指标,以及城市间地理、技术、制度的邻近性关系指标,都对城市吸收和输出创新企业流产生了不同程度的影响,外资并不利于促进中国城际创新企业流和网络的形成。
Innovation-based urbanization: Evidence from 270 cities at the prefecture level or above in China
DOI:10.11821/dlxb201810007
[本文引用: 2]
With the rapid development of knowledge economy, great changes have been taking place in urbanization pattern across the world in the current conjuncture. Considering the fact that traditional urbanization theory is hard to interpret these changes, innovation is the core concept to explain the phenomenon of the new urbanization dynamics. As one of important contents of urban geography, in the perspective of space of flows, urbanization dynamics needs to turn from research on the population flow between rural and urban research to studies on high skilled migrants flow among cities and regions. Against this background, we propose a conception of innovation-based urbanization, and use it to describe the effect of high skilled migrants and cultural diversity on urban innovation in China. Based on the sixth census data of 270 cities in China in 2010, our study calculates the index of cultural diversity of each city, and analyses the spatial structure of high skilled migrants and cultural diversity in China. Then this study measures the extent to which high skilled migrants and cultural diversity increase urban innovation, with a method of spatial regression analysis. Conceptual and empirical contributions are also compared to previous studies. The results are obtained as follows: (1) The migration of highly skilled to cities, which changes urban function and landscape and extends the knowledge activities and behaviors, is emphasized by innovation-based urbanization conception, which responds to the development of knowledge-based economy, providing a good explanation of new dynamics, new mechanism of urban development and new urban innovation landscape. (2) Innovation-based urbanization is the important driving force for Chinese urban development, especially for eastern coastal areas and provincial capital cities. (3) Highly skilled migrants and cultural diversity do have demonstrated positive effect on urban innovation output. A ten percent increase in the number of urban highly skilled migrants and the index of cultural diversity direct increase respectively urban patents by 3% and 2%. The conclusions could deepen the understanding of openness and dynamics of regional innovation system and help to improve decision-making ability on urbanization planning, promoting urban innovation and development.
基于创新的城市化: 中国270个地级及以上城市数据的实证分析
DOI:10.11821/dlxb201810007
[本文引用: 2]
传统城市化概念已难以解释全球范围内出现的新兴城市化模式,而“创新”是解读城市化新变化的重要概念。从“流的空间”视角,提出了基于创新的城市化概念。在此基础上,选取中国地级及以上270个城市作为研究的空间单元,依据第六次全国人口普查资料,分析了中国高技能迁移人口和城市文化多元性的空间分布特征,采用空间杜宾模型方法,构建城市创新空间回归模型,测度了中国高技能迁移人口规模和城市文化多元性水平对城市创新产出的影响,验证了基于创新的城市化概念。研究表明:① 基于创新的城市化概念顺应知识经济发展的背景,强调高技能劳动力向城市的迁移过程,促进城市职能与景观发生变化,城市知识活动与行为的扩展,可以很好的解释城市发展的新动力、新机制和新的创新景观。② 基于高技能劳动力迁移的创新的城市化是城市发展的重要动力,对中国的沿海及省会城市的城市化发展有重要作用。③ 中国国内高技能劳动力迁移规模和城市文化多元性水平均对城市创新产出具有正效应。在其他条件不变的情形下,城市高技能迁移人口数量每增加10%,直接带来的城市创新产出增加3%;城市文化多元性水平每提高10%,直接带来的城市创新产出增加2%。研究在理论上加深了对区域创新系统开放性和动态性的理解与认识,为知识经济下城市化和城市发展政策的制定提供了重要理论依据。
Network linkages and local embeddedness of foreign ventures in China: The case of Suzhou municipality
DOI:10.1080/00343404.2013.770139 URL [本文引用: 2]
The role of multinational corporations in metropolitan innovation systems: Empirical evidence from Europe and Southeast Asia
DOI:10.1068/a3733 URL [本文引用: 1]
Spatial structure change and influencing factors of city clusters in China: From monocentric to polycentric based on population distribution
DOI:10.18306/dlkxjz.2017.10.011
[本文引用: 1]
With the significant increase of social and economic interactions among constituent cities, city clusters have become the most striking geographic phenomenon in the twenty-first century. In the latest regional development strategy, city clusters have been positioned as the main spatial carriers of socioeconomic activities by the Chinese government. Although an increasing number of scholars has described the characteristics and proposed definitions of city clusters, there have been surprisingly few studies on the morphological change and influencing factors of city clusters' spatial structure based on population data. In most existing empirical studies on city cluster, instead of permanent resident population, registered household (hukou) population was used to measure city clusters' spatial structure and this introduces error. Hence, in this study we used two different sources of data-permanent resident population from the Chinese Census, and population of urban agglomerations released by the United Nations population division. Our sample is comprised of 13 city clusters.. Rank-size rule was applied to measure the morphological characteristics. The principal objective of this study is to examine the change and influencing factors of the spatial structure of Chinese city clusters. Our descriptive statistics show that there was a clear tendency towards polycentricity of city clusters during 1990-2010. Using two panel data analysis techniques (FE and FGLS) and different databases, we found that all else being equal, the spatial polycentricity of the city clusters is mainly associated with the increases of GDP per capita and population size. Most city clusters are in the stage of polycentricity, and only a few remain in the earlier monocentric stage. These findings have important policy implications for the development of urban clusters. For most city clusters with a polycentric tendency, the governments should promote integration within city clusters through transportation and regional coordination policies that strengthen the exchange of production factors and improve economic performance. For the few city clusters of monocentricity, however, the governments should avoid introducing polycentricity oriented policies too soon, which could be harmful to their economic performance. Due to methodological and data limitations, the endogenous problem between spatial structure and economic development is difficult to solve. The spatial structure of city clusters can be regarded as both a cause and a consequence of economic development. Hence, this two-way relationship might be correlative rather than causal. Further work should push forward in this regard to identify the real cause-effect. In addition, an increasing literature uses economic and transportation data to analyze city clusters from the perspective of functional linkage. This represents another direction that future research should focus on.
中国城市群空间结构的演化与影响因素: 基于人口分布的形态单中心: 多中心视角
DOI:10.18306/dlkxjz.2017.10.011
[本文引用: 1]
城市群是未来中国城镇化的主要空间载体,研究城市群空间结构的演化特征和影响因素具有重要意义。已有文献较少从形态单中心—多中心视角研究中国城市群空间结构的演化和影响因素,而且通常采用户籍人口而非常住人口测度城市群空间结构,导致测量误差。为解决这个问题,本文采用基于人口普查的常住人口数据进行分析,并运用联合国数据对结果进行佐证。以已有文献采用客观标准界定的13个城市群为样本,使用规模-位序法则测度城市群的形态单中心—多中心程度,探究城市群的空间结构演化趋势和影响因素。结果发现,1980年代以来大多数城市群的空间结构呈现多中心化趋势;人均GDP水平的提高和人口规模的增加是导致城市群空间结构多中心化的主要原因。因此,政府对于空间结构偏多中心的城市群,应强化城市间的交通联系和政策一体化,获取更大的发展红利;对于个别处于单中心化阶段的城市群,政策导向则避免过早地多中心化。
