

1 引言
现有文献已对传统基础设施布局特征进行深入探讨,主要集中在两个方面:① 基础设施的空间布局及演化特征。侧重于对机场[15-16]、港口[17-18]、高铁站点[19]以及物流节点[20]等交通基础设施的空间布局及演化特征,如中国机场布局形成以东部地区和西部地区为重点的“鞍型”结构[15],集装箱港口则形成了以深圳、上海、青岛、天津、大连为中心的五大集装箱港口群[18]。② 基础设施空间布局影响因素及原则。经济发展水平、技术条件以及自然条件是决定基础设施空间布局的重要因素[1,17,21⇓ -23]。此外,不同类型基础设施布局的影响因素存在异质性。如机场布局的主要影响因素为政治、经济、人口、旅游等社会经济要素[24];港口布局的首要影响因素为水文、泊位、洋流等自然本底条件[17];铁路、公路等线状交通基础设施布局的主要影响因素为沿线的人口、经济和能源等分布[19];而输变电基础设施布局需考虑能源消费地和能源生产地[25]。对于新型基础设施而言,空间布局及空间效应的研究仍处于起步阶段[13,26]。如梁春等[27]和刘文凤[28]以青岛市为例,通过分析其5G通信基站建设的现状与存在问题,从规划理念、建设模式、布局方法和建设管控等方面探索5G通信基站空间布局规划方案。目前对新型基础设施空间布局原则及影响因素的关注较为缺乏。
与传统基础设施相比,数据中心布局对经济发展和技术本底的要求更高,其运营和维护对自动化与虚拟化、信息安全、信息管理等方面专业技术人才的需求多[32],对电力等能源需求较大,因此两者布局特征及影响因素必然存在差异。对数据中心布局关注的缺失,容易导致其布局缺乏理论基础和科学依据。准确揭示数据中心空间布局模式及影响因素将对数字经济发展背景下地方营造新区位、把握经济发展新机遇具有关键作用。鉴于此,本文比较了数据中心与传统基础设施的特征差异,在传统基础设施布局原则的基础上提出数据中心布局原则,揭示中国数据中心空间格局,剖析影响因素并总结布局模式,以试图为数据中心科学选址以及优化布局提供建议和指导。
2 数据中心概念与布局原则
2.1 概念与类型
数据中心指的是海量数据信息集中处理、保存、传输、交换和管理的计算资源、存储资源、网络资源及其物理空间[33]。2020年中共中央国务院印发的《关于新时代加快完善社会主义市场经济体制的意见》中将数据作为一种新的生产要素,提升到与土地、劳动力、资本、技术同等的重要地位,并把推动数据开放共享作为加快培育数据要素市场的重要任务。在海量信息时代,大数据中心或将成为中国在全球价值链中向上发展的关键。目前,中国已建成7家国家级超级计算中心,分别位于天津、深圳、长沙、济南、广州、无锡和郑州。根据数据中心规模,可分为中小型数据中心(规模小于3000个标准机架,以功率2.5 kw为一个标准机架)、大型数据中心(规模大于3000个标准机架但小于10000个标准机架)和超大型数据中心(规模大于10000个标准机架)。本文选取大型以上数据中心为研究对象,原因有两点:① 很多中小型数据中心多布局于单位和企业内部,服务于单位和企业内部[34],而大型以上数据中心为多个企业服务,对社会经济发展的作用和影响更大;② 中小型数据中心规模小,布局较为灵活,而大型和超大型数据中心规模大、能耗高,空间布局的制约因素更为复杂。
2.2 布局原则
在传统基础设施空间布局原则的基础上,并依据数据中心特征,本文提出数据中心布局原则,具体如图1所示。
图1
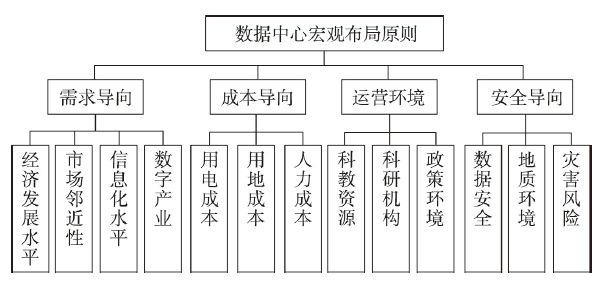
(2)成本导向。数据中心属于高耗电设施,2018年中国数据中心机架数总计约为271.06万个,耗电量为1608.89亿kW·h,占全社会用电量的2.35%[37],超过了上海、贵州、江西、陕西、甘肃、北京、重庆、宁夏、天津和黑龙江等14个省区单独的全社会用电量。随着数据中心数量和规模的不断增加,电力需求将持续攀升,低廉的用电成本是数据中心宏观区位选择中需要考虑的重要条件[38-39]。数据中心发热量大,且其制冷系统的电力消耗占数据中心总能耗的比重高达40%[40]。而低温环境或其他天然散热条件可有效减少数据中心的用电量[41],从而减少用电成本。鉴于数据中心的运营和维护对专业技术人才的需求量大,人力成本也是数据中心需要考虑的重要成本条件之一。相比于传统基础设施,用电成本和人力成本对数据中心宏观布局的影响较大。此外,与传统基础设施布局原则一致,用地成本也是数据中心布局的重要影响因素。
(4)安全导向。数据中心是存储大规模数据的载体,数据安全是影响其布局及规模设计所需考虑的重要因素之一。因此,数据中心机架在空间中呈现一定的分散分布态势。当然,与传统基础设施布局一致,地质稳定和灾害低发也是数据中心布局的重要基础。
3 数据中心发展过程与空间布局
本文研究区域为中国(暂未含港澳台地区)。数据中心的相关信息来源于2017年发布的《全国数据中心应用发展指引》,该报告详细记录了大型以上数据中心的可用机架数、类型、名称、所在省(自治区、直辖市)、所在城市、地址、运营主体、设计电源使用效率(Power Usage Effectiveness, PUE)等信息。
3.1 发展阶段与政策环境变化
中国数据中心的发展过程可分为4个阶段:起步期、雏形期、成长期和加速期[35]。1959年中国第一台大型通用电子计算机104在北京诞生,有22个机柜,占地约400 m2,是中国最早的“数据中心”,也标志着中国数据中心发展进入了起步阶段。因机房缺乏严格的建设标准,尚未有精密的温度控制和指标测试等措施,计算机稳定工作时间仅有几十分钟到几小时。20世纪70—80年代为中国数据中心发展的雏形期,此阶段的数据中心以服务于国防、科研和军事等方面为主,机房形式与起步期类似。20世纪90年代—21世纪初为中国数据中心的成长期,数据中心应用不断普及,企业数据中心(Enterprise Data Center, EDC)和互联网数据中心(Internet Data Center, IDC)等开始出现,设备不断微型化并开始大量共用网络设备。21世纪以来,尤其是2010年后,中国数据中心规模进入快速发展阶段,数据中心开始升级为云数据中心,各行业对数据中心需求增加,数据中心数量不断增加,且单体规模不断增大(图2)。
图2
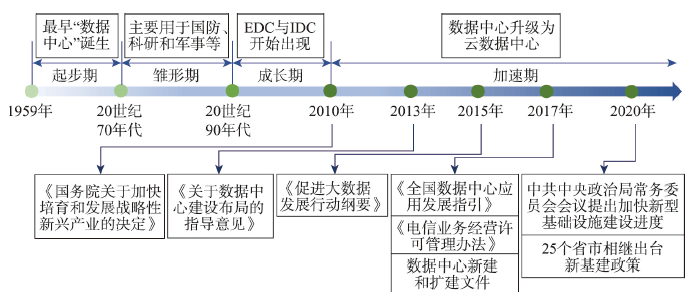
图2
数据中心的发展阶段与政策环境变化
Fig. 2
Development stage and policy environment of data center in China
历经60多年的发展和建设,中国数据中心发展的政策制度不断完善。2010年国务院发布《国务院关于加快培育和发展战略性新兴产业的决定》,明确提出“促进物联网、云计算的研发和示范应用”。数据中心作为战略性新兴产业发展的重要基础设施,逐步受到重视。2013年工业与信息化部首次发布了《关于数据中心建设布局指导意见》,标志着新一轮数据中心快速布局的开始。2015年国家发展和改革委员会出台《促进大数据发展行动纲要》,为数据中心建设提供了指引。2017年工业与信息化部印发《全国数据中心应用发展指引》,并在此后逐年发布。此外,还颁布了《电信业务经营许可管理办法》,以促进数据中心的建设与布局。但因数据中心存在能耗大和碳排放量高等问题,2017年后北京、上海、深圳等中心城市陆续出台禁止新建和扩建数据中心的相关文件,超大型数据中心在中心城市的布局受到限制。2020年3月4日,中共中央政治局常务委员会召开会议,明确提出“要加快5G网络、数据中心等新型基础设施建设进度”,明确了新基建建设是国家需求。截至2020年底,全国共25个省市相继出台推动数据中心等新型基础设施建设的政策[35]。受政策环境变化的影响,中国数据中心的数量及规模呈现一定变化趋势,2016—2019年中国数据中心数量和规模均不断增加。受政策的影响,2017年后超大型数据中心在中心城市的布局受到限制。但鉴于用户对数据中心的需求具有一定的时延要求,用户需求仍是影响数据中心布局的关键因素,因此大型数据中心逐渐演变为主导类型(图3)。
图3
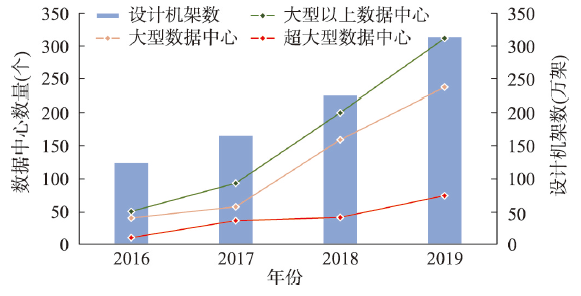
图3
2016—2019年中国大型以上数据中心数量及其设计机架数变化
Fig. 3
Number of big data centers and designed racks in China from 2016 to 2019
3.2 空间布局及演化
数据中心空间分布呈现明显的聚集性。2016—2019年大数据中心数量和可用机架数分布的基尼系数均大于0.9(表1)。此外,超大型数据中心的空间聚集程度略大于大型数据中心,这可能因为超大型数据中心运营和维护过程中对成本和技术等方面的要求高,更倾向于集中布局。
表1 2016—2019年中国数据中心分布的基尼系数
Tab. 1
| 2016年 | 2017年 | 2018年 | 2019年 | |
|---|---|---|---|---|
| 数据中心总量 | 0.967 | 0.948 | 0.947 | 0.944 |
| 大型数据中心数量 | 0.970 | 0.962 | 0.956 | 0.951 |
| 超大型数据中心数量 | 0.991 | 0.959 | 0.959 | 0.951 |
| 可用机架总数 | 0.975 | 0.957 | 0.952 | 0.947 |
| 大型数据中心可用机架数 | 0.975 | 0.968 | 0.960 | 0.955 |
| 超大型数据中心可用机架数 | 0.996 | 0.969 | 0.976 | 0.955 |
数据中心向周边地区的溢出效应明显。全国已形成以京津冀、长三角、珠三角和成渝城市群为核心的空间结构(图4)。2016年大型及以上数据中心主要集中在北京和上海两个城市,超大型数据中心主要布局在北京。依托能源配套、气候条件、成本、需求等方面的优势,贵州省贵阳市和新疆维吾尔自治区克拉玛依市也成为数据中心聚集地。随着计算需求不断增加,现有数据中心容量已无法满足需求,且部分中心城市对数据中心的能耗、碳排放量等指标严格限定和准入标准提高,由此数据中心的布局逐渐由北京、上海等向周边城市扩散,如河北省廊坊市和内蒙古自治区呼和浩特市等。与此同时,深圳、重庆和成都等经济发达城市对数据中心需求明显增加,成长为新的增长极。2017年后,贵阳和克拉玛依的大型及以上数据中心在全国的占比明显下降,原因为两地远离中心城市,仅可承接对网络时延要求较低的业务需求,而对网络时延要求较高业务的服务能力有限。此外,受中心城市对数据中心新建和扩建等方面的限制,中心城市的周边地区逐渐布局超大型数据中心,以承接北京、上海、深圳等中心城市的部分应用需求,但在现阶段发展仍相对较慢(图1)。
图4
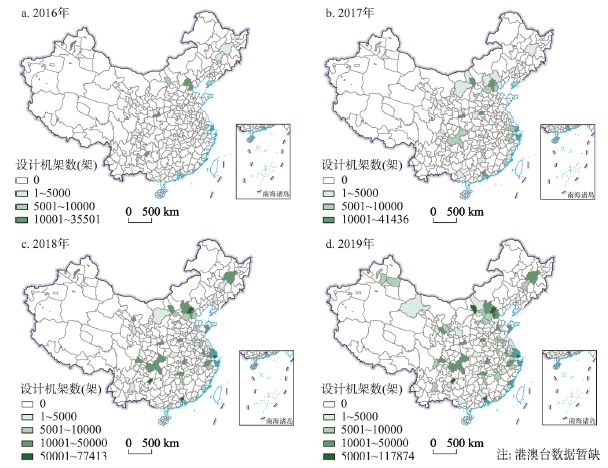
图4
2016—2019年中国数据中心设计机架的空间布局演变
注:基于自然资源部标准地图服务网站审图号为GS(2019)1827号的标准地图制作,底图边界无修改。
Fig. 4
Distribution of data center racks in China from 2016 to 2019
4 数据中心宏观布局影响因素及模式演变
4.1 变量及模型选取
基于数据中心的宏观布局原则,本文从需求导向、成本导向、运营环境和安全导向4个方面构建了影响数据中心宏观布局的指标体系,相关指标含义及其统计特征如表2所示。需要说明的是,受制于数据可获取性,未能获取到合适指标来反映数据安全;地质灾害和环境灾害为省级层面的数据,并按面积将其分配到城市,而其余数据均为地级市尺度。
表2 指标体系构建及统计描述
Tab. 2
| 原则 | 一级指标 | 二级指标 | 二级指标含义 | 最小值 | 最大值 |
|---|---|---|---|---|---|
| 需求导向 | 经济发展水平 | 人均GDP | 人均GDP(万元) | 1.5 | 20.3 |
| 市场邻近性 | 区位条件 | 与北上广成渝的最短距离(km) | 0 | 2313.4 | |
| 交通环境 | 高铁站和机场数量(个) | 0 | 4 | ||
| 信息化水平 | 互联网发展 | 互联网接入用户数(万户) | 0 | 1372 | |
| 电信业发展 | 移动电话用户数(万户) | 0 | 4020 | ||
| 数字产业 | 高技术企业 | 高技术企业数量(个) | 5 | 20977 | |
| 金融业规模 | 金融业从业人员数量(人) | 1486 | 859131 | ||
| 信息传输、计算机服务和软件业规模 | 信息传输、计算机服务和软件业从业人员数量(人) | 192 | 644776 | ||
| 成本导向 | 用电成本 | 电价 | 发电企业平均上网电价(元/kW·h) | 0.26 | 0.45 |
| 温度 | 年平均气温(℃) | 5.9 | 25.8 | ||
| 降水 | 降水量(mm/年) | 226.9 | 2459.3 | ||
| 用地成本 | 土地价格 | 国有建设用地出让价格(万元/hm2) | |||
| 人力成本 | 人均收入水平 | 在岗职工年平均工资(万元) | 4.5 | 17.3 | |
| 运营环境 | 科教资源 | 高校数量 | 高等学校数量(所) | 0 | 93 |
| 双一流高校数量 | 双一流高校数量(所) | 0 | 34 | ||
| 高学历人才 | 大学生数量(万人) | 0 | 105.7 | ||
| 科研机构 | 国家重点实验室 | 国家重点实验室数量(个) | 0 | 82 | |
| 科研投入 | R&D内部经费支出(万元) | 0 | 2233.6 | ||
| 政策环境 | 布局政策 | 是否有数据中心准入标准(1: 有;0: 无) | |||
| 安全导向 | 数据安全 | - | - | - | - |
| 地质环境 | 地质灾害 | 地震、滑坡等灾害数量(起/年) | 3 | 21640 | |
| 灾害风险 | 环境灾害 | 台风、洪水等灾害面积(万hm2/年) | 196.8 | 1650.1 |
注:平均上网电价=售电收入/上网电量×1.17,含税。
式中:
4.2 结果分析
本文分别以2016年、2017年、2018年和2019年4个年份为截面构建Tobit模型,揭示数据中心宏观空间布局影响因素的演变。建立Tobit模型前,首先分别对模型的变量进行多重共线性检验,发现金融业发展、信息传输、计算机服务和软件业发展、电信业发展、双一流高校数量和高学历人才的方差膨胀因子(VIF)大于10,模型存在严重多重共线性,故将此变量剔除。此后,模型通过共线性检验(VIF < 5)。因部分城市的影响指标数据无法获取且均无数据中心布局,仅289个城市被纳入回归模型。
模型结果在99%的置信水平上均显著,结果如表3所示。2016—2019年人均GDP、高技术企业和互联网发展3个指标对数据中心宏观布局具有显著的正向影响,表明数据中心宏观布局始终呈现明显的需求导向。用户的数据服务需求通常对网络时延具有一定的要求,鉴于空间距离是影响网络时延的重要因素之一,靠近市场需求是数据中心宏观布局所需考虑的重要因素。经济发展和信息化水平对数据中心宏观布局的影响系数远大于高技术企业,原因可能为数据中心服务不仅为高技术行业的需求,也已深入到其他行业。2017年后,区位条件对其宏观布局具有显著负向影响。原因可能在于,2016年数据中心主要集中在北京、上海、贵阳和克拉玛依等城市,区位较为多元。随着数据中心的不断建设,贵阳和克拉玛依等偏远城市的数据中心数量占比明显下降,区位条件开始对数据中心宏观布局产生负向影响,即与京津冀、长三角、珠三角和成渝城市群的距离越短,越容易吸引数据中心布局。用地成本对数据中心宏观布局具有显著的负向影响,表明2017年后数据中心布局开始呈现出明显的用地成本导向。人力成本对数据中心宏观布局始终具有显著的正向作用。原因可能在于,数据中心系统复杂,对具有专业技术专长的高科技人才需求量较大,而高科技人才的工资通常较高。充足人才供给容易吸引数据中心宏观布局。作为人才培养的重要载体,高等学校布局一直对数据中心宏观布局具有显著的正向作用。此外,城市数据中心准入政策对数据中心宏观布局也存在显著正向作用。这个结论是合理的,原因可能在于:数据中心的碳排放量高,自2017年起北京、上海、深圳等经济发达城市设置了数据中心准入标准,限制超大规模和高能耗数据中心的布局。尽管如此,受市场需求等因素的影响,以上大城市的数据中心机架数仍然规模较大。这与数据中心主要布局在经济发达城市的现象一致,并且符合全球数据中心宏观布局趋势[28]。
表3 2016—2019年Tobit回归模型结果
Tab. 3
| 一级指标 | 二级指标 | 2016年 | 2017年 | 2018年 | 2019年 | |
|---|---|---|---|---|---|---|
| 需求导向 | 经济发展水平 | 人均GDP | 414.0** | 348.5*** | 871.3** | 119.7** |
| 市场邻近性 | 区位条件 | -0.7 | -3.6** | -7.0** | -15.4** | |
| 交通环境 | 1.2 | 2.0 | 12.5 | 10.6 | ||
| 信息化水平 | 互联网发展 | 2.8* | 5.7** | 23.2** | 1.1** | |
| 数字产业 | 高技术企业 | 0.2* | 0.2* | 0.1* | 7.3* | |
| 成本导向 | 用电成本 | 电价 | -2.0 | -1.9 | -2.6 | -7.1 |
| 温度 | -2.3 | -2.5 | -0.3 | -0.3 | ||
| 降水 | -0.4 | -0.2 | -0.1 | -0.5 | ||
| 用地成本 | 土地价格 | -0.1 | -0.1** | 0.9** | 0.4** | |
| 人力成本 | 人均收入水平 | 0.1** | 0.1*** | 0.2*** | 5.4*** | |
| 运营环境 | 科教资源 | 高校数量 | 1.2** | 1.5*** | 3.7*** | 1.5*** |
| 科研机构 | 国家重点实验室 | 1.9 | 4.5 | 2.4 | 15.3 | |
| 科研投入 | 0.1 | 0.0 | 0.0 | 0.0 | ||
| 政策环境 | 布局政策 | - | 2.9*** | 5.8** | 24.6** | |
| 安全导向 | 地质环境 | 地质灾害 | -0.0 | -0.0 | -0.1 | -0.1 |
| 灾害风险 | 环境灾害 | -0.1 | -0.1 | -0.1 | -0.1 | |
| 样本量 | 289 | 289 | 289 | 289 | ||
| 对数似然值 | -459.4 | -705.6 | -771.4 | -900.2 | ||
| Likelihood ratio Chi2 (df.) | 117.8*** | 170.3*** | 148.3*** | 179.5*** | ||
注:*、**、***分别表示在0.1、0.05、0.01的水平(双侧)上显著。
现阶段电价对数据中心宏观布局影响不显著。原因可能在于,各城市电力定价受发电原动力、用途、输电成本等多重因素的影响,电费定价通常以省级行政区为基本单元,与用电类型密切相关,中心城市与其周边地区电价基本一致。与此同时,温度和降水两个影响用电量的指标对数据中心宏观布局影响不显著。中国数据中心布局形成了以京津冀、长三角、珠三角和成渝城市群为核心的空间结构,四大城市群在温度和降水方面均存在较大差异,这可能是温度和降水对数据中心宏观布局影响不显著的主要原因之一。此外,交通环境、国家重点实验室、科研投入、地质灾害和环境灾害也尚未成为现阶段数据中心宏观布局考虑的关键因素。
4.3 稳健性检验
为检验模型的稳健性,进一步以各城市数据中心数量为因变量,指标体系中变量为自变量构建Tobit回归模型,揭示数据中心宏观空间布局影响因素及其变化。结果显示(表4),2016—2019年人均GDP、高技术企业、互联网发展和高校数量对数据中心宏观布局具有显著的正向影响。2017年后,区位条件均对其宏观布局具有显著的负向影响,而布局政策和用地成本均存在正向影响。此外,交通环境、温度、降水、国家重点实验室、科研投入、地质灾害和环境灾害对数据中心宏观布局的影响不显著。模型结果与以数据中心设计机架数为因变量模型的结果呈现较强的一致性,表明模型稳健性较好。
表4 稳健性检验
Tab. 4
| 一级指标 | 二级指标 | 2016年 | 2017年 | 2018年 | 2019年 | |
|---|---|---|---|---|---|---|
| 需求导向 | 经济发展水平 | 人均GDP | 1.0** | 0.08** | 0.09** | 0.07** |
| 市场邻近性 | 区位条件 | -0.01 | -0.01* | -0.09** | -0.02** | |
| 交通环境 | 0.23 | 0.12 | 0.15 | 0.37 | ||
| 信息化水平 | 互联网发展 | 0.09* | 0.02** | 0.03** | 0.02** | |
| 数字产业 | 高技术企业 | 0.01* | 0.01* | 0.01* | 0.04* | |
| 成本导向 | 用电成本 | 电价 | -1.23 | -7.13 | -3.7 | -15.8 |
| 温度 | -0.15 | -0.06 | -0.08 | -0.23 | ||
| 降水 | -0.04 | -0.03 | -0.01 | -0.01 | ||
| 用地成本 | 土地价格 | -0.07 | -0.02** | 0.06** | 0.01** | |
| 人力成本 | 人均收入水平 | 0.03** | 0.02** | 0.04** | 0.09** | |
| 运营环境 | 科教资源 | 高校数量 | 0.05** | 0.04** | 0.05** | 0.11** |
| 科研机构 | 国家重点实验室 | 0.03 | 0.03 | 0.06 | 0.09 | |
| 科研投入 | 0.00 | 0.0 | 0.0 | 0.0 | ||
| 政策环境 | 布局政策 | - | 1.9** | 3.4** | 3.07** | |
| 安全导向 | 地质环境 | 地质灾害 | -0.00 | -0.00 | -0.00 | -0.1 |
| 灾害风险 | 环境灾害 | -0.06 | -0.01 | -0.03 | -0.1 | |
| 样本量 | 289 | 289 | 289 | 289 | ||
| 对数似然值 | -96.32 | -143.86 | -212.15 | -265.71 | ||
| Likelihood ratio Chi2 (df.) | 83.91*** | 124.90*** | 179.98*** | 198.02*** | ||
注:*、**、***分别表示在0.1、0.05、0.01的水平(双侧)上显著。
4.4 数据中心宏观布局模式演变
数据中心具备运算、存储等多种功能,其应用已渗透入各行各业。且不同业务类型和功能需求对其安全、时延、容量的要求存在差异,如金融行业主要使用数据中心进行数据存储,重点考虑数据中心安全性和容量,且对数据中心网络时延要求较低;互联网行业中需要进行大规模数据运算的业务对数据中心的网络时延要求较高,而其存储业务对网络时延要求较低。根据数据中心空间布局特征及影响因素,可总结出现阶段中国数据中心呈现出3种布局模式:① 需求导向型,指靠近市场需求的数据中心,是中国早期数据中心宏观布局的主要模式之一。随着产业数字化和信息化的升级改造,数据服务总量不断增加,需求导向型的内涵也由早期的数据服务需求演变为网络时延要求高的业务需求。例如北京、上海、广州、深圳等发达城市的数据中心主要承载运算功能,对网络时延要求较高,因此在空间上靠近需求市场。此外,中国石油数据中心(克拉玛依)服务于中国石油各驻疆企业,也表现为市场需求导向型的布局模式。② 成本导向型,指以节约数据中心运营成本为目的的数据中心选址。现阶段中国数据中心宏观布局以人力成本和用地成本导向为主,此类数据中心主要服务于数据存储,对网络时延要求较低,倾向于布局在电力、土地等成本较低的地区,如贵州海拔高、气温低,具备数据中心设备散热的天然条件,用电成本和用地成本均相对较低,有利于降低运营成本。但由于数据中心的运营和维护需要大量具备专业技术人才,此类人才工资普遍较高,因此数据中心倾向于布局在人力成本相对较高的城市。③ 需求—成本—运营环境综合导向型,指综合考虑市场需求、成本和运营环境而布局的数据中心。此类数据中心通常布局在中心城市的周边,如内蒙古自治区乌兰察布市、河北省张家口市和廊坊市,可承接北京对数据中心的需求,同时其用地成本低,运营成本较低。此外,以上城市不存在数据中心限制准入政策,为数据中心运营提供良好的政策环境。综合导向型数据中心主要服务于对网络时延要求一般的客户需求,是疏导经济发达城市数据中心需求的重要手段。随着数据中心的不断建设和网络质量的不断提升,中国数据中心布局逐渐由需求导向型转变为需求导向型、成本导向型和需求—成本—运营环境综合导向型等多元布局模式。
5 讨论与结论
数据中心具备基础设施的基本功能,与传统基础设施的功能既有相似性又有差异性。它是支撑社会数字化和信息化转型的关键基础设施,通过促进创新要素聚集,以“新经济”形式成为推动国民经济高质量发展的新动力。相比于传统基础设施,数据中心布局对区域的经济发展、技术本底要求更高,对软件设计、信息安全和信息管理等方面技术人才需求较多,对电力能源需求高,因此布局原则存在异质性。本文基于数据中心与传统基础设施的特征差异,在传统基础设施布局原则的基础上提出数据中心宏观布局原则,揭示中国数据中心宏观布局的空间特征,进一步剖析影响因素并总结布局模式,主要得出以下结论:
① 数据中心宏观布局应遵循需求导向、成本导向、运营环境和安全导向四大原则。② 现阶段中国数据中心布局呈现以京津冀、长三角、珠三角和成渝城市群为核心的空间格局。③ 以经济发展水平、信息化水平和数字产业为代表的市场需求对中国数据中心宏观布局始终存在显著的正向影响,人力成本和高校数量同样对其宏观布局同样存在显著正向影响。随着数据中心不断建设,区位条件、用地成本和布局政策均对数据中心宏观布局的影响逐渐显现。④ 数据中心宏观布局表现为需求导向型、成本导向型和需求—成本—运营环境综合导向型3种模式。早期数据中心宏观布局以需求导向为主,并不断向需求导向、成本导向型和需求—成本—运营环境综合导向型多种模式演变,分别服务于网络时延要求高、时延要求低和时延要求中等的用户需求。这有利于在满足用户需求的同时尽可能的降低数据中心运营成本,实现绿色发展和可持续发展。
本文首次探讨了中国数据中心空间布局模式,具有一定的进步意义,但仍然存在一定的局限性。① 受制于数据可获取性,本文的研究时段仅有4年,可能对数据中心发展及空间布局演变过程理解产生一定的局限性。② 由于数据中心设计机架数的相关信息较难获取,本文仅使用了国内运营商建设数据中心的相关信息,而未将Equinix、AT&T和KDDI等国外运营商建设的数据中心考虑在内。③ 数据中心规模、类型及其运营商等信息均可能对数据中心宏观布局产生影响,但现阶段尚未量化到模型中,是今后工作的重点之一。
参考文献
Geography and development
DOI:10.1093/jeg/1.1.81 URL [本文引用: 2]
The evaluation of coordinated development level between urban and rural and its spatial-temporal pattern in Yangtze River Economic Zone
长江经济带城乡协调发展评价及其时空格局
Infrastructure and the living environment of human being
基础设施与人类生存环境之关系研究
IDC data center construction requirements of power enterprises
电力企业IDC数据中心建设需求
The development of field scientific observation and research stations (networks) and scientific data centers
DOI:10.11821/dlxb202012009
[本文引用: 1]

Since the establishment of the Institute of Geographic Sciences and Natural Resources Research (IGSNRR) of the Chinese Academy of Sciences (CAS) 80 years ago, great attentions have been paid to the construction of field stations (networks) and scientific data centers. With establishment of four field observation research networks, IGSNRR has made notable success and led the construction and development of China's ecosystem research networks. Moreover, IGSNRR formed a unique field observation research platform and data sharing service platform, with two national scientific data centers and one CAS data center, as well as two national field observation and research stations and one CAS field research station. (1) This article reviewed the developmental history of Chinese (National) Ecosystem Research Network (CERN/CNERN), Chinese terrestrial ecosystem flux observation and research network (ChinaFLUX), Chinese Phenological Observation Network (CPON), Yucheng Station, Lhasa Station, Qianyanzhou Station, National Earth System Science Data Center (NESSDC), National Ecosystem Science Data Center (NESDC) and Resource and Environmental Science and Data Center. (2) The stations (networks) of the IGSNRR have grown from scratch and kept growing to be stronger, which have led the development of field observation research in China, and well supported the outcomes of important scientific achievements in geography and ecology, etc. The capacities of scientific and technological support as well as demonstration-promotion in our networks have been greatly improved, which strongly supports the construction of ecological civilization in the North China Plain, the Qinghai-Tibet Plateau and the southern mountainous and hilly areas. The networks of IGSNRR have become the largest scientific data center among the fields of earth system science, resources and environment science, and field station networks in China, with remarkable achievements in data sharing services and extensive influence both at home and abroad. (3) In the future, IGSNRR will give full play to the role of comprehensive center in field stations (networks), strengthen the construction capacity of observation and research networks such as ecosystem carbon and water flux, phenology, etc., and steadily improve the ability of condition guarantee for field observation and research stations, as well as of the data collection, analysis, mining, and sharing ability for scientific data centers. With these improvements, the networks of IGSNRR will continuously promote and lead the sharing of scientific data in China, make greater contributions to support scientific research and national needs.
野外科学观测研究台站(网络)和科学数据中心建设发展
DOI:10.11821/dlxb202012009
[本文引用: 1]
中国科学院地理科学与资源研究所成立80年来,十分重视野外台站(网络)和科学数据中心的建设,取得了辉煌成就。研究所建立了4个野外观测研究网络,引领了中国生态系统研究网络的建设与发展;成立了2个国家级科学数据中心,1个中国科学院数据中心,1个数据出版系统并于2016年加入了世界数据系统;拥有2个国家级野外观测研究站,1个中国科学院野外研究站,形成了独具特色的野外观测研究平台和数据共享服务平台。本文回顾了中国生态系统研究网络、国家生态系统观测研究网络、中国通量观测研究网络、中国物候观测网和禹城站、拉萨站、千烟洲站以及地球系统科学数据中心、生态科学数据中心、资源环境科学数据中心和全球变化科学研究数据出版系统的发展历程。地理资源所台站(网络)从无到有,不断发展壮大,引领了中国野外观测研究事业的发展,支撑了地理学、生态学等重要科学成果产出,科技支撑能力和示范能力大幅提升,有力支撑了华北平原、青藏高原以及南方山地丘陵区的生态文明建设;成为中国地球系统科学、野外台站、资源环境等学科和领域最大的科学数据汇聚中心,数据共享服务成效显著,在国内外具有广泛影响力。在未来发展中,地理资源所将充分发挥野外台站(网络)综合中心作用,强化生态系统、碳水通量、物候等观测研究网络的能力建设,稳步提升野外观测研究站条件保障能力和科学数据中心的数据汇聚能力、分析挖掘能力以及共享服务能力,持续推动和引领中国科学数据的共享,在科学研究和支撑国家需求等方面做出更大贡献。
Demand and scheme analysis of big data center construction in port enterprises
港口企业大数据中心建设需求及方案分析
On efficient resource use for scientific workflows in clouds
DOI:10.1016/j.comnet.2018.10.003 URL [本文引用: 1]
Promoting the integration and innovation of Northeast China with new infrastructure as the driving force
以“新基建”为牵引促进东北地区融合创新发展
Embrace new infrastructure to meet new development
拥抱新基建迎接新发展
New infrastructure: Both an imperative and a long-term support
新基建: 既是当务之急, 又是长远支撑
Research on spatial distribution and service level of Chinese airport system
DOI:10.11821/xb200608005
[本文引用: 2]
Based on the quantitative model and GIS method, this paper analyses the airports' spatial distribution, service coverage and air passengers flow in China. The result shows that Chinese airport system is imbalance in space and its structure is also unreasonable, which resulted in different spatial service levels, basically in accordance with Chinese economic pattern. Meanwhile, the air passengers flow is obviously agglomerated to the eastern coastal region, and its spatial connection and extension has the characteristics of hierarchy, which also shows some hub-and-spoke characteristics. The authors also find that Chinese airport system presents a "triangular balance pattern" spatial system with "Beijing, Shanghai and Guangzhou" as its centers, which will keep for a long time. Finally, the research shows that distribution of airport system is related to national or regional urban system. Therefore, with the rapid development of air travel, the regional distribution of new airports should be balanced and airport network and hierarchy system be optimized in future in China so as to induce a sound evolvement of the whole aviation network.
中国机场体系的空间格局及其服务水平
Spatial pattern and classification of the worldwide multi-airport regions
DOI:10.18306/dlkxjz.2018.11.004
[本文引用: 1]
This article employs the OAG (Official Airline Guide) flight schedule data of 2016 to analyze the spatial pattern and classification of multi-airport regions. The results indicate that: besides European countries and the United States, China, Japan, Thailand, and Brazil occupies important positions in the construction of multi-airport regions in the world. Multi-airport regions in Southern Europe, Australia, New Zealand, and West Asia are polarized and lack of secondary airports. The layout of airports in the multi-airport regions of the UK and the United States are more compacted, and people can spend 0.5~1 hour less when driving from the British other primary or secondary airports to the core airport compared with China. Multi-airport regions can be divided into nine categories according to available seats and the Herfindahl-Hirschman indexes (HHI), corresponding to different evolution stages of multi-airport regions. Globally, 22 multi-airport regions have developed into a relatively mature stage. In the future, under the premise of ensuring the overall development of multi-airport regions, China should pay attention to the transformation process of other important airports to secondary airports, improve the ground traffic level in the regions to reduce the access time between airports, and guide a high level competition between airports.
全球多机场区域空间格局与类型划分
DOI:10.18306/dlkxjz.2018.11.004
[本文引用: 1]
基于2016年的全球官方航空指南(Official Aviation Guide, 简称OAG)计划航班数据,本文重点分析了全球多机场区域的空间格局和主要类型。研究发现:除美国和欧洲的英、法、德、意等国外,中国、日本、泰国和巴西等国的多机场区域数量占有绝对优势。南欧、澳大利亚和新西兰、西亚等地的多机场区域内的机场等级呈现两端极化,缺少中间层级的辅助机场。以车程时间作为衡量,英、美两国多机场区域内机场布局更为紧凑,特别是英国其他主要机场或辅助机场到达核心机场的时间相对中国减少了约0.5~1 h。根据各多机场区域赫芬达尔—赫希曼指数(HHI指数)和可售座位数对比结果,多机场区域可分为9个类型,对照多机场区域不同的演化阶段,目前共有22个多机场区域发展较成熟。未来在保证多机场区域整体发展的前提下,中国应注重其他重要机场向中间层级的辅助机场的转化进程,提高区域内地面交通水平,以减少机场间的到达时间,引导区域内机场维持高水平竞争。
Distribution and optimization of container transportation network in China
DOI:10.11821/xb200204013
[本文引用: 2]
The container transportation is a revolution for the grocery transportation in the transportation system. The container transportation makes it impossible for the goods to be transported from door to door in the world. At the same time, the container transportation improves the efficiency of transportation. Based on analyzing the development of container transportation and network in the world, the paper points out not only the formation of container load center and lateral port but alsothe CFS is the result of the development of container transportation. The paper conducts an intensive discussion on the formation and evolvement mechanism and development mode of container load centers in the world. The formation of the network of container transportation is the tendency of container transportation and the necessary result. With economic development and rapid expansion of container transportation in China, it is necessary for China to establish rational network of container transportation. Based on GIS, the paper puts forward the mode of container ports and CFS and container transportation channels. finally a mode of judgement about container transportation channels is proposed through researching Nanchang container transportation system.
中国国际集装箱运输网络的布局与优化
Current port trends in an historical perspective
DOI:10.1080/21533369.1999.9668302 URL [本文引用: 1]
Competition and cooperation of high-speed rail and air transport in China: A perspective from spatial service market view
DOI:10.11821/xb201302003
[本文引用: 1]
With a large-scale construction of high-speed rail, its safety, economy and competition with air transport have become the foci of scholars. Today, transport infrastructure is playing a more and more important role in economic and industry layout. Under the background, the paper conducts studies on the market competition and cooperation of high-speed rail and air transport in China. First, the paper measures the spatial service market of high-speed rail and air transport by road transport with GIS method. Second, the paper analyzes the service overlapping market of high-speed rail and air transport. A city having both a high-speed rail station and an airport or the area enjoying the high-speed rail and air transport service in 1/2 hours by road transport is defined as the overlapping market. Besides, the paper discusses and stimulates the spatial effect of competition and cooperation between high-speed rail and air transport. Results indicate that: (1) Both high-speed rail and air transport are inclined to serve economy and population, and they can cover most of the population and GDP in 2 hours by road transport; (2) Different technique characteristics in distance decide their own advantageous markets. The service market of high-speed rail spatially mainly cover economic belts in Eastern and Central China, and air transport has competitive advantage in Western China. (3) With the rapid construction of high-speed rail and air transport, their overlapping markets will become larger and larger; therefore urban clusters, metropolitan areas, and economic belts will become their major competitive markets. Considering the higher construction costs and a smaller number of passengers as well as its competition with air transport in Western China, we suggest the Central Government slow down the pace of high-speed rail construction in this region.
中国高铁与民航的空间服务市场竞合分析与模拟
Research prospect and progress of port geography in China
DOI:10.13249/j.cnki.sgs.2021.04.007
[本文引用: 1]
Based on the bibliometric tool—CiteSpace, this article analyzed the research institutions, research teams, research hotspots and research stages of Chinese Port Geography, and summarized the general characteristics of Chinese Port Geography research. The study found that Chinese Port Geography has achieved a rapid development and the research methods and contents of Chinese Port Geography are diversified increasingly, some of the emerging research perspectives such as shipping companies and shipping networks, green low-carbon ports etc, are starting to rise, and become an important research direction of Port Geography gradually, besides that there is a lack of close cooperation and high academic consensus between research institutions in Chinese port geography. Finally, focusing on the discipline development of Port Geography and the needs of national strategy, we discussed the future development trend of Chinese Port Geography from the following 5 aspects: to improve the concept and basic category of port geography; to expand the theoretical innovation research in a global perspective; to strengthen the mechanism exploration based on microscopic perspective; to discuss the practical and theoretical exploration of disciplinary integration and to intensify a policy and practical exploration for national strategy.
中国港口地理学研究进展与展望
DOI:10.13249/j.cnki.sgs.2021.04.007
[本文引用: 1]
基于CiteSpace文献计量工具对中国港口地理学的研究机构、研究团队、研究热点及研究阶段进行分析,总结中国港口地理研究的总体特征。研究发现:中国港口地理学实现快速发展,研究方法和研究内容日趋多元化,航运企业与航运网络、绿色低碳港口等新视角开始发轫,逐渐成为港口地理学的重要研究方向;但中国港口地理学研究机构之间尚缺乏紧密的合作关系。最后,围绕港口地理学的学科发展及国家战略需求,从完善港口地理学概念及基本范畴、扩展全球视野创新理论研究、立足微观视角强化机理探究、学科融合的理论与实践探索、面向国家战略强化政策与实践探索5个方面探讨中国港口地理学未来发展趋势。
Analysis on the coupling coordination development of economy-resource-environment system of regional coal industry
区域煤炭产业经济-资源-环境系统耦合协调发展分析
Research on spatial layout of the infrastructure in China: Toward a high quality development
DOI:10.2307/142170 URL [本文引用: 1]
中国面向高质量发展的基础设施空间布局研究
Research on spatial layout planning of 5G communication base stations in Qingdao
青岛市5G通信基站空间布局规划探讨
Research on site layout of 5G mobile communication base station based on urban and rural planning
基于城乡规划的5G移动通信基站站址布局研究
Research on China's data center industry policy
我国数据中心产业政策研究
Development status and trend of data center
数据中心发展综述
Analysis of data center industry development
数据中心产业发展分析
Under the new infrastructure boom, the salary of scientific and technological talents is in short supply, and the increase is as high as 50%
新基建热潮下科技人才急缺薪酬涨幅高达50%
Energy Management of Internet Data Centers in Smart Grid
A review on energy efficiency and demand response with focus on small and medium data centers
DOI:10.1007/s12053-018-9753-2
[本文引用: 1]
Data centers are the backbone of a growing number of activities in modern economies. However, the large increase of digital content, big data, e-commerce, and Internet traffic is also making data centers one of the fastest-growing users of electricity. The total energy consumption of data centers corresponded to almost 1.5% of the global electricity consumption and has an approximated annual growth rate of 4.3%. Therefore, it is very important to increase the energy efficiency in data centers with actions such as power usage management, server consolidation, energy-efficient components and systems, as well as demand response programs and renewable energy sources. Small and medium data centers account for more than 50% of the total electricity consumption in this sector. In fact, surveys indicate that this data center profile waste more energy than larger facilities. Nevertheless, existing studies tend to be focused on the energy-related issues for large data centers rather than small and medium data centers. Therefore, through a meticulous state-of-the-art literature review of data centers energy efficiency and demand response perspectives, this paper aims to present how an intensive energy consumer, such as small and medium data centers, can become more efficient from the energy point of view and how they can take advantage of demand response programs to decrease costs and to cooperate with the grid to ensure higher reliability and sustainable development goals.
Research on the impact of network delay on data center layout
网络时延对数据中心布局的影响研究
Research on key elements and evaluation model of data center location
数据中心布局选址要素及评价模型研究
Analysis of energy saving potential of air-side free cooling for data centers in worldwide climate zones
DOI:10.1016/j.enbuild.2013.04.013 URL [本文引用: 1]
Adult active transport in the Netherlands: An analysis of its contribution to physical activity requirements
Another alternative for technology spillover: Influence of shareholders' technical level on innovation
DOI:10.13249/j.cnki.sgs.2020.09.007
[本文引用: 1]
With the advent of the era of the knowledge economy, innovation has become a significant engine of economic development. In this context, China has recently experienced dramatic economic restructuring with its vision to transform its growth pattern into a knowledge-driven development. Meanwhile, innovation becomes an increasingly crucial issue in the realm of economic geography. Economic geographers of related research have focused on the performance of knowledge externalities in specific spaces. In recent years, apart from geographical proximity, the concept of nongeographical proximity (e.g., organizational proximity, social proximity, institutional proximity, and cognitive proximity) has also attracted the attention of scholars. Either geographical proximity or non-geographical proximity, their essences are to increase the interaction between the shareholders and high-tech enterprises and then generate knowledge spillovers. With the assumption of the technology spillover also brought by non-geographical proximity, high-tech enterprises might be able to acquire new knowledge and expand the diversity of their knowledge bases from the frequent interactions with the shareholders. Furthermore, fewer researches had focused on the effect of shareholders’ technological level on firms’ innovation performance brought by the extra linkage built by investment from external shareholders. In order to unravel the relationship between shareholders’ technological level and high-tech enterprises’ innovation performance, this research collects data from the online databases, including Tencent location service (https://lbs.qq.com/tool/getpoint/index.html), National Enterprise Credit Information Publicity System (http://www.gsxt.gov.cn/index.html) and Qichacha (http://www.gsxt.gov.cn/index.html). By utilizing the data of 794 high-tech enterprises located in national high-tech industrial parks as samples, this article estimates the effect of shareholders’ technological level on innovation in the high-tech enterprise with a Tobit model within the framework of the knowledge production function. Based on the empirical evidence, this article proposes the three following findings: First, the average distance between the first shareholder and high-tech enterprise is 288 km. The shareholders are mainly distributed in the three core metropolitan regions (i.e., the Bohai Rim region, the Yangtze River Delta region and the Pearl River Delta region) in eastern China, and capital flows are mainly among or between these regions. Second, the shareholders’ technological level has a positive effect on improving enterprise innovation performance which is measured by the number of patents and software, because the investment behavior is conducive to enhance the convenience of technological interaction between shareholders and the high-tech enterprises. Third, the analysis of the technology spillover mechanism: the investment behavior lowers the threshold of interaction between the innovation subjects, and the technology spillover is realized through the establishment of a smooth flow of knowledge talents and a lower threshold for R&D cooperation. Finally, the article further affirms that capital flows can break through the spatial boundary and bring technology spillover, which provides a new way to facilitate the technology learning process of high-tech enterprises. Also, the following suggestions are put: With its limitation of attracting high-tech enterprises, local government can encourage local enterprises to introduce investment from enterprises with high technological level for promoting their innovation performance.
伴随资金流的技术溢出: 股东技术水平对高新技术企业创新的影响
DOI:10.13249/j.cnki.sgs.2020.09.007
[本文引用: 1]
以上市高新技术企业为例,通过建立Tobit模型,实证分析了股东技术水平对企业创新绩效的影响,进而探讨资金流带来的技术溢出机制。研究发现:高新技术企业与股东呈现出分离的空间布局特征,其中股东和资金流空间主要分布在中国的东部地区;股东技术水平对被投资企业创新绩效有正向影响并表现出稳健的结果;同时,股东作为区域外联系的对象,其投资行为使得创新主体之间相互作用的门槛更低,通过建立通畅的知识人才互动管道和更低的研发合作门槛,实现了技术溢出。并做出以下建议:资金流带动的技术外溢增加了技术学习的新路径,创新落后地区在引入高新技术企业限制的情况下,可引入携带技术的资金以达到补充效果。
