

1 引言
《中共中央关于制定国民经济和社会发展第十四个五年规划和二〇三五年远景目标的建议》中提出优化行政区划设置,发挥中心城市和城市群的带动作用。作为引领区域经济发展的增长极,以大城市为核心的城市群是推进区域协调发展的新动力源,集聚了中国78%的人口,贡献了超过80%的国内生产总值①(①数据来源:
已有研究集中在两方面:① 城市群内城市②(②为行文方便,如不做特别说明,下文统一将“城市群内城市”简写为“城市”,所综述的文献均以城市群内的城市为研究对象,与本文研究内容较契合。)高质量发展内涵的界定及评价。在内涵界定上,多数学者基于五大发展理念,提出高质量发展是以创新、协调、绿色、开放、共享为理论支撑,分工协作而形成的共同发展、共享共赢、可持续的模式[1⇓⇓-4]。既包含经济增长动力由要素比较优势向科技创新驱动转变[5],也表现在经济效率提升、结构优化和平稳运行[6],以及发展结果对生态环境、社会保障的影响[7-8]。部分学者基于高质量发展目标,认为高质量发展是基于人民对美好生活的向往,提高人民生活满意度和幸福感[9],不断满足人民实际需要的经济结构、发展方式和动力状态[10],通过治理体系和治理能力的现代化实现其预期目标[11]。还有学者认为高质量发展是高效率、公平和绿色可持续的发展[4],其核心在于“绿色”和“发展”的和谐统一[12]。城市群肩负着经济增长和绿色发展的双重要求[13],采用高效的绿色低碳生产方式能够有效缓解经济增长和生态环境之间的矛盾[4],有利于实现城市高质量发展[14]。高质量发展评价主要有两类做法,一是特定指数模型,多用全要素生产率[15]或SBM-DEA模型[14];二是多维指标体系。高质量发展的本质是从数量增加到效率提升,规模扩张到结构优化,投入、投资驱动到创新驱动的转变[16],以及绿色发展方式的选取[17],因此构建指标体系测度是必要的。如涂建军等构建了以经济发展、社会发展、生态环境质量为核心的指标体系[18];徐丽婷等构建了经济发展、生态环境保护、社会文明进步协调下的高质量发展指标体系[19]。② 城市群空间结构对高质量发展的影响。此类研究提出以城市群为空间载体,通过主体功能的跃升、经济协调发展、开放水平的提高、现代化效率的提升等方式,强化城市群之间要素流动和网络关联,加速城市群内部空间集聚,形成多个功能中心,推进高质量发展[20-21]。
从研究方法来看,大致可分为非空间分析方法和空间分析方法。非空间分析方法集中在高质量发展指标数据处理和权重计算。其中,原始数据标准化处理上,多采用极值法[8,22]、定基功效系数法[23]等消除因量纲不同对评价结果造成的影响。指标赋权上,熵值法[19,24]和主成分分析法[25]运用较为普遍,熵值法通过信息熵度量系统状态的无序程度,判断指标变化的相对幅度;主成分分析法用较少的综合变量代替原有较多的变量,有效反映指标之间的相对重要性[25]。空间分析方法多采用空间自相关分析[3]、修正后的引力模型、分形计量模型[18]、社会网络分析[26]等测算要素空间分布的均衡性、城市群规模、城市间相互作用等对城市高质量发展水平的影响。
综上分析,城市高质量发展的研究仍处于探索阶段,存在以下不足。① 从研究内容来看,高质量发展内涵界定及指标体系构建忽视了反映城市间空间结构、网络联系等因素,将城市群的高质量发展等同于单个城市的高质量发展,并未突出城市群的独特性。而且多数文献的指标并未明确区分状态和过程,高质量发展描述的应该是发展的结果,而过程性指标更多解释的是城市间存在差异的原因[27]。② 从研究方法来看,多数文献选用的方法可比性不强。其中,熵值法适用于静态评价,不利于反映时序变化。主成分分析法处理时会丢失部分指标的信息,且存在负数权重较难合理解释的情况。③ 从研究深度来看,城市高质量发展类型时空演变及其影响因素的相关研究有待延伸。现有研究对高质量发展的异质性分析深度不够,各城市要素禀赋、区位条件、空间结构,以及经济结构等存在差异,某些城市群内部甚至出现较为严重的分化。因此,城市的经济转型路径迥然不同,大而一统的高质量发展模式不符合现实的需要。那么,城市高质量发展有多少类型?呈现怎样的空间分布格局?如何缩小各类型间的差距达到协调发展?为解决上述问题,亟需将俱乐部趋同研究延伸到城市高质量发展领域,城市高质量发展趋同俱乐部存在性及构成的分析将揭示城市高质量发展类型的差异及格局演变,而俱乐部趋同形成机理的挖掘将为各类城市制定针对性的发展策略提供重要参考。
对俱乐部趋同研究而言,城市高质量发展俱乐部趋同的相关分析是中国案例对世界俱乐部趋同领域的新贡献。俱乐部趋同一直是区域经济增长和发展领域的焦点,其目的是达到区域间福利的均衡,研究对象由单一的人均收入发展至福利的综合代理指数,即,人类发展指数[28]、社会发展指数[29]、广义发展指数[30]、BLI指数(the Better Life Initiative)[31]等。其中,人类发展指数和社会发展指数对环境因素不够重视,广义发展指数更适合全球性的分析,水的获得性和卫生设施等并不是中国城市高质量发展的要义,而BLI指数则包括了公民参与治理、社区和生活满意度等较难量化的指标。中国作为一个转型期大国,如何以人为核心探讨城市间福利的均衡?高质量发展指数无疑是最佳选择。高质量发展的目的就是解决人民日益增长的美好生活需要和不平衡不充分的发展之间的矛盾,其最终目标是实现共同富裕,体现了经济发展、社会发展及自然发展等与人类发展密不可分的多维特征,而城市是撬动全国高质量发展的空间动能。因此,城市高质量发展俱乐部趋同的相关研究即是福利指数在中国的新探索,又是以人为核心拓展世界俱乐部趋同研究领域的迫切需要。
基于此,本文选取中国13个城市群中的174个城市为研究对象,从经济发展、社会保障、社会公平、成果共享、环境质量、空间联系等入手,构建城市高质量发展指标体系,采用纵横向拉开档次法和定基功效系数法进行测算,并结合马尔科夫链、空间马尔科夫链及有序响应Logit模型等,纳入网络因素分析城市高质量发展趋同俱乐部格局演变及机理,以期对中国高质量发展提供参考。本文的边际贡献为:① 从城市个体和城市群整体两方面入手提出城市高质量发展是群内城市经济发展水平高、社会保障好、社会公平、成果共享、环境质量好、空间联系质量高的发展模式。② 采用纵横向拉开档次法和定基功效系数法测算城市高质量发展指数,使得该指数在不同年份及不同城市间具有可比性。纵横向拉开档次法能从时间纵向和城市截面横向两个方面综合评价各指标的分布状况,并根据差异程度客观地为指标赋权[32],在一定程度上克服了传统赋权方法在跨期比较中的弱势,定基功效系数法使城市高质量发展指数在不同年份之间具有可比性[23]。③ 将俱乐部趋同分析技术引入城市高质量发展时空演变及影响因素分析。采用的Kernel密度估计、马尔科夫链、空间马尔科夫链等数据驱动型方法不存在模型设定偏误及参数内生性等问题,且能够计算不同俱乐部之间转移的概率。然而现有研究忽视了网络因素的重要性。在人流、物流、信息流、技术流等要素的相互作用下,城市与城市之间形成了较强的关联网络,而且网络溢出效应多重叠加,呈现出复杂化、全域性的发展趋势。因此在构建空间马尔科夫链权重矩阵时,本文在时间维度和空间维度耦合的基础上,加入网络维度,以弥补区域之间的联系并不完全受地理距离和经济距离影响的局限,更加真实地测度邻居③(③ 邻居并不一定是地理意义上的邻居,而是在时间、空间及网络等维度与该城市高质量发展关系密切的其他所有城市的“统称”。)的影响[33],进一步从高质量发展的5项支撑及邻居效应等方面构建城市高质量发展趋同俱乐部形成机理,并使用有序响应Logit模型进行检验[34],为高水平、中高水平趋同俱乐部成员保持稳定,低水平、中低水平俱乐部成员向上转移定制路径。
2 研究区域及数据来源
依据现有的城市群规划、国家“沿海、沿江、沿黄”的区域发展战略、城市群规模等选取13个城市群,包括京津冀城市群、粤港澳大湾区、长三角城市群、长江中游城市群、成渝城市群、山东半岛城市群、中原城市群、关中平原城市群、北部湾城市群、哈长城市群、辽中南城市群、呼包鄂榆城市群、兰西城市群④(④城市群划分依据:《京津冀协同发展规划纲要》(2015年6月中共中央、国务院)、《粤港澳大湾区发展规划纲要》(中共中央、国务院2019年2月)、《长江三角洲城市群发展规划》(发改规划〔2016〕1176号)、《长江中游城市群发展规划》(发改地区〔2015〕738号)、《成渝城市群发展规划》(发改规划〔2016〕号)、《山东半岛城市群发展规划(2021—2035年)》(发改规划〔2021〕24号)、《中原城市群发展规划》(发改地区〔2016〕2817号)、《北部湾城市群发展规划》(发改规划〔2017〕277号)、《哈长城市群发展规划》(发改地区〔2016〕499号)、《关中平原城市群发展规划》(发改规划〔2018〕220号)、《呼包鄂榆城市群发展规划》(发改地区〔2018〕358号)、《兰州—西宁城市群发展规划》(发改规划〔2018〕423号)。依据地理学第一定律,城市群内重复城市向更近增长极靠拢(邯郸市、邢台市划分到京津冀,运城市划分到关中平原)。本文粤港澳大湾区暂未含香港和澳门,为确保研究对象行政级别的匹配,兰西城市群是基于区、县级市所在的地级市为分析地域单元。)(图1)。以《十四五规划和2035远景目标纲要》、全国主体功能区划和国家新型城镇化为依据,基于“十四五”规划中各城市群的功能定位、发展基础和发展潜力,将13个城市群识别为3个发展阶段。其中,长三角、粤港澳大湾区、京津冀、长江中游、成渝等以国家级中心城市为核心,形成带动全国发展并具有全球影响力的增长极,处于优化提升阶段;山东半岛、中原、北部湾、关中平原等以国家区域性中心城市为核心,通过促进分工协作、完善基础设施带动区域发展,处于发展壮大阶段;辽中南、呼包鄂榆、哈长、兰西等均为中西部、东北地区重点发展的区域,城市群规模较小或尚未完全形成,处于培育发展阶段[35]。
图1
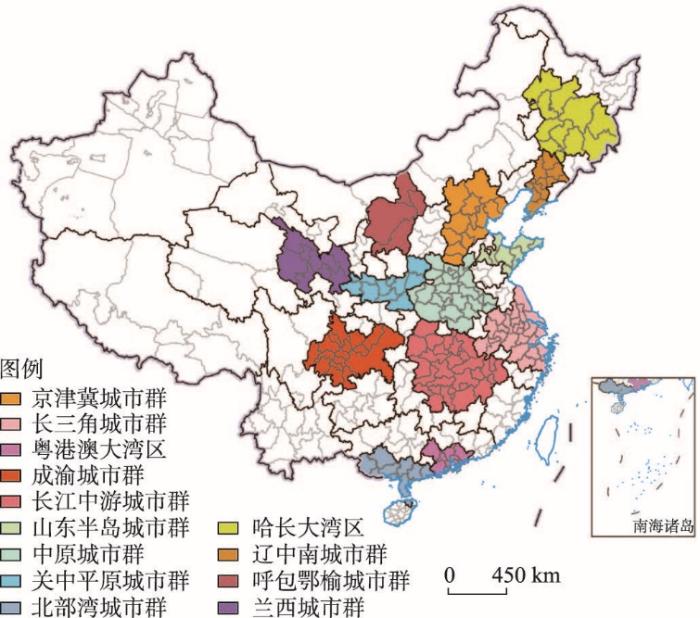
图1
中国13大城市群的空间分布
注:基于自然资源部标准地图服务网站审图号为GS(2019)1825号的标准地图制作,底图边界无修改。
Fig. 1
Spatial distribution of 13 urban agglomerations in China
数据来源于《中国城市统计年鉴》及各省份统计年鉴。DMSP/VIIRS夜光遥感数据来源于DMSP-OLS和NPP-VIIRS观测平台的夜光DN值,AQI指数来源于中国环境监测总站的全国城市空气质量实时平台,DMSP/VIIRS夜光遥感数据和AQI指数的具体取值方法是在行政区面积的基础上取行政区栅格均值。PM2.5数据来源于哥伦比亚大学国际地球科学信息网络中心(CIESIN)所属的社会经济数据和应用中心(SEDAC)公布的相关监测数据。矢量路网数据来源于OSM平台,列车收发频次数据来源于列车时刻表及铁路12306网站。个别年份城市缺失的数据,采取插值法进行处理。
3 城市高质量发展
3.1 高质量发展内涵及指标体系构建
在人民日益增长的美好生活需要和不平衡不充分发展之间的社会主要矛盾背景下,人民对物质文化生活、社会保障、生态环境质量的要求日益提高。因此,为实现高质量发展,需要经济发展的结构、效率、可持续性等多方面的提升,以及相关社会保障体系的健全、优质的生态环境作为保障,使发展成果全民共享。同时,城市群作为一个复杂的区域系统,是以中心城市为核心,建立起城市与城市之间人、物、信息、技术等要素充分流动、相互作用的层次体系,成员之间具有较强的关联效应,高质量发展不仅依赖于单个城市,更有赖于其整体结构和城市间的空间联系。因此,本文认为城市高质量发展是群内城市经济发展水平高、社会保障好、社会公平、成果共享、环境质量好、空间联系质量高的发展模式。并以此作为参考,构建高质量发展指标体系(表1)。
表1 城市群内城市高质量发展指标体系
Tab. 1
| 一级指标 | 二级指标 | 三级指标 | 指标效用 | 指标符号 | 权重 |
|---|---|---|---|---|---|
| 经济发展 | 总体水平 | 人均GDP | + | X1 | 0.112 |
| 增长稳定性 | GDP增长率变异系数倒数 | - | X2 | 0.381 | |
| 增长活力 | 社会消费品零售总额/GDP | + | X3 | 0.236 | |
| DMSP/VIIRS夜光遥感数据均值 | + | X4 | 0.063 | ||
| 创新能力 | 人均专利授权量 | + | X5 | 0.028 | |
| 产业水平 | 产业结构合理化指数 | + | X6 | 0.107 | |
| 产业结构高级化指数 | + | X7 | 0.208 | ||
| 全球化水平 | 实际利用外资金额/GDP | + | X8 | 0.094 | |
| 社会保障 | 社会福利水平 | 卫生、社会保障和社会福利从业人口/总人口 | + | X9 | 0.086 |
| 社会不稳定因素 | 失业率 | - | X10 | 0.388 | |
| 社会公平 | 人均医生 | 医生数/总人口 | + | X11 | 0.098 |
| 人均床位 | 医院、卫生院床位数/总人口 | + | X12 | 0.061 | |
| 高等教育水平 | 高等学校在校学生人数/总人口 | + | X13 | 0.079 | |
| 设施水平 | 每百人公共图书馆藏书/当年全国平均每百人公共图书馆藏书 | + | X14 | 0.036 | |
| 成果共享 | 城市内部财富分配 | 在岗职工工资总额/GDP | + | X15 | 0.111 |
| 城市之间财富分配 | ∣1-职工人均工资/城市群城市平均职工人均工资∣-1 | + | X16 | 0.016 | |
| 环境质量 | 污染排放 | 工业废水排放量/第二产业增加值 | - | X17 | 0.389 |
| 空气质量 | AQI指数 | + | X18 | 0.145 | |
| PM2.5指数 | - | X19 | 0.248 | ||
| 环境治理能力 | 生活垃圾无害化处理率 | + | X20 | 0.396 | |
| 城市绿地 | 建成区绿化覆盖率 | + | X21 | 0.173 | |
| 空间联系 | 城市联系质量 | 交通网络通达性 | + | X22 | 0.282 |
| 城市联系强度 | + | X23 | 0.161 |
(2)社会保障、社会公平、成果共享在一定程度上反映了一个城市的治理能力、社会保障水平和财富分配情况。本文从“社会福利水平”“社会不稳定因素”“人均医生”“人均床位”“高等教育水平”“设施水平”“城市财富分配”7个方面测度。其中,“社会福利水平”“社会不稳定因素”用卫生、社会保障和社会福利从业人口/总人口和失业率[10]来衡量。“人均医生”[10,18]“人均床位”[10,40]用来测算城市医疗保障分配的质量和基础的健康服务水平;“高等教育水平”“设施水平”反映人民精神文化生活方面的需求[32]。利用在岗职工工资总额/GDP[18]测算城市内部财富的分配情况,用∣1-职工人均工资/城市群城市平均职工人均工资∣-1测算城市群内城市之间的社会财富分配差异。
(4)空间联系采用交通网络通达性和城市联系强度等测算。能够有效反映城市要素空间分布的均衡性,以及城市间空间相互作用强弱。
式中:C(e)为关联函数;e为给定的距离标度;M为关联维数;N为城市数目;H为越阶函数;dij为城市i与城市j之间的直线距离,由式(1)计算出交通网络的空间关联维数,然后将dij替换为两个城市之间的最短道路距离,得到修正后的空间关联维数
两个城市间的联系强度利用修正后的引力模型计算,公式为:
式中:Rij表示两个城市之间的城市联系强度;Pi和Pj分别为城市i与城市j的常住人口;Gi和Gj为城市i与城市j的GDP;Dij为城市i与城市j之间的最短道路距离,在此基础上,构建城市群网络联系矩阵,并利用该矩阵计算不同年份城市群内部网络密度值,以此值作为城市联系强度指标。
3.2 高质量发展指数测算
为保证不同年份之间高质量发展指数是可比的,① 采用定基功效系数法对指标进行标准化处理,公式为:
式中:xij(tk)和sij(tk)分別表示第i个城市第j个指标在第tk年度的原始值和标准化的值; max[xj(t1)]、min[xj(t1)]分別表示所有城市第j个指标在基期的最大值和最小值。
② 采用纵横向拉开档次法对标准化后的指标进行赋权。设有n个被评价对象
式中:H为
③ 计算第i个城市第tk年的高质量发展指数Qi (tk),公式为:
指标权重计算结果如表1,其中“生活垃圾无害化处理率”“工业废水排放量/第二产业增加值”“失业率”“GDP增长率变异系数倒数”“交通网络通达性”权重排名前5;其次是“产业结构指数”“AQI指数”和“PM2.5指数”。因此城市间交通网络通达性越高,城市环境质量越好,产业结构越合理,越倾向于高新技术产业,越能促进城市高质量发展。
计算2003—2019年城市群各城市的高质量发展指数,并用城市群内各城市指数的均值来代表该城市群高质量发展指数[22,41],各发展阶段城市群高质量发展指数为该阶段城市群内城市高质量发展指数的均值(图2a、2b)。总体上,高质量发展指数呈上升趋势,优化提升阶段城市群的均值始终大于另外两个阶段的均值和全部城市群的均值,且有最快的增长速度(3.31%),而培育发展阶段城市群的均值均低于全部城市群的均值;发展壮大阶段城市群的均值在2011年前领先于培育发展阶段城市群,在2011年之后逐渐呈现趋近的状态。从同一发展阶段城市群之间高质量发展指数变化来看,2007年以后,粤港澳大湾区、长三角、京津冀城市群均值均高于该阶段所有城市群的均值,而长江中游、成渝城市群均值则较低。山东半岛城市群均值远高于发展壮大阶段城市群中另外3个城市群的均值,且3个城市群的增长呈现出相同的演变趋势(图2c)。培育发展阶段城市群相较于其他两个阶段城市群的变化态势,具有波动式上升的特征(图2d)。
图2
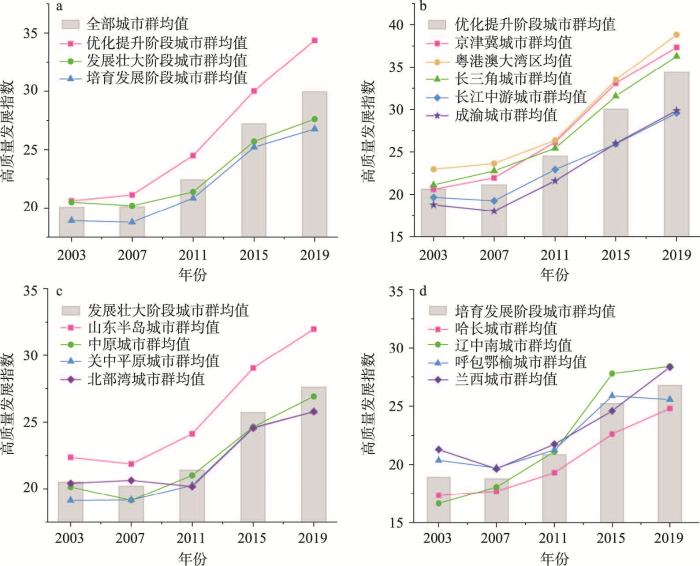
图2
2003—2019年不同发展阶段城市群之间高质量发展指数时序变化
Fig. 2
Time series changes of high-quality development index among urban agglomerations at different development stages
4 城市高质量发展趋同俱乐部格局及变迁
4.1 基本格局
K-均值聚类分析方法将样本每个维度的中位数作为聚类中心的值,使得相似的样本分到同一个组,能够有效反映组内样本趋同性。考虑到高质量发展是个动态演进的过程,本文运用该方法将2003—2019年每一年的城市高质量发展指数划分为5种类型:低水平、中低水平、中等水平、中高水平和高水平,同时为考察不同周期下高质量发展趋同俱乐部的动态演进过程,分析间隔1年和间隔4年的转移概率矩阵(表2)。
表2 城市群内城市传统马尔科夫转移概率矩阵
Tab. 2
| ti/ti+1 | 低水平 | 中低水平 | 中等水平 | 中高水平 | 高水平 |
|---|---|---|---|---|---|
| 低水平 | 0.6180 | 0.3301 | 0.0365 | 0.0096 | 0.0058 |
| 中低水平 | 0.2500 | 0.4395 | 0.2548 | 0.0366 | 0.0191 |
| 中等水平 | 0.0561 | 0.2474 | 0.4474 | 0.2228 | 0.0263 |
| 中高水平 | 0.0098 | 0.0471 | 0.2608 | 0.4098 | 0.2725 |
| 高水平 | 0.0036 | 0.0270 | 0.0324 | 0.2234 | 0.7135 |
| ti/ti+4 | 低水平 | 中低水平 | 中等水平 | 中高水平 | 高水平 |
| 低水平 | 0.5211 | 0.3099 | 0.1479 | 0.0141 | 0.0070 |
| 中低水平 | 0.2405 | 0.4430 | 0.2595 | 0.0316 | 0.0253 |
| 中等水平 | 0.1513 | 0.2105 | 0.4539 | 0.1711 | 0.0132 |
| 中高水平 | 0.0244 | 0.0894 | 0.2520 | 0.3659 | 0.2683 |
| 高水平 | 0.0083 | 0.0083 | 0.0413 | 0.1901 | 0.7521 |
可以看出,无论是以1年为间隔还是以4年为间隔,对角线处的值最大,因此,不同类型维持自身原有水平的概率大于转移概率,其中,间隔4年的维持自身稳定的总体概率较低,说明城市高质量发展类型的改变需要较长时间。其次,较高水平趋同俱乐部维持不变及向上转移的概率大于其向下转移的概率,表明随着时间的推移,更多的城市会向更高等级的俱乐部转移。最后,由对角线向两侧概率变小,表明俱乐部成员的转移基本发生在相邻水平,不易出现低水平和高水平之间转移的情况。
为进一步分析城市高质量发展趋同俱乐部的时空演进,本文结合聚类分析的分组进行俱乐部成员演变状态的识别,划分为稳定、向上转移、向下转移和波动4种状态,其中,稳定是指绝大部分年份均属于同一类型,这些稳定的城市形成了相应类型的趋同俱乐部。向上转移是指向更高水平转移,向下转移是指向更低水平转移,波动是指在考察期内变化起伏不定。
2003—2019年间处于波动状态的城市数量占比为10.34%,主要分布于相邻城市群的邻接处或者城市群边界,这些城市往往会受到空间上相邻城市的影响,而受城市群中心城市的影响相对较小(图3)。处于向下转移状态的城市数量占比为13.22%,主要分布在长江中游、北部湾、呼包鄂榆城市群,并且多与波动状态的城市相邻,此类城市受地理位置和环境的制约,较难保持稳定,易被其他城市影响。处于向上转移状态的城市数量占比为10.92%,集中分布在长三角、京津冀、成渝城市群中,多与中心城市相邻。在保持相对稳定的城市中,属于低水平趋同俱乐部的城市数量占比为9.77%,比例相对较低,说明城市群作为区域经济发展的增长极,高质量发展指数相较于其他城市更高。属于中低水平、中等水平趋同俱乐部的城市数量占比分别为16.09%、12.07%,主要分布在华中地区的中原城市群和长江中游城市群,这些城市大多集中分布,不易发生转移,长期处于稳定状态。属于中高水平趋同俱乐部的城市数量占比为12.07%,集中在长三角、粤港澳大湾区、山东半岛城市群,多与高水平趋同俱乐部城市相邻,其高质量发展保持在较高水平。属于高水平趋同俱乐部的城市数量占比为15.52%,主要分布在优化提升阶段城市群的中心城市以及各个城市群中的省会城市,这些城市对外开放程度高,产业结构高级化程度高,因此高质量发展水平较高。
图3
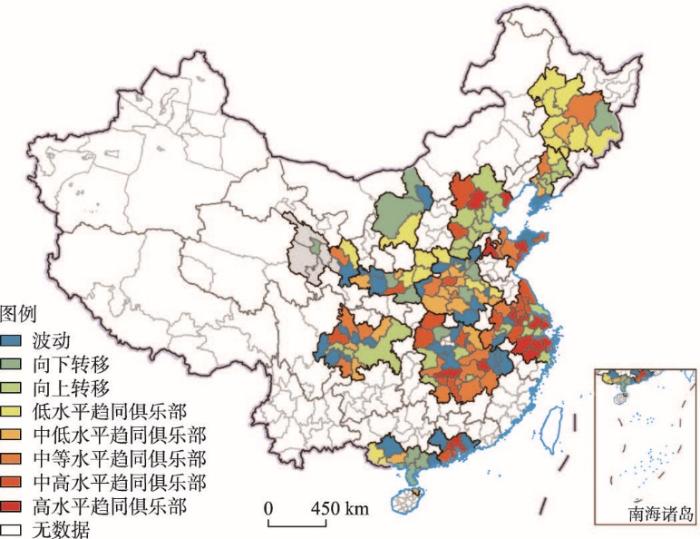
图3
2003—2019年中国13大城市群高质量发展俱乐部时空演进
注:基于自然资源部标准地图服务网站审图号为GS(2019)1825号的标准地图制作,底图边界无修改。
Fig. 3
Spatiotemporal evolution of high-quality development clubs in China's 13 urban agglomerations, 2003-2019
4.2 邻居的影响
现阶段城市与城市之间的关联效应具有复杂网络特点,以地理临近、地理距离、经济距离或者经济地理距离的耦合等来分析城市与其邻居之间的关联并不能较好地反映多重叠加的溢出效应[33]。为兼顾时间、空间及网络三重维度对城市相互作用的影响,本文首先根据地理距离倒数得到城市间的地理距离矩阵,体现空间滞后影响,接着考虑到网络作为高质量发展空间溢出传导的媒介,构建高质量发展关联网络矩阵,体现时间和网络滞后影响。高质量发展关联关系是一种长期趋势,借鉴李敬等[42]和刘华军等[43]的分析方法,建立城市高质量发展指数的VAR模型,通过VAR格兰杰因果关系检验来判断城市两两之间是否存在高质量发展因果关系,若存在,关联网络矩阵相应位置元素赋值为1,不存在则赋值为0,从而得到高质量发展关联网络矩阵。然后将距离倒数矩阵和关联网络矩阵相耦合,得到新的空间权重矩阵,既考虑地理距离又有经济计量上的因果关系,能够从时间、空间、网络3个视角耦合分析邻居的影响。
为验证上述方法构建的空间权重矩阵更合理,分别考察不同情形下高质量发展指数的Kernel密度函数分布变化(图4)。图4a表示不考虑邻居的分布动态,发现曲线存在多个波峰,表明城市高质量发展存在多个趋同俱乐部。图4b和图4c分别为将距离倒数矩阵测度的邻居作为条件和将关联网络矩阵测度的邻居作为条件的高质量发展指数Kernel密度分布,可以看出两种情形下曲线的分布仍然呈现多峰状态,意味着消除邻居的影响后,城市高质量发展并未趋同,因此这两类邻居对高质量发展俱乐部趋同的影响并不显著。图4d表示距离倒数矩阵与关联网络矩阵耦合的空间权重矩阵下的分布动态,此时曲线分布基本呈现单峰集聚形态,且分布更为集中。因此,距离倒数矩阵与关联网络矩阵耦合的空间权重矩阵下的邻居对俱乐部的形成影响更为显著,这也从侧面验证了本文从时间、空间及网络3个维度耦合构建的空间权重矩阵更适合城市高质量发展趋同俱乐部的分析。
图4
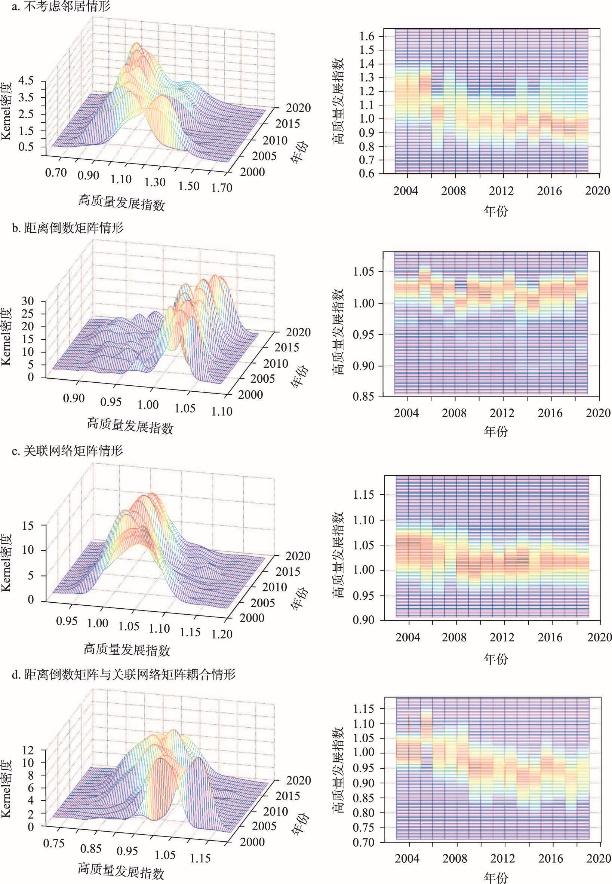
图4
2003—2019年城市群内城市高质量发展指数分布动态
Fig. 4
Distribution dynamics about high-quality development index of cities within urban agglomerations, 2003-2019
因此,基于上文构建的空间权重矩阵进行空间马尔科夫链分析,以考察邻居的影响。类似地,采用K-Medians聚类分析将邻居加权后的高质量发展指数划分为5种类型作为空间滞后条件,计算间隔4年的空间马尔科夫转移概率矩阵(表3)。
表3 城市群内城市空间马尔科夫转移概率矩阵
Tab. 3
| 滞后类型 | ti/ti+4 | 低水平 | 中低水平 | 中等水平 | 中高水平 | 高水平 |
|---|---|---|---|---|---|---|
| 低水平 | 低水平 | 0.7647 | 0.1471 | 0.0882 | 0.0000 | 0.0000 |
| 中低水平 | 0.3500 | 0.4000 | 0.2500 | 0.0000 | 0.0000 | |
| 中等水平 | 0.0000 | 0.2941 | 0.6471 | 0.0588 | 0.0000 | |
| 中高水平 | 0.1429 | 0.1429 | 0.2857 | 0.2857 | 0.1429 | |
| 高水平 | 0.0000 | 0.0000 | 0.0000 | 0.3333 | 0.6667 | |
| 中低水平 | 低水平 | 0.5217 | 0.3696 | 0.0870 | 0.0217 | 0.0000 |
| 中低水平 | 0.2708 | 0.4583 | 0.2500 | 0.0208 | 0.0000 | |
| 中等水平 | 0.1429 | 0.1429 | 0.5476 | 0.1667 | 0.0000 | |
| 中高水平 | 0.0370 | 0.2222 | 0.2963 | 0.3333 | 0.1111 | |
| 高水平 | 0.0000 | 0.0000 | 0.4000 | 0.2000 | 0.4000 | |
| 中等水平 | 低水平 | 0.4500 | 0.3000 | 0.2000 | 0.0500 | 0.0000 |
| 中低水平 | 0.3750 | 0.3750 | 0.1875 | 0.0000 | 0.0625 | |
| 中等水平 | 0.2083 | 0.2083 | 0.3333 | 0.2083 | 0.0417 | |
| 中高水平 | 0.0455 | 0.0000 | 0.1818 | 0.4091 | 0.3636 | |
| 高水平 | 0.0000 | 0.0000 | 0.0000 | 0.1579 | 0.8421 | |
| 中高水平 | 低水平 | 0.3636 | 0.3636 | 0.2424 | 0.0000 | 0.0303 |
| 中低水平 | 0.2000 | 0.4500 | 0.3250 | 0.0000 | 0.0250 | |
| 中等水平 | 0.1944 | 0.2222 | 0.4722 | 0.1111 | 0.0000 | |
| 中高水平 | 0.0526 | 0.1053 | 0.3158 | 0.3684 | 0.1579 | |
| 高水平 | 0.0625 | 0.0625 | 0.0625 | 0.1250 | 0.6875 | |
| 高水平 | 低水平 | 0.4286 | 0.4286 | 0.1429 | 0.0000 | 0.0000 |
| 中低水平 | 0.0909 | 0.5152 | 0.2121 | 0.1212 | 0.0606 | |
| 中等水平 | 0.0909 | 0.2727 | 0.3636 | 0.2424 | 0.0303 | |
| 中高水平 | 0.0000 | 0.0000 | 0.1961 | 0.4510 | 0.3529 | |
| 高水平 | 0.0000 | 0.0000 | 0.0357 | 0.2321 | 0.7321 |
从表3来看,在不同类型邻居情形下,由对角线向外概率值在不断减小,低水平和高水平之间转移的概率基本全部为0,且若发生转移更多的是向邻近类型转移。当与低水平邻居相邻时,形成低水平、中低水平、中等水平、高水平等4个趋同俱乐部,与中低水平邻居相邻时,形成低水平、中低水平、中等水平、中高水平等4个趋同俱乐部,与中等水平、中高水平、高水平邻居相邻时,形成低水平、中低水平、中等水平、中高水平、高水平等5个趋同俱乐部(图5)。随着邻居高质量发展指数的提升,低水平和中低水平趋同俱乐部范围收缩,高水平趋同俱乐部范围扩大,向上转移的城市个数增多,结合城市群发展阶段来看,培育发展阶段城市群中,低水平、中低水平趋同俱乐部范围收缩,优化提升阶段城市群中,高水平趋同俱乐部范围扩大。
图5
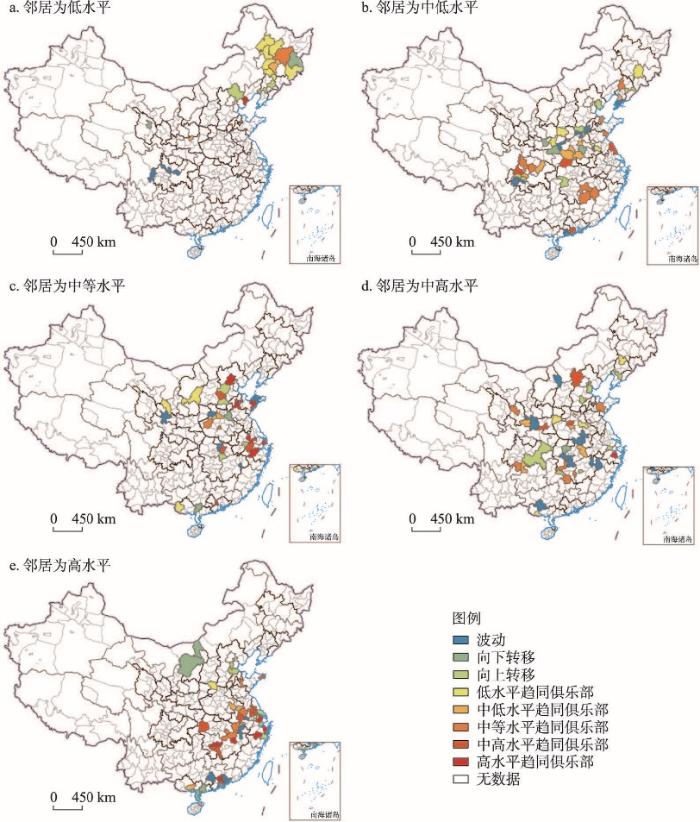
图5
邻居效应下城市群内城市高质量发展俱乐部时空演进
注:基于自然资源部标准地图服务网站审图号为GS(2019)1825号的标准地图制作,底图边界无修改。
Fig. 5
Spatiotemporal evolution about high-quality development clubs of cities within urban agglomerations under neighbor effect
5 城市高质量发展趋同俱乐部形成机理
前文的分析表明城市高质量发展存在5种类型的趋同俱乐部,那么,这些趋同俱乐部的形成及变迁机理是什么?本文认为主要有以下可能的影响因素(表4)。
表4 城市群内城市高质量发展趋同俱乐部影响因素选取
Tab. 4
| 变量 | 指标符号 | 变量解释 |
|---|---|---|
| 经济支撑 | GDP-G | 2003—2019年GDP增速差值 |
| CD-Ⅱ and Ⅲ | 2003—2019年二三产业协调度差值 | |
| Value Ⅱ/Ⅲ | 2003—2019年第三产业增加值/第二产业增加值差值 | |
| gtfp | 2003—2019年绿色全要素生产率差值 | |
| mi | 2003—2019年市场化指数差值 | |
| 保障支撑 | gtfr/GDP-2003 | 2003年地方一般财政收入占GDP比重 |
| gtfr/GDP | 2003—2019年地方一般财政收入占GDP比重差值 | |
| 环境支撑 | SO2/tio-2003 | 2003年工业二氧化硫排放量占工业生产总产量比重 |
| SO2/tio | 2003—2019年工业二氧化硫排放量占工业生产总产量比重差值 | |
| 创新支撑 | S&T/fix | 2003—2019年科学技术支出占财政支出比重差值 |
| Ed/fix | 2003—2019年教育费用支出占财政支出比重差值 | |
| 空间支撑 | TCLKRR-train2019 | 2019年单日城市群内部列车收发频次/单日全国城市群列车收发频次 |
| 邻居效应 | ni-2003 | 2003年邻居高质量发展指数 |
| ni | 2003—2019年邻居高质量发展指数差值 |
注:二三产业协调度差值:先求出“第二产业占GDP比重”与“第二产业从业人员比重”的比值,然后计算“第三产业占GDP比重”与“第三产业从业人员比重”的比值,再求两者之差;绿色全要素生产率采用胡晓珍等[
首先,高质量发展指标体系的过程性因子。前文从经济发展、社会保障、社会公平、成果共享、环境质量、空间联系质量等方面构建评价体系,其相应的过程性因子主要包括经济支撑、保障支撑、环境支撑、创新支撑及空间支撑等方面。① 经济支撑。经济支撑是实现城市高质量发展的核心,在绿色发展理念的支持下,保证经济增长的可持续性、区域产业结构的协调及高级化、较高的市场化程度,以发挥经济支撑在高质量发展中的核心作用。因此,选用“绿色全要素生产率差值”[39]测度绿色发展水平差异,“GDP增速差值”反映城市经济总量的自身增长能力[44],“二三产业协调度差值”[39]“第三产业增长值/第二产业增加值差值”衡量产业协调、产业结构等对俱乐部的影响[10],“市场化指数差值”测度市场化差异的作用[45]。② 保障支撑。作为经济发展的稳定器,保障支撑是支持经济发展成果惠及于民的重要基石,保障支撑的强弱影响社会的稳定,其中,政府的财政行为发挥着重要作用[46],选取“地方一般财政收入占GDP比重”“地方一般财政收入占GDP比重差值”[32]反映保障支撑水平的差异。③ 环境支撑。在经济发展的同时注重生态环境保护是高质量发展的内在要求,选取“工业二氧化硫排放量占工业总产量比重”“工业二氧化硫排放量占工业总产量比重差值”反映环境因素对俱乐部趋同的影响。④ 创新支撑。科学技术的发展和良好的教育能够进一步促进城市创新能力的提升。选取“科学技术支出占财政支出比重差值”“教育费用支出占财政支出比重差值”衡量[47]。⑤ 空间支撑。空间网络是影响城市高质量发展的重要媒介,交通联系是最为直接的体现。选取“单日城市群内部列车收发频次/单日全国城市群列车收发频次”衡量群内城市之间的关联程度[48]。
其次,邻居效应。前文的分析表明高质量发展趋同俱乐部的转移概率与邻居有密切联系,邻居高质量发展水平及其演变将影响城市高质量发展趋同俱乐部的形成[49],选取“邻居高质量发展指数”“邻居高质量发展指数差值”测度。将所选择的指标差值矩阵同高质量发展指数差值矩阵进行QAP相关性检验(图6),其中,GDP-G、CD-Ⅱ and Ⅲ、Value Ⅱ/Ⅲ、gtfp、S&T/fix、ni-2003、ni、TCLKRR-train 2019均通过5%、10%的显著性检验,且均为正相关关系;mi、gtfr/GDP-2003、gtfr/GDP、Ed/fix、SO2/tio-2003、SO2/tio通过5%、10%、15%的显著性检验,基本为负相关关系。说明这些指标的差异缩小会进一步拉大城市高质量发展水平的差距,促进趋同俱乐部的形成。
图6
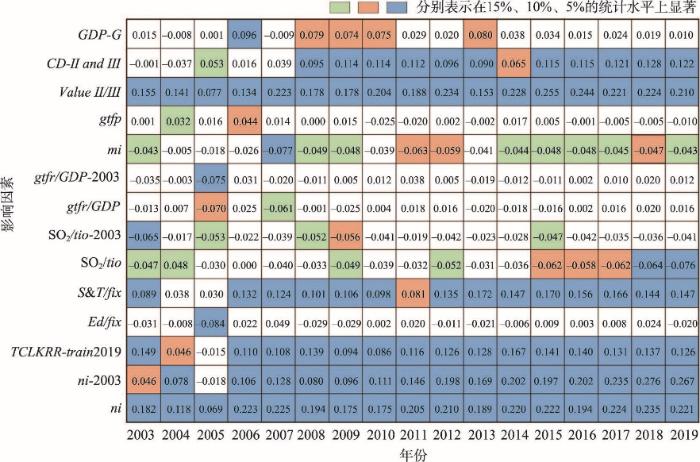
图6
2003—2019年城市群内城市高质量发展影响因素指标差值矩阵QAP相关性分析
Fig. 6
QAP correlation analysis on the difference matrix of influencing factors for high-quality development of cities within urban agglomerations, 2003-2019
在此基础上,采用有序响应Logit模型对选取的14个影响因素进行检验,以城市的趋同俱乐部属性作为被解释变量,即当城市属于低、中低、中等、中高、高等5类趋同俱乐部时,依次将被解释变量赋值为1、2、3、4、5。以表4中的指标作为解释变量,结果如图7所示。从图7可以看出,产业结构是否协调、创新水平高低、邻居效应的强弱、城市群内部关联的强弱等对趋同俱乐部的形成和变迁具有重要影响。低水平、中低水平趋同俱乐部的形成中,CD-Ⅱ and Ⅲ、gtfr/GDP-2003、Ed/fix为正向影响,Value Ⅱ/Ⅲ、gtfr/GDP、S&T/fix、ni-2003、TCLKRR-train 2019为负向影响,因此,对属于这两类趋同俱乐部的城市而言,促进产业结构协调、提高产业高级化水平,并通过技术创新、增加地方财政收入,提升工业生产中污染物排放的治理水平,有利于其打破低水平、中低水平趋同俱乐部的稳定状态,进而使城市向上转移。中等水平趋同俱乐部的影响因素中,选取的14个因素均没有通过显著性检验,说明此类城市相较于其他趋同俱乐部的城市而言转移规律性不强。中高水平、高水平趋同俱乐部的影响因素与低水平和中低水平的类似,然而,因素的作用方向相反。因此,产业高级化水平越高、科技支出越多、财政收入越稳定、邻居效应越强,城市群内部交通网络越密集会使其保持在较高水平的趋同俱乐部中。此外,CD-Ⅱ and Ⅲ、Ed/fix为负向影响,表明产业结构协调度不高及教育支出占比较低将导致较高水平的俱乐部成员向下转移。
图7
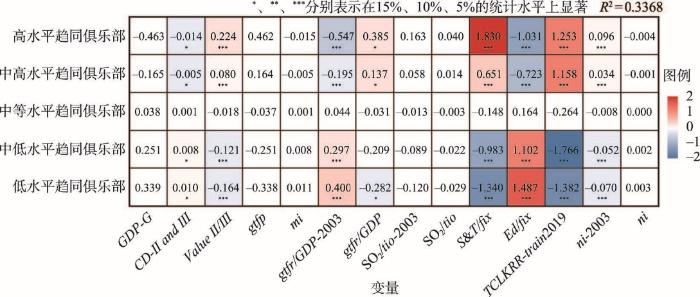
图7
城市群内城市高质量发展趋同俱乐部影响因素检验结果
Fig. 7
Test results of influencing factors for high quality development convergence clubs of cities within urban agglomerations
6 结论及建议
本文基于城市群分析城市高质量发展格局、差异及演变,在识别出5类城市高质量发展趋同俱乐部的基础上,进一步采用有序响应Logit模型探究其形成机理,主要结论为:
(1)城市群内城市高质量发展指数整体上呈现稳定的上升趋势,处于优化提升阶段城市群发展速度最快,指数均值最高;发展壮大阶段城市群发展速度相对缓慢,呈现出两极分化的态势;培育发展阶段城市群,整体水平为3个阶段中最低,呈现出波动式上升的趋势。
(2)城市群内城市高质量发展形成了低水平、中低水平、中等水平、中高水平、高水平等5个趋同俱乐部,且保持在各自现有水平的概率最大,跨等级转移的概率最低,随着时间的推移,更多城市会向更高等级的俱乐部转移。低水平趋同俱乐部城市多分布于培育发展阶段城市群中,集聚在东北、西部内陆地区;属于中低水平、中等水平趋同俱乐部的城市集中分布于华中地区的中原城市群和长江中游城市群,同等水平集聚条件下不易发生转移;属于中高水平趋同俱乐部的城市多与高水平趋同俱乐部城市相邻或集聚;属于高水平趋同俱乐部的城市分布在优化提升阶段城市群中的中心城市以及各城市群的省会城市。同时,城市高质量发展趋同俱乐部的演变与邻居存在密切关系,随着邻居高质量发展指数的提升,低水平和中低水平趋同俱乐部范围收缩,高水平趋同俱乐部范围扩大,向上转移的城市数量增多。
(3)产业结构协调度、财政收入水平、科技创新水平、邻居效应、城市群内部关联等产生的区域差异是城市高质量发展趋同俱乐部形成和变迁的驱动因素,形成了以创新驱动为核心,社会稳定为保障,产业结构协调、邻居效应正向溢出、城市空间关联性强的高质量发展趋同俱乐部驱动体系。
根据本文的研究,提出以下建议:
(1)结合城市群发展实际,形成发展阶段与俱乐部格局均衡的高质量发展体系。处于优化提升阶段的城市群,其成员多属于较高水平的趋同俱乐部,是城市群发展的“高地”。应充分利用其经济发展水平高、产业结构高级、社会保障体系完善、内部网络关联性强的优势,探索高质量发展前沿途径,巩固高质量发展领跑优势,发挥榜样先导作用。处于发展壮大阶段的城市群,应利用其在地理位置或者劳动力红利等方面的优势,积极承接优化发展阶段城市群的产业及技术转移,加强城市间联系,形成优势互补的协同发展模式,以突破现属的俱乐部层次。处于培育发展阶段的城市群,基本位于东北、西部地区,由于高耗能、高污染的重工业在该阶段城市群中的产业结构中占重要地位,应通过产业绿色发展、资源利用效率提升,逐步淘汰落后产能,努力走出一条经济发展与环境保护并重的可持续高质量发展新路径。
(2)为不同类型趋同俱乐部定制高质量发展策略。高水平、中高水平趋同俱乐部的城市为保持其稳定性,一方面应进一步增加财政支出,提升社会保障服务水平,促进产业结构的优化升级,向着集约化、高端化、绿色化方向发展,以获得可持续的内生高质量发展动力;另一方面突出邻居效应的正向溢出,发挥中心城市和省会城市的带动作用,形成城市群内部网络关联节点,以交通网络为要素传导媒介,将要素、机制、规模等优势向周边城市辐射,承担起拉动周边城市向上转移的任务。而低水平、中低水平城市的向上转移,一方面应加快城市基础设施建设,完善交通网络,为承接产业转移奠定基础。此外,扩大用于科技和教育的财政支出,以提升创新水平,增加社会福利,吸引高质量发展必需的高素质人才;另一方面应积极吸收高水平邻居的正向溢出,加强与网络关联节点的“对接”,努力并入要素传导“快车道”,形成城市群内部优势互补的产业合作模式,进一步推动俱乐部成员向上转移。
参考文献
What was the spatiotemporal evolution characteristics of high-quality development in China? A case study of the Yangtze River economic belt based on the ICGOS-SBM model
Research on high-quality development efficiency and total factor productivity of regional economies in China
Different from the developmental mode of western developed countries, China’s economy has changed from a stage of high-speed growth to a stage of high-quality development, where the people’s growing needs for better lives can be met, embodying this new concept of development. The aim of our study is to evaluate the high-quality development efficiency and total factor productivity (TFP) of regional economies in China, and to explore the characteristics of spatial-temporal pattern evolution and their influencing factors. By using the slacks-based measure of directional distance functions (SBM-DDF) model, based on the undesirable output perspective, the high-quality development efficiency and TFP of regional economies in China, from 2000 to 2018, are evaluated in this paper. The exploratory spatial data analysis (ESDA) and Tobit models are then used to identify the spatial-temporal correlation patterns and influencing factors of high-quality development efficiency and TFP. The key results show the following: (1) from 2001 to 2018, the greatest high-quality development efficiency and TFP belonged to China’s eastern region and the least to its central region. (2) U and inverted-U trend lines show that high-quality development efficiency has significant regional difference in the east–west direction, presenting a significant feature of spatial imbalance. (3) Government, urbanization rate, and marketization level play a positive role in their impact of TFP, whereas financial development, infrastructure, foreign direct investment, and capital labor ratio play a negative one.
Spatio-temporal evolution pattern and driving factors of high-quality development of Chinese cities in the new era
DOI:10.11821/dlyj020210719
[本文引用: 3]

High-quality development is the only way to consolidate strategic achievements of building a moderately prosperous society, and to draw up the grand blueprint of basically realizing socialist modernization by 2035 and building China into a great modern socialist country by 2050. In this paper, we study the issue from the city level. Based on the new concept of development, the evaluation system is established. With the help of the vertical and horizontal level division method and fixed-based efficiency coefficient method, high-quality development comprehensive indexes are synthesized. Then, this paper applies spatial auto-correlation analysis, spatial Gini coefficient, Markov transfer matrix, panel regression model to analyze the spatio-temporal evolution pattern and driving factors of high-quality development of Chinese cities in the new era. The results show that: (1) The level of high-quality development of Chinese cities had been continuously optimized from 2012 to 2019, and high-quality development comprehensive indexes of eastern, central, southwestern and northwestern cities continue to increase, while that of northeastern cities first increase and then decrease. (2) In the process of high-quality development, the Yangtze River Delta and Pearl River Delta urban agglomerations are vanguards, urban agglomeration of Ningxia along the Yellow River, rank relatively low, while central-south Liaoning urban agglomeration faces the pressure of declining development quality. (3) The level of high-quality development of Chinese cities decreases from east to west with prominent spatial agglomeration, but the imbalance of high-quality development is alleviated over time. Cities with lower quality status have the power to jump to a higher level. However, the transition becomes more and more difficult. At the same time, there is a risk that the development quality of Chinese cities could be transferred to the lower level. (4) Low altitude, gentle topography, significant industrial agglomeration externality, huge market size, adequate public financial support, continuous and in-depth opening up are the driving forces for high-quality development of Chinese cities. In order to drive high-quality development of Chinese cities, we have responsibilities to implement the new concept of development by advocating innovative development, paying attention to coordinated development, accelerating green development, attaching importance to opening-up development, and promoting shared development. In this process, first-mover cities will play a leading role in propelling high-quality development of later-mover cities, and reshaping Chinese economic geography pattern to achieve “universal boiling” vision.
新时代中国城市高质量发展的时空演进格局与驱动因素
DOI:10.11821/dlyj020210719
[本文引用: 3]
高质量发展是巩固全面建成小康社会战略成果的必由之路,是绘制建设社会主义现代化国家宏伟蓝图的不二法门。本文将研究的空间尺度下移至城市层面,基于新发展理念构建评价体系,合成了高质量发展综合指数,通过空间自相关分析、空间基尼系数、马尔科夫转移矩阵、面板回归模型等统计与计量方法,剖析新时代中国城市高质量发展的时空演进格局与驱动因素。研究表明:① 2012—2019年中国城市高质量发展水平不断提升,其中东部、中部、西南、西北城市高质量发展综合指数持续增加,东北城市则先降后升。② 长三角城市群、珠三角城市群在高质量发展进程中充当了排头兵角色,宁夏沿黄城市群高质量发展排名相对靠后,辽中南城市群面临发展质量下滑的压力。③ 中国城市高质量发展在空间上大体呈现由东向西递减的规律,空间集聚特征突出,但高质量发展失调问题随时间推移得到缓解,低质量、中低质量、中等质量与中高质量状态城市具有向上一等级跃迁的动力,但难度逐级提升。此外,中国城市发展质量存在向下一等级转移的风险。④ 海拔高度、地形地势、产业集聚、市场规模、公共财政、对外开放均能显著影响中国城市高质量发展。为全方位驱动新时代中国城市高质量发展,需贯彻落实新发展理念,发挥先发城市的领头雁作用,带动后发城市高质量发展,通过重塑中国经济地理格局达成“普遍沸腾”的愿景。
The goals and strategic path of high-quality development
高质量发展的目标要求和战略路径
High-quality development of urban agglomerations in China and construction of science and technology collaborative innovation community
DOI:10.11821/dlxb202112003
[本文引用: 1]
China's urban agglomerations are the main area of national new urbanization, the strategic core area of national high-quality development and the responsibility area of carbon neutrality. The science and technology innovation plays an irreplaceable role in realizing the above main goals of urban agglomerations. How to promote China's urban agglomeration to achieve high-quality development and high-level protection of the ecological environment under the new development pattern, and gradually build a world-class urban agglomeration is a realistic problem to be solved. Based on this issue, during the 23rd Annual Conference of the Chinese Association of Science and Technology, with the theme of "Science and technology innovation driving the development of world-class urban agglomerations and the high-quality rise of China's urban agglomerations", the "Regional Collaborative Development Forum and the Second China Urban Agglomeration Development Forum" was specially set up, through systematic discussions of more than 50 well-known experts at home and abroad on urban agglomerations and science and technology collaborative innovation, it is generally believed that the development of global urban agglomerations of China has entered a new era in the 21st century, and the high-quality development of China's urban agglomerations has been promoted to an unprecedented strategic level. However, there are a series of practical problems in the development and planning implementation of urban agglomerations. In the future, the high-quality development of China's urban agglomerations must rely on scientific and technological innovation, and the construction of innovation-driven intelligence, carbon-neutrality, dual circulation and urban-rural integrated urban agglomerations should be the basic direction of high-quality development of China's urban agglomerations. We should further innovate the research work mechanism, establish a collaborative innovation community, and gradually build China's urban agglomerations into world-class urban agglomerations with high-quality development, high-level openness, high-quality life and efficient governance.
中国城市群高质量发展与科技协同创新共同体建设
DOI:10.11821/dlxb202112003
[本文引用: 1]
中国城市群是国家新型城镇化的主体区、国家高质量发展的战略核心区与碳中和的责任区,科技创新驱动对实现城市群的上述主体目标发挥着不可替代的重要作用。如何在新发展格局下依靠科技创新驱动促进中国城市群实现高质量发展和生态环境高水平保护,并逐步建成世界级城市群,是摆在我们面前亟待解决的现实问题。基于这一问题,在第23届中国科学技术协会年会期间,以“科技创新驱动世界级城市群发展与中国城市群高质量崛起”为主题,专门设立了“区域协同发展论坛暨第二届中国城市群发展论坛”,通过应邀的国内外50多位有关城市群及科技协同创新知名专家的系统研讨,普遍认为:全球城市群的发展已进入21世纪的中国新时代,中国城市群高质量发展地位被提升到了前所未有的战略高度,但城市群发展及规划实施中存在着一系列现实问题不容忽视,未来中国城市群高质量发展必须依靠科技创新驱动,把建设创新驱动的智慧型、碳中和型、双循环型和城乡融合型城市群作为中国城市群高质量发展的基本方向。进一步创新研究工作机制,建立协同创新共同体,逐步把中国城市群建成为高水平开放、高质量发展、高品质生活和高效能治理的世界级城市群。
Logic, measurement and governance in China's high-quality economic development
中国经济高质量发展的逻辑、测度与治理
A framework of China's high-quality economic development
高质量发展的内涵研究
High-quality development assessment and spatial heterogeneity of urban agglomeration in the Yellow River Basin
黄河流域城市群高质量发展评估与空间格局分异
Evaluation and prediction of the level of high-quality development: A case study of the Yellow River Basin, China
Spatial pattern and influencing factors of high-quality development of China at the prefecture level
中国地级区域高质量发展格局与影响因素
Evaluation index system of urban agglomeration governance under the background of high-quality development: A case of the Yangtze River Delta
高质量发展背景下城市群治理评价体系构建及应用: 以长三角城市群为例
Spatial disparity and driving factors of green development efficiency in Chinese cities
中国城市绿色发展效率的空间分异及驱动因素
Polycentricity and green development efficiency of urban agglomerations: Spatial distribution of urbanization based on heterogeneity
城市群多中心性与绿色发展效率: 基于异质性的城镇化空间布局分析
Urban green development efficiency and its influencing factors in China based on the undesirable outputs
基于非期望产出的中国城市绿色发展效率及影响因素分析
Calculation and analysis of total factor productivity of China's urban agglomerations: DEA-Malmquist index method based on 2000-2014 data
中国城市群全要素生产率测算与分析: 基于2000—2014年数据的DEA-Malmquist指数法
文章基于中国19个城市群224个作为“区域空间” 的城市2000-2014年的面板数据,在采用不同方法分样本估算城市固定资本存量基础上,使用DEA-Malmquist指数法测算城市(群) TFP变化并进行分解。结果表明:中国城市群整体综合效率提升没有弥补技术进步贡献下降,使平均TFP(全要素生产率)下降但存在时空差异。空间上,西部尤其是西北地区城市群“追赶”效应使地区TFP下降较慢但不均衡性大于东部,综合效率改进从东部到西部依次递增,东部仍然具有技术进步与规模效率的明显优势;时间上,中国城市群TFP于2008年持续下降,西北地区的“追赶” 效应正在消失,但城市群内部空间差异也在波动中减小,尤其是东部。
Public views of the sustainable development goals across countries
DOI:10.1038/s41893-019-0365-4
[本文引用: 1]
The United Nation's 17 Sustainable Development Goals (SDGs) offer an extensive framework for coordinating and shaping government policies, and for engaging the public with sustainability. Public understanding of the SDGs and sustainability can influence this engagement, as people are more likely to accept and share information consistent with their own understanding. We identify public understandings of SDGs through mental maps of how people relate the SDGs to environmental, social and economic sustainability. Using responses from 12 developed/developing countries (n = 2,134), we identified four mental maps that varied mainly on two dimensions, which diverged from some expert models. Some people's mental maps identified tension between achieving environmental versus social sustainability, whereas for others the tension was between economic sustainability and the other two sustainability elements. Some people related different SDGs to each element of sustainability, whereas others saw all SDGs as targeting the same sustainability element(s). These findings highlight opportunities and challenges to engage the public with sustainability more effectively, especially with wide-ranging initiatives such as a Green New Deal. We observed cultural differences but we also identified a dominant mental map across countries that could serve as a default model for communicating sustainability internationally.
Sustainable economies: challenges, transitions and trajectories in spatial perspective
DOI:10.1016/j.apgeog.2018.01.001 URL [本文引用: 1]
Evaluation on high-quality development of Chengdu-Chongqing urban agglomeration
成渝城市群高质量发展水平评价
Evaluation of eco-city under the concept of high-quality development: A case study of the Yangtze River Delta urban agglomeration
DOI:10.13249/j.cnki.sgs.2019.08.004
[本文引用: 2]
Eco-city is an essential form of sustainable urban development and represents the tendency of modern cities. The evaluation of eco-city provides the fundamental basis for the planning, construction and management of eco-city. With the rapid development of social and economic, the connotation and evaluation index system of eco-city also need to update with the times. Currently, China's economy has shifted from a rapid growth stage to a high-quality development stage. Urban is an essential platform of regional economic development, it will also enter the stage of high-quality development. The eco-city is highly compatible with the concept of high-quality development, it is necessary to integrate the high-quality development ideology in the eco-city evaluation, which is in line with the current urban transformation and development requirements of China. Therefore, on the basis of combing the evolution and connotation development of eco-city, we set up an eco-city evaluation system guided by the concept of high-quality development, and then taking the Yangtze River Delta Urban Agglomeration (YRDUA) as an example to carry out the ecological level evaluation study of urban. Thus, the characteristics of spatial-temporal variations of urban ecological level was evaluated and the main obstacle factors was revealed. Based on various statistical data of YRDUA in 2005, 2010 and 2015, 27 indicators for evaluating eco-city that reflects the requirements for high quality development ideology were constructed from three aspects, they are economic development, ecological environment protection and social civilization progress. The entropy-TOPSIS model then analyzed the ecological level of cities, and the major obstacle factors was measured through obstacle degree model. The results showed that: The ecological level of the YRDUA present a steady improvement trend, the urban ecological level spatial pattern of the YRDUA shows a "core-periphery" structure, and it experienced the evolution process of double-high value center in 2005, single-high value center in 2010 and multiple-high value center in 2015. The ecological level of Shanghai municipality, provincial capital cities and other economically-strong cities like Suzhou and Wuxi are significantly better than other cities. There is a significant correlation between ecological level and city hierarchical, which means the urban ecological level is directly proportional to the population scale. The higher the urban hierarchy, the more advantageous the urban construction has, thus the higher the ecological level is. And the ecological level gap of the different urban hierarchy has gradually expanded during the study period. From the perspective of the 3 subsystems, economic development, ecological environment protection and social civilization progress, each city presents different advantages and disadvantages regarding different indicators. Moreover, the difference of ecology level regarding the economy and society are significant than the ecological environment. The obstacle factors of the ecological level of the YRDUA are relatively stable. For most cities, economic development, infrastructure, and public service factors are the primary constraints, especially in cities with relatively backward economic development, while a few economically developed cities have significant obstacles to environmental foundation and social civilization progress. In the future, the differentiated policies deserve much more attention, urban ecological level should promote to higher quality according to local conditions especially its significant constraints.
高质量发展下的生态城市评价: 以长江三角洲城市群为例
DOI:10.13249/j.cnki.sgs.2019.08.004
[本文引用: 2]
以长江三角洲城市群为案例区,运用熵值-TOPSIS模型评价城市生态化水平的变化及差异,运用障碍度模型探究影响城市生态化水平的主要障碍因子。结果表明:长三角城市群生态化水平在稳步提升,城市间生态化水平差异显著并呈扩大趋势;长三角城市群生态化水平在空间上呈现“中心-外围”结构,城市生态化水平与城市规模等级成正比,直辖市、省会城市和经济强市生态化水平要显著优于其他城市;城市在经济、生态环境和社会3个层面指标上的评价得分具有不平衡性,各城市优劣势有所差异,并且经济和社会层面的生态化水平差异大于生态环境层面的差异;对大多数城市而言,经济层面及基础设施、公共服务要素是主要障碍因子。未来生态城市建设应立足城市自身发展状况,因地制宜地提升城市生态化水平,建设高质量生态城市。
Theoretical logic and path selection of high-quality development of urban clusters
城市群高质量发展的理论逻辑与路径选择
Multi-fractal characteristics of spatial structure of urban agglomeration in the middle reaches of the Yangtze River
DOI:10.11821/dlxb202204012
[本文引用: 1]
Nowadays, urban agglomerations are increasingly evolving into multi-scale, interregional complex systems. Therefore, it is necessary to apply a multi-fractal method to analyze the global and local properties of an urban agglomeration. Based on the NPP-VIIRS nighttime light data in 2018, this paper calculates the multi-fractal spectrum of urban agglomeration in the middle reaches of the Yangtze River (MRYR) and its four sub-agglomerations, and then analyzes their multi-fractal properties from the perspective of scale. The main results are as follows: (1) The nighttime light capacity dimensions show that there exists a double-scale phenomenon in the whole study region and its four sub-agglomerations. (2) When q < -5.5, the spectral curves of global fractal dimension surpass the upper limit of fractal dimension; when q > 0, the nighttime light fractal dimensions of the Wuhan and Changsha-Zhuzhou-Xiangtan (Chang-Zhu-Tan) sub-agglomerations are obviously higher. (3) The spectral curves of local fractal dimension of three sub-agglomerations of Wuhan, Poyang Lake, Chang-Zhu-Tan and Yichang-Jingzhou-Jingmen show that the peaks of the f (α) curves incline to the right, and the right ends of the curves are higher than the left ends. According to the above results, we can draw some conclusions: (1) The regional integration level of the whole study area was relatively low. (2) There was a differentiated spatial structure in different scales and regions, characterized as multiscale and complex features. (3) The whole urban agglomeration and its four sub-agglomerations tend to develop in a centralized manner. From the perspective of multi-scale interaction, this study proves the multi-fractal model is competent for detecting the complex spatial structure and the underlying problems of mega-urban agglomeration. The multi-fractal model has the potential for further theoretical exploration and practical analysis.
长江中游城市群空间结构的多分形特征
DOI:10.11821/dlxb202204012
[本文引用: 1]
在城市群越来越演化为多尺度、多区域复杂系统背景下,有必要引入多分形理论与方法研究其空间结构。本文基于2018年NPP-VIIRS夜间灯光数据,计算长江中游城市群整体及其局部的多分维谱,根据谱线分析不同尺度下长江中游城市空间结构的多分形特征。结果显示:① 长江中游城市群夜间灯光容量维在整体和局部都出现双标度现象。② q < -5.5时,整体广义关联维谱线突破理论上限2,在q > 0时,武汉城市圈和环长株潭城市群的分维显著较高。③ 整体的局部分维谱和武汉城市圈、环长株潭城市群、环鄱阳湖城市群、宜荆荆城市群局部分维谱表现为单峰偏右。根据上述结果,得到和验证了以下结论:① 长江中游城市群区域一体化程度较低。② 长江中游城市群不同层级和区域的空间结构差异显著,呈现出多尺度复杂特征。③ 长江中游城市群在不同尺度中均倾向于中心集聚式发展。研究揭示多分形模型能够从尺度依赖视角有效揭示巨型城市群空间结构的复杂性及其背后的问题,具有很好的理论探索和实践分析前景。
Research on the measurement of the high-quality development level of China's urban agglomerations and its temporal and spatial convergence
中国城市群高质量发展水平测度及其时空收敛性研究
Research on the distribution dynamics, regional differences and convergence of China's high-quality economic development
中国经济高质量发展的分布动态、地区差异与收敛性研究
The spatio-temporal evolution and mechanism of the coordination between quality and quantity of economic growth in Chinese urban agglomerations
DOI:10.13249/j.cnki.sgs.2021.12.001
[本文引用: 1]
The aticle sets urban agglomerations which the Chinese 13th Five-year Plan outline referred to as the research objects, respectively from the economic efficiency, economic structure, economic stability, economic development potential, results distribution, resources and environment, the welfare of the people’s livelihood seven dimensions of urban agglomeration economy growth quality characterization, from growth rate of GDP and per capita GDP of two dimension depicting economic growth to build a comprehensive index system. Using the methods of entropy value method, coupling coordination model, geodetector and so on, we analyze the coupling coordination between quality and quantity of economic growth in China from 2006 to 2018 and its interaction mechanism. The results showed that: 1) As for the overall level, the coordination degree between quality and quantity of economic growth in China's urban agglomerations is low, and shows a downward trend; 2) In terms of the spatial pattern of coordination degree, the spatial pattern of the quality of economic growth with the quantity of economic growth and the speed of economic growth showed a trend of “high in the east and low in the west” and remained relatively stable, but the spatial pattern of coordination degree of the quality and scale of economic growth changed greatly; 3) In terms of coordination types, the “quantity lag” type distributed sporadically, the “scale lag” type is concentrated in the central and western regions, the “speed lag” type is expanded in the northeast, and the “quality lag” type showed diversity due to the different coordination objects; 4) The coordination among the quality of economic growth and the scale of economic growth and speed of economic growth shows a feature of not accordance; 5) The analysis of mutual coordination mechanism shows that the welfare of the people’s livelihood, economic development potential and per capita GDP have a significant and important influence on the improvement of the coordination level of economic growth quality and quantity in 19 China’s urban agglomerations; 6) It explains the key measures to be taken by different coordinated urban agglomerations, so as to help the high-quality economic development of 19 China’s urban agglomerations.
中国城市群经济增长质量与数量协调关系的时空演化与机理
DOI:10.13249/j.cnki.sgs.2021.12.001
[本文引用: 1]
以中国“十三五”规划纲要提及的19个城市群为研究对象,分别从经济效率、经济结构、经济稳定性、经济发展潜力、成果分配、资源环境、民生福利7个维度刻画城市群经济增长质量,从GDP增长率和人均GDP两个维度刻画经济增长数量以构建综合指标体系,运用熵值法、耦合协调模型、地理探测器等方法,剖析2006—2018年中国城市群经济增长质量与数量的耦合协调关系及其相互作用机理,研究结果表明:① 总体协调水平上,中国城市群经济增长质量与数量的协调度较低,且呈下降趋势;② 协调度空间格局上,经济增长质量与增长数量、增长速度的空间格局呈现“东高西低”的趋势,且保持相对稳定,但经济增长质量与增长规模的协调度空间格局差异较大;③ 协调类型上,“数量滞后”型呈零星分布,“规模滞后”型向中西部集聚,“速度滞后”型向东北拓展,“质量滞后”型表现出多样性特征;④ 经济增长质量与规模、速度的协调关系表现出不一致的特征;⑤ 相互协调机理分析发现,民生福利、经济发展潜力、人均GDP对中国城市群经济增长质量与数量协调水平的提升具有显著影响。⑥ 针对不同协调类型的城市群应分别采取相应举措以助力中国城市群经济高质量发展。
Research on the Hubei high-quality development comprehensive evaluation under the background of supply side structural reform based on the weighted factor analysis
供给侧改革背景下湖北高质量发展综合评价研究: 基于加权因子分析法的实证研究
Research on the characteristics of spatial network structure of the Yangtze River Delta urban agglomeration
长三角城市群空间网络结构特征研究
Probe into the assessment indicator system on high-quality development
高质量发展评价指标体系探讨
Has the great recession affected the convergence process? The case of Spanish provinces
DOI:10.1016/j.econmod.2017.08.006 URL [本文引用: 1]
Regional convergence of social and economic development in the districts of West Bengal, India: Do clubs exist? Does space matter? An empirical analysis using DLHS I-IV and NFHS IV data
DOI:10.1007/s40847-020-00094-1 [本文引用: 1]
Testing club convergence of economies by using a broad-based development index
DOI:10.1007/s10708-020-10198-0 [本文引用: 1]
Regional well-being and its inequality in the oecd member countries
DOI:10.1007/s10888-021-09521-7 [本文引用: 1]
Characteristics of comprehensive evaluation of time and space in the transformation of China's economic development mode
DOI:10.13249/j.cnki.sgs.2020.02.007
[本文引用: 3]
The 19th National Congress pointed out that "China's economy has shifted from a high-speed growth stage to a high-quality development stage", indicating that the transformation of the economic development mode is the only way for China's economy to shift from high-speed growth to high-quality development, and must shift from scale to quality. Based on the core concept of high-quality economic development, this article constructs a five-dimensional economic development mode transformation evaluation index system including economic growth kinetic energy conversion, structural optimization, green development, stable opening and population development. Firstly, the article analyzes the transformation level of economic development mode in China and various provinces from 1987 to 2017 by using the "transverse and horizontal extension method", and then explores its temporal and spatial characteristics by ESDA method. The main conclusions are as follows: 1) China's economic development mode changes overall level. It is on an upward trend year by year, especially after the growth of many provinces in 2012, but the development gap between regions is large. 2) In the five dimensions reflecting the transformation of economic development mode, the population development is better; The economic structure optimization is steadily advancing; the green development shows a trend of deterioration and improvement; the economic stability and opening up ability is steadily rising; the economic growth kinetic energy conversion is poor, but The fluctuations slightly increased. 3) The spatial differentiation is obvious, and the level of China's economic development mode has generally shown a trend of decreasing the gradient in the inland hinterland with the eastern region as the core. 4) A more obvious global spatial positive correlation is presented, and the local spatial mainly forms high and low agglomeration types, and there is a relatively obvious interaction relationship. The policy enlightenment is: 1) Establish the "five developments" concept, reduce environmental pollution through structural upgrading, and accelerate the formation of new development kinetics with science and technology innovation as the core. We will work hard to implement the people-centered development thinking and continuously improve the level of social security and welfare. 2) Play the leading role of the eastern region, increase the investment of funds, technology and talents needed for the western region, and gradually narrow the difference in the economic development mode between the eastern and western regions. 3) It is necessary to fully consider the dynamic evolution of time and space in the transformation of different provincial economic development modes. Based on this, several suggestions are proposed to promote the transformation of China's economic development mode in the new era.
中国经济发展方式转变综合评价及时空演化特征研究
DOI:10.13249/j.cnki.sgs.2020.02.007
[本文引用: 3]
基于经济高质量发展的核心理念,构建包含经济增长的动能转换、结构优化、绿色发展、稳定开放、人口发展的五维经济发展方式转变评价指标体系。运用“纵横向拉开档次法”对中国及各省域1987~2017年的经济发展方式转变水平进行综合评价,利用ESDA法对其时空特征进行探索,研究表明:① 中国经济发展方式转变水平整体呈逐年上升趋势,特别是2012年后很多省域增速明显,但地区间发展差距较大。② 反映经济发展方式转变的5个维度中,人口发展较好;经济结构优化稳步推进;绿色发展呈现先恶化后改善的趋势,但正成为主导转变的核心动力之一;经济稳定开放能力平稳上升;经济增长动能转换较差,但在呈波动中略上升。③ 空间分异明显,中国经济发展方式转变水平总体呈现出以东部地区为核心、逐步向内陆腹地区域梯度递减的趋势。④ 呈现出较明显的全局空间正相关性,局部空间上主要形成高高和低低集聚类型,存在较明显的交互影响关系。据此提出几点促进新时代中国经济发展方式转变的建议。
Network association, spillover effect and China's regional economic growth based on Tencent's location big data
DOI:10.13249/j.cnki.sgs.2019.09.002
[本文引用: 2]
Based on population mobility data between all prefecture-level cities in China acquired from Tencent mobile phone locations, this article examines the evolution of the spatial correlation model of China's prefecture-level economic growth under the population mobility network. And the spatial spillover effect of economic growth among these cities is also measured in this article by utilizing the network analysis method. The main conclusions obtained in this article are: 1) The construction of the spatial weight matrix should be based on the data that characterizes the interaction and degree between regions. The spatial weight matrix that conforms to reality should be asymmetric and change with the modifying of interaction. 2) Factors such as population mobility networks that interact with prefecture-level cities play an important role in the spillover of economic growth. China's prefecture-level cities show a more obvious ‘center-periphery’ structure. Five central cities: Beijing, Shanghai, Guangzhou, Shenzhen and Chengdu form five fulcrums from north to south and from east to west. The prefecture-level cities with which these five cities have population relationships are concentrated in the eastern and central regions in terms of spatial distribution, and slightly less in the west and northeast. Meanwhile, sub-central prefecture-level cities have formed a hexagonal population mobility network pattern from northeast to southwest. Changchun, Lanzhou, Hangzhou, Dongguan, Nanning and Kunming are vertices of this network. Population mobility is very frequent in this hexagon network and is relatively infrequent outside this hexagon. 3) Network growth effect is an important factor in the economic growth of prefecture-level cities. Using the population mobility network, the population factor has a negative network spillover effect, while foreign direct investment has a positive spillover effect on economic growth. The population factor also has a negative spillover effect on local economic growth, while the fixed asset investment and total retail sales of consumer goods have a significant positive spillover effect, if the geographical proximity network and geographical distance network are used. Finally, according to the research in this article, the policy recommendations are proposed to narrow the economic differences between prefecture-level cities and to achieve coordinated development.
网络关联、空间溢出效应与中国区域经济增长: 基于腾讯位置大数据的研究
DOI:10.13249/j.cnki.sgs.2019.09.002
[本文引用: 2]
以腾讯公司根据手机位置得到的中国地级及以上城市之间人口流动数据为基础,考察人口流动网络下地级市经济增长的空间关联模式及其演变,结合网络分析方法,测度地级市间经济增长的空间溢出效应。主要结论有:① 符合现实的空间权重矩阵应该是非对称的,且随着互动关系的改变而发生变化。② 人口流动网络等反应地级市之间互动的因素在经济增长空间溢出中发挥了重要作用。③ 基于网络的空间溢出效应是地级市经济增长的重要因素。
A study on the model of economic growth convergence in developing regions: An Empirical analysis from Henan province, China
DOI:10.1007/s00181-019-01640-5 [本文引用: 2]
China's urban agglomeration and metropolitan area construction under the new development pattern
DOI:10.2307/141854 URL [本文引用: 1]
新发展格局下的中国城市群与都市圈建设
Measurement of high-quality development of the Yangtze River Economic Belt
基于“五大发展理念”的长江经济带高质量发展测度
Does national high-tech zone promote the transformation and upgrading of China's industrial structure
国家高新区推动了中国产业结构转型升级吗
An empirical research on industry structure and economic growth
我国产业结构高级化与经济增长关系的实证研究
Measurement and comparison of high- quality development of world economy
世界经济高质量发展水平的测度及比较
Comprehensive evaluation and impact mechanism of high-quality development of China's resource-based cities
DOI:10.11821/dlxb202110011
[本文引用: 1]
Promoting the transformation, upgrading, and high-quality development of resource-based cities is a key point to achieve high-quality development in China. The comprehensive evaluation of the high-quality development of resource-based cities and the analysis of its influence mechanism can not only enrich the relevant theoretical research, but also have important practical significance. Based on Marxist political economy, this paper reviews and analyzes the theoretical framework of high-quality development in the new era, and systematically constructs the index system of high-quality development of resource-based cities. On this basis, the high-quality development level of 117 resource-based cities is comprehensively estimated, and its influence mechanism is analyzed. The results show the following. (1) From 2005 to 2017, the high-quality development level of resource-based cities continued to grow, showing a significant spatial distribution pattern of "relatively high in the east, but relatively low in the west and northeast". (2) The cities with higher and lower high-quality development levels have obvious regional agglomeration characteristics, but the local imbalance of high-quality development level intensifies, and the phenomenon of spatial polarization continues to expand. (3) The high-quality development level of cities in different growth stages is quite different. Among them, the high-quality development level of regenerative cities is the highest, while that of declining cities is the lowest. (4) The distance between resource-based cities and provincial capital cities or municipalities directly under the central government, natural factors (such as location, and altitude of cities), and the open time of cities have an important impact on the high-quality development level of resource-based cities.
中国资源型城市高质量发展综合评估及影响机理
DOI:10.11821/dlxb202110011
[本文引用: 1]
促进资源型城市转型升级与高质量发展,是中国全面实现高质量发展的难点和重点。对资源型城市高质量发展水平进行综合评估并分析其影响机理既能丰富相关理论研究,也具有重要的实践意义。基于马克思主义政治经济学,梳理和分析了新时代高质量发展的理论框架,系统构建了资源型城市高质量发展的指标体系,在此基础上综合测算了中国117个资源型城市的高质量发展水平,并深入分析了其影响机理。结果表明:① 2005—2017年资源型城市高质量发展水平持续增长,整体呈现显著的“东部相对较高、西部相对较低”的分布格局。② 高质量发展水平较高和较低的城市具有明显的区域集聚特征,但高质量发展水平局部不平衡性加剧,空间极化现象持续扩大。③ 不同成长阶段的城市高质量发展水平存在较大差别,其中,再生型城市高质量发展水平最高,而衰退型城市高质量发展水平最低。④ 资源型城市与省会城市或直辖市的距离、区位和海拔、城市的开放时间等均对资源型城市高质量发展水平有重要影响。
A measurement and comparative analysis of high-quality economic development of Chinese urban agglomerations
中国城市群经济高质量发展测算及差异比较分析
Study on the spatial correlation and explanation of regional economic growth in China: Based on analytic network process
中国区域经济增长的空间关联及其解释: 基于网络分析方法
Convergence test and coordinated development of China's regional economic growth under the background of different spatial network
不同空间网络关联情形下中国区域经济增长的收敛检验及协调发展
Measurement and analysis of high-quality economic development in cities above prefecture level
全国地级以上城市经济高质量发展测度与分析
A comparative study on the high-quality development of economy in the border areas of China
中国沿边省区经济高质量发展水平比较研究
Coupling coordination of economic growth, industrial development and ecology in the Yellow River Basin
黄河流域经济增长—产业发展—生态环境的耦合协同关系
Spatial-temporal pattern and obstacle factors of urban residents' quality of life in the Yellow River Basin under the background of high-quality development
DOI:10.13249/j.cnki.sgs.2021.08.001
[本文引用: 1]
Improving urban residents’ quality of life is an important goal and concrete embodiment of achieving high-quality development in the Yellow River Basin.This article constructs an evaluation index system of urban residents of quality of life from 4 aspects (residents’ life, infrastructure, public service and ecological environment), and measures the level of urban residents’ quality of life in the Yellow River Basin in 2004-2018. The kernel density estimation, ESDA and Dagum Gini coefficient are used to analyze the spatial and temporal pattern of residents’quality of life and measured the spatial difference. The obstacle factor diagnosis model is used to analyse the obstacle factors of residents’ quality of life. The conclusions are as follows: 1) From 2004 to 2018, the areas with high quality of life of urban residents in the Yellow River basin gradually transferred from the lower reaches to the middle and upper reaches; 2) The H-H agglomeration areas of urban residents’quality of life in the Yellow River Basin are mainly in Inner Mongolia Autonomous Region, and the L-L agglomeration areas are mainly in Henan Province, Shandong Province and Shanxi Province; 3) The spatial difference of the quality of life of urban residents in the Yellow River Basin is mainly the contribution of the net value difference between regions from the upper, middle and lower scales, and the contribution of the regional difference from the left and right bank scales; 4) The obstacles to urban residents’ quality of life in the Yellow River Basin are mainly the amount of water resources per capita, the number of mobile phone users at the end of the year, the area of parks and green space per 10 000 persons, the proportion of education expenditure in fiscal expenditure, the road area per 10 000 persons, and the per capita disposable income, etc. Therefore, we must pay attention to the ecological environment protection, especially the rational utilization of water resources, improvement of urban infrastructure and public service levels in the future high-quality development.
高质量发展目标下黄河流域城市居民生活质量的时空格局及障碍因子
DOI:10.13249/j.cnki.sgs.2021.08.001
[本文引用: 1]
提高居民生活质量是实现黄河流域高质量发展的重要目标和具体体现。从居民生活、基础设施、公共服务、生态环境4个方面构建城市居民生活质量评价指标体系,测度2004―2018年黄河流域城市居民生活质量水平,利用核密度估计、ESDA、Dagum基尼系数等方法进行居民生活质量时空格局分析及空间差异测度,并运用障碍因子诊断模型分析影响居民生活质量水平的障碍因子,得出如下结论:① 2004―2018年黄河流域城市居民生活质量高水平区域从下游城市逐渐转移到中上游城市;② 黄河流域城市居民生活质量高-高集聚区主要是内蒙古自治区及相邻区域的城市,低-低集聚区主要是河南省、山东省以及山西省的部分城市;③ 黄河流域城市居民生活质量水平的空间差异从上中下游尺度看主要是区域间净值差异贡献,从左右岸尺度看主要是区域内部差异贡献;④ 黄河流域城市居民生活质量水平的障碍因子主要是人均水资源量、移动电话年末用户数、每万人公园绿地面积、教育支出占财政支出比重、每万人拥有的道路面积与人均可支配收入等,因此在未来的高质量发展中要注重生态环境保护,特别是合理利用水资源,完善城市基础设施与提升公共服务水平。
Urban spatial network characteristics from the perspectives of reality and virtual flow in Northeast China
基于现实与虚拟流视角下的东北地区城市空间网络特征
Analyzing regional economic growth club convergence in China based on the perspective of spatiotemporal coupling
基于时空耦合视角的中国区域经济增长俱乐部趋同分析
Analysis of growth differences and convergence of regional green TFP in China
中国区域绿色全要素生产率增长差异及收敛分析
