

摘要:把握民生发展水平的空间分异演变规律对新时代协同区域民生发展、促进共同富裕具有重要的理论和实践意义。本文运用定基极差熵权法、标准差椭圆、核密度估计和空间Markov链、时空地理加权回归等方法,研究2010—2021年中国民生发展水平的空间演变及影响机理。结果表明:① 2010—2021年中国民生发展水平大幅提升,四大区域呈东部>中部>西部>东北依次递减特征;民生发展水平空间依赖关系增强,具有明显的高值簇和低值簇集聚特征,长三角和京津冀地区形成了稳定的热点区,四川形成了稳定的冷点区。② 中国民生发展水平的重心由东北向西南方偏移,空间方向性增强;全国和四大区域民生发展水平的空间差异性逐渐增强,且全国和西部存在极化趋势;民生水平等级空间转移方向受到邻近省份的影响。③ 经济、科技、人口老龄化、财政分权对民生产生了正向作用,城镇化为负向效应,且5个因素的影响具有空间分异特征。
1 引言
消除贫困、改善民生,实现共同富裕是社会主义的内在要求。中国共产党始终将发展和改善民生作为立党为公、执政为民的重要目标和价值追求。党的历次重要会议均明确了民生建设的方向和目标。中国共产党“十七大”提出民生建设的“五有”概念,提出努力使全体人民学有所教、劳有所得、病有所医、老有所养、住有所居;中国共产党“十八大”强调要在民生“五有”上持续取得新进展;中国共产党“十九大”在民生“五有”的基础上,创新性地增加了“幼有所育”“弱有所扶”,强调要在民生“七有”上不断取得新进展;中国共产党“二十大”报告辟专章论述“增进民生福祉,提高人民生活品质”,以不断实现人民对美好生活的向往为目的,坚持在发展中保障和改善民生。“十四五”规划和2035年远景目标纲要更是绘制了新发展阶段民生事业发展的新蓝图,要增加人民群众的“三感”,主动缩小区域差距。随着一系列推动民生建设的政策落地,中国的民生项目和范围不断扩展,民生厚度日趋增强,民生水平和质量大幅提高。截至2020年底,中国已消除绝对贫困全面建成了小康社会,并建成了世界上规模最大的社会保障、教育和医疗卫生体系[1]。2021年年末中国的基本养老保险参保人数达到102872万人,基本医疗保险参保人数为136424万人,参保率达到96.6%。学前教育毛入学率大幅提升至88.1%,城镇新增就业年均超过1300万人。但不可忽视的是,中国民生领域短板也不少,区域发展和收入分配差距依然较大,群众在就业、教育、医疗、居住、养老等方面面临不少难题[2],民生发展不平衡不充分的矛盾突出[3],东中西部民生保障和改善还存在梯级差距[4],这将成为制约中国持续改善民生、实现共同富裕的重要因素。那么,中国民生的空间分异呈现出怎样的特征?其空间演变态势如何?哪些因素导致了民生发展空间分异的演化?等等,厘清这些问题,对于新时代协同区域民生发展、促进共同富裕具有重要的理论和实践意义。
2 文献综述
“民生”是中国独有的概念和话语体系[5]。国内针对民生问题的研究可分为理论性和实证性两类。
2.1 关于民生问题的理论性讨论
理论性研究主要集中在民生的内涵与外延、民生建设的理论基础、理论发展和创新、民生建设成就和缘由、解决和改善民生的对策等方面。
对民生概念的清晰理解和准确表述,是研究民生问题的基本前提。民生的理解有广义和狭义之分。狭义上的民生概念主要是指民众的基本生存和生活状态,以及民众的基本发展机会、能力和权益保护的状况[4]。民生是一个扬弃福利及福祉的范畴,它描述了民众的生活状态,体现社会生活的总体要求,蕴含着社会治理规范,寄托着人们的生活理想[5]。广泛意义上的民生不仅包括公民的生计与生活,还包括公民的政治、文化和精神需求以及公民的生命、健康和尊严价值等内容[6]。民生不再局限于物质层面,而是上升为以物质层面为基础、以精神层面为支撑、以制度层面为保障的系统工程[7]。它是最广大人民群众的生存权、发展权和享受权,体现在人民的物质生活、政治生活、文化生活、社会生活中[8]。民生作为一种实践,有其理论基础和理论依据。学界普遍认为,中国传统文化的民本思想与马克思主义的人民观是当代中国民生理论的基本源头[9],具有丰富内涵的马克思主义民生思想理所当然地成为新中国民生建设的重要理论基础[10]。中国共产党“十八大”以来,党中央提出了一系列适应新时代中国民生发展的新思想、新论断和新观点,实现了新时代中国特色社会主义民生建设的重要理论创新[11-12]。建党百年来,中国民生建设取得了巨大的成就,主要表现在民生保障法治体系与制度体系不断完善、基本公共服务均等化深入推进、公共服务支出不断增长[13]、“幼有所育、学有所教、劳有所得、病有所医、老有所养、住有所居、弱有所扶”不断取得新进展[14]、人人享有基本民生保障成为现实[13]。中国民生事业百年辉煌成就,背后体现的是党对民生问题内在规律和每个阶段历史格局的精准把握[15],成功的重要原因在于遵循了理论、实践、文化三重逻辑[16],坚持了经济发展和民生改善的良性循环[17]。解决民生问题应该重点加强基础性、普惠性、兜底性民生建设,努力使全体公民学有所教、劳有所得、病有所医、老有所养、住有所居[18],坚持“发展共享、创新推动、绿色环保、保障兜底”的系统思维[19],做到民生建设普惠性与差别性、发展性与共建性、公平性与补偿性相统一[20],促进民生建设与经济发展的良性循环,为民生保障的高质量、可持续发展提供坚实的经济基础[21]。
2.2 关于民生问题的实证性讨论
民生问题的实证性研究主要集中在民生发展水平的测度、区域差距及影响因素等方面。在测度民生发展水平时,选用的方法主要有熵权法[22-23]和线性加权法[24]。因学者对民生的内涵和外延的理解不同,同时由于时效性、数据可得性等原因,学者们构建民生发展水平的指标体系存在很大差异。如高和荣等从消费水平、社会保障、文化教育、就业与培训、公共安全、公共医疗卫生、公共基础设施7个维度选取25个指标构建基本民生发展水平的指标体系[22]。陈明华等基于经济发展、人民生活、社会发展、生态建设、科技创新5个维度选取了21项指标作为城市民生的评价指标体系[23]。范如国等从收入与支出、社会保障、生活环境3个维度选取14个重要指标建立民生指数综合评价体系[24]。在研究中国民生发展差距及影响因素时,学者们通常运用Dagum基尼系数[22-23]、泰尔指数[25]、方差分解法[23]等方法,分析中国民生发展水平的区域差距、发展趋势及民生发展差异的结构来源;运用空间面板回归[22]、QAP回归[23]、地理加权回归[26]、地理探测器[25]等方法考察中国民生发展差异的影响机理或因素。
综上,民生问题的研究已成为理论界的热门话题,并且关于民生问题的理论性研究内容相当广泛,这给本文提供了重要的文献研究基础。但从研究现状来看,民生的理论性远强于实证性研究。民生问题既是一个理论问题,也是一个实践问题。理论与实践相结合,首要的是要强化实证研究法[9]。而实证类研究目前多聚焦于城市的民生发展水平,未将农村纳入进来,或是虽考虑了农村的情况,但未考虑到民生的层次性。鉴于此,本文运用定基极差熵权法测度2010—2021年中国民生发展水平,运用标准差椭圆、核密度估计法和空间马尔可夫链等方法识别民生发展水平的演化过程及其规律,并构建空间计量模型和时空地理加权回归模型分别从全局和局域层面探究和识别其驱动因素,从而为政府制定补齐民生短板、解决民生发展的不平衡不充分问题的政策提供重要的理论依据。
本文的边际贡献体现在3个方面:① 以统筹城乡的视角,遵循数量和质量的统一,从民生“七有”维度构建民生发展水平的指标体系;② 运用定基极差熵权法测算民生发展水平,既可以对不同地区的民生发展水平进行横向对比,也可以实现同一地区的纵向比较,从而克服了熵权法只能判断民生发展水平相对地位的不足;③ 探究民生发展水平空间分异的影响因素,在进行空间计量回归得到全局回归系数的基础上,运用时空地理加权回归(GTWR)得到一系列随时空变化而影响不同省份民生发展水平的回归系数,从而使研究结果更符合实际情况。
3 研究设计
3.1 民生发展水平指标体系
构建合理的指标体系是客观评价民生发展水平的前提。在对民生问题的理论性和实证性文献充分梳理的基础上,基于对民生内涵和外延的理解,遵循全面性、科学性和可行性原则,本文以中国共产党“十九大”报告提出的“民生七有”作为准则层,选取46个具体指标构建民生发展水平指标体系(表1)。
表1 中国民生发展水平的指标体系
Tab. 1
| 目标层 | 准则层 | 维度 | 具体指标 | 权重 | 指标属性 |
|---|---|---|---|---|---|
| 民生 发展 水平 | 幼有 所育 | 数量 | 幼儿园入园率(%) | 0.011 | + |
| 幼儿园数量(所) | 0.008 | + | |||
| 学前教育班数量(个) | 0.008 | + | |||
| 生育保险覆盖率(%) | 0.008 | + | |||
| 质量 | 乡村幼儿园占幼儿园比例(%) | 0.011 | + | ||
| 幼儿园生师比(教师=1) | 0.010 | - | |||
| 学有 所教 | 数量 | 中等职业学校初中应届生入学率(%) | 0.005 | + | |
| 普通高中入学率(%) | 0.008 | + | |||
| 本地大学录取人数/本地高中毕业人数(%) | 0.007 | + | |||
| 少年儿童读物出版种数(种) | 0.018 | + | |||
| 人均拥有公共图书馆藏量(册) | 0.014 | + | |||
| 一般公共预算教育经费占一般公共预算支出比例(%) | 0.015 | + | |||
| 质量 | 小学生师比(教师=1) | 0.006 | - | ||
| 初中生师比(教师=1) | 0.007 | - | |||
| 高中生师比(教师=1) | 0.010 | - | |||
| 大学生师比(教师=1) | 0.030 | - | |||
| 劳有 所得 | 数量 | 失业保险覆盖率(%) | 0.029 | + | |
| 工伤保险覆盖率(%) | 0.042 | + | |||
| 城镇居民登记失业率(%) | 0.017 | - | |||
| 城镇居民人均可支配收入(元) | 0.007 | + | |||
| 农村居民人均纯收入(元) | 0.006 | + | |||
| 社会保障就业支出占GDP比例(%) | 0.016 | + | |||
| 质量 | 城乡居民收入差距(元) | 0.029 | - | ||
| 城镇居民家庭恩格尔系数 | 0.033 | - | |||
| 农村居民家庭恩格尔系数 | 0.015 | - | |||
| 病有 所医 | 数量 | 每万农村人口村卫生室数(个) | 0.042 | + | |
| 每千人口卫生技术人员数(个) | 0.042 | + | |||
| 每千人口执业(助理)医师(个) | 0.032 | + | |||
| 社会医疗卫生总支出占GDP比例(%) | 0.021 | + | |||
| 质量 | 病床利用率(%) | 0.021 | + | ||
| 居民年住院率(%) | 0.017 | - | |||
| 甲乙类法定报告传染病发病率(%) | 0.023 | - | |||
| 老有 所养 | 数量 | 城镇职工基本养老保险覆盖率(%) | 0.024 | + | |
| 城镇职工基本养老保险基金累计结余(亿元) | 0.030 | + | |||
| 城乡居民基本养老保险基金累计结余(亿元) | 0.010 | + | |||
| 城镇居民人均领取养老金额(元) | 0.016 | + | |||
| 城乡居民人均领取养老金额(元) | 0.041 | + | |||
| 质量 | 每千老年人拥有养老机构/社会养老床位数(个) | 0.033 | + | ||
| 弱有 所扶 | 数量 | 最低生活保障人数占比(%) | 0.031 | - | |
| 城市居民最低生活保障人均支出(元) | 0.073 | + | |||
| 农村居民最低生活保障人均支出(元) | 0.009 | + | |||
| 质量 | 农村最低生活保障救助标准占农村居民人均消费支出比例(%) | 0.038 | + | ||
| 城镇最低生活保障救助标准占城镇居民人均消费支出比例(%) | 0.053 | + | |||
| 住有 所居 | 数量 | 住房保障支出(亿元) | 0.021 | + | |
| 住宅商品房平均销售价格/人均收入 | 0.022 | - | |||
| 质量 | 房租年均涨幅(%) | 0.027 | - |
3.2 测算民生发展水平的方法
为对不同地区的民生发展水平进行纵横向比较,本文运用定基极差熵权法测算中国民生发展水平。其计算步骤如下[27]:
式中:
3.3 测算民生发展水平空间演变的方法
民生发展水平空间演变表现为方向分布、空间扩张和收缩趋势,针对这些特征,分别运用标准差椭圆(SDE)、核密度估计和空间Markov链方法进行辨识。
3.3.1 标准差椭圆
标准差椭圆是通过长短轴、中心坐标、转角、面积等主要要素的变化揭示要素空间分布特征。本文运用标准差椭圆揭示中国民生发展水平的空间演变方向偏差过程。标准差椭圆计算公式如下[28]:
式中:
3.3.2 核密度估计
式中:
3.3.3 空间Markov链
运用空间马尔可夫链矩阵转移方法分析在加入空间滞后条件后民生发展水平空间状态的转移。民生发展水平马尔可夫链矩阵转移估算方法为[31]:
引入“空间滞后”作为邻里条件后,将k×k维的马尔可夫矩阵分解为k个k×k条件转移概率矩阵,构建空间Markov链,以揭示中国民生发展水平的空间状态的转移概率和特征。
3.4 数据来源
以中国31个省(市、自治区)的民生发展水平为研究对象,由于数据统一性原因,暂未含香港、澳门和台湾地区。此外,对于四大区域覆盖的省份,本文按照国家统计局的划分方法,东、西、中部和东北地区包括的省份分别为10个、12个、6个和3个 ( 西部地区包括四川、云南、甘肃、陕西、西藏、新疆、贵州、内蒙古、宁夏、广西、重庆和青海;中部地区包括湖南、安徽、江西、山西、河南和湖北;东北地区包括黑龙江、辽宁和吉林;东部地区包括山东、河北、浙江、海南、广东、福建、江苏、天津、上海和北京。)。数据来源于《中国教育统计年鉴》(2011—2022)、《中国卫生健康统计年鉴》(2011—2022)、《中国统计年鉴》(2011—2022)以及各省、市、自治区统计年鉴。
4 结果与分析
4.1 中国民生发展水平的总体趋势和空间分布特征
4.1.1 民生发展水平大幅提升,四大区域呈东部>中部>西部>东北依次递减特征
2010— 2021年中国民生发展水平指数由0.286上升到0.863,12年间上升幅度达201.4%,年均增速10.55%,这说明中国的民生建设成效显著,民生水平大幅提高(图1)。民生发展水平指数的最高点出现在2019年,这之前民生发展指数逐年上升,2019年之后逐年下降到2021年。2021年相对2020年下降幅度达8.21个百分点,一个很重要的原因在于受疫情冲击,经济增长受到影响,财政收入增速放缓,不可避免地影响到民生建设支出。
图1
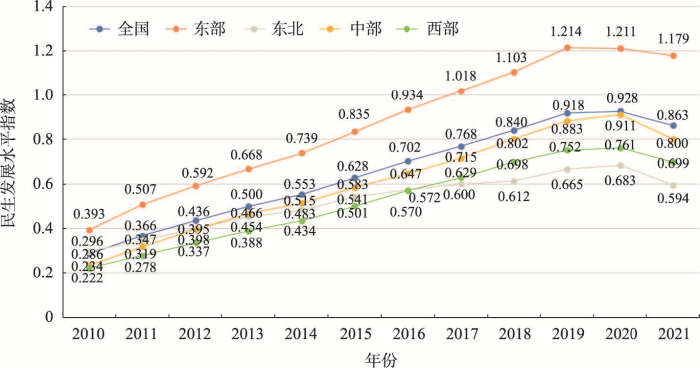
图1
2010—2021中国民生发展水平指数趋势
Fig. 1
The trend of Chinese people's livelihood development index, 2010-2021
从四大区域来看,2010—2021年东、中、西和东北地区民生发展水平指数分别由0.393、0.234、0.222、0.296上升到1.179、0.800、0.699、0.594,年均增速分别为10.50%、11.85%、11.0%、6.53%。从民生发展水平的发展趋势来看,中西部和全国保持一致,2010—2019年呈现稳定上升的态势,2020年达到高点后开始下降。东部地区高点出现在2019年,之后逐年下降到2021年。东北地区2010—2011年在中西部之上,但在2012年开始落后于中部地区,2017年开始被西部地区超越,此后一直处于最末位。12年间四大区域民生发展水平指数由大到小为东—中—西—东北,这说明民生发展水平从整体上呈现出“东部—中部—西部—东北”依次递减的状态。东部地区经济实力强,财政收入雄厚,有足够的资金用于民生建设,从而能始终保持民生发展之强势。中部地区民生发展大有追赶东部之势,可能的原因在于中部崛起战略和“一带一路”倡议的实施,促进了中部6省与多个国家区域重大战略联动,在全面深化改革开放中,不断被赋予新动能,社会发展成就显著,带动民生发展水平稳步提高。
2014年鲁、冀、浙、粤、苏进入高水平等级,高水平等级省份增加到8个,占东部省份的80%。这一时期中部地区民生发展态势好,6省全部由较低水平进入中等及以上水平。其中鄂、皖为较高水平,湘鄂赣晋为中等水平。西部地区和东北地区中等水平以下省份的数量增加,内部出现较大的差距,四川为较高水平,青、甘、云和贵为低水平等级。2018年较低和低水平主要分布在东北和西部地区,黑、吉由较低进入低水平行列。晋、陕、内蒙古由中等下降为较低水平等级,宁夏由较低向下进入低水平。高水平省份由6个减到5个,京、鲁、苏、沪和粤为高水平。冀和浙分别向下转化到中等和较高水平行列。2021年高水平省份减少到4个,即京、沪、苏和鲁,浙江退出高水平行列。中等水平省份数由5个增加到10个,中部6省份均属于中等水平区。高水平省份数量进一步减少到3个,广东由高水平向下进入较高水平。总体上来看,11年间京沪始终为民生发展高水平等级,中高水平以北京和上海为中心向周围扩散,宁夏始终为低水平地区。
从民生发展水平的增长率来看,增长率包括正、负两个方向,运用自然间断点分级法对正向和负向值分别进行分类,2014年,31省份全部为正向增长,具体分为低速、中速和高速。2018年除了吉林为-0.66%的外,其他省份为正向增长,西藏以45%的增长速度位于首位,安徽(23.6%)和河南(15.34%)增速分别位于第2和第3位。2021年除了北京、上海、浙江和西藏外,其他27省份为负向增长,负向高增长有辽宁、河南、广西、广东、贵州和湖南(图2)。
图2
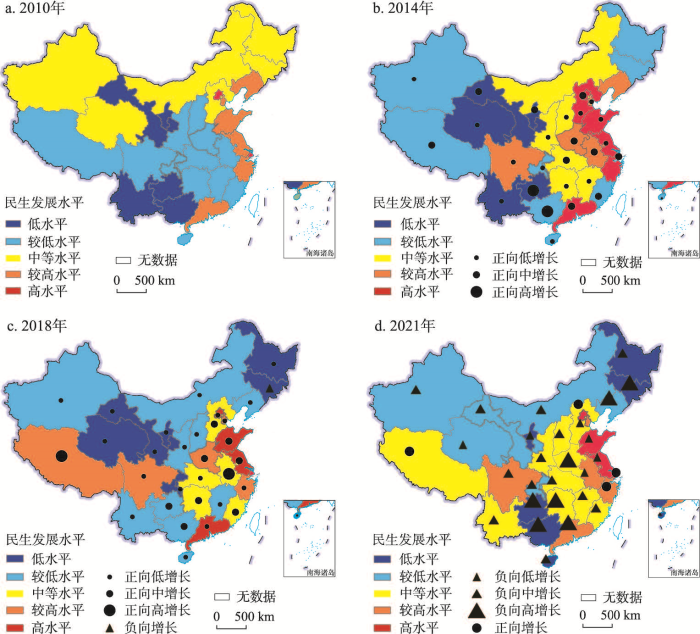
图2
2010—2021年中国民生发展水平分省时空分布
注:基于自然资源部标准地图服务网站GS(2019)1825号标准地图绘制,底图边界无修改,下同。
Fig. 2
Spatial and temporal distribution of Chinese people's livelihood development level, 2010-2021
4.1.2 民生发展水平空间依赖关系强,呈高值簇和低值簇集聚特征
运用公式(6)和(7)计算2010—2021年中国民生发展水平系数的全局Moran's I,结果显示各年份指数在0~1之间,Z值大于1.96的下限,并通过显著性水平检验(表2),说明中国民生发展水平在全域有显著的空间正相关,呈现出相似值集聚的空间分布格局。特别是在2018年之后,全局Moran's I总体有增大趋势,说明中国民生发展的空间依赖关系增强,具有明显的高值簇和低值簇集聚特征。
表2 中国民生发展水平系数的全局Moran's I估计值
Tab. 2
| 年份 | Moran's I | Z值 | P值 |
|---|---|---|---|
| 2010 | 0.244 | 3.607 | 0.000 |
| 2011 | 0.251 | 3.662 | 0.000 |
| 2012 | 0.268 | 3.886 | 0.000 |
| 2013 | 0.236 | 3.469 | 0.001 |
| 2014 | 0.199 | 3.004 | 0.003 |
| 2015 | 0.211 | 3.171 | 0.002 |
| 2016 | 0.245 | 3.613 | 0.000 |
| 2017 | 0.273 | 3.976 | 0.000 |
| 2018 | 0.303 | 4.358 | 0.000 |
| 2019 | 0.264 | 3.901 | 0.000 |
| 2020 | 0.286 | 4.274 | 0.000 |
| 2021 | 0.311 | 4.588 | 0.000 |
利用Getis-Ord Gi*指数识别中国民生发展水平系数的高值簇和低值簇集聚区,即冷热点区。由图3可见,2010年民生发展水平的热点区分布在辽宁、山东、京津冀地区和长三角地区,冷点区分布在四川、重庆、广西、云南和贵州等西南地区。2014年民生发展水平在山东、河南、京津冀地区和长三角地区形成热点区,冷点区分布在东北的辽宁和吉林,冷点区由西南收缩,并向西北扩散,最终在甘肃、青海、四川和重庆形成冷点区。2018年民生发展水平沿东部沿海地区向中部扩散,热点省份由9个省份增加到12个省份。热点地区包括山东、河南、湖北、江西、福建、京津冀地区、长三角地区。冷点区域进一步收缩,只有甘肃和四川2个省份。2021年热点地区和冷点地区均呈现出收缩的特征,其中冷点区仅有四川省,湖北和江西退出热点区。这一时期,民生发展水平的热点区有山东、河南、山西、福建、京津冀地区和长三角地区。总体来看,研究期内,民生发展水平在长三角和京津冀地区形成了稳定的热点区,在四川形成了稳定的冷点区。
图3
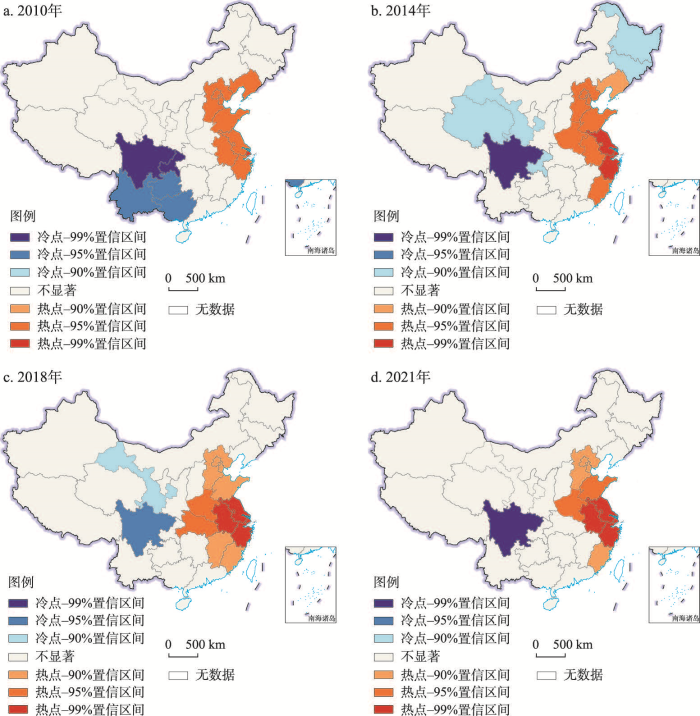
图3
2010—2021年中国民生发展水平的冷热点分布
Fig. 3
Distribution of hot and cold spots of Chinese people's livelihood development level, 2010-2021
4.2 中国民生发展水平空间演变过程
4.2.1 民生发展水平重心由东北向西南方偏移,空间方向性有增强趋势
图4为中国民生发展水平标准差椭圆。2010—2021年民生发展水平重心呈现向西南、东南方交替移动的趋势,移动范围在112.30°E~113.10°E和33.31°N~34.06°N之间,移动距离6.76~26.01 km之间,这表明随时间的推移,西南和东南方的民生建设相对好于西北和东北方。
图4
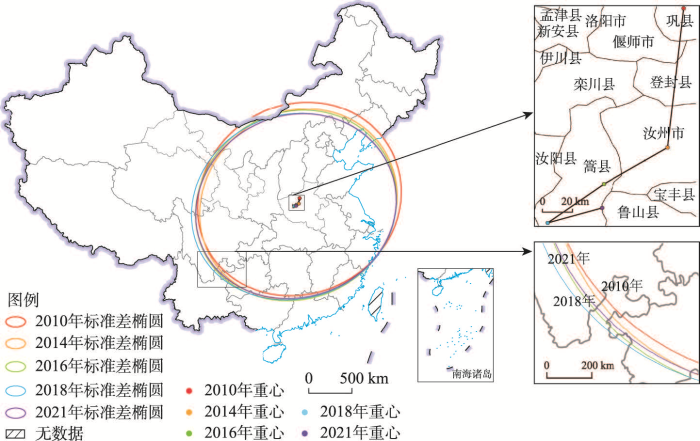
图4
2010—2021年中国民生发展水平的标准差椭圆及重心迁移
Fig. 4
Standard deviation ellipse and the focus shifts of Chinese people's livelihood development level, 2010-2021
具体来看,研究期内民生发展水平的重心从巩县转移至篙县,途中经过登封县和汝州市,但重心均位于河南省。重心转移路径从东南(2010—2011年)→西南(2011—2012年)→西北(2012—2013年)→西南(2013—2018年)→东南(2018—2020年)→东北(2020—2021年),总共向西南方向偏移6次,向东南方向偏移3次,向西北方向偏移1次,向东北方向偏移1次。2010—2017年长半轴的距离由1162.49 km减少到1143.34 km,短半轴的距离由1033.94 km减少到1015.18 km,长短半轴的差距由128.55 km减少到128.16 km,表明中国民生发展水平空间分布向心力增强。2017—2021年长半轴的距离由1143.34 km减少到1139.92 km,短半轴的距离由1015.18 km减少到994.67 km,长短半轴的差距由128.16 km增加到145.25 km,表明中国民生发展水平空间方向性增加。标准差椭圆的旋转角呈不规则变化,旋转角范围为75.56°~78.21°,旋转角最小和最大的年份分别出现在2014年和2018年,但阶段性变化与长短半轴差距有较大的相似性。结合中国民生发展指数的空间格局来看,中国民生发展的高值区集中在东部与东南部,该类地区市场经济发达、经济规模大、财政收入丰盈,民生建设的物质基础雄厚,从而使其民生“七有”建设不断取得突破。东北地区经济经历了2003—2012年的“黄金十年”之后,创新、改革的动力相对不足,经济急速下滑,教育、医疗、社保、住房等民生状况与东中部的差距扩大。而随着中国对西部地区和区域协调发展的重视,国家从政策、资源和资金多方面支持西部地区的就业、教育、养老、医疗等领域的建设,有力地促进了西部地区的民生建设,提高了民生发展水平。同时必须注意的是,尽管西部地区的民生发展水平相对自身有了很大的提升,但与东中部地区依然存在差距。
4.2.2 民生发展水平空间差异性逐渐增强,且全国和西部存在极化趋势
图5
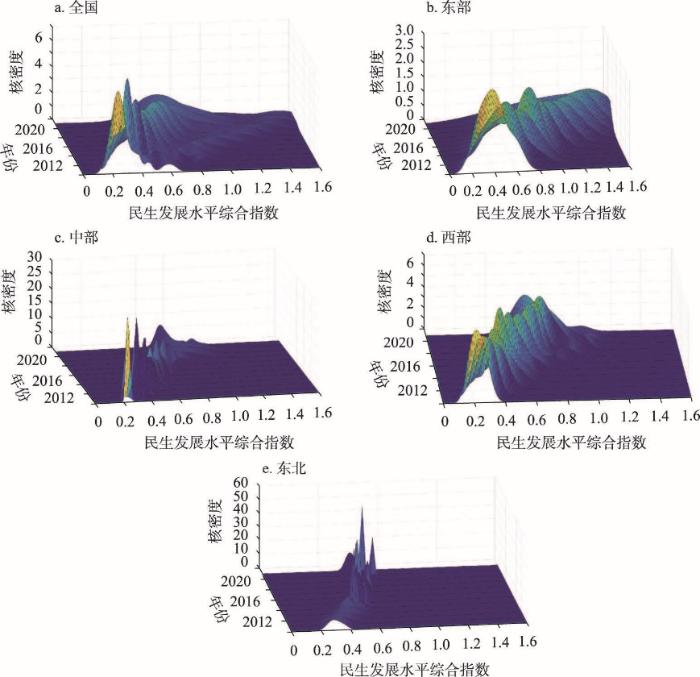
图5
2010—2021年中国民生发展水平空间分异的核密度图
Fig. 5
Kernel density of spatial differentiation of Chinese people's livelihood development level, 2010-2021
具体来看,全国层面研究期内波峰个数为2个或以上,曲线呈现“双峰”形态或“多峰”形态,说明全国民生发展水平存在极化趋势(表3)。次峰峰值明显低于主峰峰值,主峰波峰高度持续下降,由高而窄持续变为矮而宽,说明全国民生发展水平的空间差异性和分散性逐渐增强,存在显著的空间非均衡性特征。核密度曲线右尾拉长,意味着全国范围内民生发展水平不均衡性增加。区域层面西部地区核心密度曲线波峰高度逐年下降,说明随时间推移,12省份的民生发展水平不均衡性增加。波峰在2014年开始由先前的“单峰”形态转为“双峰”形态,左侧的主峰远高于右边的次峰,表明低水平省份多于高水平省份的数量,且存在极化趋势;东北地区核密度曲线的波峰高度在2010—2018年之间大幅度上升,表明期间东北3省民生发展差距显著缩小,2018年波峰高度小幅下降,3省份之间的差距有所增大,波峰形态为“双峰”形态,这说明存在极化现象;中部地区核密度曲线在2010—2018年间大幅右移,表明这期间中部地区民生发展势头强劲,民生发展水平大幅提高,2018—2021年核密度曲线小幅右移,说明民生发展水平仍然在提高,但边际增长率在递减。核密度曲线大部分年份只有1个波峰,不存在左右拖尾,说明中部地区内部民生发展呈现均衡性趋势,且不存在极化现象;东部地区波峰高度逐年下降,核密度曲线扁而宽,说明各省民生发展水平差异程度变大。波峰形态主要为1个波峰的“单峰”形态,说明不存在极化现象。分布曲线的波峰逐渐移到曲线的右侧,“左拖尾”趋势明显,曲线宽度逐年扩大,说明东部地区民生高水平区的省份数量增多,东部10省表现出不均衡性,但梯度差异程度不断缩小。
表3 2010—2021年中国民生发展水平系数的核密度估计
Tab. 3
| 地区 | 曲线位置 | 波峰形态和数量 | 延展性 | 极化情况 |
|---|---|---|---|---|
| 全国 | 右移 | 1主峰1次峰,宽度变宽 | 右拖尾,延展拓宽 | 有极化情况 |
| 西部 | 右移 | 双峰,宽度变宽 | 右拖尾,延展拓宽 | 有极化情况 |
| 东北 | 右移 | 1主峰1次锋,宽度变宽 | 无拖尾 | 有极化情况 |
| 中部 | 右移 | 1个主峰,宽度变宽 | 无拖尾 | 无极化情况 |
| 东部 | 右移 | 1个主峰,宽度变宽 | 左拖尾,延展拓宽 | 无极化情况 |
4.2.3 民生发展水平空间转移方向受邻近省份的影响,具有与邻近省份相似的发展趋势
表4为中国民生发展水平的马尔可夫转移概率矩阵,对角线上的元素表示民生发展水平类型没有发生变化的概率,而非对角线上的元素则表示不同类型之间发生转移的概率,在未考虑空间依赖关系情况下,中国民生发展水平类型转移在对角线上的数值均远大于非对角线上的数值,表明其发展具有很强的稳定性,且各省市的低水平、较低水平、中等水平、较高水平和高水平等级在下一期维持不变的概率分别为86.36%、69.15%、70.24%、72%和93.62%,特别是高水平和低水平区空间格局呈现更稳定的特征,说明全国范围内存在富者更富、穷者更穷的“马太效应”。同时,转移概率等于0的元素均远离矩阵主对角线,可以看出民生发展水平会在相邻类型之间发生递次转移,而跨等级转移的可能性非常小。
表4 民生发展水平系数的马尔可夫转移概率矩阵
Tab. 4
| 类型 | 低水平 | 较低水平 | 中等水平 | 较高水平 | 高水平 |
|---|---|---|---|---|---|
| 低水平(66) | 0.8636 | 0.1364 | 0 | 0 | 0 |
| 较低水平(94) | 0.0851 | 0.6915 | 0.2128 | 0.0106 | 0 |
| 中等水平(84) | 0.0119 | 0.1786 | 0.7024 | 0.1071 | 0 |
| 较高水平(50) | 0 | 0 | 0.1800 | 0.7200 | 0.1000 |
| 高水平(47) | 0 | 0 | 0 | 0.0638 | 0.9362 |
表5为考虑空间依赖关系后民生发展水平的马尔可夫链转移矩阵。由表5可知,区域背景影响某地区的民生发展水平空间转移方向,低水平的“邻居”会使本地区的民生发展水平境遇变差,而以高水平为邻,会使本地区的境遇变好。如区域背景为低水平的情况下,较低水平区下一期维持现状的概率增加到100%,比未考虑空间依赖关系时高出30.85%。区域背景为中等水平的情况下,较低水平区下一期维持现状的概率减少到60%,比未考虑空间依赖关系时低近10%,而向中等水平转移的概率增加到30%,比未考虑空间依赖关系时高出8.72%。区域背景为较高水平的情况下,中等水平区向较高水平转移的概率增加到20.83%,比未考虑空间依赖关系时高出10.12%。由此可见,减少和消除民生发展水平的空间分异,很重要的一点是要深入实施区域协调发展战略,在发展中促进省际之间的相对均衡。
表5 民生发展水平指数的空间马尔可夫转移概率矩阵
Tab. 5
| 滞后类型 | 类型 | 低水平 | 较低水平 | 中等水平 | 较高水平 | 高水平 |
|---|---|---|---|---|---|---|
| 低水平 | 低水平(0) | 0 | 0 | 0 | 0 | 0 |
| 较低水平(3) | 0 | 1.0000 | 0 | 0 | 0 | |
| 中等水平(0) | 0 | 0 | 0 | 0 | 0 | |
| 较高水平(0) | 0 | 0 | 0 | 0 | 0 | |
| 高水平(0) | 0 | 0 | 0 | 0 | 0 | |
| 较低 水平 | 低水平(43) | 0.9302 | 0.0698 | 0 | 0 | 0 |
| 较低水平(40) | 0.0500 | 0.7750 | 0.1500 | 0.0250 | 0 | |
| 中等水平(14) | 0.0714 | 0.2143 | 0.5714 | 0.1429 | 0 | |
| 较高水平(10) | 0 | 0 | 0.2000 | 0.7000 | 0.1000 | |
| 高水平(5) | 0 | 0 | 0 | 0 | 1.0000 | |
| 中等 水平 | 低水平(18) | 0.7222 | 0.2778 | 0 | 0 | 0 |
| 较低水平(30) | 0.1000 | 0.6000 | 0.3000 | 0 | 0 | |
| 中等水平(44) | 0 | 0.2045 | 0.7500 | 0.0455 | 0 | |
| 较高水平(5) | 0 | 0 | 0.4000 | 0.6000 | 0 | |
| 高水平(3) | 0 | 0 | 0 | 0.3333 | 0.6667 | |
| 较高 水平 | 低水平(0) | 0 | 0 | 0 | 0 | 0 |
| 较低水平(18) | 0.0556 | 0.6667 | 0.2778 | 0 | 0 | |
| 中等水平(24) | 0 | 0.0833 | 0.7083 | 0.2083 | 0 | |
| 较高水平(30) | 0 | 0 | 0.1667 | 0.7000 | 0.1333 | |
| 高水平(24) | 0 | 0 | 0 | 0.0833 | 0.9167 | |
| 高水平 | 低水平(5) | 0.8000 | 0.2000 | 0 | 0 | 0 |
| 较低水平(3) | 0.6667 | 0.3333 | 0 | 0 | 0 | |
| 中等水平(2) | 0 | 0.5000 | 0.5000 | 0 | 0 | |
| 较高水平(5) | 0 | 0 | 0 | 1.0000 | 0 | |
| 高水平(15) | 0 | 0 | 0 | 0 | 1.0000 |
注:通过Queen相邻的空间关系计算得到地区的空间滞后项。
图6为中国分省的民生发展水平指数的空间转换可视化图。2010—2017年民生发展水平等级向上转移的省份为8个,向下转移的为8个,等级不变的为15个。向上转移的省份主要分布在东部地区,向下转移的省份分布在东北和西部地区。2017—2021年东北和东部地区民生发展水平等级比较稳定,等级发生向上转移主要分布在中部和西部地区。
图6
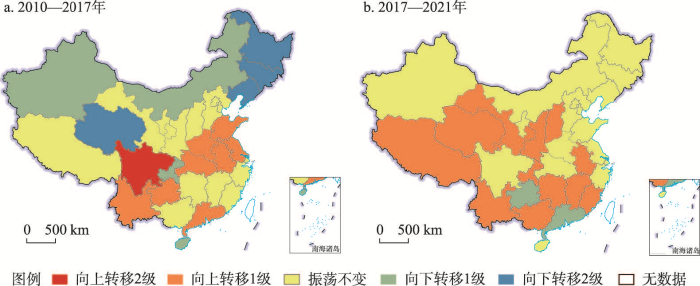
图6
2010—2021年中国民生发展水平马尔可夫链的空间转移情况
Fig. 6
Spatial shift of Markov chain of Chinese people's livelihood development level, 2010-2021
5 民生发展水平空间分异的影响机理
5.1 变量与模型构建
表6 变量说明
Tab. 6
| 变量 | 名称 | 符号 | 定义 | 单位 |
|---|---|---|---|---|
| 被解释变量 | 民生发展水平综合指数 | score | 民生发展水平综合得分 | - |
| 解释变量 | 人均GDP | avegdp | 地区国内生产总值/总人口 | 万元/人 |
| 城镇化率 | urban | 城镇人口占常住人口比例 | % | |
| 人口密度 | density | 地区总人口/地区总面积 | 万人/km2 | |
| 人均R&D经费 | avescience | R&D经费支出/地区总人口 | 万元/人 | |
| 老年人口抚养比 | old | 老年人口/劳动年龄人口 | % | |
| 科学技术占财政支出比重 | govscience | 地方科学技术支出/地方财政总支出 | % | |
| 财政分权度 | fiscal | 地方财政总支出/全国财政总支出 | % |
5.2 模型的设定
空间计量回归模型可以从全局上识别中国民生发展水平的影响程度,且考虑了空间自相关性问题。由于本文使用的是省际面板数据,故构建包含截面和时间序列的面板数据模型。为控制个体与时间异质性对回归结果带来的影响,本文对个体及时间固定效应分别加以控制。基准面板分析模型设定如下[32]:
式中:
第四部分内容分析表明,中国民生发展水平存在明显的空间自相关性,同时考虑到民生发展水平的积累效应,在基准回归的基础上,分别构建空间面板滞后、误差和杜宾模型:
式中:W为空间权重矩阵;其余参数的解释与式(13)相同。
空间计量回归参数能从全域层面探究对民生发展水平的影响因素,但是所估计参数是一个不变的常数,且隐含了空间均质性假设,这与中国民生发展水平的空间异质性不完全相符。故本文在空间计量回归的基础上进一步构建时空地理加权回归模型(GTWR)探究不同影响因子的空间异质性。模型如下[33]:
式中:
5.3 经济、科技、人口老龄化、财政分权对民生发展水平产生正向作用,城镇化为负向影响
表7 基准回归与相关统计检验结果
Tab. 7
| 变量 | 混合回归 | 空间固定 | 时间固定 | 时间和空间双固定 |
|---|---|---|---|---|
| Constant | -0.3376***(-7.9614) | - | - | - |
| avegdp | 0.0570***(11.0123) | 0.0872***(10.5022) | 0.0336***(9.2364) | 0.0270***(4.2127) |
| urban | 0.3866***(8.4156) | 0.8931***(5.0050) | 0.2141***(6.8247) | -0.2156(-1.5639) |
| density | -0.5420***(-3.5714) | -0.8442(-0.2931) | 0.2515**(2.3318) | 2.6181(2.3763) |
| avescience | 2.0868***(3.4749) | 0.2074***(0.2434) | 1.3048***(3.3099) | 1.3541**(2.3763) |
| old | 0.0222***(11.0769) | 0.0230**(7.6104) | 0.0033*(1.9451) | 0.0087***(3.0430) |
| govscience | -0.0008***(-0.0715) | 0.0293***(2.0509) | 0.0103(1.3898) | 0.0562(0.61069) |
| fiscal | 7.2728***(10.2856) | 1.2100***(0.3999) | 7.8869***(16.8523) | 7.6337***(3.8919) |
| R2 | 0.8156 | 0.8130 | 0.8454 | 0.3725 |
| LM(lag) | 239.1416*** | 263.5411*** | 9.3331*** | 33.0013*** |
| Robust-LM(lag) | 109.8029*** | 128.7680*** | 11.5334*** | 16.6657*** |
| LM(sem) | 178.2678*** | 149.4310*** | 0.0244 | 18.5474*** |
| Robust-LM(sem) | 48.9292*** | 14.6579*** | 2.2246 | 2.2118 |
| 空间和时间固定效应联合显著性检验 | LR统计量 | 自由度 | P值 | |
| 时间固定 | 1015.67 | 12 | 0.0000 | |
| 空间固定 | 45.04 | 31 | 0.0494 | |
| 时间、空间双固定 | 442.01 | 31 | 0.0000 |
注:*、**、***分别表示在10%、5%和1%的显著水平下显著;括号内为t值。
空间滞后模型是否为最终分析模型,还需要对空间杜宾模型的适用性进行判断,如果Wald检验通过显著性检验,则空间杜宾模型为最优模型。反之,若未通过显著性检验,则空间滞后模型为最终模型。结果表明,Wald检验统计量值为41.16,通过1%的显著性检验,故本文适合采用时空双固定的空间面板杜宾模型作为最终分析模型,回归的相关参数见表8。
表8 空间面板杜宾模型的直接效应和间接效应
Tab. 8
| 直接效应 | 间接效应 | 总效应 | ||||||
|---|---|---|---|---|---|---|---|---|
| 参数 | t值 | 参数 | t值 | 参数 | t值 | |||
| avegdp | 0.0283*** | 4.7698 | 0.0025 | 0.1294 | 0.0307** | 1.4452 | ||
| urban | -0.4058*** | -3.3046 | -1.2983 | -1.5177 | -1.7565** | -1.8981 | ||
| density | 2.2918 | 1.3674 | 3.9158 | -1.749 | 6.20756 | 1.1645 | ||
| avescience | 2.0957*** | 1.9648 | 7.276* | 3.8434 | 2.9385 | 1.6226 | ||
| old | 0.0087*** | 3.006 | 0.0195** | 1.8237 | 0.0280 | 2.2684 | ||
| govscience | 0.0033 | 0.3762 | 0.0449 | 0.5537 | 0.04813 | 1.4768 | ||
| fiscal | 8.1665*** | 4.7296 | 38.623*** | 4.2397 | 46.790*** | 4.7134 | ||
| Time | 控制 | 控制 | 控制 | 控制 | 控制 | 控制 | ||
| Region | 控制 | 控制 | 控制 | 控制 | 控制 | 控制 | ||
| R2 | 0.9671 | 0.9671 | 0.9671 | 0.9671 | 0.9671 | 0.9671 | ||
注:*、**、***分别表示在10%、5%和1%的显著水平下显著。
5.3.1 经济发展显著地促进民生发展水平
表征经济发展的人均GDP的直接效应的回归系数为0.0283,通过1%的显著性检验,说明人均GDP每提高1万元,本地区民生发展水平指数提高0.0283。经济发展是做大蛋糕的问题,而民生具有分蛋糕的属性,只有蛋糕做大了,才可能水涨船高分得更多的蛋糕,经济发展是改善民生的基础和前提。从实际情况来看,改革开放以来,中国经济发展是创造奇迹的过程,也是民生发展建设不断取得新突破的过程,经济发展带来丰盈的财政收入,国家财力的日益壮大,为民生建设提供了坚实的财力保障。
5.3.2 城镇化推进过程中产生的各种问题抑制民生发展水平
表征城镇化水平的城镇化率的直接效应回归系数为-0.4058,通过1%的显著性检验,说明城镇化率每提高1%,本地区民生发展水平指数降低0.4058。1978年改革开放以来,中国的城镇化经历大规模快速发展过程,城市群、中小城市和小城镇加速发展,成为推动经济发展和社会进步的基本动力。但实证检验表明研究期内中国的城镇化对民生发展并未发挥正向激励作用,可能的原因在于城镇化在快速推进过程中,人口城镇化滞后于土地城镇化,公共服务的供给跟不上迅速膨胀的人口的需求,形成房价偏高、交通拥堵、学校数量不足等各种“城市病”。
5.3.3 科技成为民生发展水平的强劲引擎
表征科技发展的人均R&D经费的直接效应回归系数为2.0957,通过1%的显著性检验,说明人均R&D经费投入每增加1万元,本地区民生发展水平指数提高2.0957。科技用于民生改善,可以降低成本、提高效益,破解教育、养老、医疗、就业等方面的难题。近十年来中国坚持科技为民,强化科技研发的民生导向,不断释放科技红利,降低了医疗、教育、社会保障管理等方面的成本,造福千家万户,实现改善人民生活质量的目的。人均R&D经费的间接效应回归系数为7.276,通过1%的显著性检验,说明人均R&D经费投入每增加1万元,周边地区民生发展水平指数提高7.276,科技的发展对周边地区产生了空间溢出效应。
5.3.4 人口老龄化对民生发展水平具有正向促进作用
表征人口老龄化程度的老年人口抚养比的直接效应回归系数为0.0087,通过1%的显著性检验,说明老年人口抚养比每提高1%,本地区民生发展水平指数提升0.0087。老年人口抚养比是反映人口老龄化的指标,人口老龄化一方面给公共服务供给、社会保障制度可持续发展带来挑战,但同时也有可能倒逼经济转型升级,增添促进发展的新动力,不断健全养老服务体系和医疗保险体系,使得养老和就业环境处于改善和完善过程中,并形成与之相关的产业链条,增加就业岗位,从而促进民生建设。
5.3.5 财政分权能显著地提高民生发展水平
表征财政自主权的财政分权度直接效应的回归系数为8.1665,通过1%的显著性检验,说明财政分权度每提高1%,本地区民生发展水平指数提升8.1665。其原因在于财政收支转移的过程可能会促进地方政府间的竞争,提高资源的配置效率,促进经济增长,从而创造更多的税源用于民生建设。同时,财政分权的提升使地方政府能更加有效地调配公共资源,从而促进民生福祉的改善。财政分权度间接效应的回归系数为38.623,通过1%的显著性检验,说明财政分权度对周边地区产生了空间溢出效应。
5.4 经济、科技、人口老龄化、财政分权对民生发展水平的影响具有空间分异特征
为进一步考察中国民生发展水平影响因素的空间分异,本文运用时空地理加权回归模型对上文通过显著性检验的5类因素进行回归分析,并运用ArcGIS绘制历年分布图(受限于篇幅,只展示2010年和2021年),考察这5类因素的作用机理变迁(图7)。
图7
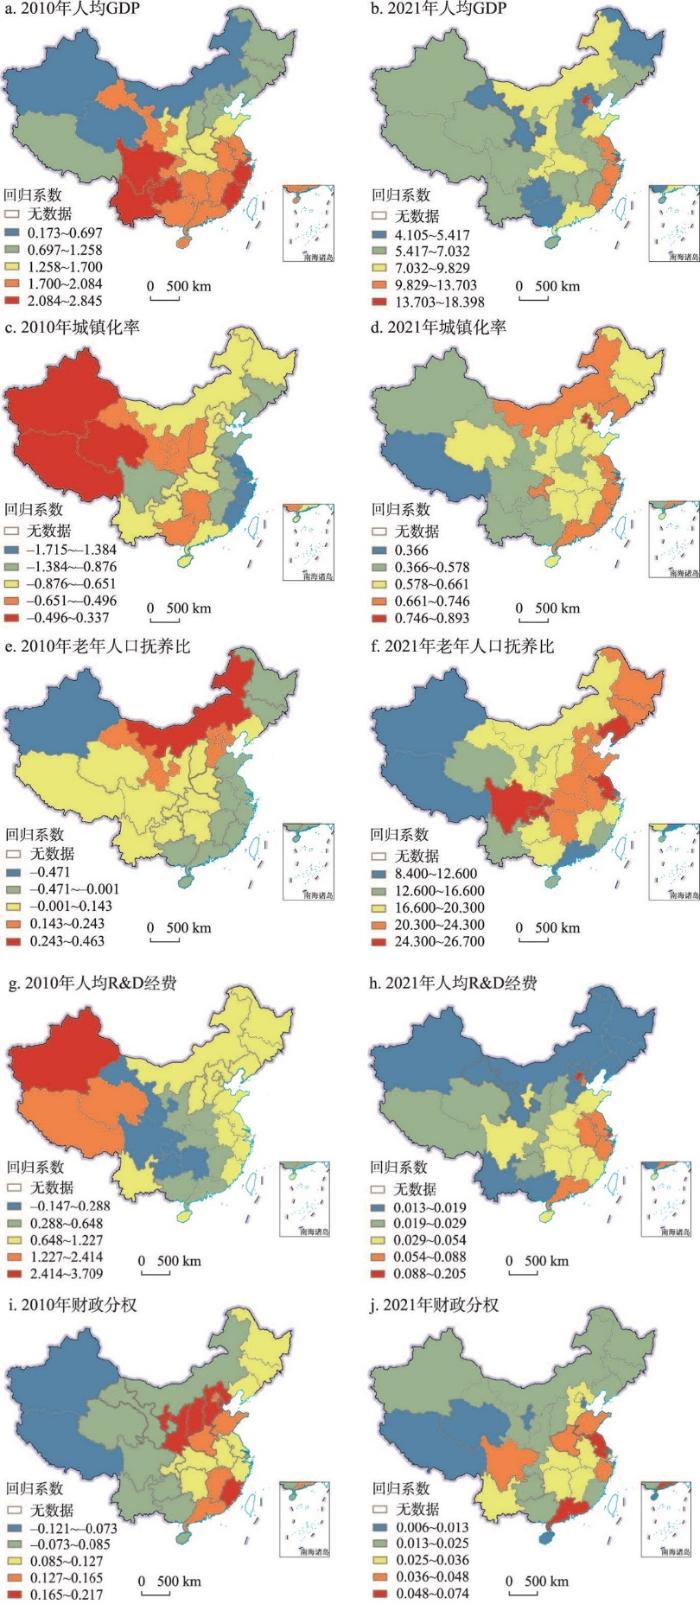
图7
2010—2021年中国民生发展水平影响因素的时空变化
Fig. 7
Spatial and temporal changes in factors influencing Chinese people's livelihood development level, 2010-2021
由图7可知,人均GDP、城镇化率、老年人口抚养比、人均R&D经费和财政分权度对民生发展水平的影响具有空间分异特征,其影响作用也随时间的变化发生变迁。具体来看,各省份人均GDP对民生发展水平影响的回归系数增加,说明经济在民生发展方面所起的作用趋于强化,空间上呈现南强北弱的分异规律,并由南强北弱向东强西弱演变。就相对地位来看,2010—2021年京津经济发展对民生的促进作用由第三梯队进入第一二梯队,西南的云贵川由第一梯队进入第三梯队;31个省份的城镇化率影响民生发展水平的回归系数由负值转为正值,但系数的绝对值变小,城镇化率对民生的影响由抑制转变为积极影响,空间上由西强东弱向东强西弱转变,影响作用减弱;老年人口抚养比系数由负转正,系数绝对值变大,说明人口老龄化对民生发展的作用由抑制转向为产生积极影响,且作用趋于增强。可能的原因在于,近几年来中国全面贯彻落实积极应对人口老龄化国家战略,不断健全养老服务和老年人健康支撑体系,相关产业吸纳就业能力增加,对就业和养老产生促进作用;人均R&D经费的回归系数由-0.147~3.709范围变为0.013~0.205,科技对民生发展水平产生积极效应趋势。2010年西部的新疆和西藏的科技对民生发展水平的影响作用最大,川、吉、辽、冀、蒙省份的作用较大,但随着这些地区相对地位的下降,科技对民生的作用力由外强内弱向东强西弱格局转变;财政分权度回归系数由-0.121~0.217范围变为0.006~0.074,财政分权水平对民生发展水平产生积极效应趋势,东北地区、京津冀地区的作用减弱,沪苏粤地区的影响增加。
6 结论与建议
本文运用定基极差熵权法、标准差椭圆、核密度估计法和空间马尔可夫链等方法揭示了2010—2021年中国民生发展水平的空间演变规律,并构建空间计量回归、时空地理加权回归模型从全局和局域层面探究和识别民生发展空间分异的驱动因素。
结果表明:① 民生发展水平的重心由东北向西南方向偏移,重心从巩县转移至篙县,途中经过了登封县和汝州市,但重心均位于河南省。同时,民生发展水平的重心空间方向性增强。② 民生发展水平空间不均衡性逐渐增强,且全国和西部存在极化趋势;③ 民生发展水平等级空间格局呈现稳定的特征,但等级空间转移方向受到邻近省份的影响;④ 经济、科技、人口老龄化、财政分权对民生产生正向作用,城镇化为负向效应,且5个因素的影响具有空间分异特征。
据此,提出以下对策建议:① 深入实施区域协调发展战略,促进全国民生发展水平的均等化。特别是东北地区要推动东北全面振兴,深入实施民生振兴计划,缩小与东中部地区的差距。加强省际间协同和跨省合作,推进民生空间联动发展。② 坚持高质量地发展经济,厚实民生发展水平的物质基础。着力激发市场主体活力,通过技术与制度创新,提高资源要素使用效率。实施创新驱动发展战略,通过质量、效率和动力变革,推动经济高质量发展,实现在发展中保障和改善民生。③ 发挥各地区的比较优势,制定差异化民生建设策略。时空地理加权回归系数表明,各省经济、城镇化、科技、老龄化水平、财政分权对民生发展水平的作用呈现明显的空间分异特征。因此,各省应基于省情,根据这些因素的影响大小及演变规律,积极探索符合本地实际的发展路径和方法策略,兜牢基本民生底线,加快补齐民生领域短板,不断实现人民对美好生活的向往。
参考文献
Spatio-temporal pattern and its influencing factors of children multidimensional poverty in China
DOI:10.11821/dlxb202110015
[本文引用: 1]

Global multidimensional poverty has arouse great attention from the public. It is of great theoretical and practical significance to explore the spatial and temporal changes of multidimensional children poverty and its influencing factors. Taking 25 provinces (municipalities and autonomous regions) of China as an example, this study uses the A-F method to measure children multidimensional poverty of China during 2010-2016, and examines its spatio-temporal pattern and influencing factors with spatial autocorrelation and the geodetector. The results demonstrated the following: (1) During 2010-2016, the children multidimensional poverty index in eastern, central and western China showed a downward trend, and poverty in the dimensions of living standards, care, education and health were effectively improved. (2) The children multidimensional poverty index and each dimensional poverty index had spatial differences, which was manifested as "high in the east, medium in the central region, and low in the west". (3) Urban and rural children multidimensional poverty in China has been improved, and the index spatial pattern has gradually changed to "east, middle, west; high, middle, and low", however, the multidimensional poverty index of rural children has been far higher than that of urban children. (4) Family environment and urbanization level are important factors affecting children multidimensional poverty. Ability of raising children, economic level and educational environment are secondary factors. The interaction between the factors has a far greater impact on children multidimensional poverty than a single factor. Educational environment and ability of raising children, urbanization level and medical resources, and family environment are the main interactive factors leading to children multidimensional poverty.
中国儿童多维贫困时空格局变化及其影响因素
DOI:10.11821/dlxb202110015
[本文引用: 1]
儿童是社会发展的未来,相对于具有劳动能力的成年人,儿童群体更易陷入严重的多维贫困状态,因此探讨儿童多维贫困的时空动态变化及其影响因素具有重要的理论价值和实践意义。以中国25个省、市、自治区为研究区,使用A-F法从住房、照料、教育、健康、营养维度对2010—2016年中国儿童多维贫困进行测度,并结合空间自相关、地理探测器等方法对其时空格局及影响因素进行研究。结果表明:① 2010—2016年中国东中西部儿童多维贫困指数均呈下降趋势,儿童多维贫困在住房、照料、教育、健康、营养各维度均得到有效改善;② 2010—2016年中国儿童多维贫困、各维度贫困存在空间分布差异,呈现“东—中—西”部儿童多维贫困指数阶梯式递增的空间特征;③ 2010—2016年中国城市、农村儿童多维贫困情况均得到改善,空间分布向着“东—中—西”贫困指数阶梯式递增的格局转变,但农村儿童多维贫困指数始终远高于城市;④ 家庭情况、城镇化水平是影响儿童多维贫困空间分异的重要因素,抚养能力、经济水平、教育环境是影响儿童多维贫困的次要因素。综合来看,各影响因素的交互作用对儿童多维贫困空间分异的影响远超过单因素,教育环境与抚养能力、城镇化水平与医疗资源、家庭情况与抚养能力为影响儿童多维贫困的主导交互因素。
The development of people's livelihood and social policy and the new journey: New problems and new issues
民生建设和社会政策发展及新征程中的新问题与新议题
A comprehensive assessment of green development and its spatial-temporal evolution in urban agglomerations of China
DOI:10.11821/dlyj201707010
[本文引用: 1]
Green development is becoming increasingly important. The Fifth Plenary Session of the 18th CPC Central Committee established green development as an important development concept of the 13th Five-Year Plan (2016-2020). Urban agglomerations in China that perform as core areas are likely to play vital roles in the promotion of green development. This study focuses on Chinese urban agglomerations as the research object, and proposes a comprehensive index system for the assessment of green development. In addition, methods such as the projection pursuit model, Pearson correlation, coefficient of variation, and Theil index are used to measure the level of green development, spatial and temporal evolution characteristics, and heterogeneity in urban agglomerations of China. Results show that: (1) since 2005, the level of green development has been increasing, although by fluctuating amounts. When divided into layers, the green development results indicate a certain degree of hierarchical structure. Based on the overall performance of China's urban agglomerations over the past decade, their green development can be divided into five grades: highly advancing area, rapidly advancing area, steadily advancing area, preliminarily advancing area, and starting area. (2) The economic development element dominates the green development, followed by the social progress element, and then the ecological civilization element, which is improving gradually. Different levels of urban agglomerations show diverse characteristics at different stages when it comes to the evolution of dominant element. National urban agglomerations are dominated by economic development element, the dominant element in regional urban agglomerations is complex, and the provincial ones generally lack dominant element. Besides, there are also significant differences in the same hierarchy urban agglomeration. (3) The green development level of urban agglomerations mismatch the level of central cities and this phenomenon needs to be treated differently. (4) According to the Theil index value, differences in green development reveal a divergent trend, mainly owing to variations among the layers. (5) Finally, several policies are proposed to raise the level of such green development in China, including the exchange and cooperation among urban agglomerations, resource sharing, and the innovation and promotion of environmental policy.
中国城市群绿色发展水平综合测度与时空演化
DOI:10.11821/dlyj201707010
[本文引用: 1]
绿色发展日益重要,党的十八届五中全会把绿色发展确立为“十三五”时期的一项重要发展理念,而作为中国发展核心区域的城市群必然对绿色发展的推进起着至关重要的作用。以中国城市群为研究对象,构建绿色发展综合评价体系,采用投影寻踪模型、Pearson相关、变异系数、Theil指数等方法,综合分析中国城市群绿色发展时空特征及异质性。结果表明:① 2005年以来中国城市群绿色发展水平波动上升,且呈一定的层级格局;城市群绿色发展差异显著,分为:高度推进区、快速推进区、稳步推进区、初步推进区、初始起步区5类。② 经济发展要素为中国城市群绿色发展主导支撑、社会进步要素次之,生态文明要素逐步加快;不同层级城市群不同阶段主导要素演化不同;同一层级内差异同样显著。③ 不同层级城市群中心城市与城市群绿色发展等级匹配存在异质性,需区别对待。④ 中国城市群绿色发展水平差异呈一定发散趋势,层级间差异成为绿色发展差异的最主要原因。⑤ 最后,提出全面提升中国城市群绿色发展水平的建议:加强城市群交流与合作、实现资源共享,加大环境政策的创新以及推行力度。
Basic meaning and characteristics of people's livelihood
民生的基本涵义及特征. 中国党政干部论坛
Connotations and Implications of people's livelihood
民生的内涵及意蕴
Comment on the connotation and characteristics of people's livelihood
论民生的内涵和特点
Connotation and construction path of people's livelihood in the new era
新时代的民生内涵与建设路径
The current connection of people's livelihood and approach to its realization
民生的时代内涵及其实现途径
Review and reflection: The research on some problems of people's livelihood in the theoretical circle
回顾与反思: 理论界关于民生若干问题的研究
The theoretical basis and experiential inspiration of 70 years of people's livelihood construction in New China
新中国70年民生建设的理论基础及经验启示
Xi Jinping's theoretical innovation on ensuring and improving people's livelihood
习近平关于保障和改善民生的理论创新要论
Theoretical innovation and practical features of the construction of Chinese people's livelihood in the new era
新时代中国民生建设的理论创新与实践特色
Spatiotemporal patterns and determinants of interprovincial migration in China between 2000 and 2020
DOI:10.11821/dlxb202212007
[本文引用: 2]
Understanding the geographical pattern and driving factors of China's population migration in the first 20 years of the 21st century has become a pivotal issue in promoting the construction of the new-type urbanization and interaction development between regions during the 14th Five-Year Plan period (2021-2025). Supported by the data of the sixth and seventh national population censuses and 2005 and 2015 national 1% population sample surveys, this paper aims to investigate the spatiotemporal evolution characteristics and influencing factors of interprovincial migration in China from 2000 to 2020. Relevant population geospatial analysis and the eigenvector spatial filtering Poisson pseudo-maximum likelihood estimation (ESF PPML) gravity model are employed. The following conclusions are drawn: (1) China's population migration patterns were generally stable from 2000 to 2020, where notable imbalance and network spillover effects were also detected. A large number of migrants from central, western and northeast parts of China tended to move to the eastern region. (2) The overall migration patterns between 2000 and 2020 revealed several changing characteristics. The degree of imbalance and spatial agglomeration of migration patterns gradually weakened. Yet, a north-south differentiation emerged. It is also found that the out-migration trend of the northeast region increased with the elaspe of time. (3) The ESF PPML model indicated that gravity factors (population scale, geographical distance), regional socio-economic factors (wage disparity, proportion of investment in science and technology and education, medical care), social network factors, environmental comfort (PM2.5 concentration) and living costs (proportion of housing price) drove the interprovincial migration pattern between 2000 and 2020. (4) The influence of regional economic differences on interprovincial migration reflected a weakening trend. The pattern of population migration gradually turned into the decision-making of diversified demands for the economy, public services and urban amenities, while the living cost factor represented by housing price had played a gradually significant part. The conclusion of this paper provides policy references for the construction of the new-type urbanization and coordinated development between regions during the 14th Five-Year Plan period in China.
2000—2020年中国省际人口迁移格局的演化特征及影响因素
DOI:10.11821/dlxb202212007
[本文引用: 2]
准确认识和把握21世纪前20年中国人口迁移的地理格局和影响因素,是推动新型城镇化建设及区域均衡发展的关键科学问题。借助特征向量空间滤波泊松伪最大似然估计(ESF PPML)引力模型,基于第六次和第七次全国人口普查数据、2005年和2015年全国1%人口抽样调查数据,研究了2000—2020年中国省际人口迁移的时空演化特征及影响因素。主要结论为:① 2000—2020年间人口迁移格局总体稳定,具有较强的不平衡性和网络溢出效应,大量人口从中部、西部、东北地区迁移至东部地区;② 人口迁移格局稳中有变,不平衡程度和空间集聚程度逐渐减弱,人口迁移和人口分布显现出南北分异趋势,东北地区人口迁出强度不断增强; ③ 传统引力模型因素(人口规模、地理距离)、地区社会经济发展因素(工资差异、科技教育投入占比、医疗水平)、社会网络因素、环境舒适度(PM<sub>2.5</sub>浓度)以及生活成本(住宅价格占比)共同影响人口迁移格局;④ 区域经济差异对省际人口迁移的影响作用逐步弱化,人口迁移逐渐转变为对工资收入、高质量公共服务、环境舒适度等多因素考虑的决策过程,生活成本逐渐对人口迁移产生显著影响。
People's livelihood construction in the new era: Theoretical development and practical achievements
新时代民生建设: 理论发展与实践成就
The history, achievements and experience of people's livelihood construction in the hundred years of the founding of the Party
建党百年民生建设的历程、成就与经验
The historical investigation and basic experience of the Communist Party of China leading the construction of people's livelihood in the past hundred years
中国共产党百年来领导民生建设的历史考察及基本经验
The basic principles of the CPC for the development of people's livelihood
中国共产党发展民生事业的基本原则
Comment on the ideological origin and theoretical connotation of "Ensuring and improving people's livelihood"
论“保障和改善民生”的思想渊源和理论内涵
"The Questions of the Times" of Chinese people's livelihood construction in the new era and its way of development
新时代民生建设的“时代之问”及其发展之道
Research on the construction of people's livelihood in the new era under the concept of sharing
共享理念下的新时代民生建设研究
Times change, policies (systems) innovation, and high-quality development of the people's wellbeing
时代变迁、制度创新与民生保障高质量发展
The regional disparity and influencing factors of the level of basic livelihood in China
中国基本型民生发展水平区域差距及影响因素
Measurement, source decomposition and formation mechanism of regional differences in urban livelihood development in China
中国城市民生发展的区域差异测度、来源分解与形成机理
The theoretical model and demonstration of people's livelihood index evaluation
民生指数评价的理论模型及实证
Sources and drives of differences in people's livelihood development in ten major urban agglomerations in China
中国十大城市群民生发展差异来源及驱动因素
Spatio-temporal pattern evolution and impact factors of people's livelihood developing undertakings level in China
中国城市民生发展水平时空演化特征及其影响因素
Spatio-temporal evolution and influencing factors of urban public health level in China
DOI:10.11821/dlyj020210440
[本文引用: 2]
Based on the comprehensive evaluation method combining fixed base range entropy weight method and fixed base equal weight assignment method, kernel density estimation and exploratory spatial data analysis methods, this paper analyzes the spatio-temporal evolution characteristics of public health level of 284 cities in China from 2003 to 2018, and uses the generalized spatial two-stage least square method to investigate its influencing factors. The results show that: (1) During the study period, the urban public health level is on the rise as a whole in China, but the difference of public health level among cities has expanded, and there is always a phenomenon of multi-level differentiation. (2) The kernel density curves of the four plates have their own evolution forms in the position of gravity center, the height of main peak, the number of wave crests, the length of trailing and the thickness of trailing, which is the result of the coupling and superposition of time characteristics and regional characteristics. (3) There are positive spatial spillover effect and spatial “Peer Effects” in China's urban public health level, and the spatial agglomeration type has transformed from LL type to HH type. (4) Income level, population density, technological progress, industrialization and health system reform have an impact on urban public health, but the impact of various factors on different regions is heterogeneous.
中国城市公共健康水平的时空演化及其影响因素
DOI:10.11821/dlyj020210440
[本文引用: 2]
采用定基极差熵权法与定基等权赋值法相结合的综合评价方法、核密度估计、探索性空间数据分析等方法,分析2003—2018年中国284个地级以上城市公共健康水平的时空演化特征,并运用广义空间两阶段最小二乘法考察其影响因素。结果发现:① 研究期内中国城市公共健康水平整体呈上升趋势,但各城市间公共健康水平差异有所扩大,且始终存在多级分化现象;② 四大板块核密度曲线在重心位置、主峰高度、波峰数量、拖尾长度、拖尾厚度上均有各自演化形态,是一种时段特征与地区特色相互耦合叠加的结果;③ 中国城市公共健康水平存在正向空间溢出效应和空间“同群效应”,空间集聚类型实现了由LL型为主体向HH型为主体的转化;④ 收入水平、人口密度、科技进步、工业化程度、卫生体制改革对城市公共健康具有影响,但各因素对不同区域的影响存在异质性。
Spatio-temporal evolution characteristics and influence factors of inclusive financial development level in China
中国普惠金融发展水平时空演变特征及影响因素
Spatio-temporal characteristics of the coupling and coordination of Guangdong-Hong Kong-Macau Greater Bay Area's basic public services and economic development
DOI:10.18306/dlkxjz.2022.09.011
[本文引用: 1]
Coordinated development of basic public services and the economy is an important part of inclusive growth. Based on entropy method, coupled coordination degree model and Kernel density estimation method, this paper studies the spatio-temporal characteristics of coupling coordination between basic public services and economic development in the Guangdong-Hong Kong-Macao Greater Bay Area from 2009 to 2019. The results show that: 1) The comprehensive level of basic public services and economic development shows an upward trend of fluctuation, but with obvious stage characteristics, and the development of the two is not completely synchronous. 2) Basic public services and economic development have a strong coupling effect, and their coordination is gradually improved. However, there is no transition in the level of coupling coordination, which is always a kind of forced coupling coordination, forming a spatial pattern of low peripheral and high center. 3) The oupling coordination subtype heterogeneity of 11 cities is obvious, and the peripheral Jiangmen, Huizhou and Zhaoqing all belong to the lagging type of economic development. From a regional point of view, the lag of economic development is mainly distributed in the West, while the lag of basic public services is mainly concentrated in the East and the Middle. 4) The coupling coordination degree of the low value area shows an upward trend, the difference between the cities in the high value area is gradually narrowing, and the polarization phenomenon is formed between the cities in the high value area and the low value area. The results can provide a theoretical basis for relevant departments to coordinate policies for economic and basic public services in the Guangdong-Hong Kong-Macao Greater Bay Area.
粤港澳大湾区基本公共服务与经济发展耦合协调的时空特征
DOI:10.18306/dlkxjz.2022.09.011
[本文引用: 1]
基本公共服务与经济耦合协调度发展是包容性增长的重要内容。论文运用熵值法、耦合协调度模型和核密度估计方法,研究粤港澳大湾区2009—2019年基本公共服务与经济发展耦合协调的时空特征。结果表明:① 基本公共服务与经济发展综合水平均呈现波动上升趋势,但具有明显的阶段性特征,且二者发展不完全同步。② 基本公共服务与经济发展耦合作用强,协调性逐渐改善,但耦合协调等级没有发生跃迁,始终为勉强耦合协调类型,形成外围低中心高的空间格局。③ 11个城市耦合协调亚类型异质性明显,外围的江门、惠州、肇庆均属于经济发展滞后型。分区域看,经济发展滞后型主要分布在研究区西部(澳珠中江),基本公共服务滞后型主要集中在研究区东部(深港莞惠)和中部(广佛肇)。④ 低值区耦合协调度呈上升趋势,高值区城市之间的差异性在逐渐缩小,高值区与低值区城市间形成了两极分化现象。该成果能为相关部门在制定粤港澳大湾区经济与基本公共服务建设协调政策时提供理论依据。
Temporal and spatial features of insurance industry development level and its impact on economic growth in the Guangdong-Hong Kong-Macao Greater Bay Area
DOI:10.18306/dlkxjz.2022.09.015
[本文引用: 1]
The insurance industry is playing an increasingly important role in China's economic development, transformation and industrial upgrading. Based on the city panel data of the Guangdong-Hong Kong-Macao Greater Bay Area (GBA) from 2006 to 2019 and using entropy weights, kernel density estimation, and spatial econometric methods, this study examined the spatial-temporal characteristics of the development level of the insurance industry in the area and its impact on economic growth. The findings are as follows: 1) The comprehensive index of insurance industry development level increased with fluctuation. The insurance industry development level in 11 cities of the GBA showed the characteristics of Hong Kong, Macao, and Guangzhou leading in the eastern, central, and western regions, and Guangzhou, Shenzhen, and Zhuhai leading in the three economic circles of Guangzhou-Foshan-Zhaoqing, Shenzhen-Dongguan-Huizhou, and Zhuhai-Zhongshan-Jiangmen. 2) The development level of the insurance industry in the 11 cities is polarized, but the absolute difference between high-value and low-value regions tends to decrease, and the gap between low-value areas tends to widen. 3) The development of the insurance industry has a significant positive impact on regional economic growth. If other influencing factors remain unchanged, each 1% increase in the development level of the insurance industry will result in a regional economic growth of 0.0538%. The development of the insurance industry has negative spillover effect, but it does not pass the significance test. The research results provide a theoretical basis for relevant departments in the Greater Bay Area to formulate industrial policies that promote the insurance industry and economic development mutually.
粤港澳大湾区保险业发展水平时空演变特征及对经济增长的影响
DOI:10.18306/dlkxjz.2022.09.015
[本文引用: 1]
保险业在中国经济发展、转型和产业升级等方面发挥着越来越重要的作用。论文利用粤港澳大湾区2006—2019年的市级面板数据,运用熵权、核密度估计和空间计量等方法,研究粤港澳大湾区保险业发展水平时空特征及其对经济增长的影响,结果表明:① 保险业发展水平综合指数在波动中上升,11个城市保险业发展水平呈现香港、澳门和广州单核领跑大湾区东、中、西部的特征,珠三角9市呈现广州、深圳和珠海单核领跑广佛肇、深莞惠和珠中江三大经济圈的特征;② 11个城市保险业发展水平存在两极分化现象,但高值区与低值区的绝对差异有缩小趋势,低值区城市之间的差距有扩大趋势;③ 保险业发展对本地区经济增长产生了显著的正向影响,在其他影响因素保持不变的情况下,保险业发展水平每提升1%,本地区经济增长0.0538%。保险业发展具有负溢出效应,但未通过显著性检验。研究成果为粤港澳大湾区相关部门制定保险业与经济发展相互促进的产业政策提供了理论依据。
Dynamic evolution characteristics and driving factors of tourism ecological security in the Yellow River Basin
DOI:10.11821/dlxb202203015
[本文引用: 1]
It is of great theoretical and practical importance to measure and examine tourism ecological security in the Yellow River Basin (YRB). The purpose of this study is to promote coordinated and sustainable development of the tourism economy and ecological environment. From the perspective of watershed sustainable development, this paper constructs the theoretical framework and index system of tourism ecological security in the YRB based on DPSIR system model, and analyzes its dynamic evolution characteristics and driving factors by using improved TOPSIS method, kernel density estimation, spatial autocorrelation, traditional and spatial Markov chains and quantile regression panel method. The results showed that: (1) There has been an evolutionary trend toward a dual-core form of tourism ecological security over time, as its average value fluctuates and then rises. The overall tourism ecological security level was relatively low (0-0.55), shifting from the predominant risk level in 2008 (accounting for 89.04%) to the levels of predominant risk and deterioration in 2017 (60.27% and 31.51%, respectively). A large downward risk remains. (2) In terms of dynamic evolution characteristics, the transfer of tourism ecological security risks and sensitive levels had "path dependence" and "self-locking" effects. In practice, however, the probability of maintaining the initial state of the deterioration level and the critical safety level was relatively small. And the type of transfer was usually accomplished during a subsequent level transfer. Its dynamic change process was strongly influenced by regional factors. Its characteristics of dynamic evolution were characterized by significant spatial and temporal heterogeneity. (3) Tourism ecological safety was most significantly influenced by environmental pollution in lower-level units. The tourism load level had a greater positive marginal effect on higher-level areas; however, economic development and level of tourism development have a greater positive marginal effect on areas with lower ecological tourism security levels.
黄河流域旅游生态安全的动态演变特征及驱动因素
DOI:10.11821/dlxb202203015
[本文引用: 1]
科学测度与审视旅游生态安全对促进黄河流域旅游经济和生态环境协调可持续发展具有重要的理论和实践价值。从流域可持续发展视角,基于DPSIR系统模型构建黄河流域旅游生态安全理论框架和指标体系,采用改进TOPSIS法、核密度曲线、空间自相关、传统和空间马尔可夫链及面板分位数回归方法对其动态演化特征和驱动因素进行探析。结果表明:① 时间上,旅游生态安全均值波动下降后上升,呈收敛趋势,且有向“双核”形态演变的趋势。空间上,旅游生态安全值整体较低(0~0.55),由2008年以风险级为主(占89.04%)转变为2017年以风险级和恶化级为主(分别占60.27%和31.51%),且仍存在较大下行转移风险。② 动态演化特征上,不考虑邻域条件下,旅游生态安全风险级、敏感级转移具有“路径依赖”与“自身锁定”效应。而恶化级、临界安全级保持初始状态概率较小,且类型转移通常发生在相邻等级递次转移。邻域背景在其动态变化过程中起着重要作用,且其动态演化特征具有显著时空异质性。③ 影响因素方面,环境污染对低层级单元的旅游生态安全负向抑制作用较为明显,旅游负荷水平对较高层级地区旅游生态安全的正向边际效应略大,而旅游发展水平、经济发展水平等变量则对较低等级单元旅游生态安全的正向边际效应较大。
Spatial differentiation and influencing mechanism of nearby urbanization in central and western China
DOI:10.11821/dlxb202112009
[本文引用: 1]
Considering the new-type urbanization background, the nearby urbanization model provides a practical approach toward eliminating the disadvantage of trans-regional urbanization and promoting urbanization. This study establishes the indexes of the nearby urbanization rate (NU), contribution to nearby urbanization (CNU) and trend of contribution to nearby urbanization (TNU), to analyze the spatial differentiation features of nearby urbanization in central and western China from 2000 to 2015. Moreover, this study explores the determinant factors and influencing mechanism of the spatial differentiation of nearby urbanization in the study region. Results show that: (1) From 2000 to 2015, the population of nearby urbanization increased from 196 million to 347 million and the NU increased from 28.16% to 46.89%. (2) Based on the analysis of the CNU, we found that the main source of nearby urbanization was the population registered in the local town, but the contribution of local town to nearby urbanization (CNUt) gradually declined over the study period. The areas with high CNUt were widely distributed in central and western China in 2000, but by 2015, they were restricted to Sichuan province. Meanwhile, the contribution of local county to nearby urbanization (CNUc) increased and the contribution of local province to nearby urbanization (CNUp) varied slightly. Most areas with high CNUp were provincial capital cities, resource-based cities or pastural cities. (3) Based on the analysis of the TNU, the trend of the contribution of local county to nearby urbanization (TNUc) exceeded the trend of the contribution of local province to nearby urbanization (TNUp), while the trend of the contribution of local town to nearby urbanization (TNUt) exhibited the least influence. Therefore, examining nearby urbanization based on the county-level spatial unit was advantageous in most regions; however, in the northwestern border regions and provincial capital cities, the provincial level was more applicable. (4) The spatial differentiation of nearby urbanization was determined based on the integrated results of various influencing factors, including natural environment, economic development, non-agricultural industries, urban public services, transportation accessibility, and the influence of local administration.
中国中西部地区就近城镇化空间分异格局及机理
DOI:10.11821/dlxb202112009
[本文引用: 1]
就近城镇化是中国中西部地区破除异地城镇化模式弊端、推进新型城镇化健康发展的现实路径选择。通过构建就近城镇化率、贡献力和贡献势指标,从本省、本县和本镇3个城镇化尺度,系统分析2000—2015年中国中西部地区就近城镇化空间分异特征,并深入剖析其驱动机制。研究发现:① 2000—2015年中西部地区就近城镇人口总数从1.96亿增加到3.47亿,就近城镇化率从28.16%上升到46.89%。② 从贡献力看,中西部地区就近城镇化的主要来源是本镇户籍人口,但本镇贡献力呈下降趋势,本县贡献力波动上升,本省贡献力变化不大。③ 从贡献势看,本县贡献势>本省贡献势>本镇贡献势,县域尺度是中西部大部分地区就近城镇化的优势空间单元。④ 中西部地区就近城镇化空间分异是自然环境背景、经济增长和非农产业发展、城市公共服务供给、交通运输条件和地方行政力量等多重因素的综合作用结果。
Inequality pattern of population-economy and its influencing factors in Tibet from 2009 to 2018
DOI:10.11821/dlyj020220401
[本文引用: 1]
Population and economy are essential problems of human social development and many studies have proved that there is a close correlation between them. Population flow is an important reason affecting the process of regional economic equilibrium, while regional economic disequilibrium is a vital driving force of population flow. Their spatio-temporal pattern and current relationship are constraint and support for regional sustainable development. Unbalanced development has become increasingly prominent in China, but the underdeveloped regions have not received enough attention. As minority autonomous region and southwest frontier region of China, Tibet has long been the only provincial concentrated contiguous poverty-stricken area. It is of great significance to examine the relationship between population and economy of this kind of area. This article made a spatial-temporal study on the inequality pattern of population-economy in Tibet during 2009-2018 by combining geographic concentration, Gini coefficient and inconsistent index. Panel data regression and spatio-temporal weighted regression model were used to analyze the factors affecting the inconsistency of population and economy distribution. The results show that the population and economy agglomeration demonstrate a stable and disequilibrium pattern which is characterized by high in the southeast and low in the northwest. The area with high geography concentration has strong coupling with the distribution of river valley plains, traffic trunks and administrative centers. The overall imbalance of population-economy is weakening. However, the spatial distribution and development trend of inconsistent index are disparate in different counties. Human capital, economic strength and industrial structure are the leading factors affecting the inconsistency of population-economy whose absolute value of the influence coefficient are more than 10%, followed by government regulation capacity, road infrastructure, physical capital and medical infrastructure. The effect of social consumption level is not significant. Spatial differences in effects on inconsistent index indicate that the effect of human capital and industrial structure on most counties are more reflected in attracting population. The influence of economic strength, physical capital, medical infrastructure and government regulation capacity are mainly reflected in promoting economic development, and the reach of economy strength covers all counties. Compared with other influencing factors, the spatial heterogeneity of the impact of road infrastructure and social consumption on inconsistent index are the most obvious.
2009—2018年西藏人口与经济的非均衡格局及其影响因素
DOI:10.11821/dlyj020220401
[本文引用: 1]
选择地理集中度、基尼系数、不一致指数等指标,研究2009—2018年西藏人口与经济非均衡时空格局,并采用面板数据回归和时空地理加权回归模型对其影响因素进行分析。结果发现:西藏人口与经济分布表现出稳定的非均衡格局,呈现“东南高、西北低”的特征,地理集中度高值区与河谷平原、交通干线、行政中心的分布耦合性较强。西藏人口与经济空间匹配的整体非均衡性不断减弱,县区人口与经济不一致指数的空间分布和发展态势差异明显。人力资本、经济实力和产业结构水平是影响人口与经济不一致性的主导因素,三者影响系数绝对值均大于10%,其次是政府调控能力、道路基础设施、物质资本和医疗基础设施,而社会消费水平的作用不显著。各因素对不一致指数影响的空间异质性表明,人力资本和产业结构水平对大部分县区的影响更多体现在吸引人口方面,经济实力、物质资本、医疗基础设施、政府调控能力对县区的影响主要体现在推动经济发展上,其中经济实力的影响范围囊括所有县区;与其他影响因素相比,道路基础设施、社会消费影响的空间差异最为明显。
