

1 引言
“健康中国”建设和“美丽中国”建设是实现中华民族伟大复兴的两翼[1]。中国共产党“十八大”以来,党中央作出“实施健康中国战略”的重大部署。中国共产党“二十大”报告上,习近平总书记再次提出了要全面推进“健康中国建设”,完善人民健康促进政策[2]。全球工业化和城市化的迅速发展,给人们带来便利和机遇的同时,也给人们也带来了巨大的威胁和挑战,诸如环境污染、传染病在全球范围内的传播、人口老龄化等各种健康风险也在增加,各国开始重视环境的治理和基础设施的完善,健康也逐渐融入到城市建设中[3],建设“健康城市”对社会和环境等因素进行健康管理成为应对城市健康挑战的最优办法。1984年加拿大多伦多国际会议上“健康城市”理念被首次提出,会上提出通过多部门和多学科的联合来解决城市健康问题[4],1986年渥太华宪章从健康公共政策的制定、环境支撑条件、社区参与、个人素质、健康服务5个方面提出健康城市战略框架,此后世界卫生组织(WHO)将健康城市作为全球性行动进行推广。中国的健康城市研究是从20世纪90年代开始逐步发展起来的,2016年10月发布的《“健康中国2030”规划纲要》提出,把健康城市和健康村镇建设作为推进健康中国建设的重要抓手[5],健康城市成为中国健康未来的关键[6]。
在“健康城市”正式提出之后,相关研究大量涌现,健康城市的概念和内涵得到了不断的修改和完善,目前世界卫生组织(WHO)所认定的健康城市是为人类和地球提供服务的地方,自然环境、生态环境、社会环境稳定发展,人们幸福指数提高,实现健康的动态循环[7]。基于理论内涵构建指标体系对健康城市进行定量评价是推进健康城市实现可持续发展的重要保障[8],WHO出版的《健康城市指标:全欧洲资料分析》[9]一书中,首次全面分析了健康城市的各项总体参数,提出了包括卫生健康、公共医疗服务、环境、社会经济等4个方面共53项指标,后确定了人群、服务、环境、经济4个维度共32项指标构成健康城市建设水平评价指标体系[10]。自中国健康城市运动开展以来,众多地区进行了基于健康城市建设水平评价的健康城市建设模式的探索[11],2015年全国爱卫办从环境、社会、服务、人群、文化、组织保障6个方面构建指标体系,突出强调人的健康协调发展,后续的评价指标体系多在此基础上进行修改完善,将交通规划[12]、信息[13]等类别的因素列入评价指标体系,强调公众[14]、政府[15]、非营利组织[16]等在健康城市建设中的作用。中国对健康城市的评价研究更侧重衡量结果,强调要考虑到经济和体制改革的因素[17],通过经济、社会、制度等多层面提高城市健康水平[18],进行了很多政策性指标体系的建设。在健康城市建设水平评价方法方面,多选用理论分析法、因子分析法、SWOT分析法、德尔菲法、层次分析法、空间分析法等[19]。针对健康城市建设的发展路径研究,WHO率先在欧洲打造健康城市网络[8],推动健康城市项目建设,为其他城市的健康城市建设提供平台支持。以健康促进为目标[20],大多数学者着重从改善医疗卫生系统[21]、改造人居环境[22-23]、改善城市基础设施和促进公共服务均等化方面研究建设健康城市[24⇓-26]。此外,有关学者从城市规划[27-28]、新型城镇化[29]、生态文明[30]、高质量发展[31]等方面探索健康城市建设的路径与经验。
综上所述,国内外对健康城市的探究从最初的单纯定性理论性研究趋向于定量研究,研究主题也随着时代的变化不断更新,研究方向也与更多学科进行交叉,学者从社会学、体育学、国家政策等不同视角进行了健康城市建设的研究。已有研究对健康城市的评价主要围绕社会、人群、人居环境等角度开展,缺乏对社会经济、制度、文化等系统要素的考量,同时对健康城市建设的时空演变及形成机制探究不足。基于此,本文以“人地关系”为核心探究健康城市的内涵与建设维度,以2010年、2015年和2020年为时间截面,一方面,探究中国341个地级以上城市健康城市建设的时空格局特征,另一方面辨析健康城市建设时空格局的影响因素,进而探索健康城市建设的优化路径和重点建设方向。
2 研究框架、方法和数据
2.1 健康城市的内涵及发展变化
表1 健康城市的内涵及发展变化
Tab. 1
| 年份 | 代表观点 | 文献来源 |
|---|---|---|
| 1984 | 首次提出“健康城市”概念,指出要通过公众、健康和部门机构间的合作解决城市卫生及与健康相关问题 | [32] |
| 1988 | 健康城市就是一个能够促使创造和改善自然和社会环境,扩大社会资源,使人们能够相互支持、履行生命中所有功能,实现可能达到的最理想的健康状态的城市 | [33] |
| 1995 | 健康城市是一个不断开发、发展自然和社会环境,并不断扩大社会资源,使人们在享受生命和充分发挥潜力方面能够互相支持的城市 | [7] |
| 2006 | 从城市规划、建设到管理各个方面以人的健康为中心,保障广大市民健康生活和工作,成为人类社会发展所必需的健康人群、健康环境和健康社会有机结合的整体 | [34] |
| 2012 | 健康城市可以看作是政治、产业、文化、科技及空间五个层面的有机结合,它们相对独立,又相互影响 | [35] |
图1
综合国内外学者有关健康城市内涵和概念的论述,结合“健康中国”战略的建设背景,本文从地理学视角出发将健康城市总结为:健康城市是在人地系统耦合机制下,坚持以人为本的理念,通过解决好“人口—社会—经济—文化—环境”的关系,理顺各要素之间的作用机制;构建以全民健康为目标,生态环境为基础,医疗卫生为核心,经济发展为支撑,公共服务为保障,科技创新为导向的各要素良性循环系统;最终建设成“医疗服务公平、经济高效发展、文化素养提高、社会和谐进步、生态环境友好”的“人—地”健康协调发展的城市建设新模式。
2.2 研究框架
基于健康城市内涵的内在属性,即“人地和谐共生”和“可持续发展”,构建“五维”体系的健康城市建设综合测度模型,从医疗水平、经济基础、文化发展、社会服务、生态环境五大子系统入手,通过描述性分析城市之间、省域间、地区间健康城市综合建设水平和各子系统建设水平的差异,继而从空间分析角度入手,探究健康城市建设的空间演化,深入剖析区域健康城市在横向和纵向方面的建设差异;进而,从健康城市的本底条件、建设基础和发展能力3个方面探究影响健康城市建设的形成机制及调控策略。
2.3 指标体系与数据来源
2.3.1 健康城市建设评价
结合健康中国战略纲要以及《全国健康城市评价指标(2018版)》,构建由医疗水平、经济基础、文化发展、社会服务、生态环境5个方面的25项具体指标构成的健康城市建设评价指标体系(表2)。考虑到数据的可获得性、完整性以及城市的影响力,选取341个地级以上城市作为研究对象(暂未含港澳台地区及三沙市),主要数据来自2011年、2016年和2021年各省市统计年鉴、各市国民经济与社会发展统计公报和地方政府官网数据;个别缺失数据通过相邻年份按照趋势法补齐。
表2 健康城市建设评价指标体系表
Tab. 2
| 目标层 | 指标层 | 文献来源 |
|---|---|---|
| 健康医疗水平 | 预期寿命(岁) | [36] |
| 万人拥有医生数(人/万人) | ||
| 甲、乙类法定报告传染病发病率(/10万) | ||
| 城乡基本医疗保险参保率(%) | ||
| 医疗卫生支出占一般性公共财政支出的比重(%) | [37] | |
| 健康经济基础 | 城乡居民人均可支配收入比 | [38] |
| 二三产业产值占GDP比重(%) | ||
| 第三产业从业人员比重(%) | [39] | |
| 人均地方财政一般预算内收入(元) | ||
| 单位GDP能耗减少率(%) | ||
| 健康文化发展 | 老年人口每万人拥有老年大学数量(个/万人) | |
| 万人劳动力大专及以上文化程度人数(人/万人) | [40] | |
| 万人专利拥有量(件/万人) | ||
| R&D经费占GDP比重(%) | ||
| 万人公共图书馆藏书量(册/万人) | ||
| 健康社会服务 | 千人养老床位数(张/千人) | [41] |
| 失业保险参保率(%) | ||
| 全社会平均退休工资水平(元) | ||
| 千人公共汽车拥有量(辆/千人) | ||
| 千人体育健身场所拥有量(个/千人) | ||
| 健康生态环境 | 空气质量(API)达到和优于二级天数(d) | |
| 城镇生活污水集中处理率(%) | ||
| 建成区绿化覆盖率(%) | [42] | |
| 生活垃圾无害化处理率(%) | [43] | |
| 工业固废综合利用率(%) |
2.3.2 影响因素选择
厘清影响健康城市建设区域差异的影响因素和形成机制有利于各地区因地制宜的制定科学有效的优化措施。结合中国目前健康城市建设的具体情况,从健康城市的本底条件、建设基础和发展能力3个维度甄选出9个驱动因子指标探究不同的因子对健康城市影响程度的大小及作用机制。指标选取如表3所示:
表3 健康城市建设的影响因素选取
Tab. 3
| 系统层 | 指标层 | 探测因子 |
|---|---|---|
| 健康城市本底条件 | 地形起伏 | 平均高程X1 |
| 植被覆盖指数 | 平均NDVI X2 | |
| 人口密度 | 人口密度X3 | |
| 健康城市建设基础 | 城市化发展水平 | 城镇化率X4 |
| 交通通达度 | 交通通达指数X5 | |
| 经济活动强度 | 地均GDP产值X6 | |
| 健康城市发展能力 | 经济发展潜力 | GDP增长率X7 |
| 科技创新驱动水平 | 科技进步贡献率X8 | |
| 劳动者素质水平 | 劳动年龄人口的平均受教育年限X9 |
2.4 研究方法
2.4.1 融合“五维”体系的健康城市综合测度模型
采用主成分分析法[44]通过将n维因子进行正交变换确定指标权重,将权重处理结果值与标准化数据计算得到各子系统的综合得分TK,然后利用健康城市建设水平综合测度模型计算各时期健康城市建设水平(HC)即综合健康指数。计算公式如下:
式中:i表示城市序号;j为测度指标;
2.4.2 空间分布模式分析
式中:Xi和Xj为单元i和单元j的属性值;
式中:d为距离;Wij(d)为i、j点之间以距离规则定义的空间权重;E(I)为期望值;var(I)为变异系数;
2.4.3 区域差异性分析
运用Dagum基尼系数[47]探析中国健康城市建设的非均衡性,揭示中国健康城市建设的区域差异及其来源,定量化、清晰化的分析健康城市建设的时空分布格局。Dagum将总体基尼系数G分解为区域内差距的贡献Gw、区域间差距的贡献Gnb和超变密度的贡献Gt,即G=Gw+Gnb+Gt,G值越大意味着各区域之间健康城市建设的差距越大,空间越不平衡,协同性越弱。计算公式如下:
式中:yji(yhr)为j(h)地区内任意城市健康城市建设水平;μ为均值;n为城市个数341;k为本文所划分的区域数量7;nj(nh)为j(h)区域内城市的数量,Djh为两个区域间健康城市建设水平的相对影响,djh为区域间健康城市建设的综合健康指数的差值,即在μj>μh时,djh为yji-yhr>0条件下的所有综合健康指数差异(yji-yhr)的加权平均数,pjh则为超变一阶距,表示yhr-yji>0条件下的所有城市综合健康指数差异的加权平均数。
2.4.4 空间分异机理分析
采用地理探测器[48]中的因子探测器,分析健康城市建设的空间分异机理,计算公式如下:
式中:q的值域为[0,1],q值越大,说明空间分异越明显;如果分层是由自变量X生成,则q值越大表示X和健康城市建设的空间分布越一致,自变量X对健康城市建设的解释力越强,反之则越弱。其中,h = 1, 2, …, L为变量Y或因子X的分层,即分类或分区;Nh、N分别为层h和全区的单元数;
3 健康城市建设的区域差异分析
3.1 健康城市建设的总体分异格局
综合测度得分结果代表了健康城市建设的整体水平。采用Jenks自然断裂法对341个地级市2010年、2015年和2020年健康城市建设水平划分为低水平、较低水平、中等水平、较高水平、高水平5个等级(图2)。中国健康城市的建设水平均表现出明显的区域差异性,长期呈现出“沿海高内陆低、东部高西部低”的结构布局。
图2
图2
2010—2020年中国健康城市建设的综合健康指数空间分异
注:基于自然资源部标准地图服务网站GS(2023)2767号标准地图制作,底图边界无修改。
Fig. 2
Spatial differentiation of the comprehensive health index of healthy city construction in China from 2010 to 2020
从3个时间截面来看,341个地级市平均综合健康指数分别为0.367、0.402和0.438。2010年处于高水平的城市有12个,到2020年达到33个,主要在东部地区的发达城市如北京、上海以及内陆地区个别省会城市呈现点状零星分布格局,但在长三角地区已出现明显集聚特征,且到2020年空间集聚性增强;2010年较高水平城市有41个,到2020年达到92个,主要是在长三角城市群、山东半岛城市群以及珠三角城市群的高水平城市周边呈现组团状集聚分布,并出现向内陆地区延伸趋势,中部和东北部地区较高水平城市数量明显增加;2010年中等水平城市有74个,2020年达到139个,主要分布于中国中部地区且呈现集中连片分布,到2020年中等城市在华北、华中、华南以及新疆和甘肃省的西部地区大量集中分布,集聚特征更加显著;2010年处于较低水平城市有119个,到2020年缩减到58个,在西部和东北部边境地区集中分布,特别是西南、西北和东北地区的大量城市由低水平提升为较低水平,空间分布格局变化较大;2010年低水平城市有95个,到2020年缩减到19个,主要分布在青藏高原地区以及云贵高原的西部地区,且分布范围大大缩小,这体现了整体上中国健康城市建设水平的提高,并逐渐呈现均衡发展。
按地区来看,除东北地区综合健康指数经历先下降后上升的趋势外,2010—2020年各地区健康城市的综合建设水平均得到了提升,特别是华中和西北地区增长速度较快,西南地区由于受国家政策扶助的影响,提升也较大,东北地区建设水平提升较慢与其传统发展条件制约而导致发展后劲不足有关。华东和华南地区是七大地区中健康城市建设较好的区域,特别是上海市、浙江省、福建省、广东省作为东部沿海省份凭借着良好的医疗卫生资源、社会经济基础和生态环境以及完善的公共服务健康城市的建设优于其他地区。西南地区、西北地区和东北地区健康城市综合建设水平较低,地区内部建设水平差异性不大。
3.2 健康城市建设的分维度分异格局
(1)健康医疗水平指数。2010—2020年中国医疗水平健康指数总体表现为东南高西北低的特征(图3)。计算结果显示,2010年、2015年和2020年中国341个地级市的平均医疗水平健康指数分别为0.082、0.084和0.104。按地区分析,京津、山东半岛以及东南沿海地区的城市医疗水平健康指数均处于较高水平以上,而西南地区、西北地区的新疆、东北地区西北部城市医疗水平健康指数处于低水平。按城市分析,北京、广州、深圳医疗水平健康指数始终排在前列且各项指标均名列前茅,人均预期寿命远超过全国平均水平,医疗卫生方面的支出在全市财政支出比重较高,医疗资源配置合理且充分;而塔城、阿里、那曲、玉树等老少边地区的医疗水平健康指数较低,这很大程度上在于其偏僻的地理位置,地形复杂,交通不便,基础医疗设施不完善,加之宣传不够,医疗保险参保率也低于全国平均水平,致使这些地区医疗水平健康指数较为低下。
图3
图3
2010—2020年中国健康城市建设分维度健康指数空间分异
注:基于自然资源部标准地图服务网站GS(2023)2767号标准地图制作,底图边界无修改。
Fig. 3
Spatial differentiation of health indices by dimensions of healthy city construction in China from 2010 to 2020
(2)健康经济基础指数。在全国范围内经济基础健康指数的空间差异性较大,空间分布格局不均衡。计算结果显示,2010年、2015年和2020年中国341个地级市的平均经济基础健康指数分别为0.071、0.077和0.084。华东地区、华北地区的京津地区、华中地区的中部健康城市建设的经济基础子系统健康程度较高,东北地区、青藏高原的祁连山区、三江源及其周围地区以及柴达木盆地以及西南边陲地区经济基础的健康指数较低。按城市分析,深圳、北京、上海、广州经济基础健康指数排名处于前列,这些城市经济实力雄厚,经济活力强,产业结构逐渐趋于优化,地方财政稳定,而像伊春、绥化、黔东南、大兴安岭地区由于区位优势不足以及经济实力落后,经济基础健康发展程度较低。
(3)健康文化发展指数。2010年、2015年和2020年中国341个地级市的平均文化发展健康指数分别为0.017、0.022和0.025,2010年文化发展健康指数处于较高水平以上的城市仅有29个,到2020年增长为35个,增幅不大。按地区分析,东部沿海地区文化发展的健康指数最高,特别是京津地区、长三角地区和山东半岛地区形成了明显的文化发展健康指数高值区,而西北地区、西南地区、华北地区的黄土高原和内蒙古高原以及东北地区的大部在健康城市建设的文化发展处于劣势地位。按城市分析,北京、深圳、上海、杭州文化发展健康指数排名前列,这些地区高层次人才群体庞大,居民文化素质高,科研实力强;而海北、阿里、果洛等西北和西南地区的自治州和地区文化发展的健康指数偏低。
(4)健康社会服务指数。2010年、2015年和2020年中国341个地级市的平均社会服务健康指数分别为0.056、0.063和0.067,从沿海到内陆地区,社会服务健康指数呈现递减的趋势。按地区分析,社会服务健康指数处于较高水平以上的城市集中于东部沿海地区,空间上呈现南北向的狭长分布状态,处于低水平的城市主要分布在西南地区、西北地区的南部城市以及长江中上游地区。按城市分析,北京、三亚、上海、广州的社会服务健康指数排在前几位,而甘南、昭通、昌都、迪庆等由于社会保障事业滞后、就业压力大等原因社会服务健康指数处在较低水平。
(5)健康生态环境指数。2010年、2015年和2020年中国生态环境健康指数平均值分别为0.139、0.155和0.166。按地区分析,华东地区、华南地区、华中地区东部城市、华北地区南部城市健康城市建设的生态环境健康指数优于其他地区,生态环境健康指数较低的城市主要分布在西部内陆地区特别是西南地区。同时生态环境健康水平的空间分异与自然地形区的分布有着较强的关联度,华北平原、长江中下游平原以及南部地区的山地丘陵地区是生态环境健康优势区,黄土高原西部地区、内蒙古高原东北部、东北部山区如大小兴安岭山区是生态环境健康低值区。按城市分析,三亚、景德镇、广州、北京、厦门生态环境健康指数较高,这些地区大力发展生态文明建设,生态格局得到极大优化,森林覆盖率高,空气质量状况好,鹤岗、黔东南、怒江、鸡西等生态环境健康指数低。
3.3 健康城市建设的空间分布相关性分析
为便于从整体上把握健康中国建设的空间关联特征,利用ArcGIS对健康城市建设的全局Moran's I进行计算以探讨其空间集聚特征。计算结果如表4所示,2010年、2015年、2020年健康城市建设Moran's I指数均为正值,Z统计值均大于2.58,p值均<0.001。这表明地级市单元健康城市建设在空间分布上并非均质,存在显著的空间相关性,2010—2015年Moran's I指数由0.268上升到0.298,2015—2020年下降到0.295,表明从2010—2015年地级行政单元之间健康城市建设的空间集聚性增强,但2015年后空间集聚性呈现减弱趋势,但下降幅度不大。从整体上看,341个城市健康城市建设的空间集聚性仍强,但随着健康中国战略的逐步推进,各市域单元健康城市建设水平差异逐渐缩小。
表4 2010—2020年健康城市建设的全局Moran's I估计值
Tab. 4
| 年份 | Moran's I | Z(I) | p |
|---|---|---|---|
| 2010 | 0.268 | 19.2 | <0.001 |
| 2015 | 0.298 | 21.33 | <0.001 |
| 2020 | 0.295 | 21.12 | <0.001 |
基于全局自相关的检验,进一步从局部空间自相关角度计算2010年、2015年、2020年健康城市建设的Getis'G指数,并将其划分为热点区、次热点区、过渡区、次冷点区、冷点区5种类型(图4)。可以发现,2010—2020年健康城市建设的空间差异明显,各类型区地理空间分布相对较为稳定,冷热点城市在一定范围内呈现动态变化。2010年热点区城市有27个,空间分布上比较分散,主要在京津冀地区、山东半岛地区、长三角地区以及珠三角地区的部分城市形成局部热点区;到2020年热点区的城市数量达到了40个,在山东半岛城市群、长三角城市群的热点区具有向周边扩散的趋势,辐射范围扩大,表现出集群特征;次热点区主要呈现出以热点区为核心向周围扩散的趋势,表现出一定的层次性,且到2020年次热点区域扩大显著,尤其是山东半岛城市群、海峡西岸城市群、珠三角城市群以及京津冀城市群的次热点区范围增幅最大;冷点区主要分布在西部内陆的西藏、青海、新疆以及黑龙江的北部,到2020年冷点区域缩小显著,冷点区的城市由2010年的59个缩减为2020年的30个,空间分布集聚程度增高,特别是新疆北部和东部、四川盆地和横断山区受国家政策的扶持以及东部地区城市的“一对一”帮扶政策转化为次冷点区,另外由于国家出台振兴东北老工业基地政策,东北地区冷点区的范围也进一步缩小;2010—2020年过渡区和次冷点区在全国范围内分布最广,说明健康城市建设的整体水平不高,仍需进一步加强建设力度。
图4
图4
2010—2020年中国健康城市建设的冷热点空间分布
注:基于自然资源部标准地图服务网站GS(2023)2767号标准地图制作,底图边界无修改。
Fig. 4
Spatial distribution of healthy city construction hot spots and cold spots in China from 2010 to 2020
3.4 健康城市建设的区域差异分析
为全面掌握健康城市的建设的发展优势和短板,推动区域健康城市协调发展,借助Dagum基尼系数分析健康城市建设的区域差异性及其来源。计算结果显示,2010年、2015年和2020年七大地区健康城市建设的总体区域差异G值分别为0.155、0.159和0.132,均值为0.149,健康城市建设的总体区域差异的基尼系数变化可分为两个阶段,第一阶段(2010—2015年)呈上升趋势,尽管各地区健康城市建设水平呈现上升趋势,但中国各区域健康城市建设的差异逐渐增大;第二阶段(2015—2020年)呈现下降趋势,各区域之间差异性缩小,这在一定程度上是由于健康中国战略的推行,各地区开始制定健康政策,加大力度推进健康城市建设。从整体上看,2010—2020年中国健康城市建设的区域差异呈现先增后减的趋势,健康城市建设区域总体协调性仍处于较弱水平。
(1)区域内差异Gjj。总体来看,各个地区健康城市建设的区域内差异值较小且呈下降的趋势(表5)。按照区域内差异均值来看,西南地区各城市区域内差异最大达到0.123,西北地区次之,后依次为华北、华南、东北、华东,华中地区的区域内差异均值最小为0.086。2010—2020年七大地区的区域内差异均呈下降趋势,华北、华东、东北、华中、华南、西南和西北的下降幅度分别达到了12.49%、11.48%、12.22%、16.95%、14.83%、7.52%和11.54%。华中地区区域内差异均值最小且区域内差异缩小速度最快,这说明华中地区内部城市的协同能力增强,西南地区区域内差异值无较大变化,缩小速度缓慢,区域内部城市的联动性差、协同发展能力弱。
表5 中国健康城市建设的区域内差异Gjj值
Tab. 5
| 年份 | 华北 | 华东 | 东北 | 华中 | 华南 | 西南 | 西北 |
|---|---|---|---|---|---|---|---|
| 2010 | 0.102 | 0.112 | 0.116 | 0.096 | 0.115 | 0.128 | 0.119 |
| 2015 | 0.093 | 0.110 | 0.108 | 0.083 | 0.106 | 0.125 | 0.116 |
| 2020 | 0.089 | 0.100 | 0.102 | 0.079 | 0.098 | 0.118 | 0.105 |
| 均值 | 0.095 | 0.107 | 0.109 | 0.086 | 0.106 | 0.123 | 0.113 |
(2)区域间差异Gjh。用Gjh反映中国七大地区健康城市建设区域间差异的大小(表6)。整体来看,七大地区Gjh处于0.09~0.22之间。具体看,2010年区域间差异值较大处于前几位的地区为华东—西北、华南—西北、华东—西南、华南—西南,这些地区之间的Gjh均大于0.19;2015年和2020年区域间差异值较大处于前几位的地区没有发生改变,差异值最大的为华东—西北地区。这说明西北、西南地区与华东和华南地区之间健康城市建设的差异性较大,这主要因为西北和西南地区地理位置偏僻,经济发展水平较低,社会基础设施不完善,居民健康意识薄弱造成健康城市建设水平较低。
表6 中国健康城市建设的区域间差异Gjh值
Tab. 6
| 地区 | 2010年 | 2015年 | 2020年 | 2010—2020下降幅度(%) |
|---|---|---|---|---|
| 华东—华南 | 0.124* | 0.111* | 0.099* | 20.21 |
| 华东—华北 | 0.152 | 0.139 | 0.126 | 17.25 |
| 华东—华中 | 0.141 | 0.127 | 0.114 | 19.06 |
| 华东—东北 | 0.157 | 0.162 | 0.168 | -7.08 |
| 华东—西南 | 0.196※ | 0.189※ | 0.182※ | 7.15 |
| 华东—西北 | 0.217※ | 0.204※ | 0.191※ | 11.80 |
| 华南—华北 | 0.148 | 0.135 | 0.122 | 17.73 |
| 华南—华中 | 0.135 | 0.121* | 0.108* | 19.84 |
| 华南—东北 | 0.151 | 0.154 | 0.157※ | -3.43 |
| 华南—西南 | 0.192※ | 0.182※ | 0.172 | 10.86 |
| 华南—西北 | 0.213※ | 0.196※ | 0.180※ | 15.81 |
| 华北—华中 | 0.125* | 0.112* | 0.100* | 20.08 |
| 华北—东北 | 0.134* | 0.131 | 0.128 | 4.54 |
| 华北—西南 | 0.159 | 0.151 | 0.142 | 10.50 |
| 华北—西北 | 0.174 | 0.160 | 0.146 | 16.06 |
| 华中—东北 | 0.112* | 0.112* | 0.113* | -0.36 |
| 华中—西南 | 0.139 | 0.134 | 0.129 | 7.11 |
| 华中—西北 | 0.155 | 0.144 | 0.133 | 13.85 |
| 东北—西南 | 0.138 | 0.131 | 0.124 | 10.70 |
| 东北—西北 | 0.151 | 0.136 | 0.122 | 19.43 |
| 西南—西北 | 0.142 | 0.134 | 0.127 | 11.04 |
注:※表示dagum系数排在前四位;*表示dagum系数排在后四位。
2010—2020年区域间差异值较小且均处于前几位的地区为华东—华南、华北—华中和华中—东北,Gjh均小于0.126,2010年区域间差异值较小的还有华北—东北,但到2015年和2020年两个地区的差异值增大。华东地区与华南地区健康城市建设的区域间差异最小,这主要因为华东和华南地区位置相邻,社会经济基础较好、生态环境改善明显以及公共服务完善使得健康城市的建设优于其他地区,区域间协同性强、区域差异小。
从2010—2020年下降幅度看,除华东—东北、华南—东北、华中—东北外各区域间差异均呈现下降趋势,华东—华南和华北—华中Gjh下降幅度超过20%,这表明华中地区和华北地区借助临近华东和华南地区,加强与临近区域间的联系,发展健康城市建设,逐渐缩小与先进地区之间的差距。东北地区与华东、华中和华南地区区域间差异增大,主要是由于东北地区地理位置上与健康城市建设水平较高的地区相隔较远,再受经济发展方式转型滞后、社会基础设施建设较差等方面的影响。综上,西北、西南和东北地区与其他地区特别是华东和华南地区之间健康城市建设的差异性较大,华东地区与华南地区健康城市建设的区域间差异最小,整体上健康城市建设区域间差异减小,但区域间协同性仍较弱。
(3)健康城市建设的总体区域差异贡献及其构成。表7揭示了中国健康城市建设的总体差异的来源。区域间差异对健康城市建设的总体差异的贡献相对最大,均值为0.0584,平均贡献率为58.55%,远高于区域内来源和超变密度来源,且呈现上升趋势;区域内差异贡献率最小为13.84%,3个时间截面内,区域内差异贡献率大致在均值附近上下小幅波动;超变密度贡献率次之,为27.61%,这二者与区域间差异相反,贡献率呈现下降趋势。因此,要解决中国健康城市建设中的区域差异问题,缩小区域间的差异,加强区域之间的协同发展是重点。
表7 中国健康城市建设总体差异的来源
Tab. 7
| 年份 | 区域内 | 区域间 | 超变密度 | |||||
|---|---|---|---|---|---|---|---|---|
| Gw | 贡献率(%) | Gnb | 贡献率(%) | Gt | 贡献率(%) | |||
| 2010 | 0.0157 | 15.72 | 0.0531 | 53.15 | 0.0311 | 31.13 | ||
| 2015 | 0.0136 | 13.77 | 0.0575 | 58.2 | 0.0277 | 28.03 | ||
| 2020 | 0.0121 | 12.03 | 0.0647 | 64.31 | 0.0238 | 23.66 | ||
| 均值 | 0.0138 | 13.84 | 0.0584 | 58.55 | 0.0275 | 27.61 | ||
4 健康城市建设时空格局的演变机理分析
表8 健康城市建设的影响因子探测结果
Tab. 8
| 系统层 | 探测因子 | q值 | ||
|---|---|---|---|---|
| 2010年 | 2015年 | 2020年 | ||
| 健康城市本底条件 | 平均高程X1 | 0.501 | 0.482 | 0.457 |
| 平均NDVI X1 | 0.307 | 0.324 | 0.338 | |
| 人口密度X3 | 0.471 | 0.484 | 0.508 | |
| 健康城市建设基础 | 城镇化率X4 | 0.254 | 0.249 | 0.257 |
| 交通通达指数X5 | 0.436 | 0.429 | 0.441 | |
| 地均GDP产值X6 | 0.537 | 0.541 | 0.546 | |
| 健康城市发展能力 | GDP增长率X7 | 0.415 | 0.476 | 0.397 |
| 科技进步贡献率X8 | 0.407 | 0.431 | 0.468 | |
| 劳动年龄人口的平均受教育年限X9 | 0.395 | 0.423 | 0.455 | |
图5
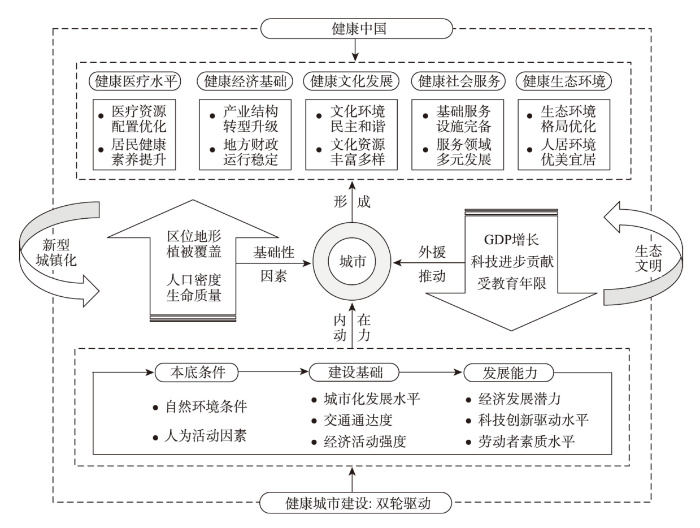
图5
健康城市建设时空格局形成机理
Fig. 5
Driving mechanism of space-time pattern of healthy city construction
(1)本底条件是影响健康城市建设的基础性因素。本底条件主要体现在地形的起伏、地表植被覆盖、人口密度等方面。平均高程和平均NDVI反映自然地理环境对健康城市建设的影响,人口密度反映社会发展基础对健康城市建设的影响,他们之间的相互作用对健康城市建设产生基础性作用。从整体上看,平均高程和人口密度对健康城市建设区域差异影响较大,均值分别为0.480和0.488,而平均NDVI对健康城市建设区域差异的影响力较小,均值为0.323。高程对城市建设最直接的影响是土地利用分布,过高的海拔对健康城市的建设起负向作用;人口密度在一定程度上反应的是城市经济的发展活力,同时提升城市的经济效率和竞争力。平均NDVI代表城市的地表植被覆盖情况,植被覆盖程度高说明城市生态环境保持率高。从q值来看,由于中国的平均NDVI空间格局并未呈现出严格的“东南高、西北低”的格局,因此平均NDVI对健康城市建设的空间格局有一定影响,且影响力在不断提高。
(2)建设基础是影响健康城市建设的内在动力因素。建设基础主要体现在城市化发展水平、交通通达度以及经济活动强度等方面,建设基础的优劣程度直接影响着健康城市建设水平,是重要内生动力。交通通达指数和地均GDP产值对健康城市建设空间差异的影响较大,均值分别为0.435和0.541。地均GDP产值是健康城市建设的空间格局的最重要影响因素,而城镇化率的影响力则较小,仅为0.253。城镇化率高意味着城市经济发展水平高和城市社会基础服务设施的完善,但是城镇化率并不能完全反映健康城市建设的区域差异,中西部地区很多城市类似鄂尔多斯、克拉玛依市等人口流动大,城镇化率高,但健康城市的建设水平低,因此城镇化率对健康城市建设的空间格局的影响呈现一个波动起伏的状态且处于较低水平;交通通达指数代表城市的交通通达度,交通通达度高,满足了城市建设的需要,同时增强便利性程度,促进城市社会经济可持续发展;地均GDP产值代表城市的经济活动强度,相对发达的经济发展水平能够保障政府财政收入以及居民消费能力进而加快健康城市的建设,经济活力强会带动众多企业新技术的蓬勃发展,创造更多就业机会,带动城市化发展水平,提高了居民生活的便捷性,维持城市社会稳定,是健康城市建设的核心支撑条件。
(3)发展能力是影响健康城市建设的外援推动因素。发展能力主要体现在经济发展潜力、科技创新驱动水平和劳动者素质水平等方面。经济发展实力的提升、创新驱动水平的提高和劳动者素质水平的提高在一定程度上增强健康城市建设的未来发展能力。GDP增长率、科技进步贡献率和劳动年龄人口的平均受教育年限对健康城市建设的空间差异的影响均较大,均值都大于0.42,分别为0.429、0.435和0.424。GDP增长率代表城市的经济发展潜力,GDP增长率高体现城市经济增速快,可以激活城市发展的活力,促进产业结构优化升级,带动城镇化水平,促进健康经济的发展,但是近年来中国东部地区诸多健康城市建设较好的城市GDP增长率呈现持续平稳下降状态,中西部诸多地区借助于大数据、航空航天、新能源等新兴产业的布局,GDP增长率持续上升,因此其对健康城市建设空间格局的影响力呈现一个先上升后下降的趋势;科技进步贡献率代表科技创新驱动水平,劳动年龄人口的平均受教育年限代表劳动者素质水平,健康城市的建设需要依靠发达的科技和高质量的教育水平,创新驱动水平和劳动力素质水平提高是健康城市建设外在的重要推动力。科技进步贡献率高、劳动年龄人口平均受教育年限的增加,可以增加科技支撑经济社会发展的整体效益,提高城市的综合创新能力。科技的不断进步也为居民提供了更加健康、智能的生活方式,促进健康社会进步,因此两个因子对健康城市建设的空间格局的影响力呈现一个较大的上升趋势。
5 推进健康城市建设的调控策略
健康城市建设是一个涉及多学科、多部门、深层次、多阶段的融合国家、政府、公民的综合性系统工程。依据不同地区健康城市建设的时空格局演变特征、本底条件、建设基础和发展能力等因素,提出以下调控策略:
(1)持续推进生态文明与美丽中国建设,夯实健康城市建设的资源环境本底条件。华东地区、华南地区、华北地区南部的平原以及低山丘陵地区的城市地形起伏小、植被覆盖指数高,城市健康城市建设的生态环境健康指数优于其他地区,经济活动强度和交通通达度高,应继续大力推进新时代生态文明建设,优化能源消费结构,降低单位能耗,优化生态格局;西南和西北地区由于特殊的气候和地形起伏条件,加上受传统城市产业结构的影响,呈现出生态环境脆弱、人口密度低、人才资源紧缺等问题,因此要加强对自然生态环境的保护与管理,坚决守住生态安全底线,推动形成可持续、可循环的生态环境格局。
(2)促进东部地区优势医疗资源合理布局,提升中西部地区基本医疗发展水平。京津、山东半岛以及东南沿海地区的城市医疗水平健康指数均处于较高水平以上,优质医疗资源分布集中,要不断优化中东部地区高水平、高等级医疗机构的布局,同时借助科技水平提高,加强远程医疗技术应用,扩大高水平医疗资源的辐射范围;西南地区、西北地区和东北地区医疗卫生服务需求大,要继续加大政府的财政投入倾斜力度,增强基础医疗资源的供给水平。加大东部地区、东南地区对其他地区的医疗对口支援工作,由政府协调,促进医院、医学类高校、医疗科技人才等资源的对口流动,促进中西部地区和东北区的医疗事业发展。同时在快速城镇化、老龄化的背景下要完善城市社区医疗的布局,提升社区医疗服务能力和服务水平,缓解快速老龄化带来的城市医疗的压力。
(3)加快东部地区经济转型发展的步伐,增强中西部地区大数据、新能源等新兴产业布局,提升经济发展的质量。华东地区、华北地区的京津地区、华中地区的中部城市得益于良好的建设基础,健康城市建设水平较高,应该继续发挥该地区建设基础的内生动力,稳步提升城镇发展水平和社会公共服务水平,大力发展科技创新,将“健康促进、健康优先”融入经济建设之中,继续增强经济活力,同时要发挥带动效应,推进发达地区的健康产业向欠发达地区的转移、升级;东北地区、青藏高原地区以及西南边陲地区要借助独特的地理位置积极扩大开放,打破区域边界,依托“一带一路”发展开放型经济,将区位条件劣势转换为优势条件,在开放中实现共赢,在促进经济健康发展的同时,提升经济发展的质量,加大对健康城市建设的支持力度。
(4)优化东部地区文化产业结构,加快中西部地区健康文化产业培育与发展的步伐。东部沿海地区特别是京津地区、长三角地区和山东半岛地区形成了明显的文化发展健康指数高值区,要持续提高人力资本水平,充分发挥“人才红利”在健康城市建设中的作用,同时要继续大力提高科技创新驱动水平,发挥“数字化战略”在文化发展中的作用,占据未来文化发展的高地;而西北地区、西南地区、黄土高原和内蒙古高原以及东北地区文化发展处于劣势地位,要扶持文化发展,深入挖掘边疆文化、工业基地文化、革命老区文化等优秀文化资源转化为健康城市建设发展的重要文化资产,重塑文化发展模式,并依托现代科学创新,增加科技研发投入强度,大力建设高质量文化。
(5)全面提升健康城市的社会服务能力,提升全社会基本公共服务均等化水平。东部沿海地区社会服务健康程度较高,要继续完善养老、就业、出行、健身等社会基础设施的建设,不断提高居民的生活幸福水平。同时要继续开发和利用社会组织,推进精细化、高品质、多元化公共服务设施的建设;处于低水平的城市,如西南地区、西北地区的南部城市以及长江中上游地区应履行政府保障基本健康服务需求的责任,对标找差,从难题入手,落实政策,健全保障机制,增强对人才的吸引力,降低流出率,提高社会服务的专业度和服务质量。
6 结论与讨论
6.1 结论
本文从地理学的角度探究了健康城市基本内涵,在此基础上构建了健康城市建设评价指标体系,采用融合“五维”体系的健康城市综合测度模型、时空差异分析方法、空间分异机理分析等方法分析了中国健康城市建设的时空格局及形成机制,主要结论如下:
(1)本文界定了健康城市建设的五维体系,即健康城市是在人地系统耦合机理指导下形成的“医疗服务公平、经济高效发展、文化素养提高、社会和谐进步、生态环境友好”的“人—地”健康协调发展的城市建设新模式,并据此构建了健康城市建设的“五维体系”。本文为促进健康城市建设和推进健康中国战略的实施提供了科学依据。
(2)健康城市评价结果显示,2010年、2015年和2020年中国341个城市综合健康指数平均值分别为0.367、0.402和0.438,上升幅度为19.35%,健康城市建设的水平总体上呈上升态势,但建设进程比较缓慢,且空间分布格局呈现地域不平衡性,总体表现为“沿海高内陆低、东部高西部低”的结构布局。2010—2020年各地级单元的健康城市建设在空间上存在明显的空间分异特征,表现出明显的全局空间正相关性,空间集聚性呈现先增强后减弱趋势。局部自相关结果表明,2010—2020年健康城市建设的冷热点在一定范围内呈现动态变化,热点区和次热点区的数量逐渐增多,冷点区的数量逐渐减少,大致呈现出“东部热,西部冷;沿海热,内陆冷”的空间分布状态;Dagum基尼系数分解显示,2010—2020年健康城市建设的总体区域差异正在缩小。
(3)健康城市建设是由多种因素综合作用的形成的复合系统,自然环境和人为活动的本底条件、建设基础和发展能力分别为健康城市建设空间格局的基础性因素、内在动力因素和外援推动因素。地均GDP产值、平均高程、人口密度、交通通达度对健康城市建设的影响较大。
(4)在健康城市建设调控策略方面,首先要充分认识到健康城市建设已从最初提出的医疗卫生领域的健康到实现“人口—社会—经济—文化—环境”等各个系统的健康协调发展;其次是健康城市的建设是一个系统性工程,且空间异质性明显,要坚持因地制宜,摒弃“因治而治”,根据区域发展特点探索各具特色的经验模式。
6.2 讨论
健康城市的建设是当前“健康中国”战略实施的一个重要的抓手,对于一个城市乃至一个国家而言都非常重要。本文系统地对健康城市从地理学的角度进行阐释,并且以全国层面上的城市为例对健康城市建设的格局进行探究,可为健康中国的推进和建设提供有力的支撑。但健康城市建设的时空格局是个复杂的动态过程,对健康城市建设水平的测度受制于指标体系的局限性相较于现实情况还存在一定差距,这可能会影响健康城市建设阶段的评判。因此,未来的研究之中要对所构建的“五维”评价体系进行完善,选用更加精确的指标综合评估健康城市的建设情况,对各个地区开展有针对性的优化和调节;本文尝试探讨了健康城市建设区域差异格局及成因,并针对性的提出了各区域推进健康城市建设的具体措施,但受制于研究基础,对于健康城市的建成标准的定量化体系,以及健康城市建设战略目标等顶层设计内容未有涉及,这也是国家层面在推进健康城市建设时需要解决的关键问题,需要在未来的研究中加以关注。
参考文献
The key fields and action suggestions of geography participating in the construction of Healthy China
DOI:10.11821/dlxb202208002
[本文引用: 2]

The interaction between health and environment is the most essential man-land relationship. Geography plays a significant role in the construction of Healthy China. It can provide path guidance based on development strategy, process evaluation and policy orientation, theoretical guidance based on man-land relationship harmony and spatial system optimization, and practical guidance based on healthy life, health service, health environment, health security and health industry layout. Combining the disciplinary characteristics of geography and the five key areas of the construction of Healthy China, geography could play a unique part in the 18 aspects, including sub-disciplines of health geography, tourism geography, economic geography, urban geography, behavioral geography, population geography, information geography, social geography, cultural geography, rural geography, and environmental geography. First, it promotes healthy life in areas of regional residents' health literacy, living style, and spatio-temporal behavior, as well as regional population mental health. Secondly, it improves healthy service in areas of disadvantaged people health service, major diseases prevention and control, and sustainable health in key regions. Thirdly, it constructs an environment in areas of healthy eco-environmental construction, healthy climate change response, environmental health risk detection, healthy urban and rural environmental construction, and healthy cultural landscape construction. Next, it enhances healthy protection in areas of geographic information system (GIS), optimization of medical resource allocation, healthy services accessibility, and fairness. Finally, it develops healthy industry in areas of development of local medicine and traditional Chinese medical industry, healthy tourism and entertainment, optimization of senior care, maternal and infant industry. However, nowadays, the contribution of geography in building the Healthy China is limited because of the following reasons: (1) weak basis for health geography; (2) lack of strong sense of participation; and (3) lack of policy support from geographical organization. In the future, more research should be focused on problem-oriented and policy-oriented geographical theory, empirical and policy research, health promotion research of deep integration of geographic technology and thinking, and systematic guidance and policy support for geographers to participate in the construction of Healthy China.
地理学参与健康中国建设的重点领域与行动建议
DOI:10.11821/dlxb202208002
[本文引用: 2]
健康与环境关系是最基本的人地关系,“健康中国”建设需要地理学参与。地理学能为健康中国建设提供基于发展战略、过程评价和政策导向的路径指引,基于人地关系和谐和空间系统优化的理论指导,基于健康生活引导、健康服务优化、健康环境营造、健康保障决策、健康产业布局的实践指南。地理学参与健康中国建设,可在居民健康素养、健康生活方式与时空行为、区域人群心理健康,重点人群健康服务、重大疾病监测防控、重点区域健康促进,健康大数据与信息系统、医疗卫生资源优化配置、健康服务可达性与公平性,气候变化的健康应对、健康生态环境建设、环境健康风险治理、健康城市(环境)建设、健康乡村(环境)建设、健康文化景观建设,道地药材开发与中医药产业布局、康养旅游与健身休闲产业布局、养老服务与妇婴产业布局等18个领域发挥独特优势。地理学参与健康中国建设还存在地理科学的健康基础薄弱、地理学者的参与意识不强、地理组织的政策支持不够等问题,需要强化问题导向和目标导向的健康地理学的理论、实证和政策研究,强化地理应用技术与地理科学思维深度融合的健康促进研究,强化地理组织对地理学者参与健康中国建设的系统引领与政策支持。
Give priority to the development strategy of ensuring people's health
把保障人民健康放在优先发展战略位置
Planning to build a healthy city is the key to improving the livability of the city
规划建设健康城市是提高城市宜居性的关键
Healthy cities and the city planning process: A background document on links between health and urban planning
Healthy cities: Key to a healthy future in China
DOI:S0140-6736(18)30608-1 PMID:29678343 [本文引用: 1]
Do healthy cities work? A logic of method for assessing impact and outcome of healthy cities
DOI:10.1007/s11524-011-9617-y URL [本文引用: 2]
Healthy cities indicators: Analysis of data from cities across Europe
European Healthy City Network Phase V: Patterns emerging for healthy urban planning
Research on the evaluation system of healthy cities in subtropical regions: A case study of Guangzhou
亚热带地区健康城市评价体系研究: 以广州为例
Determining thresholds for spatial urban design and transport features that support walking to create healthy and sustainable cities: Findings from the IPEN Adult study
Healthy cities indicators: A suitable instrument to measure health?
DOI:10.1007/s11524-011-9643-9 URL [本文引用: 1]
Healthy cities: Facilitating the active participation and empowerment of local people
DOI:10.1007/s11524-011-9623-0 URL [本文引用: 1]
Four urban health paradigms: The search for coherence
Building the healthy city: The role of nonprofits in creating active urban parks
DOI:10.2747/0272-3638.32.5.682 URL [本文引用: 1]
Temporal-spatial relationship between health resources and residents' health in Southern China
DOI:10.11821/dlyj020181028
[本文引用: 1]
<p id="C3">Health is not only the basic human right, but also the foundation of personal happiness and national prosperity. Over the past 40 years of reform and opening up, Chinese residents' health has continued to improve. Health resources are the material basis for maintaining residents' health, and residents' health level is closely related to health resources level. At present, there are significant regional differences in health resources and residents' health in China. Promoting equalization level of health resources and reducing regional differences in residents' health are an important goal of "Healthy China" construction and also a vital task of health geography research. Therefore, it is of great academic value and practical significance to study the relationship between health resources and residents' health in China. Based on the coefficient of variation, geographic mapping and GWR, this paper analyzed the temporal and spatial variations of health resources and residents' health in Southern China from 2000 to 2015, and the temporal-spatial relationship between health resources and residents' health. The results showed that:</p> <p id="C3-1">(1) In the past 15 years, the health resources level of most of municipalities in Southern China (96.02%) has been continuously improving. Meanwhile, the spatial difference of health resources level gradually decreases, and the equalization level continues to increase, which is reflected as the continuous expansion of high-value region, the shrinking of low-value region and the decline of the coefficient of variation of municipalities by 23.29%. Furthermore, the western Sichuan Plateau, the Yangtze River Delta and the Pearl River Delta are the high value-region of health resources. </p> <p id="C3-2">(2) In the past 15 years, the residents' health level of all municipalities in southern China has been continuously improving. The spatial difference of residents' health level from east to west is obvious, but the high-value region expands continuously, the low-value region shrinks continuously, the spatial difference decreases greatly and the coefficient of variation of municipalities decreased by 64.62%.</p> <p id="C3-3">(3) In Southern China, residents' health level is moderately positively correlated with the health resources level (r=0.49), but in different cities, the contributions of health resources level to residents' health level are different, which shows significant spatial heterogeneity effects.</p>
中国南方地区卫生资源与居民健康的时空关系
DOI:10.11821/dlyj020181028
[本文引用: 1]
卫生资源是维护居民健康的物质基础,居民健康水平与卫生资源水平密切相关。采用空间变异系数、GIS空间分析、地理加权回归等分析方法,对2000—2015年中国南方地区的卫生资源与居民健康的时空关系进行研究,结果表明:① 过去15年间,中国南方地区绝大多数地市(96.02%)的卫生资源水平都是持续提高的;卫生资源水平的空间差异逐渐减小,均等化程度不断提升,表现为最高区不断扩大,最低区不断缩小,空间变异系数下降23.29%;川西高原、长江三角洲、珠江三角洲为卫生资源水平最高区。② 过去15年间,中国南方地区所有地市的居民健康水平都是持续提高的;居民健康水平呈现出自东向西梯度降低的空间分异,最高区不断扩张,最低区不断收缩,空间差异大幅减小,空间变异系数下降了64.62%。③ 中国南方地区的居民健康水平与卫生资源水平呈中度显著正相关(r=0.49),但在不同的地市,卫生资源水平对居民健康水平的贡献是不一样的,呈现出显著的空间异质性影响。
The health status of citizens in China and its influencing factors
我国城市居民健康状况及影响因素研究
A comparative study on the level of healthy city construction in China under the background of healthy China: Based on the analysis of seven demonstration cities in sub-provincial cities
健康中国背景下我国健康城市建设水平的比较研究: 基于副省级城市中7个示范城市的分析
Evidence for healthy cities: Reflections on practice, method and theory
Spatial optimization of residential care facility locations in 2020 in Beijing: Maximum equity in accessibility
DOI:10.18306/dlkxjz.2015.12.009
[本文引用: 1]
Beijing is facing rapid population aging. Residential care plays an increasingly important role in the care for the elderly people. It is of great importance to optimize the layout of residential care facilities to ensure equal and reasonable access, which has scientific and practical implications. This study first forecasted the spatial distribution of the elderly population under natural growth in 2020 in Beijing. Second, a spatial optimization model was established to maximize equity in access to residential care facilities. The Particle Swarm Optimization algorithm was used to solve the optimization model. As the results show, the elderly population aged 60 or older will reach 4.37 million in 2020 in Beijing, among which 7.9%, 50.2%, 30.1%, and 11.8% of the total elderly population will be located in the Capital Core Functional Area, Urban Functional Extension Area, Urban New Developing Area, and Ecological Protection Area, respectively. By contrast, 2.7%, 32.7%, 48.5%, and 16.1% of the total residential care facility (RCF) beds will be located in the Capital Core Functional Area, Urban Functional Extension Area, Urban New Developing Area, and Ecological Protection Area, respectively when optimized. The optimized RCF layouts improve spatially equal access to residential care resources with very low accessibility standard variation (0.0026), while the accessibility standard variation of actual layouts is 8 times (0.0207) that of the optimized results. In the layouts with maximum equity in access, only a portion of the demands for residential care in the Capital Core Functional Area and Urban Functional Extension Area will be met locally. The residential care resources in the Urban New Developing Area will meet both the local demands and the demands from the two functional areas in the central city. The Ecological Protection Area, however, mainly provides residential care services for the local elderly population. The optimized results of this study correspond to the “Special Plan for the Development of Residential Care Facilities in Beijing,” which also conforms to the reality that the land resources are in shortage in the central city and the physical environment in the suburb is more pleasant for the elderly people. The results of this study will support knowledge-based policy-making and planning of residential care facilities. The methods introduced in this study can also be applied to the spatial optimization of other types of public service facilities.
基于公平最大化目标的2020年北京市养老设施布局优化
DOI:10.18306/dlkxjz.2015.12.009
[本文引用: 1]
北京市正快速步入老龄化社会,机构养老作为一种重要的养老模式,对其布局公平性和合理性的研究具有重要的科学和现实意义。本文首先预测了自然增长状态下2020年北京市老龄人口的空间分布,然后建立设施布局优化模型,该模型以各需求点到养老设施的可达性差异最小化为目标;并采用粒子群优化算法求解,对北京市养老设施进行以公平最大化为目标的布局优化。研究结果表明,在公平最大化的目标下,首都功能核心区和城市功能拓展区(即中心城区)所提供的机构养老资源不能完全满足本地需求。城市发展新区在满足当地的机构养老需求之外,还将为中心城区提供大量机构养老服务,生态涵养发展区在满足本地需求的基础上还可为其他地区提供少量机构养老服务。该布局导向与《北京市养老设施专项规划》提出的布局建议相一致,且符合中心城区用地紧张、郊区自然环境较舒适的现实情况。研究结果能为养老政策的制定提供科学建议,所采用的方法也能为其他类型公共服务设施的布局优化提供借鉴。
Impact of human settlements on public health: New frontier in urban planning research
人居环境对健康的主动式干预: 城市规划学科新趋势
Research on health-oriented human settlements planning in the context of Healthy China: A case study of Hangzhou
健康中国背景下健康导向型人居环境规划研究: 以杭州市为例
High-quality health systems in the Sustainable Development Goals era: Time for a revolution
Spatial equilibrium state and its time evolution of medical health resource supply level in China
DOI:10.13249/j.cnki.sgs.2018.06.005
[本文引用: 1]
In the context of the national efforts to promote the equalization of medical and health services, to get a correct understanding of the status quo of equalization of medical and health resources and a scientific evaluation of the country to promote the equalization of medical and health services, this article discusses spatial equilibrium of medical and health resources and its time evolution, using the data of 338 cities in China as the research sample, using the medical resources supply level as a measure index of the health service. Based on the methods of kernel density estimation, Gini coefficient and its decomposition and LISA time path analysis, the spatial equilibrium analysis framework of state-region-city domain is constructed, and the spatial equilibrium state of medical and health resources and its temporal evolution are quantitatively described. The results show that: the spatial distribution of medical and health resources is moving towards equilibrium, and the crossed level of medical and health resources is higher between three regions. The high concentration area is mainly maintained in western Xinjiang, Tibet and Sichuan Region, the low and low agglomeration areas are scattered in the provinces such as Henan Province, Jiangxi Province and Guangxi Zhuang Autonomous Region. In particular, there is a concentrated distribution area in the transitional zone between the eastern coast and the central region, the level of medical and health resources supply exists “Beijing-Shantou low belt”, which is an underdeveloped area between two developed areas in Chinese eastern costal and Beijing-Guangzhou railway, and located in “Beijing-Kowloon line”(Beijing to Jiujiang) and the south extension of the “Jiu Shan line” (Jiujiang to Shantou) along the railway. Compared to economic developmentof “Beijing-Shantou low belt”, the medical and health resourcesin “Beijing-Shantou low belt” have a small span between the north and south, and a small east-west span. At the same time, the spatial and temporal path analysis of medical and health resources supply level indicates that the spatial pattern shows a strong stability. The relative length of the time route in the central and eastern regions is relatively small, and the supply level of medical and health resources is relatively slow. In particular, the “Beijing-Shantou Troughs” are basically in the areas with the lowest relative length. Time course curvature is generally small, indicating that the development of medical and health resources supply level has a relatively stable spatial dependence and spatial change direction, that is, strong spatial locking effect. The degree of equalization of medical and health resources has been significantly improved on the national scale, while the supply level of medical and health resources in the region begins to appear. This requires the government to change the support of medical and health services to achieve the full coverage from the basic public health support to the health care services behind the focus of support; at the same time, perfecting the transfer payment system, improving the ability of backward areas to provide medical and health services, and achieve health care resources reasonable allocation in the regions, which is also the connotation of “everyone enjoys basic medical and health services”.
中国医疗卫生资源供给水平的空间均衡状态及其时间演变
DOI:10.13249/j.cnki.sgs.2018.06.005
[本文引用: 1]
为正确认识医疗卫生资源空间分布的现状,以医疗卫生资源空间均衡状态及其时间演变趋势为研究内容,采用中国338个地级市为研究样本,运用核密度估计、基尼系数及其分解和LISA时间路径分析等方法,构建国家-区域-市域3个层次的空间均衡分析框架,定量刻画医疗卫生资源空间均衡状态及其时间演变特征。研究结果表明,医疗卫生资源的空间分布正在走向均衡;医疗卫生资源供给水平在三大区域之间的交错程度较高且呈现逐渐增高的趋势;在东部沿海到中部地区的过渡地带存在集中分布的低低集聚区,即医疗卫生资源供给水平同样存在“京汕低谷带”。
What is the meaning of urban liveability for a city in a low-to-middle-income country? Contextualising liveability for Bangkok, Thailand
DOI:10.1186/s12992-018-0425-y [本文引用: 1]
Toward the Healthy City:People
City planning and population health: A global challenge
DOI:10.1016/S0140-6736(16)30066-6 URL [本文引用: 1]
Basic rules and key paths for high-quality development of the new urbanization in China
DOI:10.11821/dlyj020180445
[本文引用: 1]
The high-quality development of the new urbanization in China is focused on man-earth harmony, people-oriented principle, low-carbon, ecology, innovation, wisdom and safety. It is an organic unity of high quality citizenization, infrastructure, living environment, urban construction, public service and urban management. Promoting the new urbanization is an important way for China to build a moderately prosperous society in all respects and achieve modernization basically, and it is an important way to realize the strategy of rural revitalization. To promote the development of China's new urbanization, we need to follow the four stage rule and gradual development rule. To realize the strategy transformation of new urbanization, it is necessary to make more changes: from the quantitative to the quality-oriented, from the "one step" to "step by step" in realizing our goals, from radical to gradual, from inducing "negative effect" to releasing the "positive energy", from passive to active, from "land-oriented" to "people-oriented". The current situation and background conditions of China's urbanization are very different from one place to another. Thus, we should avoid "one-size-fits-all" in promoting the development of new urbanization. Adhering to the principle of adapting local conditions and appropriate conditions, the paper divides the new urbanization area into five major types, including urban agglomeration region (I), major grain-producing region (II), farming, forestry, and animal husbandry region (III), linked poverty alleviation region (IV), and ethnic autonomous region (V), which are further divided into 47 sub-regions. The urbanization development mode between different regions and different subregions cannot be copied from each other, and we need to implement some diversified and differentiated models. According to the main functions of different types of urbanization regions, the different development policies of urbanization should be formulated, and development goals and priorities should be put forward according to local conditions, and the classification guidance should be proposed according to the appropriate conditions. The key paths to promote the high-quality development of China's new urbanization include: enhance the overall synergy of high-quality development and improve the quality of urban agglomeration development; promote the integrated development of industrial and urban areas and the equalization of basic urban public services, and improve the quality of urban development; propel integrated development between urban and rural areas and accelerate the revitalization of rural areas; highlight the main functions of urbanization quality development in different types of areas in accordance with local conditions; innovate institutional mechanisms and ensure that high-quality development is carried out throughout the trial process of new urbanization; standardize small towns with distinctive features and lay a solid foundation for the high-quality development of new urbanization; strengthen the analysis and regulation of the capacity of resources and environment for the high-quality development of new urbanization.
中国新型城镇化高质量发展的规律性与重点方向
DOI:10.11821/dlyj020180445
[本文引用: 1]
中国新型城镇化高质量发展是一种人地和谐、高效低碳、生态环保、节约创新、智慧平安的质量提升型城镇化,是高质量的城市建设、高质量的基础设施、高质量的公共服务、高质量的人居环境、高质量的城市管理和高质量的市民化的有机统一。高质量推进新型城镇化发展需要遵循城镇化发展的四阶段性规律和渐进式规律,实现新型城镇化由数量型向质量型、由“一步到位”向“分步到位”、由激进式向渐进式、由诱发“负效应”向释放“正能量”、由被动性向主动型、由“地为本”向“人为本”的战略转型。考虑到中国新型城镇化发展的地域差异显著,新型城镇化高质量发展客观上要因地制宜、因类指导,可将全国新型城镇化高质量发展区域划分为城市群地区(Ⅰ)、粮食主产区(Ⅱ)、农林牧地区(Ⅲ)、连片扶贫区(Ⅳ)、民族自治区(Ⅴ)共5大高质量发展类型区和47个亚区。未来推进中国新型城镇化高质量发展的重点路径包括:增强新型城镇化高质量发展的整体协同性,提高城市群发展质量;推动产城深度融合发展,加快实现基本公共服务均等化,提升城市发展品质与质量;推动城乡深度融合发展,在新型城镇化高质量发展中实现乡村振兴;突出因地制宜,明确不同类型地区城镇化高质量发展的主体功能;创新体制机制,全过程推进城镇化高质量发展;量力而行,以特取胜,规范建设特色小镇,夯实新型城镇化高质量发展的基石;把新型城镇化高质量发展与区域资源环境承载力及高质量保护有机结合起来。
Study on relationship of coupling coordination between the development of healthy city and the intensive use of land under the background of ecological civilization: A case from Beijing-Tianjin-Hebei region
生态文明背景下健康城市发展与土地集约利用耦合协调关系研究: 以京津冀为例
On the construction of Chinese high-quality development evaluation system and the path of its transformation in the new era
新时代我国高质量发展评判体系的构建及其转型路径
The healthy city: Its function and its future
DOI:10.1093/heapro/1.1.55 URL [本文引用: 1]
Promoting Health in the Urban Context
//WHO. Healthy Cities Papers.
Development and practical model of healthy city programs in China
中国健康城市建设的进展及理论思考
Duet attributes of healthy city system: Indemnificatory and propel
健康城市系统双重属性:保障性与促进性
The health assessment of the urban ecosystem of Xining city
DOI:10.11821/yj2010020004
[本文引用: 1]
Research of ecosystem health is becoming a comprehensive cutting-edge discipline focusing on human activity, socio-economic organizations, the natural systems and human health, which has attracted more and more attention in China since the beginning of the 21st century. Urban ecosystem health assessment is an important direction of development in ecosystem health research, especially in the health of urban living environment, which well runs the city as a community or an eco-system. Based on the connotations of the health assessment of urban ecosystem, five indexes are selected to build an evaluation system, including dynamics, organizational structure, resilience, ecosystem services and the health status of populations. Besides the method of fuzzy mathematical models is applied to analyze and evaluate the health of the urban ecosystem of Xining city from 2000 to 2008. The results show that the health status of the ecosystem of Xining city was mainly at a pathological level and tended to be improving year by year during the nine years. Per capita GDP, urban population density, per capita green area, sewage treatment rate, the Engel's coefficient and the number of well-educated people have exerted influence on the healthy development of Xining. It is forecasted that the sick and unhealthy status will have a declining trend in the next three years, while the healthy and very healthy status will have a rising trend, suggesting that the ecosystems of Xining will be further improved. And the health in the three years will be mainly in a sub-health state. In fact, forensic analysis will greatly enrich the health of China's urban ecosystem as a case study. It is of great practical significance to monitor urban ecological environmental changes in urban planning. Ecosystem health assessment studies on sustainable development are a contemporary hot spot, and how to accurately predict the status of the future healthy development needs to be further explored.
西宁市城市生态系统健康评价
Effects of the government's health expenditure on the health of rural residents in China
政府卫生支出对中国农村居民健康的影响
Urban ecosystem health assessment based on vitality index and set-pair analysis
基于生命力指数与集对分析的城市生态系统健康评价
Chinese urbanization speed judging based on urbanization quality
DOI:10.13249/j.cnki.sgs.2010.05.643
[本文引用: 1]
After illuminating the connotation of urbanization quality, this paper constructed an index system comprised with 31 indicators, from three aspects including strength of urban infrastructure, coordination degree of urbanization and sustainable level of urbanization. On this basis, models of urbanization quality evaluation and coordination evaluation between urbanization "quality" and "quantity" were established. Using United Nations method, this paper amended the urbanization rate of China(excluding Hongkong, Macao and Taiwan) since the Reform and Opening Up, and then judged China's urbanization rate and moderation of inter-provincial urbanization speed of 2008 based on statistical data of 1978~2008 and latest statistics of each province in 2008. The results show that: ① Mass index of Chinese urbanization increased gradually from 1978 to 2008, and the coordination between urbanization speed and quality was getting better. But the speed of urbanization was slightly lagging behind. ② In 2008,China's inter-provincial urbanization indices were significant different,turning lower from the eastern, central to western. Urbanization in China can be divided into five types: serious quality lag- type, quality lag- type,coordination- type,speed lag-type,and serious speed lag-type. ③ Population can't reflect the real level of urbanization quality. And corresponding relationship between city scale and quality of urbanization didn't exist, which means it's not correct that larger city was better in quality. ④ Balance of Chinese urbanization quality in each aspect was obviously insufficient. Urban foundation strength was the main driving force of improving urban quality currently. Assuredly, there were still many insufficiencies in those areas where provided with high quality of urbanization development or better coordination between speed and quality.
基于城市化质量的中国城市化发展速度判定分析
Setting standards for urban development: Review of evaluation of urban high-quality development
为城市发展定标: 城市高质量发展评价研究综述
Research on regional differences and polarization of China's health construction level from a Multi-dimensional perspective: Based on the strategic goal of "Healthy China 2030"
多维度视阈下中国健康建设水平的区域差异与极化研究: 基于“健康中国2030”战略视角
Analysis of population health vulnerability assessment and influencing factors in Zhejiang Province
DOI:10.13249/j.cnki.sgs.2020.08.008
[本文引用: 1]
Population health vulnerability has gradually become a new hotspot in the field of vulnerability research. Reducing the urban population health vulnerability and improving the population health resilience are not only important to the connotations of building healthy city, but also an important support to enhance the ability to respond to urban public health emergencies. This paper use authoritative data such as statistical yearbooks and government statistical bulletins to build a population health vulnerability assessment index system from the two dimensions of population health sensitivity and coping. Using the set pair analysis method to evaluate the health vulnerability of 11 cities in Zhejiang Province from three aspects: degree of identity, degree of difference and degree of opposition. The research shows that: 1) The ranking of the vulnerability index of each city maintains a high consistency with the sensitivity index, and shows heterogeneity and randomness with the coping index. 2) From the perspective of the overall trend, the impact of sensitivity on the vulnerability index is greater than coping index, indicating that attention should be paid to sensitivity indicators in constructing healthy cities, and reducing sensitivity is the key to reducing the urban population's health vulnerability index. 3) The main factors influencing the health vulnerability of the urban population tend to be the same, but the core leading factors are different. In the process of constructing a healthy city, the corresponding construction measures should be proposed on the basis of full evaluation and research. 4) Sensitivity and response capability to large public health emergencies should be taken into account in the assessment of urban population health vulnerability.
浙江省人口健康脆弱性评估及影响因素分析
DOI:10.13249/j.cnki.sgs.2020.08.008
[本文引用: 1]
运用集对分析法从敏感性和应对性2个方面对浙江省11个地市的人口健康脆弱性进行评估。研究表明:① 从敏感性和应对性2个维度对城市人口健康脆弱性进行评估的方法具有一定可靠性,但在突发大型流行性病毒感染疫情的情境下仍需进一步完善;② 各地市脆弱性指数排名与敏感性指数保持较高一致性,而与应对性指数则表现出异质性和随机性,认为降低敏感性是降低城市人口健康脆弱性指数的关键;③ 城市人口健康脆弱性评价还应该增加城市对大型突发公共卫生事件的敏感性和应对能力的考量,相应的评估方法和模型仍有待进一步研究。
A study on the evaluation of urban green development quality: The case of Jiangsu province
基于绿色发展的城市发展质量评价研究: 以江苏为例
Assesment of land eco-security of the Hengyang city on the principal component
基于主成分分析的衡阳市土地生态安全评价
Temporal and spatial patterns evolution of county urbanization quality in Anhui
安徽省县域城镇化质量的时空演变
Agglomeration and dispersion of city sizes and the influence of central cities: Based on the multi-scale spatial autocorrelation and the case of China
城市规模的空间聚散与中心城市影响力: 基于中国637个城市空间自相关的实证
A new approach to the decomposition of the Gini income inequality ratio
DOI:10.1007/BF01205777 URL [本文引用: 1]
Geodetector: Principle and prospective
DOI:10.11821/dlxb201701010
[本文引用: 1]
Spatial stratified heterogeneity is the spatial expression of natural and socio-economic process, which is an important approach for human to recognize nature since Aristotle. Geodetector is a new statistical method to detect spatial stratified heterogeneity and reveal the driving factors behind it. This method with no linear hypothesis has elegant form and definite physical meaning. Here is the basic idea behind Geodetector: assuming that the study area is divided into several subareas. The study area is characterized by spatial stratified heterogeneity if the sum of the variance of subareas is less than the regional total variance; and if the spatial distribution of the two variables tends to be consistent, there is statistical correlation between them. Q-statistic in Geodetector has already been applied in many fields of natural and social sciences which can be used to measure spatial stratified heterogeneity, detect explanatory factors and analyze the interactive relationship between variables. In this paper, the authors will illustrate the principle of Geodetector and summarize the characteristics and applications in order to facilitate the using of Geodetector and help readers to recognize, mine and utilize spatial stratified heterogeneity.
地理探测器: 原理与展望
DOI:10.11821/dlxb201701010
[本文引用: 1]
空间分异是自然和社会经济过程的空间表现,也是自亚里士多德以来人类认识自然的重要途径。地理探测器是探测空间分异性,以及揭示其背后驱动因子的一种新的统计学方法,此方法无线性假设,具有优雅的形式和明确的物理含义。基本思想是:假设研究区分为若干子区域,如果子区域的方差之和小于区域总方差,则存在空间分异性;如果两变量的空间分布趋于一致,则两者存在统计关联性。地理探测器q统计量,可用以度量空间分异性、探测解释因子、分析变量之间交互关系,已经在自然和社会科学多领域应用。本文阐述地理探测器的原理,并对其特点及应用进行了归纳总结,以利于读者方便灵活地使用地理探测器来认识、挖掘和利用空间分异性。
