

1 引言
北极地区是全球气候变化最为剧烈的地区之一。1979—2021年北极地区的升温速度(0.73 ℃/10a)是全球其他区域的4倍[1],这一现象被称为“北极放大”效应(Arctic Amplification, AA)[2-3]。北极放大效应加速海冰融化并导致反照率降低,进而形成对气候的正反馈效应[3⇓⇓⇓-7]。北极放大效应不仅直接改变了极地海洋、海冰、积雪/冻土、冰川与冰盖等极地系统要素[8-9],而且对北极地区生态环境[10⇓⇓-13],乃至北半球中高纬度地区[14-15]以及全球的大气圈[16⇓-18]、水圈[19]、生物圈[20]和人类经济社会[21-22]产生深远影响。越来越多的研究表明,近年来北半球频发的极端气候与水文事件,诸如高温、热浪、干旱、强降水、洪涝等,均与北极放大具有密切的关联[23-24]。
图1

图1
北极流域地理位置分布及主要河流的年径流变化
Fig. 1
Geographic distribution of Arctic river basins and temporal changes in annual runoff from major rivers
2 北极流域概况及研究历程回顾
北极地区的大河主要分布在欧亚大陆和北美地区。其中,欧亚大陆上的北极河流主要分布在俄罗斯境内(图1),自西向东主要包括北德维纳河(Northern Dvina)、伯朝拉河(Pechora)、鄂毕河(Ob)、普尔河(Pur)、塔兹河(Taz)、叶尼塞河(Yenisei)、哈坦加河(Khatanga)、奥列尼奥克河(Olenek)、勒拿河(Lena)、亚纳河(Yana)、因迪吉尔卡河(Indigirka)和科雷马河(Kolyma)。在北极地区的6条最大河流中,其中4条河流(鄂毕河、叶尼塞河、勒拿河、科雷马河)位于欧亚大陆的西伯利亚地区(表1)。从俄罗斯境内流入北冰洋的多年平均河流径流量为2922 km3,约占北冰洋的河流径流总汇入量的55.6%[47]。
| 河流 | 水文站纬度 (°N) | 水文站经度 (°) | 多年平均径流量 (km3) | 流域面积 (106 km2) | 径流观测时段 |
|---|---|---|---|---|---|
| 鄂毕河 | 66.63 | 66.60 E | 405 | 2.95 | 1936—2022年 |
| 叶尼塞河 | 67.43 | 86.48 E | 570 | 2.44 | 1936—2022年 |
| 勒拿河 | 70.68 | 127.39 E | 544 | 2.43 | 1936—2022年 |
| 科雷马河 | 67.47 | 153.69 E | 105 | 0.65 | 1978—2022年 |
| 育空河 | 61.93 | 162.88 W | 209 | 0.83 | 1976—2021年 |
| 麦肯锡河 | 67.45 | 133.74 W | 292 | 1.75 | 1973—2022年 |
| 北德维纳河 | 64.13 | 41.92 E | 102 | 0.35 | 1956—2022年 |
| 伯朝拉河 | 65.42 | 52.28 E | 114 | 0.25 | 1932—2020年 |
| 普尔河 | 67.01 | 78.22 E | 168 | 0.11 | 2018—2022年5—10月 |
| 奥列尼奥克河 | 71.85 | 123.65 E | 42 | 0.22 | 1991—2022年 |
| 亚纳河 | 70.77 | 136.08 E | 33 | 0.24 | 1978—2022年 |
自21世纪初以来,全球科学家开始关注北极地区径流变化及其背后的物理机制[30-31,53]。表2列出了1912—2018年间北极流域地表径流的不同估算结果。值得注意的是,由于不同学者关注的流域范围不同(从局部区域的5.26×10⁶ km2至全流域的24.20×10⁶ km2),选取的研究时段和研究方法也存在差异,由此得到的多年平均径流深介于200~234 mm之间不等。近年来,北极流域径流观测与模拟的研究手段不断改进,从早期单一的水文观测数据整编,发展到当前基于水文气象数据及水文模型的径流量估算[30,44,54]。研究数据也从传统的水文监测[55],扩展至气象卫星监测[44]与遥感大数据[56]相结合等。
表2 北极地区地表径流量评估汇总表
Tab. 2
| 序号 | 汇流面积 (106 km2) | 多年平均径流量 (km3) | 多年平均径流深 (mm) | 研究时段 | 研究方法 | 文献来源 |
|---|---|---|---|---|---|---|
| 1 | 12.9 | 2603 | 202 | 1912—1995年 | 观测 | [57] |
| 2 | 24.2 | 4749 | 212 | 1960—1989年 | 观测+分析 | [55] |
| 3 | 9.1 | 1932 | 212 | 1936—1999年 | 观测 | [31] |
| 4 | 16.9 | 3658 | 216 | - | 观测+模型 | [58] |
| 5 | 18.9 | 4314 | 228 | 1921—1999年 | 观测+分析 | [44] |
| 6 | 23.7 | 5250 | 222 | 1921—1999年 | 观测+分析 | [44] |
| 7 | 11.4 | 2310 | 203 | 1940—1990年 | 观测 | [59] |
| 8 | 16.4 | 3596 | 219 | 1979—1999年 | 模型 | [54] |
| 9 | 8.8 | 1796 | 204 | 1936—2006年 | 观测 | [60] |
| 10 | 12.1 | 2420 | 200 | 1964—2000年 | 观测 | [61] |
| 11 | 15.8 | 3162 | 200 | 1980—1999年 | 模型 | [62] |
| 12 | 16.7 | 3730 | 223 | 2003—2005年 | GRACE卫星 | [56] |
| 13 | 19.0 | 4300 | 226 | 1936—2006年 | 观测+模型 | [63] |
| 14 | 5.26 | 1154 | 219 | 1964—2013年 | 观测 | [64] |
| 15 | 11.3 | 2310 | 204 | 1970—2017年 | 观测 | [65] |
| 16 | 13.5 | 2996 | 221 | 1975—2015年 | 观测+分析 | [66] |
| 17 | 22.1 | 5169 | 234 | 1984—2018年 | 模型 | [30] |
3 北极流域径流变化特征
3.1 年径流变化特征
3.2 冬季径流变化特征
1980—2009年鄂毕河、叶尼塞河、勒拿河和麦肯锡河在12月至次年2月间的总径流量增加1.3%[78]。1980—2019年勒拿河、科雷马河、育空河和麦肯锡河的冬季径流量分别增加了43%、72%、16%和16%,为年均径流增幅的1.7~5.2倍[72]。此外,相比于1936—1975年,1976—2015年期间欧亚大陆地区的北德维纳河、伯朝拉河、鄂毕河,以及西西伯利亚北部的河流和拉普捷夫海流域西部的河流,冬季径流量增加了15%~40%[47]。而同期叶尼塞河、勒拿河和科雷马河的冬季径流量增加更为明显,分别为68%、47%和174%[47]。值得注意的是,小流域的冬季径流变化通常更为显著,如1995—2019年叶尼塞河上游流域冬季径流增加了80%,而同期的年径流量仅增加7%[71]。
4 快速升温下的北极径流变化驱动
图2
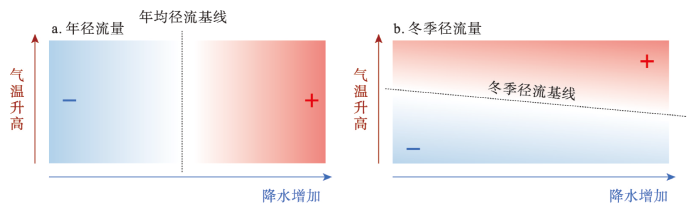
图2
北极流域年径流量和冬季径流量对气温与降水变化的响应
Fig. 2
Schematic diagram illustrating the response of annual runoff and winter runoff in the Arctic basin to changes in temperature and precipitation
图3
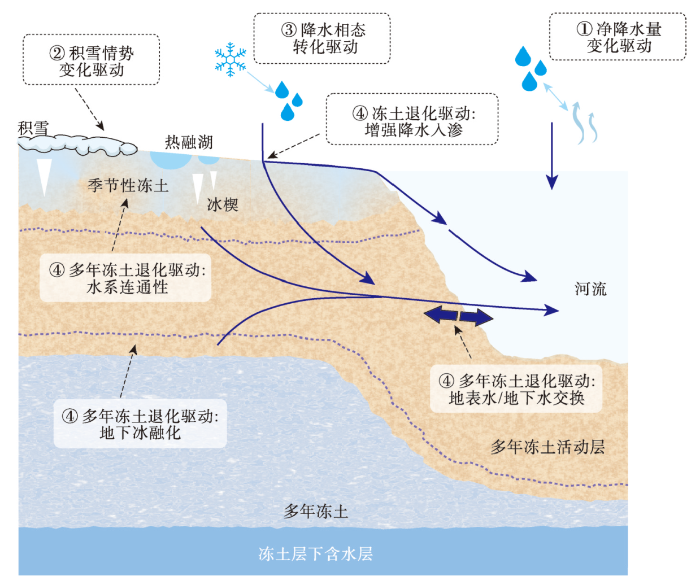
图3
北极流域径流过程变化的主要驱动示意图
注:修改自Liu等[72]。
Fig. 3
The schematic diagram depicting the key drivers that predominantly influence hydrological processes
within the Arctic river basin
4.1 净降水量变化驱动
受气候变化的影响,包括鄂毕河、叶尼塞河、勒拿河、麦肯锡河等在内的北极流域正在变得更加温暖和湿润[93-94]。随着气温升高,北极地区蒸发量增加[95],其中冬季[29]和多年冻土区[96]的增速更为显著,这导致了大气中的水汽含量增加。根据克劳修斯—克拉贝龙方程(Clausius-Clapeyron relation),温度每升高1 ℃,大气水分含量约增加7%[97],进而带来降水增加[98]。1979—2017年北极陆地降水的增速为(0.10±0.05) (mm/d)/100 a[99],同期西伯利亚三大流域的年降水增速可达0.25 (mm/d)/100 a [100]。研究证实,北极地区降水对升温的敏感系数为4.5% /℃[27],其中西伯利亚东部的平均和极端降水在秋季的增加趋势接近热力学约束的8% /℃[99]。根据气候模型的模拟结果显示,在未来持续升温的背景下,北极地区的降水增加速度和幅度将远远超过先前的预估结果[26]。至21世纪末(2091—2100年),北极地区的降水量将增加50%~60%,显著高于全球平均水平[101-102]。
从水量平衡的角度来看,一个流域的径流变化主要取决于降水与蒸发。当前北极陆地的降水量增速远大于蒸发量增速,引起北极流域净降水量(降水量与蒸发量之差)增加,进而导致河流径流量增多[29]。1980—2017年鄂毕河年降水量增速为1.27 mm/a,而年蒸发量的增速仅为0.54 mm/a,导致径流量在同期以0.54 mm/a的速率持续增加[103]。Berezovskaya等[80]利用1936—1998年的降水与径流观测数据,证实了西伯利亚勒拿河流域径流量与降水量呈现同步增加的态势。在未来更加温暖和湿润的气候条件下,麦肯锡河、勒拿河和叶尼塞河等北极河流的径流量将在整个21世纪持续增加[94]。模型预测,到21世纪末北极地区的净降水量将达到2318~2734 km3/a,远高于之前的预估结果[104]。因此,随着快速升温的影响,北极流域径流量可能将持续增加。
4.2 积雪情势变化驱动
积雪作为大气圈和冰冻圈的关键要素之一[105],也是重要的水文变量。气候变暖对北极地区的积雪分布、积雪量和积雪融化时间等产生显著影响[106⇓⇓-109]。1970—2010年北半球3—4月积雪覆盖面积明显缩小,减少速率达80万km2/10 a [110]。同时,1992—2016年北半球年均积雪量呈显著下降趋势(197.2 km3/10 a),总计减少约13%[111]。此外,1960—2000年北极大部分地区均出现积雪期缩短、春季融雪时间提前的现象[112-113]。以1979—2009年为例,北极地区的积雪日数和雪水当量分别以-2.49 d/10 a和-0.17 cm/10 a的速率减少[114]。
在全球变暖的背景下,积雪变化对河流径流过程产生显著影响[115-116]。在春季融雪期,北极四大流域(鄂毕河、叶尼塞河、勒拿河、育空河)的河流径流量与积雪面积呈显著相关,积雪面积越大,径流量越低;随着积雪面积减少,河流径流量呈增加趋势[82-83,117]。通过对叶尼塞河融雪径流的进一步研究发现,在融雪初期,河流径流量减少,而在融雪后期,河流径流量增加[91]。此外,随着全球升温,积雪融化时间提前,导致河流的径流峰值从夏季提前到春季[118]。受融雪时间提前的影响,欧亚大陆北极河流5月份的流量显著增加[119-120]。根据未来情景预估,至21世纪末,北极地区春季积雪面积可能减少10%~35%,积雪深度和雪水当量也相应减少[121],积雪情势变化对北极径流的影响仍将持续。
4.3 降水相态转化驱动
4.4 多年冻土退化驱动
北极流域的重要特征之一是广泛分布多年冻土。在全球升温的背景下,多年冻土正在加速退化[131⇓⇓-134],表现为多年冻土温度升高、面积减少、冻土活动层厚度增加,以及季节性冻土融化期延长且冻结期缩短等[135]。欧亚大陆和北美地区的575个多年冻土观测孔监测数据显示,多年冻土温度自20世纪70年代起开始上升[136-137],仅在2007—2016年全球多年冻土升温了(0.29±0.12) °C[10]。加拿大西北部1 km2区域的遥感监测显示,1947—2008年多年冻土面积从0.70 km2减少到0.43 km2 [138]。此外,20世纪70年代起冻土活动层也发生快速变化,至2013年鄂毕河、叶尼塞河和勒拿河流域的冻土活动层体积分别增加了28 km3、142 km3和228 km3 [135]。模拟结果显示,当全球地表温度升高1.5 ℃时,在RCP2.6(2027—2036年)、RCP4.5(2026—2035年)和RCP8.5(2023—2032年)情景下,多年冻土退化面积将分别达到23.6%、24.1%、25.6%[139]。由此可见,在全球持续升温背景下,多年冻土正在快速退化。
多年冻土退化可以通过改变活动层厚度、土壤含水量和地下径流量(即基流量)[140],以及地表水和地下水之间的交换强度等[84,141⇓ -143],对流域径流过程产生直接或间接的影响。在多年冻土退化的过程中,一方面,地下冰不断融化,增加了地下水储量和含水层导水性[85,144 -145],增强了地表水与地下水之间的连通性与交换强度[146-147],从而导致地下水向河流排泄的水量(即基流量)持续增加(图4)[148]。特别是在多年冻土覆盖率较高的流域,活动层更厚、地下水储存能力更强,从而有利于增加地表径流[135]。另一方面,多年冻土退化还能够通过改变河流形态[149]和地貌形态(如热融喀斯特、热融滑坡和滑塌等)[150⇓-152],影响流域水流路径和水系连通性[153],部分地表水甚至通过贯通融区渗漏至地下含水层(图4),从而导致湖泊等地表水体的干涸[84,146],影响流域水文过程。此外,冻土退化可以通过影响植被生长状况[154⇓-156]和演替过程[157],改变地表辐射平衡及蒸散发通量[155,158],进而影响流域径流过程。
图4
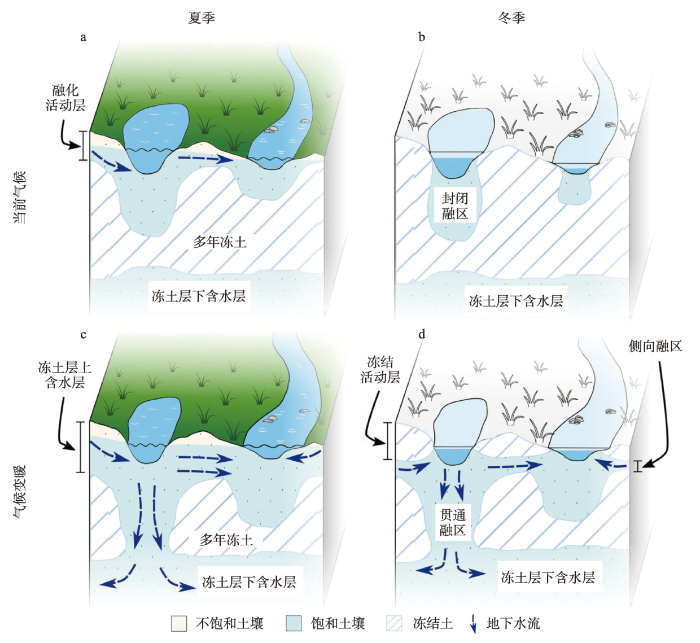
图4
当前气候及未来升温背景下的夏季与冬季水文过程及其对多年冻土退化的响应
注:修改自Lamontagne‐Hallé等[146]。
Fig. 4
Conceptual hydrogeologic permafrost systems under the present climate conditions and its potential changes in a warmer climate for summer and winter
5 挑战与展望
北极升温带来的“放大效应”通过改变物质和能量交换,深刻影响着全球水文循环过程。然而,由于北极地区的海冰、积雪、多年冻土、冰川等多个水文要素之间的相互作用[8],水文系统对气候变暖的响应异常复杂[159],给北极水文研究带来巨大的挑战。尽管遥感监测和模型等研究方法的快速发展在很大程度上弥补数据缺失的不足,但仍需要与地面观测数据(特别是径流观测数据)相结合,并相互补充验证。因此,地面观测成为北极地区环境和水文变化研究的一个关键问题[160]。然而,由于北极地区地广人稀且气候条件极端恶劣,地面观测工作异常艰难,获取到的观测数据十分有限且难以连续。据Shiklomanov等[44]的统计,北美和俄罗斯地区的北极水文观测站点数量在1985年前后达到峰值(超过3000个),但随后开始减少,尤其受苏联解体的影响,到2000年站点数量甚至减少了38%。此后,在2008年的全球金融危机影响下,可用的北极地区地面观测站点进一步减少[99]。由此导致的地面观测数据缺失严重影响了北极观测数据的连续性。以叶尼塞河流域为例,其径流观测数据先后存在长达13年(1963—1965年、1968—1974年及1977—1979年)的数据缺失[78]。加上观测方法自身的局限性,所获取的径流数据通常还会存在3%~6%的误差[161],增加了观测结果的不确定性。对北极河流而言,由于河水在冬季结冰,冬季的日尺度径流观测数据的误差尤为显著[162]。因此,地面站点观测数据的数量和质量极大地限制了对径流变化及其对气候变暖响应的量化分析[163]。此外,诸如水库调蓄、农业灌溉等人类活动也对北极流域的径流季节性变化产生影响[60,90],增加了北极水文过程研究的复杂性。综上所述,建立起北极流域径流及相关环境要素(如温度、降水、多年冻土、人类活动等)的动态监测网络,是当前北极水文过程研究所面临的重要挑战。
多年冻土作为指示气候临界点的重要指标之一[164-165],正经历快速升温与退化。多年冻土的退化会导致流域的退水过程减缓,进而影响流域的径流过程。其中,地下径流作为与多年冻土退化紧密相关的径流组分,既直接受多年冻土退化的影响,又反向作用于多年冻土退化过程,使其成为极地环境快速变化的重要驱动因素[166-167]。从水文科学发展的角度来看,寒区径流和地下水如何随气候变暖而改变(如冰川消融和多年冻土融化),仍然是水文学中未解决的23个重要科学问题之一[168]。同时,多年冻土退化的水文效应也是冰冻圈科学与地球系统科学研究的核心问题之一[84]。然而,由于多年冻土与水文系统之间的相互作用极为复杂,并且随着多年冻土状态的变化而发生改变,加之多年冻土空间分布及其含冰量存在显著的时空差异,目前尚无法准确识别并量化多年冻土退化在水文过程中的作用。此外,由于难以对多年冻土变化进行高密度的实时监测,对多年冻土区水文过程的准确模拟和预测始终存在观测手段和数据等方面的限制,导致目前对多年冻土退化的水文效应的认识仍然不足,更难以进行更为深入和准确的定量分析[145]。因此,加强对北极多年冻土区的监测[169],发展耦合冻融过程的寒区地下水模型[146],量化多年冻土退化对径流变化的影响和贡献,揭示多年冻土退化对水文过程的影响机制,将成为未来极地水文学研究的重要方向。
致谢
感谢课题组研究生于宗绪、张家玲和王睿欣在文献与数据查找方面提供的帮助。特别感谢两位匿名审稿人对本文的修改与完善所给予的宝贵建议。
参考文献
The Arctic has warmed nearly four times faster than the globe since 1979
The Arctic amplification debate
DOI:10.1007/s10584-005-9017-y URL [本文引用: 1]
Arctic amplification dominated by temperature feedbacks in contemporary climate models
DOI:10.1038/ngeo2071 [本文引用: 2]
Processes and impacts of Arctic amplification: A research synthesis
DOI:10.1016/j.gloplacha.2011.03.004 URL [本文引用: 1]
Arctic amplification produced by sea ice retreat and its global climate effects
DOI:10.11867/ j.issn.1001-8166.2015.09.0985
[本文引用: 1]

Since the 1970s, the continuous global warming has impacted the Arctic environment. The temperature increasing rate of Arctic during this century is nearly twice that of the global average, which is named as Arctic Amplification phenomena. Sea ice coverage of Arctic Ocean varied in a declined trend. Summer sea ice extent in 2012 was less than 40% of that in last century. The serious retreat of Arctic sea ice coverage is a unique phenomenon during the past 1 450 years. It is projected that an ice-free summer Arctic will happen in the near future. The positive feedback processes inside the Arctic are considered to be the key factors to drive the Arctic amplification under the background of global warming, which result in the Arctic and global climate changes, and drive many extreme meteorological and climatological events. An important mission of Arctic science is to reveal the physical mechanisms that drive these positive feedbacks. The main scientific issues of Arctic amplification are all related to the air-ice-sea interaction. Sea ice is the most active factor of Arctic amplification. The variations of sea ice microstructure and the thermal dynamical features need to be clarified quantitatively by considering the melt pond, lateral melting, snow cover, and ice drifting. Ocean is the key factor to acquire and store the solar energy for Arctic change. Oceanic heat flux is very important for the energy reallocation (energy storage and release), which is influenced by fresh water content and pycnocline structure to form the air-sea coupling. The main goal of researches for the Arctic Amplification is to understand the variation of Arctic climate system, the air-ice-sea interaction, feedback between ocean and atmosphere, variation in cyclones and blocks, influence of cloud and fog on Arctic change. On the basis of better understanding of variation of sea ice, ocean, and climate Arctic, the dominant function and physical processes of the vortex Rossby-waves will be the main issue to reveal the gateways and processes for the influence of Arctic change on China’s climate.
北极海冰减退引起的北极放大机理与全球气候效应
DOI:10.11867/ j.issn.1001-8166.2015.09.0985
[本文引用: 1]
自20世纪70年代以来,全球气温持续增高,对北极产生了深刻的影响。21世纪以来,北极的气温变化是全球平均水平的2倍,被称为“北极放大”现象。北极海冰覆盖范围呈不断减小的趋势,2012年北极海冰已经不足原来的40%,如此大幅度的减退是过去1 450年以来独有的现象。科学家预测,不久的将来,将会出现夏季无冰的北冰洋。全球变暖背景下北极内部发生的正反馈过程是北极放大现象的关键,不仅使极区的气候发生显著变化,而且对全球气候产生非常显著的影响,导致很多极端天气气候现象的发生。北极科学的重要使命之一是揭示这些正反馈过程背后的机理。北极放大有关的重大科学问题主要与气—冰—海相互作用有关,海冰是北极放大中最活跃的因素,要明确海冰结构的变化,充分考虑融池、侧向融化、积雪和海冰漂移等因素,将海冰热力学特性的改变定量表达出来。海洋是北极变化获取能量的关键因素,是太阳能的转换器和储存器,要认识海洋热通量背后的能量分配问题,即能量储存与释放的联系机理,认识淡水和跃层结构变化对海气耦合的影响。全面认识北极气候系统的变化是研究北极放大的最终目的,要揭示气—冰—海相互作用过程、北极海洋与大气之间反馈的机理、北极变化过程中的气旋和阻塞过程、北极云雾对北极变化的影响。在对北极海冰、海洋和气候深入研究的基础上,重点研究极地涡旋罗斯贝波的核心作用,以及罗斯贝波变异的物理过程,深入研究北极变化对我国气候影响的主要渠道、关键过程和机理。
The emergence of surface-based Arctic amplification
DOI:10.5194/tc-3-11-2009
URL
[本文引用: 1]
. Rises in surface and lower troposphere air temperatures through the 21st century are projected to be especially pronounced over the Arctic Ocean during the cold season. This Arctic amplification is largely driven by loss of the sea ice cover, allowing for strong heat transfers from the ocean to the atmosphere. Consistent with observed reductions in sea ice extent, fields from both the NCEP/NCAR and JRA-25 reanalyses point to emergence of surface-based Arctic amplification in the last decade.\n
The central role of diminishing sea ice in recent Arctic temperature amplification
DOI:10.1038/nature09051 [本文引用: 1]
Interpretation of IPCC SROCC on polar system changes and their impacts and adaptations
极地系统变化及其影响与适应新认识
Space-based observations for understanding changes in the Arctic-boreal zone
Permafrost is warming at a global scale
Permafrost warming has the potential to amplify global climate change, because when frozen sediments thaw it unlocks soil organic carbon. Yet to date, no globally consistent assessment of permafrost temperature change has been compiled. Here we use a global data set of permafrost temperature time series from the Global Terrestrial Network for Permafrost to evaluate temperature change across permafrost regions for the period since the International Polar Year (2007-2009). During the reference decade between 2007 and 2016, ground temperature near the depth of zero annual amplitude in the continuous permafrost zone increased by 0.39 ± 0.15 °C. Over the same period, discontinuous permafrost warmed by 0.20 ± 0.10 °C. Permafrost in mountains warmed by 0.19 ± 0.05 °C and in Antarctica by 0.37 ± 0.10 °C. Globally, permafrost temperature increased by 0.29 ± 0.12 °C. The observed trend follows the Arctic amplification of air temperature increase in the Northern Hemisphere. In the discontinuous zone, however, ground warming occurred due to increased snow thickness while air temperature remained statistically unchanged.
Permafrost carbon emissions in a changing Arctic
Vegetation greening and climate change promote an increase in evapotranspiration across Siberia
The world's largest high Arctic lake responds rapidly to climate warming
Using a whole-watershed approach and a combination of historical, contemporary, modeled and paleolimnological datasets, we show that the High Arctic's largest lake by volume (Lake Hazen) has succumbed to climate warming with only a similar to 1 degrees C relative increase in summer air temperatures. This warming deepened the soil active layer and triggered large mass losses from the watershed's glaciers, resulting in a similar to 10 times increase in delivery of glacial melt-waters, sediment, organic carbon and legacy contaminants to Lake Hazen, a >70% decrease in lake water residence time, and near certainty of summer ice-free conditions. Concomitantly, the community assemblage of diatom primary producers in the lake shifted dramatically with declining ice cover, from shoreline benthic to open-water planktonic species, and the physiological condition of the only fish species in the lake, Arctic Char, declined significantly. Collectively, these changes place Lake Hazen in a biogeochemical, limnological and ecological regime unprecedented within the past similar to 300 years.
Recent Arctic amplification and extreme mid-latitude weather
DOI:10.1038/ngeo2234 [本文引用: 1]
Exploring links between Arctic amplification and mid-latitude weather
DOI:10.1002/grl.v40.5 URL [本文引用: 1]
Evidence for a wavier jet stream in response to rapid Arctic warming
Intensified warming of the Arctic: Causes and impacts on middle latitudes
DOI:10.1016/j.gloplacha.2014.03.003 URL [本文引用: 1]
Amplified Arctic warming and mid-latitude weather: New perspectives on emerging connections
Characteristic analysis of organic carbon output and its affecting factors of Arctic rivers in Siberia
DOI:10.11821/dlxb202105002
URL
[本文引用: 1]
As an important component of Arctic carbon cycle, riverine organic carbon export is very sensitive to climate change. In order to analyze the organic carbon output from 2004 to 2017 of Ob, Yenisei and Lena rivers in Siberia of Russia, river discharge and organic carbon data from the ArcticGRO (https://arcticgreatrivers.org/) were used in this study through mathematical statistical analysis and other methods. Results showed that the total annual organic carbon output of these three rivers is about 23 Tg, among which the dissolved organic carbon (DOC) output is approximately 18.55 Tg, more than half of the total in Arctic regions, and nearly 4 times of particulate organic carbon (POC) output. The output of annual DOC from 2009 to 2017 is significantly different from that of 1999-2008, DOC output of Ob River increased by 18% annually, Lena River increased by almost 70%, while Yenisei River dropped by 13%. The organic carbon output in spring and summer reached more than 85% of the whole year, with an output peak in spring, but the outputs of Ob River in spring and summer were almost the same. The organic carbon output characteristics of these river basins are different in seasonality, which was mainly affected by runoff, permafrost and human activities. Among them, the total DOC output has a significant positive correlation with runoff variation in terms of inter-annual and seasonal changes. In general, DOC concentration becomes larger as the discharge increases. Permafrost also has notable influence on river DOC and POC due to various types of distribution. Therefore, the study of the characteristics and influencing factors of the organic carbon output of Arctic rivers under climate change is conducive to in-depth understanding of the comprehensive response of the organic carbon output of Arctic rivers to climate and environmental changes, which lays a foundation for revealing the process of the Arctic carbon cycle under climate change.
西伯利亚北极河流有机碳输出特征及影响要素
DOI:10.11821/dlxb202105002
[本文引用: 1]
河流有机碳输出是北极碳循环的重要组分,对气候变化十分敏感。本文利用ArcticGRO的径流及有机碳数据,通过数理统计分析等方法,对2004—2017年间俄罗斯西伯利亚地区的鄂毕河、叶尼塞河和勒拿河有机碳输出进行研究。结果显示:西伯利亚3大河流的年均有机碳输出总量约23 Tg,其中溶解有机碳(DOC)输出约18.55 Tg,占北极地区50%以上,接近颗粒有机碳(POC)输出的4倍。2009—2017年间的年均DOC输出量较1999—2008年存在较大差异,鄂毕河增加18%,叶尼塞河下降13%,而勒拿河增加了近70%。春、夏两季有机碳输出总量占全年85%以上,春季为有机碳输出高峰期,而在鄂毕河流域春、夏季贡献率相当。各流域河流有机碳输出特征不同且具有季节性变化,主要受径流、冻土及人类活动等的影响。其中,DOC输出总量在年际与季节性变化特征上均与径流变化呈显著正相关,随径流增加DOC浓度也相应增大;而多年冻土也因类型及分布差异对河流DOC与POC具有不同程度的影响。研究气候变化下的北极河流有机碳输出特征及影响要素,有助于深入理解北极河流有机碳输出对气候及环境变化的综合响应,为揭示气候变化下的北极碳循环过程奠定基础。
Plant response to climate change along the forest-tundra ecotone in northeastern Siberia
DOI:10.1111/gcb.12304
PMID:23813896
[本文引用: 1]
Russia's boreal (taiga) biome will likely contract sharply and shift northward in response to 21st century climatic change, yet few studies have examined plant response to climatic variability along the northern margin. We quantified climate dynamics, trends in plant growth, and growth-climate relationships across the tundra shrublands and Cajander larch (Larix cajanderi Mayr.) woodlands of the Kolyma river basin (657 000 km(2) ) in northeastern Siberia using satellite-derived normalized difference vegetation indices (NDVI), tree ring-width measurements, and climate data. Mean summer temperatures (Ts ) increased 1.0 °C from 1938 to 2009, though there was no trend (P > 0.05) in growing year precipitation or climate moisture index (CMIgy ). Mean summer NDVI (NDVIs ) increased significantly from 1982 to 2010 across 20% of the watershed, primarily in cold, shrub-dominated areas. NDVIs positively correlated (P < 0.05) with Ts across 56% of the watershed (r = 0.52 ± 0.09, mean ± SD), principally in cold areas, and with CMIgy across 9% of the watershed (r = 0.45 ± 0.06), largely in warm areas. Larch ring-width measurements from nine sites revealed that year-to-year (i.e., high-frequency) variation in growth positively correlated (P < 0.05) with June temperature (r = 0.40) and prior summer CMI (r = 0.40) from 1938 to 2007. An unexplained multi-decadal (i.e., low-frequency) decline in annual basal area increment (BAI) occurred following the mid-20th century, but over the NDVI record there was no trend in mean BAI (P > 0.05), which significantly correlated with NDVIs (r = 0.44, P < 0.05, 1982-2007). Both satellite and tree-ring analyses indicated that plant growth was constrained by both low temperatures and limited moisture availability and, furthermore, that warming enhanced growth. Impacts of future climatic change on forests near treeline in Arctic Russia will likely be influenced by shifts in both temperature and moisture, which implies that projections of future forest distribution and productivity in this area should take into account the interactions of energy and moisture limitations. © 2013 John Wiley & Sons Ltd.
The impact of Arctic climatic and terrestrial environmental changes on primary industry: A review
DOI:10.11821/dlxb202211010
[本文引用: 1]
The Arctic is undergoing unprecedented climatic and terrestrial environmental changes. The Arctic primary industry has experienced a wide and significant effect from these shifting environmental factors, such as rising temperatures, greening vegetation, thawing permafrost, and frequent wildfires. It is essential to integrate the knowledge of impacts caused by climatic and terrestrial environmental changes on Arctic primary production in order to support the sustainable development of primary industry and inform the formulation of industrial policies. The four main sectors of primary industry (cultivation, livestock husbandry, forestry, fishery and aquaculture) were discussed in this work. This study synthesized the types and extent of the impacts caused by climatic and terrestrial environmental changes on each sector, and provided a summary and outlook from five aspects with a cross-sector perspective: (1) the specific ways of climate changes affecting primary production; (2) the challenges of integrating knowledge from local researches; (3) the enactment and implementation of adaptation strategies; (4) the demand for integration and innovation in data and methods; and (5) the inspiration of the climate change-induced alteration in Arctic primary industry for China. This study concluded the priorities of researching the impact of climate changes on Arctic primary industry, and the results would be capable to aid China's participation in the sustainable development of Arctic primary producing activities.
北极气候和陆地环境变化对第一产业影响研究进展
DOI:10.11821/dlxb202211010
[本文引用: 1]
北极地区正在经历前所未有的气候及陆地环境变化,气温升高、植被绿化、冻土融化以及野火频发等因素已经对北极地区的第一产业产生了广泛而深远的影响。为了支撑气候变化背景下北极第一产业的可持续发展与相关政策的制定,有必要加强北极气候及陆地环境变化对第一产业影响的整体性认识。本文针对北极地区的种植业、畜牧业、林业以及渔业4个第一产业部门,系统梳理了它们受到气候及陆地环境变化影响的类型与程度。同时,本文基于跨部门视角总结了当前北极环境变化对第一产业影响的相关研究,并从5个方面进行了分析与展望:① 气候及陆地环境变化对第一产业的具体影响方式;② 整合局域性科学认识的挑战;③ 气候变化适应策略的制定与实施;④ 数据与方法层面的整合与创新;⑤ 气候变化影响下北极第一产业变化对中国的启示。本文总结了未来气候变化背景下北极第一产业研究的重点领域,可为中国参与北极第一产业资源的可持续利用与开发提供参考。
Establishment and significance of the scientific system of cryospheric science
冰冻圈科学体系的建立及其意义
Changing climate both increases and decreases European river floods
DOI:10.1038/s41586-019-1495-6 [本文引用: 1]
Northern Eurasian heat waves and droughts
DOI:10.1175/JCLI-D-13-00360.1
URL
[本文引用: 1]
This article reviews the understanding of the characteristics and causes of northern Eurasian summertime heat waves and droughts. Additional insights into the nature of temperature and precipitation variability in Eurasia on monthly to decadal time scales and into the causes and predictability of the most extreme events are gained from the latest generation of reanalyses and from supplemental simulations with the NASA Goddard Earth Observing System model, version 5 (GEOS-5). Key new results are 1) the identification of the important role of summertime stationary Rossby waves in the development of the leading patterns of monthly Eurasian surface temperature and precipitation variability (including the development of extreme events such as the 2010 Russian heat wave); 2) an assessment of the mean temperature and precipitation changes that have occurred over northern Eurasia in the last three decades and their connections to decadal variability and global trends in SST; and 3) the quantification (via a case study) of the predictability of the most extreme simulated heat wave/drought events, with some focus on the role of soil moisture in the development and maintenance of such events. A literature survey indicates a general consensus that the future holds an enhanced probability of heat waves across northern Eurasia, while there is less agreement regarding future drought, reflecting a greater uncertainty in soil moisture and precipitation projections. Substantial uncertainties remain in the understanding of heat waves and drought, including the nature of the interactions between the short-term atmospheric variability associated with such extremes and the longer-term variability and trends associated with soil moisture feedbacks, SST anomalies, and an overall warming world.
Enhanced poleward moisture transport and amplified northern high-latitude wetting trend
DOI:10.1038/nclimate1631 [本文引用: 1]
New climate models reveal faster and larger increases in Arctic precipitation than previously projected
As the Arctic continues to warm faster than the rest of the planet, evidence mounts that the region is experiencing unprecedented environmental change. The hydrological cycle is projected to intensify throughout the twenty-first century, with increased evaporation from expanding open water areas and more precipitation. The latest projections from the sixth phase of the Coupled Model Intercomparison Project (CMIP6) point to more rapid Arctic warming and sea-ice loss by the year 2100 than in previous projections, and consequently, larger and faster changes in the hydrological cycle. Arctic precipitation (rainfall) increases more rapidly in CMIP6 than in CMIP5 due to greater global warming and poleward moisture transport, greater Arctic amplification and sea-ice loss and increased sensitivity of precipitation to Arctic warming. The transition from a snow- to rain-dominated Arctic in the summer and autumn is projected to occur decades earlier and at a lower level of global warming, potentially under 1.5 °C, with profound climatic, ecosystem and socio-economic impacts.© 2021. The Author(s).
Future increases in Arctic precipitation linked to local evaporation and sea-ice retreat
DOI:10.1038/nature13259 [本文引用: 2]
Arctic precipitation and evaporation: Model results and observational estimates
DOI:10.1175/1520-0442(1998)011<0072:APAEMR>2.0.CO;2 URL [本文引用: 1]
The atmospheric role in the Arctic water cycle: A review on processes, past and future changes, and their impacts
DOI:10.1002/jgrg.v121.3 URL [本文引用: 4]
Recent changes to Arctic river discharge
Arctic rivers drain ~15% of the global land surface and significantly influence local communities and economies, freshwater and marine ecosystems, and global climate. However, trusted and public knowledge of pan-Arctic rivers is inadequate, especially for small rivers and across Eurasia, inhibiting understanding of the Arctic response to climate change. Here, we calculate daily streamflow in 486,493 pan-Arctic river reaches from 1984-2018 by assimilating 9.18 million river discharge estimates made from 155,710 satellite images into hydrologic model simulations. We reveal larger and more heterogenous total water export (3-17% greater) and water export acceleration (factor of 1.2-3.3 larger) than previously reported, with substantial differences across basins, ecoregions, stream orders, human regulation, and permafrost regimes. We also find significant changes in the spring freshet and summer stream intermittency. Ultimately, our results represent an updated, publicly available, and more accurate daily understanding of Arctic rivers uniquely enabled by recent advances in hydrologic modeling and remote sensing.© 2021. The Author(s).
Increasing river discharge to the Arctic Ocean
DOI:10.1126/science.1077445
PMID:12481132
[本文引用: 5]
Synthesis of river-monitoring data reveals that the average annual discharge of fresh water from the six largest Eurasian rivers to the Arctic Ocean increased by 7% from 1936 to 1999. The average annual rate of increase was 2.0 +/- 0.7 cubic kilometers per year. Consequently, average annual discharge from the six rivers is now about 128 cubic kilometers per year greater than it was when routine measurements of discharge began. Discharge was correlated with changes in both the North Atlantic Oscillation and global mean surface air temperature. The observed large-scale change in freshwater flux has potentially important implications for ocean circulation and climate.
Key indicators of Arctic climate change: 1971-2017
A circumpolar perspective on fluvial sediment flux to the Arctic Ocean
Seasonal and annual fluxes of nutrients and organic matter from large rivers to the Arctic Ocean and surrounding seas
DOI:10.1007/s12237-011-9386-6 URL [本文引用: 1]
The delivery of mercury to the Beaufort Sea of the Arctic Ocean by the Mackenzie River
Very high levels of mercury (Hg) have recently been reported in marine mammals and other higher trophic-level biota in the Mackenzie Delta and Beaufort Sea of the western Arctic Ocean. To quantify the input of Hg (particulate, dissolved and methylated) by the Mackenzie River as a potential source for Hg in the ecosystem, surface water and sediment samples were taken from 79 sites in the lower Mackenzie Basin during three consecutive summers (2003-2005) and analyzed for Hg and methylmercury (MeHg). Intensive studies were also carried out in the Mackenzie Delta during the freshets of 2004 and 2005. Large seasonal and annual variations were found in Hg concentrations in the river, coincident with the variations in water discharge. Increased discharges during spring freshet and during the summers of 2003 and 2005 compared to 2004 were mirrored by higher Hg concentrations. The correlation between Hg concentration and riverflow suggests additional Hg sources during periods of high water, potentially from increased surface inundation and increased bank erosion. The increase in the Hg concentration with increasing water discharge amplifies the annual Hg and MeHg fluxes during high water level years. For the period 2003-2005, the Hg and MeHg fluxes from the Mackenzie River to the Beaufort Sea averaged 2.2 tonnes/yr and 15 kg/yr, respectively, the largest known Hg source to the Beaufort Sea. More than half of the mercury flux occurs during the short spring freshet season which coincides with the period of rapid growth of marine biota. Consequently, the Mackenzie River input potentially provides the major mercury source to marine mammals of the Beaufort Sea. The Hg and MeHg fluxes from the Mackenzie River are expected to further increase with the projected climate warming in the Mackenzie Basin.
Assessment of sediment and organic carbon exports into the Arctic Ocean: The case of the Yenisei River basin
DOI:S0043-1354(19)30326-4
PMID:31022529
[本文引用: 1]
The export of organic carbon export by the rivers to the oceans either as particulate organic carbon (POC) or dissolved organic carbon (DOC) is very sensitive to climate change especially in permafrost affected catchments where soils are very rich in organic carbon. With global warming, organic carbon export in both forms is expected to increase in Arctic regions. It should affect contemporary biogeochemical cycles in rivers and oceans and therefore modify the whole food web. This study tries to understand complex processes involved in sediment, POC and DOC riverine transport in the Yenisei River basin and to quantify their respective fluxes at the river outlet. The SWAT (Soil and Water Assessment Tool) hydrological model is used in this study to simulate water and suspended sediment transfers in the largest Arctic river. POC and DOC export have been quantified with empirical models, adapted from literature for the study case. First, the hydrological model has been calibrated and validated at a daily time step for the 2003-2008 and the 2009-2016 periods respectively, and its output has been compared with field data for water and sediment fluxes. Based on conceptualization of transfer processes, calibration on climate and soil properties has been performed in order to correctly represent hydrology and sediment transfer in permafrost basins. Second, calibration of empirical models for DOC/POC transport have been performed by comparing their output with field data, available from 2003 to 2016. Our study reveals that SWAT is capable of correctly representing hydrology, sediment transfer, POC and DOC fluxes and their spatial distribution at a daily timescale, and outlines the links between these fluxes and permafrost features. Our simulation effort results in specific sediment, POC and DOC fluxes of 2.97 t km yr, 0.13 t km yr and 1.14 t km yr for the period 2003-2016 which are in the range of previous estimates. About 60% of the total fluxes of sediment, DOC and POC to the Arctic Ocean are exported during the two months of the freshet. Spatial analysis show that permafrost-free areas have returned higher daily organic carbon export than permafrost affected zones, highlighting the thawing permafrost effect on carbon cycle in climate change feedback.Copyright © 2019 Elsevier Ltd. All rights reserved.
Effects of the Arctic river runoff on the Arctic Ocean circulation
北极河流径流对北冰洋环流的影响
Recent increases in Arctic freshwater flux affects Labrador Sea convection and Atlantic overturning circulation
The Atlantic Meridional Overturning Circulation (AMOC) is an important component of ocean thermohaline circulation. Melting of Greenland’s ice sheet is freshening the North Atlantic; however, whether the augmented freshwater flux is disrupting the AMOC is unclear. Dense Labrador Sea Water (LSW), formed by winter cooling of saline North Atlantic water and subsequent convection, is a key component of the deep southward return flow of the AMOC. Although LSW formation recently decreased, it also reached historically high values in the mid-1990s, making the connection to the freshwater flux unclear. Here we derive a new estimate of the recent freshwater flux from Greenland using updated GRACE satellite data, present new flux estimates for heat and salt from the North Atlantic into the Labrador Sea and explain recent variations in LSW formation. We suggest that changes in LSW can be directly linked to recent freshening, and suggest a possible link to AMOC weakening.
Consequences of future increased Arctic runoff on Arctic Ocean stratification, circulation, and sea ice cover
DOI:10.1002/jgrc.v121.1 URL [本文引用: 1]
Freshwater and its role in the Arctic marine system: Sources, disposition, storage, export, and physical and biogeochemical consequences in the Arctic and global oceans
DOI:10.1002/jgrg.v121.3 URL [本文引用: 1]
The effects of discharge changes in Siberian rivers on Arctic sea-ice melting
Arctic river discharge is one of the important factors affecting sea-ice melting of Arctic shelf seas. However, such effects have not been given much attention. In this study, the changes in discharge of the Ob, Yenisei, and Lena Rivers and the sea ice of the Kara and Laptev Seas during 1979–2019 were analyzed. Substantial increases in discharge and heat from the discharge and decreases in sea ice concentration (SIC) were detected. The effects of changes in discharge and riverine heat on sea ice changes were investigated. The results showed that the influence of the discharge, accumulated discharge, heat, and accumulated heat on SIC mainly occurred at the beginning and final stages of sea-ice melting. Discharge accelerated the melting of sea ice by increasing the absorption of solar radiation as the impurities contained in the discharge washed to the sea ice surface during the initial and late stages of sea-ice melting. Changes in cumulative riverine heat from May to September greatly contributed to the SIC changes in the Kara and Laptev Seas at the seasonal scale. The SIC reduced by 1% when the cumulative riverine heat increased by 213.2 × 10⁶ MJ, 181.5 × 10⁶ MJ, and 154.6 × 10⁶ MJ in the Lena, Yenisei, and Ob Rivers, respectively, from May to September. However, even in the plume coverage areas in the Kara and Laptev Seas, discharge changes from the three rivers had a limited contribution to the reduction in SIC at annual scales. This work is helpful for understanding the changes in Arctic sea ice.
Increasing riverine heat influx triggers Arctic sea ice decline and oceanic and atmospheric warming
World water balance and water resources of the earth
Climatic change and the dynamics of river runoff into the Arctic Ocean
DOI:10.1023/B:WARE.0000007584.73692.ca URL [本文引用: 6]
Geographical research direction and development trend of Hydrology
水文学的地理研究方向与发展趋势
DOI:10.11821/xb198402008
[本文引用: 1]
水文学的研究一般可以归纳为三个方向,即地理学、地球物理学与工程学。
Long-term changes of river water inflow into the seas of the Russian Arctic sector
Heat flux calculations for Mackenzie and Yukon rivers
DOI:10.1016/j.polar.2014.05.001 URL [本文引用: 1]
Northern Hemisphere permafrost map based on TTOP modelling for 2000-2016 at 1 km2 scale
DOI:10.1016/j.earscirev.2019.04.023
[本文引用: 2]
Permafrost is a key element of the cryosphere and an essential climate variable in the Global Climate Observing System. There is no remote-sensing method available to reliably monitor the permafrost thermal state. To estimate permafrost distribution at a hemispheric scale, we employ an equilibrium state model for the temperature at the top of the permafrost (TTOP model) for the 2000-2016 period, driven by remotely-sensed land surface temperatures, down-scaled ERA-Interim climate reanalysis data, tundra wetness classes and landcover map from the ESA Landcover Climate Change Initiative (CCI) project. Subgrid variability of ground temperatures due to snow and landcover variability is represented in the model using subpixel statistics. The results are validated against borehole measurements and reviewed regionally. The accuracy of the modelled mean annual ground temperature (MAGT) at the top of the permafrost is +/- 2 degrees C when compared to permafrost borehole data. The modelled permafrost area (MAGT < 0 degrees C) covers 13.9 x 10(6) km(2) (ca. 15% of the exposed land area), which is within the range or slightly below the average of previous estimates. The sum of all pixels having isolated patches, sporadic, discontinuous or continuous permafrost (permafrost probability > 0) is around 21 x 10(6) km(2) (22% of exposed land area), which is approximately 2 x 10(6) km(2) less than estimated previously. Detailed comparisons at a regional scale show that the model performs well in sparsely vegetated tundra regions and mountains, but is less accurate in densely vegetated boreal spruce and larch forests.
Circum-Arctic map of permafrost and ground-ice conditions, version 2
Environmental and hydrologic overview of the Yukon River Basin
Alaska and Canada//US Geological Survey. Water-Resources Investigations Report,
Discharge dataset, Version 20230406
Potential role of permafrost thaw on increasing Siberian river discharge
Despite the increasing Siberian river discharge, the sensitivity of streamflow to climate forcing/permafrost thawing is poorly quantified. Based on the Budyko framework and superposition principles, we detected and attributed the changes in streamflow regimes for the three great Siberian rivers (Ob, Yenisei, and Lena) during 1936–2019. Over the past 84 years, streamflow of Ob, Yenisei and Lena has increased by ∼7.7%, 7.4% and 22.0%, respectively. Intensified precipitation induced by a warming climate is a major contributor to increased annual streamflow. However, winter streamflow appears to be particularly sensitive to temperature. Whilst rising temperature can reduce streamflow via evapotranspiration, it can enhance groundwater discharge to rivers due to permafrost thawing. Currently, every 1 °C rise in temperature likely leads to 6.1%–10.5% increase in groundwater discharge, depending on the permafrost condition. For permafrost-developed basins, the contribution to increased streamflow from thawing permafrost will continue to increase in the context of global warming.
Streamflow simulations of the terrestrial Arctic domain
Assessment of contemporary Arctic river runoff based on observational discharge records
DOI:10.1029/2000JD900444
URL
[本文引用: 2]
We describe the contemporary hydrography of the pan‐Arctic land area draining into the Arctic Ocean, northern Bering Sea, and Hudson Bay on the basis of observational records of river discharge and computed runoff. The Regional Arctic Hydrographic Network data set, R‐ArcticNET, is presented, which is based on 3754 recording stations drawn from Russian, Canadian, European, and U.S. archives. R‐ArcticNET represents the single largest data compendium of observed discharge in the Arctic. Approximately 73% of the nonglaciated area of the pan‐Arctic is monitored by at least one river discharge gage giving a mean gage density of 168 gages per 106 km2. Average annual runoff is 212 mm yr−1 with approximately 60% of the river discharge occurring from April to July. Gridded runoff surfaces are generated for the gaged portion of the pan‐Arctic region to investigate global change signals. Siberia and Alaska showed increases in winter runoff during the 1980s relative to the 1960s and 1970s during annual and seasonal periods. These changes are consistent with observations of change in the climatology of the region. Western Canada experienced decreased spring and summer runoff.
Contemporary estimates of pan-Arctic freshwater discharge from GRACE and reanalysis
Discharge observation networks in Arctic regions:Computation of the river runoff into the Arctic Ocean, its seasonality and variability
//Lewis E L, Jones E P, Lemke P, et al.
Estimates of freshwater discharge from continents: Latitudinal and seasonal variations
DOI:10.1175/1525-7541(2002)003<0660:EOFDFC>2.0.CO;2 URL [本文引用: 1]
Record Russian river discharge in 2007 and the limits of analysis
A pan-arctic evaluation of changes in river discharge during the latter half of the 20th century
Projected changes in Arctic Ocean freshwater budgets
Changing discharge patterns of high-latitude rivers
//Pielke R A.
Recent trends and variability in river discharge across northern Canada
DOI:10.5194/hess-20-4801-2016
URL
[本文引用: 1]
. This study presents an analysis of the observed inter-annual variability and inter-decadal trends in river discharge across northern Canada for 1964–2013. The 42 rivers chosen for this study span a combined gauged area of 5.26 × 10⁶ km2 and are selected based on data availability and quality, gauged area and record length. Inter-annual variability in river discharge is greatest for the eastern Arctic Ocean (coefficient of variation, CV = 16 %) due to the Caniapiscau River diversion into the La Grande Rivière system for enhanced hydropower production. Variability is lowest for the study area as a whole (CV = 7 %). Based on the Mann–Kendall test (MKT), no significant (p > 0.05) trend in annual discharge from 1964 to 2013 is observed in the Bering Sea, western Arctic Ocean, western Hudson and James Bay, and Labrador Sea; for northern Canada as a whole, however, a statistically significant (p < 0.05) decline of 102.8 km3 25 yr−1 in discharge occurs over the first half of the study period followed by a statistically significant (p < 0.05) increase of 208.8 km3 25 yr−1 in the latter half. Increasing (decreasing) trends in river discharge to the eastern Hudson and James Bay (eastern Arctic Ocean) are largely explained by the Caniapiscau diversion to the La Grande Rivière system. Strong regional variations in seasonal trends of river discharge are observed, with overall winter (summer) flows increasing (decreasing, with the exception of the most recent decade) partly due to flow regulation and storage for enhanced hydropower production along the Hudson and James Bay, the eastern Arctic Ocean and Labrador Sea. Flow regulation also suppresses the natural variability of river discharge, particularly during cold seasons.
River discharge
Osborne E, Richter-Menge J, Jeffries M, et al.
Analysis of trends in annual streamflow to the Arctic Ocean
DOI:10.1002/hyp.13392
[本文引用: 1]
There is increasing interest in the magnitude of the flow of freshwater to the Arctic Ocean due to its impacts on the biogeophysical and socio-economic systems in the north and its influence on global climate. This study examines freshwater flow based on a dataset of 72 rivers that either directly or indirectly contribute flow to the Arctic Ocean or reflect the hydrologic regime of areas contributing flow to the Arctic Ocean. Annual streamflow for the 72 rivers is categorized as to the nature and location of the contribution to the Arctic Ocean, and composite series of annual flows are determined for each category for the period 1975 to 2015. A trend analysis is then conducted for the annual discharge series assembled for each category. The results reveal a general increase in freshwater flow to the Arctic Ocean with this increase being more prominent from the Eurasian rivers than from the North American rivers. A comparison with trends obtained from an earlier study ending in 2000 indicates similar trend response from the Eurasian rivers, but dramatic differences from some of the North American rivers. A total annual discharge increase of 8.7 km(3)/y/y is found, with an annual discharge increase of 5.8 km(3)/y/y observed for the rivers directly flowing to the Arctic Ocean. The influence of annual or seasonal climate oscillation indices on annual discharge series is also assessed. Several river categories are found to have significant correlations with the Arctic Oscillation, the North Atlantic Oscillation, or the Pacific Decadal Oscillation. However, no significant association with climate indices is found for the river categories leading to the largest freshwater contribution to the Arctic Ocean.
The large-scale freshwater cycle of the Arctic
Analysis of the Arctic system for freshwater cycle intensification: Observations and expectations
DOI:10.1175/2010JCLI3421.1
URL
[本文引用: 1]
Hydrologic cycle intensification is an expected manifestation of a warming climate. Although positive trends in several global average quantities have been reported, no previous studies have documented broad intensification across elements of the Arctic freshwater cycle (FWC). In this study, the authors examine the character and quantitative significance of changes in annual precipitation, evapotranspiration, and river discharge across the terrestrial pan-Arctic over the past several decades from observations and a suite of coupled general circulation models (GCMs). Trends in freshwater flux and storage derived from observations across the Arctic Ocean and surrounding seas are also described.
Arctic freshwater export: Status, mechanisms, and prospects
DOI:10.1016/j.gloplacha.2014.11.013 URL [本文引用: 1]
Increasing Alaskan river discharge during the cold season is driven by recent warming
Arctic hydrology is experiencing rapid changes including earlier snow melt, permafrost degradation, increasing active layer depth, and reduced river ice, all of which are expected to lead to changes in stream flow regimes. Recently, long-term (>60 years) climate reanalysis and river discharge observation data have become available. We utilized these data to assess long-term changes in discharge and their hydroclimatic drivers. River discharge during the cold season (October–April) increased by 10% per decade. The most widespread discharge increase occurred in April (15% per decade), the month of ice break-up for the majority of basins. In October, when river ice formation generally begins, average monthly discharge increased by 7% per decade. Long-term air temperature increases in October and April increased the number of days above freezing (+1.1 d per decade) resulting in increased snow ablation (20% per decade) and decreased snow water equivalent (−12% per decade). Compared to the historical period (1960–1989), mean April and October air temperature in the recent period (1990–2019) have greater correlation with monthly discharge from 0.33 to 0.68 and 0.0–0.48, respectively. This indicates that the recent increases in air temperature are directly related to these discharge changes. Ubiquitous increases in cold and shoulder-season discharge demonstrate the scale at which hydrologic and biogeochemical fluxes are being altered in the Arctic.
Unprecedented acceleration of winter discharge of upper Yenisei River inferred from tree rings
The Yenisei River is the largest contributor of freshwater and energy fluxes among all rivers draining to the Arctic Ocean. Modeling long-term variability of Eurasian runoff to the Arctic Ocean is complicated by the considerable variability of river discharge in time and space, and the monitoring constraints imposed by a sparse gauged-flow network and paucity of satellite data. We quantify tree growth response to river discharge at the upper reaches of the Yenisei River in Tuva, South Siberia. Two regression models built from eight tree-ring width chronologies ofLarix sibiricaare applied to reconstruct winter (Nov–Apr) discharge for the period 1784–1997 (214 years), and annual (Oct–Sept) discharge for the period 1701–2000 (300 years). The Nov–Apr model explains 52% of the discharge variance whereas Oct–Sept explains 26% for the calibration intervals 1927–1997 and 1927–2000, respectively. This new hydrological archive doubles the length of the instrumental discharge record at the Kyzyl gauge and resets the temporal background of discharge variability back to 1784. The reconstruction finds a remarkable 80% upsurge in winter flow over the last 25 years, which is unprecedented in the last 214 years. In contrast, annual discharge fluctuated normally for this system, with only a 7% increase over the last 25 years. Water balance modeling with CRU data manifests a significant discrepancy between decadal variability of the gauged flow and climate data after 1960. We discuss the impact on the baseflow rate change of both the accelerating permafrost warming in the discontinuous zone of South Siberia and widespread forest fires. The winter discharge accounts for only one third of the annual flow, yet the persistent 25 year upsurge is alarming. This trend is likely caused by Arctic Amplification, which can be further magnified by increased winter flow delivering significantly more fresh water to the Kara Sea during the cold season.
Mechanisms behind the uneven increases in early, mid-and late winter streamflow across four Arctic river basins
Freezing temperature controls winter water discharge for cold region watershed
DOI:10.1029/2019WR026030
URL
[本文引用: 1]
Pronounced climate warming over the arctic‐subarctic regions has lead to profound hydrological changes including intensified river flow, but how soil frost controls aquifer discharge remains poorly understood. This study quantifies the relationship between freezing temperature and baseflow in winter. Analyses show that the traditional reservoir models are unable to reproduce the observed baseflow variations. By incorporating a freezing temperature function in the reservoir models, the model performances are largely improved. It indicates the dominant role of freezing temperature in controlling the aquifer discharge through reducing the watershed conductivity and liquid (active) water content. The results for the Albany watershed in Canada show that the watershed lump conductivity decreases by half when air temperature accumulates to −172 °C·day from winter start and in extremely cold years, it could decrease by more than 85%. With this relationship, a climate warming of +1, +2, and +4 °C would suggest an increase of 7.7%, 16.7%, and 41.0% in conductivity or 6.8%, 14.7%, and 35.0% in winter discharge, respectively. The study provides an important link between climate warming and aquifer discharge in cold regions. The results could be particularly useful for developing process‐based models, estimating baseflow variations, and assessing climate change impact on cold region hydrology.
Increasing discharge from the Mackenzie River system to the Arctic Ocean
DOI:10.1002/hyp.v31.1 URL [本文引用: 1]
Timing, duration, and magnitude of peak annual water‐levels during ice breakup in the Mackenzie Delta and the role of river discharge
DOI:10.1002/2012WR013198 URL [本文引用: 1]
Permafrost hydrology in changing climatic conditions: Seasonal variability of stable isotope composition in rivers in discontinuous permafrost
Increasing winter baseflow and mean annual streamflow from possible permafrost thawing in the Northwest Territories, Canada
Recent trends in freshwater influx to the Arctic Ocean from four major Arctic-draining rivers
Runoff from Arctic rivers constitutes a major freshwater influx to the Arctic Ocean. In these nival-dominated river systems, the majority of annual discharge is released during the spring snowmelt period. The circulation regime of the salinity-stratified Arctic Ocean is connected to global earth–ocean dynamics through thermohaline circulation; hence, variability in freshwater input from the Arctic flowing rivers has important implications for the global climate system. Daily discharge data from each of the four largest Arctic-draining river watersheds (Mackenzie, Ob, Lena and Yenisei; herein referred to as MOLY) are analyzed to identify historic changes in the magnitude and timing of freshwater input to the Arctic Ocean with emphasis on the spring freshet. Results show that the total freshwater influx to the Arctic Ocean increased by 89 km3/decade, amounting to a 14% increase during the 30-year period from 1980 to 2009. A distinct shift towards earlier melt timing is also indicated by proportional increases in fall, winter and spring discharges (by 2.5%, 1.3% and 2.5% respectively) followed by a decrease (by 5.8%) in summer discharge as a percentage of the mean annual flow. This seasonal increase in discharge and earlier pulse onset dates indicates a general shift towards a flatter, broad-based hydrograph with earlier peak discharges. The study also reveals that the increasing trend in freshwater discharge to the Arctic Ocean is not solely due to increased spring freshet discharge, but is a combination of increases in all seasons except that of the summer.
How is the impact of climate change on river flow regimes related to the impact on mean annual runoff? A global-scale analysis
Compatibility analysis of precipitation and runoff trends over the large Siberian watersheds
A precipitation shift from snow towards rain leads to a decrease in streamflow
DOI:10.1038/nclimate2246 [本文引用: 2]
Yukon River streamflow response to seasonal snow cover changes
DOI:10.1002/hyp.v23:1 URL [本文引用: 2]
Streamflow response to seasonal snow cover mass changes over large Siberian watersheds
Hydrologic impacts of thawing permafrost: A review
Changing groundwater discharge dynamics in permafrost regions
Simulation of reservoir influences on annual and seasonal streamflow changes for the Lena, Yenisei, and Ob' rivers
Human influence on increasing Arctic river discharges
Surface runoff changes and their causes in the Russia pan-Arctic Region
DOI:10.18402/resci.2020.02.13
[本文引用: 1]
Using the surface runoff data from the Global Runoff Data Base (GRDB) and the Arctic Great Rivers Observatory (ArcticGRO), this study analyzed the surface runoff variation characteristics of the six major river basins in the pan-Arctic region of Russia since 1930, and summarized the impacts of climate change and human activities on the surface runoff. The results provide a theoretical basis to further the scientific understanding of the runoff changes in the Arctic region of Russia under the background of climate change and increasing human activities, and for the rational development and utilization of water resources in the region. The results show that the annual runoff of the Severnaja Dvina, Pechora, Ob, Yenisei, Lena, and Kolyma Rivers increased at a rate of 1.53 m 3/s, 7.27 m 3/s, 15.37 m 3/s, 19.59 m 3/s, 38.41 m 3/s, and 21.15 m 3/s, respectively. The seasonal distribution characteristics of runoff are characterized by a decrease in flood peak flow during spring and summer, and an increase in runoff during winter. Seasonal distribution of surface runoff tended to be more even during the year. The change in annual runoff is mainly affected by climate change. In contrast, human activities have little effect on annual runoff in most areas. The two dominant factors, climate change and human activities, jointly drive the change in the annual distribution of runoff. Annual runoff of these rivers has increased as a result of global warming, while the annual distribution of runoff tends to be uniform under the combined effects of climate change and human activities.
俄罗斯环北极地区地表径流变化及其原因
DOI:10.18402/resci.2020.02.13
[本文引用: 1]
本文利用The Global Runoff Data Base (GRDB)和The Arctic Great Rivers Observatory (ArcticGRO)地表径流数据研究了1930年以来的俄罗斯环北极地区六大河流地表径流变化规律,并综述了气候变化和人类活动对地表径流的影响,为进一步科学理解气候变化和人类活动背景下的俄罗斯环北极地区的径流变化规律,进行水资源合理开发利用提供理论依据。结果表明:①北德维纳河、伯朝拉河、鄂毕河、叶尼塞河、勒拿河和科雷马河年径流量分别以每年1.53 m <sup>3</sup>/s、7.27 m <sup>3</sup>/s、15.37 m <sup>3</sup>/s、19.59 m <sup>3</sup>/s、38.41 m <sup>3</sup>/s、21.15 m <sup>3</sup>/s的速率呈增加趋势。径流的年内分布特征表现为春季和夏季的洪峰流量降低,冬季径流量增加,径流年内分配趋向更加均匀。②径流量的年际变化主要受气候变化影响,人类活动对大部分地区的年径流量影响不大,气候变化和人类活动两大因素共同驱动改变了径流的年内分布特征。研究结论对深入理解气候变化影响下的北极河流径流变化、探讨一带一路背景下的跨界水资源合作开发,以及制定北极变化的减缓和适应对策具有一定参考价值。
Increasing river discharge in the Eurasian Arctic: Consideration of dams, permafrost thaw, and fires as potential agents of change
Changes in Lena River streamflow hydrology: Human impacts versus natural variations
Streamflow changes over Siberian Yenisei river basin
DOI:10.1016/j.jhydrol.2004.03.017 URL [本文引用: 2]
A two-parameter climate elasticity of streamflow index to assess climate change effects on annual streamflow
The Arctic is becoming warmer and wetter as revealed by the Atmospheric Infrared Sounder
DOI:10.1002/grl.v42.11 URL [本文引用: 1]
Evaluation of the impact of climate change on the streamflow of major pan-Arctic river basins through machine learning models
ncreasing evaporation amounts seen in the Arctic between 2003 and 2013 from AIRS data
DOI:10.1002/jgrd.v120.14 URL [本文引用: 1]
Faster increase in evapotranspiration in permafrost-dominated basins in the warming pan-Arctic
Robust responses of the hydrological cycle to global warming
DOI:10.1175/JCLI3990.1
URL
[本文引用: 1]
Using the climate change experiments generated for the Fourth Assessment of the Intergovernmental Panel on Climate Change, this study examines some aspects of the changes in the hydrological cycle that are robust across the models. These responses include the decrease in convective mass fluxes, the increase in horizontal moisture transport, the associated enhancement of the pattern of evaporation minus precipitation and its temporal variance, and the decrease in the horizontal sensible heat transport in the extratropics. A surprising finding is that a robust decrease in extratropical sensible heat transport is found only in the equilibrium climate response, as estimated in slab ocean responses to the doubling of CO2, and not in transient climate change scenarios. All of these robust responses are consequences of the increase in lower-tropospheric water vapor.
The impact of Arctic warming on increased rainfall
The Arctic region is warming two to three times faster than the global mean, intensifying the hydrological cycle in the high north. Both enhanced regional evaporation and poleward moisture transport contribute to a 50-60% increase in Arctic precipitation over the 21st century. The additional precipitation is diagnosed to fall primarily as rain, but the physical and dynamical constraints governing the transition to a rain-dominated Arctic are unknown. Here we use actual precipitation, snowfall, rainfall output of 37 global climate models in standardised 21st-century simulations to demonstrate that, on average, the main contributor to additional Arctic (70-90 degrees N) rainfall is local warming (similar to 70%), whereas non-local (thermo)dynamical processes associated with precipitation changes contribute only 30%. Surprisingly, the effect of local warming peaks in the frigid high Arctic, where modest summer temperature changes exert a much larger effect on rainfall changes than strong wintertime warming. This counterintuitive seasonality exhibits steep geographical gradients, however, governed by nonlinear changes in the temperature-dependent snowfall fraction, thereby obscuring regional-scale attribution of enhanced Arctic rainfall to climate warming. Detailed knowledge of the underlying causes behind Arctic snow/rainfall changes will contribute to more accurate assessments of the (possibly irreversible) impacts on hydrology/run-off, permafrost thawing, ecosystems, sea ice retreat, and glacier melt.
Climate changes over the Arctic land during 1979-2017
DOI:10.18402/resci.2021.06.16
[本文引用: 3]
The Arctic is one of the rapidly changing regions remarkably influenced by global warming. Polar warming amplification (warming rate two times larger than the global mean) and rapidly declining sea ice lead to not only dramatic changes in the local environment, but also profound effects on weather and climate system in the mid-latitude. An in-depth understanding of seasonal and geographical features of long-term trends can contribute to policy responses to climate change and its consequence, supporting Arctic resource development in the future. Using gridded observational analysis datasets and the ERA-Interim reanalysis, this study focused on linear trends of surface air temperature, precipitation, and related extreme indices in the land area north of 60°N during 1979-2017. The results show that temperature changes highly agree with each other while precipitation changes are distinct across the multiple data sources, especially after 2008, which is possibly caused by sharply decreased gauges in use under the global financial crisis. The ERA-Interim dataset can well reproduce the upward trends of near-surface air temperature and precipitation over the Arctic land, about (0.57±0.07) ℃/10 a and (0.10±0.05) mm/d/100 a for annual mean. The warming trend is strong in spring, autumn, and winter whereas weak in summer. Areas near the Arctic coasts have the largest warming rate, with local warming higher than 1.0 ℃/10 a. The increasing trend of precipitation in autumn is the largest. The precipitation increases in Siberia are well linked to the local surface warming. During autumn, increases in both the mean and extreme precipitation in eastern Siberia can be as high as the thermodynamically constrained 8 %/K. No evident trend of diurnal temperature range is observed in summer. In spring, the diurnal temperature range in Alaska and northern Canada increases evidently whereas a decreasing trend emerges in other regions. Annual temperature range decreases in the Nordic, Alaska, and northern Canada while increases in western and eastern Siberia. In both winter and summer, warming trend of minimum temperature over the Arctic is larger than that of maximum temperature, which is also larger in winter than in summer. This study evidences that surface warming is an important driver of local precipitation increase over the Arctic land while circulation changes may create the geographical differences; decrease of observational stations has an obviously negative impact on monitoring the long-term trend of precipitation; ERA-Interim is an important alternative to observational analysis data in the Arctic land. Especially for regions with sparse weather stations and for periods when the number of available stations decreases, the ERA-Interim data can provide consistent and reliable climate change information.
1979—2017年北极陆地气候变化趋势
DOI:10.18402/resci.2021.06.16
[本文引用: 3]
北极地区是受全球变暖影响最为显著的地区之一。北极升温速率超过全球平均速率的2倍,这一“极地放大现象”和海冰的快速消融不仅造成当地环境的剧烈变化,还深刻影响着中纬度的天气和气候系统。深入理解气候长期趋势的季节和地理分布特征,有助于应对北极气候变化及其影响,并为未来开发北极资源服务。考虑到北极地区观测台站稀疏带来的不确定性,本文利用多套格点化的观测分析和ERA-Interim再分析资料,结合线性趋势分析,研究了1979—2017年60°N以北陆地地表温度、降水、气温日较差、年较差及相关极端气候指标的变化趋势。结果显示:①各资料中气温变化的一致性很高,但对于降水在2008年之后的变化,不同资料差异较大,可能是金融危机下可用台站数量急剧下降造成的。②ERA-Interim再分析资料能够很好地再现北极陆地温度和降水的整体增加趋势,变化速率分别约(0.57±0.07) ℃/10 a和(0.10±0.05) mm/d/100 a。春、秋、冬季升温趋势强,而夏季升温趋势较弱。北冰洋沿岸地区升温速率最大,局地可超过1.0 ℃/10 a。③降水的增加趋势在秋季最大。西伯利亚降水的增加与局地升温有很好的对应关系,其中秋季西伯利亚东部平均和极端降水的增加趋势可达热力学约束的8 %/K。④夏季气温日较差没有显著的变化趋势,春季阿拉斯加和加拿大北部地区的气温日较差呈显著增大趋势,其他区域则以减小趋势为主。气温年较差在北欧、阿拉斯加和加拿大北部呈减小趋势,在西伯利亚西部和东部呈增加趋势。无论冬夏,温度最小值的升高趋势比最大值更显著;冬季温度最小值的升高趋势比夏季更显著。研究表明,地表升温是北极陆地局地降水增加的重要驱动因素,不同区域降水变化的差异则可能与环流变化有关;观测台站数量的减少对降水趋势的监测有显著影响;ERA-Interim可作为北极地区观测分析资料的重要补充,特别在台站稀疏地区和台站数量减少的时段,ERA-Interim可提供一致和可信的气候变化信息。
Increasing annual and extreme precipitation in permafrost-dominated Siberia during 1959-2018
Towards a rain-dominated Arctic
DOI:10.1038/NCLIMATE3240
[本文引用: 3]
Climate models project a strong increase in Arctic precipitation over the coming century1, which has been attributed primarily to enhanced surface evaporation associated with sea-ice retreat(2). Since the Arctic is still quite cold, especially in winter, it is often (implicitly) assumed that the additional precipitation will fall mostly as snow(3). However, little is known about future changes in the distributions of rainfall and snowfall in the Arctic. Here we use 37 state-of-the-art climate models in standardized twenty-first-century (2006-2100) simulations4 to show a decrease in average annual Arctic snowfall (70 degrees-90 degrees N), despite the strong precipitation increase. Rain is projected to become the dominant form of precipitation in theArctic region (2091-2100), as atmosphericwarming causes a greater fraction of snowfall to melt before it reaches the surface, in particular over the North Atlantic and the Barents Sea. The reduction in Arctic snowfall is most pronounced during summer and autumn when temperatures are close to the melting point, but also winter rainfall is found to intensify considerably. Projected (seasonal) trends in rainfall and snowfall will heavily impact Arctic hydrology (for example, river discharge, permafrost melt)(5-7), climatology (for example, snow, sea-ice albedo and melt)(8,9) and ecology (for example, water and food availability)(5,10).
Strong future increases in Arctic precipitation variability linked to poleward moisture transport
Impacts of climate change and human activities on runoff changes in the Ob River Basin of the Arctic region from 1980 to 2017
DOI:10.1007/s00704-022-04021-8 [本文引用: 1]
Arctic precipitation recycling and hydrologic budget changes in response to sea ice loss
Challenges in the study of cryospheric changes and their impacts
DOI:10.11867/j.issn.1001-8166.2013.10.1067
[本文引用: 1]
Cryospheric changes and their impacts are receiving wide attention from international scientific and social communities. Here, we summarize the present hotspots of international cryospheric sciences and hence conclude four major aspects of it. They are respectively ① mechanism of cryospheric changes, ② interaction of cryospheric and other spheres of climate/earth system, ③ impacts of cryospheric changes, and ④ adaptation methods and strategy to these changes. Among the four areas, mechanism study is the basis for cryospherc sciences, interaction between different spheres is the currently developing aspect of the field, impacts of cryospheric changes are increasingly studied and yet still have large gaps, while adaptation study is still an iniative nowadays. For the above four aspects, there are key issues for each of them. For instance, dynamic responses and spatial/temporal differences are the key challenges in the mechanism studies. Rational and precise description on physical/chemical/geochemical processes of cryosphere is one of critical issues on improving the climate models. Scoping the spatial/temporal scales, as well as defining the influence degree is the key gaps in studying the cryospheric impacts. Methods and related index system for vulnerability assessment is the key issue in the study of the adaptation strategy of cryospheric impacts. Cryospheric sciences are developing towards, in the near future, the coupling of cryoshperic components into climate system in global scale, detecting the impacts of cryospheric changes using multiple and integrated methodology, and innovated approaches in adaptation.
冰冻圈变化及其影响研究的主要科学问题概论
DOI:10.11867/j.issn.1001-8166.2013.10.1067
[本文引用: 1]
冰冻圈变化及其影响日益显著并受到广泛关注。系统梳理了目前国际冰冻圈科学研究的主要关注热点, 认为冰冻圈的变化机理、冰冻圈与气候相互作用、冰冻圈变化的影响与适应等构成了国际冰冻圈科学研究的4大科学问题。冰冻圈变化机理是冰冻圈科学研究的基础领域, 冰冻圈与气候相互作用是当前着力加强的重点, 冰冻圈变化的影响日益受到关注, 但研究基础还较薄弱, 冰冻圈变化影响的适应机制是尚处在萌芽状态的研究领域。围绕上述重大科学问题, 紧抓冰冻圈变化过程中的动力响应与时空差异性问题, 气候模式中冰冻圈过程的精细化描述问题, 准确认识影响的时空尺度与程度问题和脆弱性评价方法和指标体系等科学问题, 是寻求科学突破的关键。以全球的视野审视冰冻圈的变化过程, 从有机耦合的角度探讨气候模式中的冰冻圈过程, 以多因素、多过程综合与集成的手段辨析冰冻圈变化的影响, 从方法创新上寻求科学评估冰冻圈变化脆弱性及适应性的突破途径, 是未来研究的重点。
Patterns and trends of Northern Hemisphere snow mass from 1980 to 2018
DOI:10.1038/s41586-020-2258-0 [本文引用: 1]
Detection and attribution of observed changes in Northern Hemisphere spring snow cover
DOI:10.1175/JCLI-D-12-00563.1
URL
[本文引用: 1]
Significant declines in spring Northern Hemisphere (NH) snow cover extent (SCE) have been observed over the last five decades. As one step toward understanding the causes of this decline, an optimal fingerprinting technique is used to look for consistency in the temporal pattern of spring NH SCE between observations and simulations from 15 global climate models (GCMs) that form part of phase 5 of the Coupled Model Intercomparison Project. The authors examined simulations from 15 GCMs that included both natural and anthropogenic forcing and simulations from 7 GCMs that included only natural forcing. The decline in observed NH SCE could be largely explained by the combined natural and anthropogenic forcing but not by natural forcing alone. However, the 15 GCMs, taken as a whole, underpredicted the combined forcing response by a factor of 2. How much of this underprediction was due to underrepresentation of the sensitivity to external forcing of the GCMs or to their underrepresentation of internal variability has yet to be determined.
Declining summer snowfall in the Arctic: Causes, impacts and feedbacks
DOI:10.1007/s00382-011-1105-2 URL [本文引用: 1]
Spatiotemporal variability of snow cover timing and duration over the Eurasian continent during 1966-2012
including an assessment of uncertainty
Spatiotemporal variation of snow depth in the Northern Hemisphere from 1992 to 2016
A comprehensive and hemispheric-scale snow cover and snow depth analysis is a prerequisite for all related processes and interactions investigation on regional and global surface energy and water balance, weather and climate, hydrological processes, and water resources. However, such studies were limited by the lack of data products and/or valid snow retrieval algorithms. The overall objective of this study is to investigate the variation characteristics of snow depth across the Northern Hemisphere from 1992 to 2016. We developed long-term Northern Hemisphere daily snow depth (NHSnow) datasets from passive microwave remote sensing data using the support vector regression (SVR) snow depth retrieval algorithm. NHSnow is evaluated, along with GlobSnow and ERA-Interim/Land, for its accuracy across the Northern Hemisphere against meteorological station snow depth measurements. The results show that NHSnow performs comparably well with a relatively high accuracy for snow depth with a bias of −0.6 cm, mean absolute error of 16 cm, and root mean square error of 20 cm when benchmarked against the station snow depth measurements. The analysis results show that annual average snow depth decreased by 0.06 cm per year from 1992 to 2016. In the three seasons (autumn, winter, and spring), the areas with a significant decreasing trend of seasonal maximum snow depth are larger than those with a significant increasing trend. Additionally, snow cover days decreased at the rate of 0.99 day per year during 1992–2016. This study presents that the variation trends of snow cover days are, in part, not consistent with the variation trends of the annual average snow depth, of which approximately 20% of the snow cover areas show the completely opposite variation trends for these two indexes over the study period. This study provides a new perspective in snow depth variation analysis, and shows that rapid changes in snow depth have been occurring since the beginning of the 21st century, accompanied by dramatic climate warming.
Changes in snow cover over Northern Eurasia in the last few decades
Changing northern hemisphere snow seasons
DOI:10.1175/2010JCLI3644.1
URL
[本文引用: 1]
Spatial and temporal patterns in the onset, offset, and length of the snow season across Northern Hemisphere continents are examined for the period from 1967 to 2008. Full snow seasons (FSS) and core snow seasons (CSS) are defined based on the consistency of snow cover within a location over the course of the cold season. Climatologically, the seasonal onsets of FSS and CSS progress more rapidly across the continents than the slower spring northward offset. Average Northern Hemisphere FSS duration has decreased at a rate of 0.8 week decade−1 (5.3 days decade−1) between the winters of 1972/73 and 2007/08, while there is no significant hemispheric change in CSS duration. Changes in the FSS duration are attributed primarily to a progressively earlier offset, which has advanced poleward at a rate of 5.5 days decade−1. A major change in the trends of FSS offset and duration occurred in the late 1980s. Earlier FSS offsets, ranging from 5 to 25 days, and resultant abbreviated durations are observed in western Europe, central and East Asia, and the mountainous western United States. Where regional changes in CSS were observed, most commonly there were shifts in both onset and offset dates toward earlier dates. Results indicate that it is important to pay close attention to spring snowmelt as an indicator of hemispheric climate variability and change.
The changing cryosphere: Pan-Arctic snow trends (1979-2009)
DOI:10.1175/JCLI-D-11-00081.1
URL
[本文引用: 1]
Arctic snow presence, absence, properties, and water amount are key components of Earth’s changing climate system that incur far-reaching physical and biological ramifications. Recent dataset and modeling developments permit relatively high-resolution (10-km horizontal grid; 3-h time step) pan-Arctic snow estimates for 1979–2009. Using MicroMet and SnowModel in conjunction with land cover, topography, and 30 years of the NASA Modern-Era Retrospective Analysis for Research and Applications (MERRA) atmospheric reanalysis data, a distributed snow-related dataset was created including air temperature, snow precipitation, snow-season timing and length, maximum snow water equivalent (SWE) depth, average snow density, snow sublimation, and rain-on-snow events. Regional variability is a dominant feature of the modeled snow-property trends. Both positive and negative regional trends are distributed throughout the pan-Arctic domain, featuring, for example, spatially distinct areas of increasing and decreasing SWE or snow season length. In spite of strong regional variability, the data clearly show a general snow decrease throughout the Arctic: maximum winter SWE has decreased, snow-cover onset is later, the snow-free date in spring is earlier, and snow-cover duration has decreased. The domain-averaged air temperature trend when snow was on the ground was 0.17°C decade−1 with minimum and maximum regional trends of −0.55° and 0.78°C decade−1, respectively. The trends for total number of snow days in a year averaged −2.49 days decade−1 with minimum and maximum regional trends of −17.21 and 7.19 days decade−1, respectively. The average trend for peak SWE in a snow season was −0.17 cm decade−1 with minimum and maximum regional trends of −2.50 and 5.70 cm decade−1, respectively.
Why does snowmelt-driven streamflow response to warming vary? A data-driven review and predictive framework
Climate change is altering the seasonal accumulation and ablation of snow across mid-latitude mountainous regions in the Northern Hemisphere with profound implications for the water resources available to downstream communities and environments. Despite decades of empirical and model-based research on snowmelt-driven streamflow, our ability to predict whether streamflow will increase or decrease in a changing climate remains limited by two factors. First, predictions are fundamentally hampered by high spatial and temporal variability in the processes that control net snow accumulation and ablation across mountainous environments. Second, we lack a consistent and testable framework to coordinate research to determine which dominant mechanisms influencing seasonal snow dynamics are most and least important for streamflow generation in different basins. Our data-driven review marks a step towards the development of such a framework. We first conduct a systematic literature review that synthesizes knowledge about seasonal snowmelt-driven streamflow and how it is altered by climate change, highlighting unsettled questions about how annual streamflow volume is shaped by changing snow dynamics. Drawing from literature, we then propose a framework comprised of three testable, inter-related mechanisms—snow season mass and energy exchanges, the intensity of snow season liquid water inputs, and the synchrony of energy and water availability. Using data for 537 catchments in the United States, we demonstrate the utility of each mechanism and suggest that streamflow prediction will be more challenging in regions with multiple interacting mechanisms. This framework is intended to inform the research community and improve management predictions as it is tested and refined.
Diel streamflow cycles suggest more sensitive snowmelt-driven streamflow to climate change than land surface modeling does
DOI:10.5194/hess-26-3393-2022
URL
[本文引用: 1]
. Climate warming will cause mountain snowpacks to melt earlier, reducing summer streamflow and threatening water supplies and ecosystems. Quantifying how sensitive streamflow timing is to climate change and where it is most sensitive remain key questions. Physically based hydrological models are often used for this purpose; however, they have embedded assumptions that translate into uncertain hydrological projections that need to be quantified and constrained to provide reliable inferences. The purpose of this study is to evaluate differences in projected end-of-century changes to streamflow timing between a new empirical model based on diel (daily) streamflow cycles and regional land surface simulations across the mountainous western USA. We develop an observational technique for detecting streamflow responses to snowmelt using diel cycles of incoming solar radiation and streamflow to detect when snowmelt occurs. We measure the date of the 20th percentile of snowmelt days (DOS20) across 31 western USA watersheds affected by snow, as a proxy for the beginning of snowmelt-initiated streamflow. Historic DOS20 varies from mid-January to late May among our sites, with warmer basins having earlier snowmelt-mediated streamflow. Mean annual DOS20 strongly correlates with the dates of 25 % and 50 % annual streamflow volume (DOQ25 and DOQ50, both R2=0.85), suggesting that a 1 d earlier DOS20 corresponds with a 1 d earlier DOQ25 and 0.7 d earlier DOQ50. Empirical projections of future DOS20 based on a stepwise multiple linear regression across sites and years under the RCP8.5 scenario for the late 21st century show that DOS20 will occur on average 11±4 d earlier per 1 ∘C of warming. However, DOS20 in colder watersheds (mean November–February air temperature, TNDJF<-8 ∘C) is on average 70 % more sensitive to climate change than in warmer watersheds (TNDJF>0 ∘C). Moreover, empirical projections of DOQ25 and DOQ50 based on DOS20 are about four and two times more sensitive to climate change, respectively, than those simulated by a state-of-the-art land surface model (NoahMP-WRF) under the same scenario. Given the importance of changes in streamflow timing for water resources, and the significant discrepancies found in projected streamflow sensitivity, snowmelt detection methods such as DOS20 based on diel streamflow cycles may help to constrain model parameters, improve hydrological predictions, and inform process understanding.\n
Streamflow response to seasonal snow cover extent changes in large Siberian watersheds
Potential impacts of a warming climate on water availability in snow-dominated regions
DOI:10.1038/nature04141 [本文引用: 1]
Accelerated continental‐scale snowmelt and ecohydrological impacts in the four largest Siberian river basins in response to spring warming
DOI:10.1002/hyp.v34.19 URL [本文引用: 1]
Change in spring snowmelt timing in Eurasian Arctic rivers
Historical trends and projections of snow cover over the High Arctic: A review
Snow is the dominant form of precipitation and the main cryospheric feature of the High Arctic (HA) covering its land, sea, lake and river ice surfaces for a large part of the year. The snow cover in the HA is involved in climate feedbacks that influence the global climate system, and greatly impacts the hydrology and the ecosystems of the coldest biomes of the Northern Hemisphere. The ongoing global warming trend and its polar amplification is threatening the long-term stability of the snow cover in the HA. This study presents an extensive review of the literature on observed and projected snow cover conditions in the High Arctic region. Several key snow cover metrics were reviewed, including snowfall, snow cover duration (SCD), snow cover extent (SCE), snow depth (SD), and snow water equivalent (SWE) since 1930 based on in situ, remote sensing and simulations results. Changes in snow metrics were reviewed and outlined from the continental to the local scale. The reviewed snow metrics displayed different sensitivities to past and projected changes in precipitation and air temperature. Despite the overall increase in snowfall, both observed from historical data and projected into the future, some snow cover metrics displayed consistent decreasing trends, with SCE and SCD showing the most widespread and steady decreases over the last century in the HA, particularly in the spring and summer seasons. However, snow depth and, in some regions SWE, have mostly increased; nevertheless, both SD and SWE are projected to decrease by 2030. By the end of the century, the extent of Arctic spring snow cover will be considerably less than today (10–35%). Model simulations project higher winter snowfall, higher or lower maximum snow depth depending on regions, and a shortened snow season by the end of the century. The spatial pattern of snow metrics trends for both historical and projected climates exhibit noticeable asymmetry among the different HA sectors, with the largest observed and anticipated changes occurring over the Canadian HA.
A warming-induced reduction in snow fraction amplifies rainfall extremes
DOI:10.1038/s41586-023-06092-7 [本文引用: 1]
Warming temperatures are impacting the hydrometeorological regime of Russian rivers in the zone of continuous permafrost
DOI:10.5194/tc-13-1635-2019
URL
[本文引用: 2]
. Large Arctic river basins experience substantial variability in climatic,\nlandscape, and permafrost conditions. However, the processes behind the\nobserved changes at the scale of these basins are relatively poorly\nunderstood. While most studies have been focused on the “Big 6” Arctic\nrivers – the Ob', Yenisey, Lena, Mackenzie, Yukon, and Kolyma – few or no\nassessments exist for small and medium-sized river basins, such as the\nYana and Indigirka River basins. Here, we provide a detailed analysis of\nstreamflow data from 22 hydrological gauges in the Yana and Indigirka River\nbasins with a period of observation ranging from 35 to 79 years up to 2015.\nThese river basins are fully located in the zone of continuous permafrost.\nOur analysis reveals statistically significant (p<0.05) positive trends in\nthe monthly streamflow time series during the autumn–winter period for most\nof the gauges. The streamflow increases in a stepwise pattern (post-1981) for\n17 out of 22 gauges in September (average trend value for the period of\nrecord is 58 % or 9.8 mm) and 15 out of 22 gauges in October (61 %\nor 2.0 mm). The positive trends are seen in 9 out of 19 rivers that do not\nfreeze in November (54 %, 0.4 mm) and 6 out of 17 rivers that do not\nfreeze in December (95 %, 0.15 mm). Precipitation is shown to decrease\nin late winter by up to 15 mm over the observational period. Additionally,\nabout 10 mm of precipitation that used to fall as snow at the beginning of\nwinter now falls as rain. Despite the decrease in winter precipitation, no\ndecrease in streamflow has been observed during the spring freshet in May and June\nin the last 50 years (from 1966); moreover, five gauges show an increase of\n86 % or 12.2 mm in spring floods via an abrupt change in 1987–1993. The\nchanges in spring freshet start date are identified for 10 gauges; the\nearlier onset in May varies from 4 to 10 d over the observational period. We\nconclude that warmer temperatures due to climate change are impacting the\nhydrological regime of these rivers via changes in precipitation type (rain\nreplacing snow). Other factors, such as the melting of permafrost, glaciers, and\naufeis or changes in groundwater conditions, are likely to contribute as\nwell; however, no direct observations of these changes are available. The\nchanges in streamflow can have a significant impact on the ecology of the\nzone of continuous permafrost, while the increasing freshwater fluxes to the\nArctic Ocean can impact the Arctic thermohaline circulation.\n
More frequent, intense, and extensive rainfall events in a strongly warming Arctic
Changing climate shifts timing of European floods
DOI:10.1126/science.aan2506
PMID:28798129
[本文引用: 1]
A warming climate is expected to have an impact on the magnitude and timing of river floods; however, no consistent large-scale climate change signal in observed flood magnitudes has been identified so far. We analyzed the timing of river floods in Europe over the past five decades, using a pan-European database from 4262 observational hydrometric stations, and found clear patterns of change in flood timing. Warmer temperatures have led to earlier spring snowmelt floods throughout northeastern Europe; delayed winter storms associated with polar warming have led to later winter floods around the North Sea and some sectors of the Mediterranean coast; and earlier soil moisture maxima have led to earlier winter floods in western Europe. Our results highlight the existence of a clear climate signal in flood observations at the continental scale.Copyright © 2017 The Authors, some rights reserved; exclusive licensee American Association for the Advancement of Science. No claim to original U.S. Government Works.
Winter runoff variations in European Russia
DOI:10.1134/S0097807815060032 URL [本文引用: 1]
Dissolved organic matter composition of winter flow in the Yukon River basin: Implications of permafrost thaw and increased groundwater discharge
Increased rainfall stimulates permafrost thaw across a variety of Interior Alaskan boreal ecosystems
Extremely wet summer events enhance permafrost thaw for multiple years in Siberian tundra
Changes in precipitation and air temperature contribute comparably to permafrost degradation in a warmer climate
Impact of global warming rate on permafrost degradation
Global warming weakening the inherent stability of glaciers and permafrost
Climatic warming and the degradation of warm permafrost
Remote sensing quantifies widespread abundance of permafrost region disturbances across the Arctic and Subarctic
Permafrost dynamics and their hydrologic impacts over the Russian Arctic drainage basin
Christiansen H H. Permafrost thermal state in the polar Northern Hemisphere during the International Polar Year 2007-2009: A synthesis
Fast response of cold ice-rich permafrost in northeast Siberia to a warming climate
Permafrost‐thaw‐induced land‐cover change in the Canadian subarctic: Implications for water resources
Most of the northern hemisphere permafrost remains under climate change
Potential mechanistic causes of increased baseflow across northern Eurasia catchments underlain by permafrost
Changing permafrost in a warming world and feedbacks to the Earth system
Effects of changing permafrost conditions on hydrological processes and fluvial fluxes
Permafrost degradation and hydrolic response in the Russian Arctic drainage basin
Statistics and characteristics of permafrost and ground‐ice distribution in the Northern Hemisphere
Polar Geography,
Permafrost changes and its effects on hydrological processes on Qinghai-Tibet plateau
青藏高原多年冻土变化对水文过程的影响
Guidelines for cold‐regions groundwater numerical modeling
Increased groundwater to stream discharge from permafrost thawing in the Yukon River basin: Potential impacts on lateral export of carbon and nitrogen
Using streamflow characteristics to explore permafrost thawing in northern Swedish catchments
Large sinuous rivers are slowing down in a warming Arctic
Climate change drives widespread and rapid thermokarst development in very cold permafrost in the Canadian High Arctic
Changing hydrologic connectivity due to permafrost thaw in the lower Liard River valley, NWT, Canada
Diminishing lake area across the northern permafrost zone
Pan-Arctic ice-wedge degradation in warming permafrost and its influence on tundra hydrology
Greening vs browning? Surface water cover mediates how tundra and boreal ecosystems respond to climate warming
Complexity revealed in the greening of the Arctic
Impacts of climate-induced permafrost degradation on vegetation: A review
Summer soil drying exacerbated by earlier spring greening of northern vegetation
Complex streamflow responses to climate warming in five river basins in South Yakutia, Russia
Pan‐Arctic river discharge: Prioritizing monitoring of future climate change hot spots
Cold region river discharge uncertainty: Estimates from large Russian rivers
Progress in permafrost hydrology in the new millennium
Exceeding 1.5 ℃ global warming could trigger multiple climate tipping points
Mechanisms and impacts of Earth system tipping elements
Invited perspective: What lies beneath a changing Arctic?
Climate warming enhances chemical weathering in permafrost-dominated eastern Siberia
Twenty-three unsolved problems in hydrology (UPH): A community perspective
The cold region critical zone in transition: Responses to climate warming and land use change
