

1 引言
黄河流域生态保护和高质量发展已上升为重大国家战略[1]。如何取得经济发展与环境保护的双赢,是黄河流域生态保护和高质量发展的关键。新形势下,旅游业作为绿色朝阳产业,已成为中央及各级政府解决经济发展和生态环境复杂问题、促进黄河流域绿色高质量发展的重要方向[2]。2021年10月国务院印发《黄河流域生态保护和高质量发展纲要》(简称《纲要》)明确指出,推动黄河流域文旅融合发展,把文化旅游产业打造成为支柱产业。然而,旅游业所具有的环境友好与资源消耗双重产业属性,决定了其与生态环境存在对立统一的二元矛盾关系。已有研究表明全球8%温室气体排放来自于旅游业,旅游业碳排放量预计到2025年增加至65亿t[3]。由此可见,在生态保护和高质量发展的战略要求下,旅游发展需由“追求经济高质量发展”转为“生态保护和经济高质量发展协同推进”。因此,重点关注旅游经济与生态保护的协同发展关系、分析二者协同发展的内在机制、探究影响二者协同发展的具体因素,对助推黄河流域生态环境保护和区域经济高质量发展具有重要理论与现实意义。
旅游发展与生态环境的关系是学术界广泛关注的热点问题。国外研究较早基于生物学视角分析旅游活动对自然生态本底产生的负面影响,例如植被、土壤、河流等[4-5]。Grossman等基于环境库兹涅茨曲线证实了城市生态环境与旅游经济发展呈现倒“U”型曲线的交互关系[6]。随着研究的不断深入,学者们基于可持续发展理论[7]、面板回归方法[8]、双指数函数模型[9]等深入探究了旅游业与生态环境的交互胁迫关系。国内相关研究起步较晚,已有研究通过旅游环境承载力模型[10]、旅游生态足迹[11]分析旅游活动下生境质量的阶段性波动特征并尝试从投入产出视角探讨旅游生态效率[12]、旅游资源转换效率[13]等。近年来,部分学者逐渐拓展旅游地理学研究视野,将空间纳入相关研究中。例如旅游经济对城市绿色发展的空间溢出效应、旅游生态效率与生态安全的空间一致性[14]。另外,在旅游经济与生态环境互动的现有研究中,耦合是一个常见角度。已有研究主要集中在旅游与生态环境耦合理论机制、交互关系、耦合协调评价、协同发展规律和路径等方面[15-16],研究方法主要运用耦合协调度模型、BP模型、VAR模型、交互胁迫模型和空间统计分析方法。
随着城市面临的不确定性风险日益增加,城市生态治理的核心任务被认为应由减轻脆弱性向增强韧性转变,建设韧性城市成为国际社会普遍共识。中国共产党“二十大”报告明确提出“打造宜居、韧性城市”①(①参见:
综上,关于旅游与生态的相关研究已较为丰富,但仍有以下内容值得探索:① 研究视角上,已有文献从生态足迹、绿色发展、生态安全等视角分析了生态环境与旅游经济交互关系,鲜有将生态韧性与旅游经济作为两个相互关联的系统进行分析。② 研究方法上,已有文献对旅游经济与生态保护的关系多以耦合协调研究为主。耦合侧重于研究思路和方法,对研究对象的内在机制涉及较少,协同演化相较于耦合更能揭示系统间交互作用的内在机理[16]。目前,从协同演化的视角研究旅游经济与生态环境的交互机制较为缺乏,致使两个系统交互联系的内在机理和协同演化特征并未被深刻阐释。
鉴于以上分析,本文以大河之治始于河口为切入点,选取肩负“新旧动能转换和下游湿地保护生态治理”双重重任的山东省为研究案例地,依据演化韧性视角,从“抵抗—响应—创新”3个能力构建城市生态韧性的评价指标体系,运用熵权-TOPSIS法分别测度旅游经济和城市生态韧性;采用哈肯模型、核密度估计等探究旅游经济与城市生态韧性的协同演化特征;最后,基于时空地理加权回归对二者协同演化的影响因素进行解析。一方面,完善旅游经济与城市生态韧性协同演化的理论体系和量化表达,另一方面,归纳总结旅游经济与城市生态韧性的协同演化特征,为黄河流域旅游经济与城市生态保护协调发展提供思路与建议。
2 研究设计
2.1 研究区域
山东省位于黄河入海的“地上河”河段(图1),国土流域面积占比7.90%,人口总量流域占比24.14%②(②参见:
图1
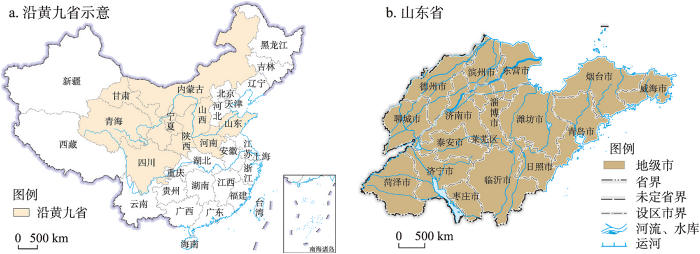
图1
研究区域示意图
注:基于自然资源部标准地图服务网站审图号为GS(2016)2881号、山东省自然资源厅标准地图服务网站审图号为鲁SG(2021)025号的标准地图绘制,底图边界无修改;研究时期为2011—2020年,故仍将莱芜区作为单独地级市分析。
Fig. 1
Schematic diagram of the research area
2.2 指标体系
2.2.1 基于综合评价模型测算旅游经济综合指数
表1 旅游经济与城市生态韧性协同演化指标体系
Tab. 1
| 一级指标 | 二级指标 | 单位 | 权重(%) | 文献来源 | |
|---|---|---|---|---|---|
| 旅游经济 | 旅游经济发展规模 | 旅游总收入 | 万元 | 14.32 | [25] |
| 游客总人数 | 万人 | 10.54 | [25] | ||
| 旅游总收入占GDP的比重 | 9.54 | [15] | |||
| 旅游经济发展效率 | 旅游人均创汇收入 | 元 | 11.82 | [15] | |
| 旅游投入产出比 | 12.74 | [15] | |||
| 旅游人均消费 | 元 | 8.52 | [25] | ||
| 旅游经济发展支撑 | 旅游接待能力 | 个 | 13.34 | [25] | |
| 文化和旅游的财政支出 | 亿元 | 10.35 | [25] | ||
| 文旅资源丰度 | 个 | 8.84 | [25] | ||
| 城市生态韧性 | 抵抗能力 | 水资源总量 | m3 | 10.45 | [27] |
| 公园绿地面积 | hm2 | 10.31 | [27] | ||
| 建成区绿化覆盖率 | 7.93 | [28] | |||
| 生物丰度指数 | 7.74 | [28] | |||
| 响应能力 | 一般工业固体废弃物综合利用率 | 4.09 | [28] | ||
| 污水处理厂集中处理率 | 3.52 | [28] | |||
| 生活垃圾无害化处理率 | 4.78 | [28] | |||
| 环保占财政支出的比例 | 11.95 | [29] | |||
| 创新能力 | R&D经费投入 | 元 | 8.62 | [29] | |
| 专利授权数量 | 个 | 9.58 | [30] | ||
| R&D人员数量 | 人 | 10.37 | [31] | ||
| 高等教育在校学生数 | 人 | 10.67 | [32] |
2.2.2 基于“抵抗—响应—创新”构建城市生态韧性
目前城市生态韧性的概念内涵与量化方法仍未达成共识,现有文献过于强调干扰的存在和生态系统的自我恢复力,忽略城市生态系统的社会属性,难以综合评估城市生态韧性的本质内涵和创新发展的能力。演化韧性视角下,城市生态韧性是城市生态系统始终具备的固有属性,无论城市生态是否受到干扰,其始终具备干扰发生前进行防御、干扰发生时及时响应和不断学习创新的动态能力。在此基础上,本文提出城市生态韧性的3阶段能力,即抵抗能力、响应能力和创新能力,从“抵抗—响应—创新”3个能力构建城市生态韧性指标体系(表1):① 抵抗能力依赖系统之前形成的条件禀赋,表现为城市生态系统所具备的承受干扰、稳定结构的属性,例如生态本底。借鉴方创琳的研究成果,从水、土、生物资源等生态因子中进行梳理[27];② 响应能力表现为受干扰的过程中,通过迅速、多样化的措施实现对冲击响应的属性,响应能力更强调社会能动性主体对干扰的应对措施;③ 创新能力表现为为更迅速应对干扰,城市生态系统通过学习、创新,进行路径突破和结构更新的属性。演化韧性认为韧性进化主要体现为“创新适应”,具体包括创新强度、创新产出、创新投入[22]。评价方法采用熵权-TOPSIS法[26]。
2.3 旅游经济与城市生态韧性协同演化的理论分析
2.3.1 自组织演化的基本条件
根据旅游经济与城市生态韧性的运行方式及协同作用,二者可以构成旅游经济—城市生态韧性复合系统,其是一个开放性、非线性、非平衡性的自适应系统[35]。开放性体现在该复合系统内部各子系统间、系统与外界之间通过彼此间的关联进行信息、物质、能量等的流动和交换;非线性体现在复合系统内部的相互作用上,如旅游经济主体(游客)与城市生态韧性主体(个人、组织、机构)间的相互作用,旅游经济主体与水、土、生物等城市生态本底之间的相互影响以及复合系统运行与宏观调控配合作用等;非平衡性是系统内部要素差异性、异质性的状态,旅游经济—城市生态韧性复合系统内部涉及多个地区和子系统,且各自的发展水平和阶段存在差异;另外,复合系统中的能动性主体具有自主性和异质性,其决策行为受有限理性约束;自适应性体现在复合系统自身能适应控制参量的变化,当外界信息、物质和能量大量涌入时,复合系统内部通过整合利用资源推动系统发展。
2.3.2 自组织演化的基本特征
旅游经济与城市生态韧性协同演化的目的是推动旅游经济与城市生态韧性保持良好的相互作用关系,达到人与自然和谐相处的发展状态[36]。在该复合系统中,旅游经济和城市生态韧性为状态参量。其中,城市生态韧性是旅游经济发展的基础条件,较高的城市生态韧性通过生态本底保持、基础设施完善,提高旅游接待能力、增强入境旅游吸引力、刺激游客消费、拓展旅游服务功能,有利于巩固旅游经济发展支撑、提高旅游经济发展效率、扩大旅游经济发展规模。与此同时,旅游经济发展带来的经济效益、环境规制等,为城市生态本底完善提供资金支持和政策保障,并对城市生态韧性提出更高要求,出现城市能动性主体(个人、组织、机构)参与到城市生态韧性系统的有益尝试,如环境污染治理、节能环保技术研发、可再生能源推广、绿色意识增强等。综上,依据协同学理论,两个状态参量在相互联系、相互作用中随时间变化呈现出不同的快慢变化,受正反馈机制作用,会使复合系统出现各种微小的随机涨落,并通过自组织行为形成控制复合系统动态演化方向和结构的序参量,在序参量驱动下,复合系统不断跳跃结构突变临界点,形成新的有序结构,其有序程度越高,协同程度就越高[37](图2)。
图2
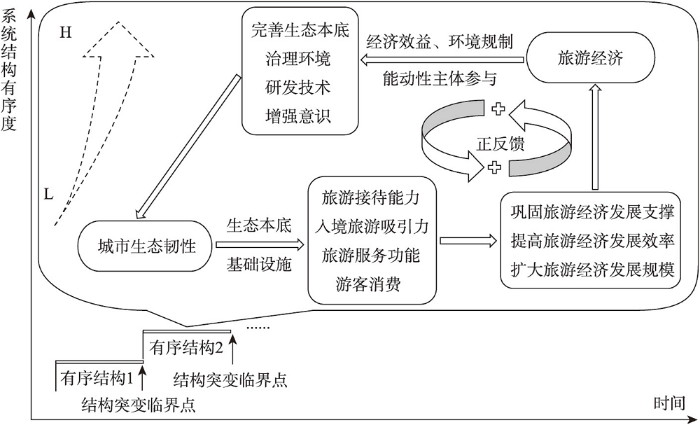
图2
旅游经济与城市生态韧性协同演化机制
Fig. 2
Co-evolution mechanism of tourism economy and urban ecological resilience
基于旅游经济与城市生态韧性协同演化的自组织特征,本文利用协同学理论的哈肯模型对复合系统内部不同状态参量相互作用的演化过程进行分析,识别出该复合系统的序参量,进而确定系统的序参量和状态参量之间的自组织关系,揭示旅游经济与城市生态韧性的协同演化机制。
2.4 研究方法
2.4.1 基于哈肯模型测算旅游经济与城市生态韧性协同演化
式中:a、b为两个子系统间相互作用的强度系数;
将其带入序参量演化方程,可得系统演化方程:
求
哈肯模型创立之初主要用于物理学领域,其使用条件在社会、经济领域存在一定偏差,为科学模拟旅游经济与城市生态韧性协同演化关系,本文对模型做如下改进:① 哈肯模型是针对连续性随机变量设定的,需要将社会经济数据离散化处理;② 旅游经济与城市生态韧性是城市固有的系统,因此需要增加哈肯模型的常数项。经过以上调整,得到协同演化方程:
2.4.2 基于时空地理加权回归模型探究影响因素
时空地理加权回归(Geographically and Temporally Weighted Regression, GTWR)是基于地理加权回归加入时间因子构建的时空依赖的局部模型,考虑回归系数不仅随着空间位置的变化而变化,也随时间而发生变化。计算公式为[32]:
式中:
旅游经济与城市生态韧性协同演化受到宏观和微观等多方面的影响,参考已有文献,从政策规划、经济发展基础、社会文化因素等方面选择了经济发展水平(ECON)、外商投资(FDI)、产业结构(STR)、人力资本(HUMAN)、环境规制(ENVI)、政府干预(GOV)、科技创新(CREA)、金融发展(FDS)等因素(表2)。
表2 变量描述性统计
Tab. 2
| 变量类型 | 变量名称 | 变量解释 | 极小值 | 极大值 | 均值 | 标准差 |
|---|---|---|---|---|---|---|
| 被解释变量 | 协同演化水平 | 采用改进哈肯模型计算得出 | 0.0014 | 0.7339 | 0.1994 | 0.1358 |
| 解释变量 | 经济发展水平 | 人均GDP(万元) | 1.8711 | 19.1173 | 6.9157 | 3.3242 |
| 外商投资 | 实际使用外资金额占GDP比重(%) | 0.0007 | 0.0479 | 0.0122 | 0.0101 | |
| 产业结构 | 产业结构指数 | 5.5671 | 23.6590 | 10.6427 | 2.4333 | |
| 人力资本 | 每万人在校大学生数(万人) | 0.0033 | 0.1212 | 0.0231 | 0.0256 | |
| 政府干预 | 地方财政支出占GDP比重(%) | 0.0149 | 0.2011 | 0.1205 | 0.0300 | |
| 环境规制 | 资源税占财政收入的比重(%) | 0.0002 | 0.0686 | 0.0162 | 0.0136 | |
| 金融发展 | 银行贷款总额占GDP比重(%) | 0.4579 | 2.2200 | 0.8922 | 0.3624 | |
| 科技创新 | 地方财政科学技术支出(万元) | 0.0029 | 0.0424 | 0.0185 | 0.0095 |
2.5 数据来源
研究数据来源涵盖2个部分:① 社会经济数据:《中国旅游统计年鉴》(2012—2021年)⑦(⑦2018年起,改为《中国文化和旅游年鉴》。)、《中国城市统计年鉴》(2012—2021年)、《山东省统计年鉴》(2012—2021年)和山东各地级市统计公报(
3 旅游经济与城市生态韧性协同演化分析
3.1 旅游经济与城市生态韧性的时空分异特征
基于熵权-TOPSIS法分别测算旅游经济和城市生态韧性,并利用自然间隔断点法将旅游经济依次划分为:高水平区域(0.3050, 1.0000)、中等水平区域(0.1580, 0.3040)和低水平区域(0.0000, 0.1570);将城市生态韧性依次划分为:高韧性区域(0.2290, 1.0000)、中等韧性区域(0.1560, 0.2280)和低韧性区域(0.0000, 0.1550)。
山东省旅游经济总体表现为先持续上升后短暂下降趋势,空间上呈现“高高集聚、低低集聚”的特征(图3a)。① 高水平区域:包括青岛、烟台、济南和泰安等地级市,旅游经济平均值分别为0.5670、0.3483、0.3702和0.3479。胶东两个地级市赋存丰富的滨海自然资源和历史文化资源,是海洋旅游重点开发区域。济南作为省会城市,具备得天独厚的旅游经济发展条件,在溢出效应下,泰安文旅资源优势进一步凸显,旅游经济蓬勃发展。② 中等水平区域:包括潍坊、威海、淄博、济宁、菏泽、临沂和日照等7个地级市。淄博、济宁两个地级市是典型的重工业城市,旅游业并非当地的中坚产业,旅游发展在资源、市场以及创新方面缺乏竞争力。③ 低水平区域:主要分布在鲁南和鲁西地区,包括聊城、德州、莱芜、滨州、东营、枣庄等6个地级市。
图3
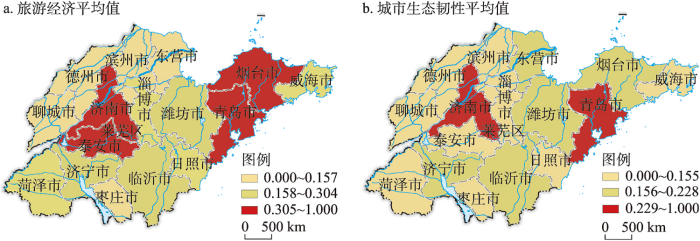
图3
2011—2020年山东省旅游经济与城市生态韧性的空间分布
Fig. 3
Spatial distribution of tourism economy and urban Ecological resilience in Shandong Province from 2011 to 2020
山东省城市生态韧性总体表现为稳定增长的态势,空间上呈现经济发达地市“双核领跑”的显著特征(图3b)。① 高韧性区域:包括济南、青岛,其城市生态韧性平均值分别为0.4207、0.4000。这两个副省级城市作为国家确定的城市环境总体规划编制试点城市和山东半岛经济增长极,既拥有成熟、科学的生态管控政策,也具备实施生态管控的物质基础。② 中等韧性区域:主要包括东营、烟台、潍坊、济宁和临沂等5个地级市。东营、济宁和临沂是传统的资源型城市,快速发展的城市化与工业化挤占了大量生态空间,城市生态文明建设落后于城市规模扩张和产业转移。③ 低韧性区域:主要分布于鲁西、鲁南地区,具体包括莱芜、枣庄、菏泽、泰安、德州、聊城、日照、淄博、滨州和威海等10个地级市。滨州和威海作为典型北方缺水的滨海城市,淡水资源短缺和地质环境是影响修复生态环境和提升生态韧性的主要限制性因子[23]。
3.2 协同演化模型构建及序参量识别
以旅游经济(TE)和城市生态韧性(UER)为状态变量,提出哈肯模型假设,并根据绝热消去法判断模型假设是否成立,最终得出系统序参量。表3所示2011—2020年旅游经济为序参量,各项参数为:γ1 = 0.0697,γ2 = 0.7386,a = -1.7180,b = 1.4441。
表3 2011—2020年山东省旅游经济与城市生态韧性协同演化序参量识别结果
Tab. 3
| 模型假设 | 运动方程 | 参数信息 | 模型结论 |
|---|---|---|---|
| 运动方程不成立;不满足绝热近似假设;模型假设不成立 | |||
| 运动方程成立;满足绝热近似假设;模型假设成立 |
注:*、**、***分别表示在10%、5%和1%水平下显著。
演化方程为:
势函数为:
令
研究显示旅游经济为协同系统的序参量,主导着协同系统的演化。控制参量反映协同系统的演化行为,其中,a < 0,说明2011—2020年城市生态韧性对旅游经济发展具有积极影响;b > 0,表明2011—2020年旅游经济发展对城市生态韧性提高具有正向推动作用,与童昀等在已有研究中得出的“以旅游业作为主导产业的城市在绿色发展领域取得的进展更为突出”结论一致[40];改进的哈肯模型中阻尼系数γ1 > 0、γ2 > 0,表明山东省旅游经济与城市生态韧性均对协同系统存在正反馈作用。综上,结合已有研究得出的“生活垃圾无害化处理率、每万劳动力R&D人员数量和人均公园绿地面积是制约山东半岛城市群城市生态韧性的主要因子”[23]这一结论,可以推断以上3个因子也是制约旅游经济与城市生态韧性协同演化的主要内部因子。人、城、境、业和谐统一是旅游经济与城市生态韧性协同演化的多元价值延伸,生态宜人的城市公园休憩地是城市绿色生态建设的重要内容,能够为开展旅游活动提供必需的空间环境;伴随旅游活动而产生的生活垃圾是旅游活动与环境承载力之间矛盾的体现,对其进行无害化处理是促进旅游经济可持续发展的重要举措;人才是创新的基础,当前旅游业正处于由传统旅游向文旅融合的转型阶段,高素质、高学历人才供给可以提高旅游发展内生动力,增强旅游经济对外竞争力。
3.3 旅游经济与城市生态韧性协同演化的时空分异特征
本文运用Stata 12软件绘制2011—2020年山东省旅游经济与城市生态韧性协同演化的核密度分布图(图4)。曲线位置上,呈现先右移后左移的趋势,表明旅游经济与城市生态韧性的协同演化经历了“增长—下降”过程。曲线形态上,研究期内核密度曲线始终存在显著右拖尾,2020年曲线拖尾现象有所减弱,表明各地区协同演化值有所提高且差距呈现收敛趋势。波峰变化上,曲线波峰宽度逐渐变宽、主峰高度持续下降,研究期末出现双峰,即旅游经济与城市生态韧性协同演化存在两极分化现象。
图4
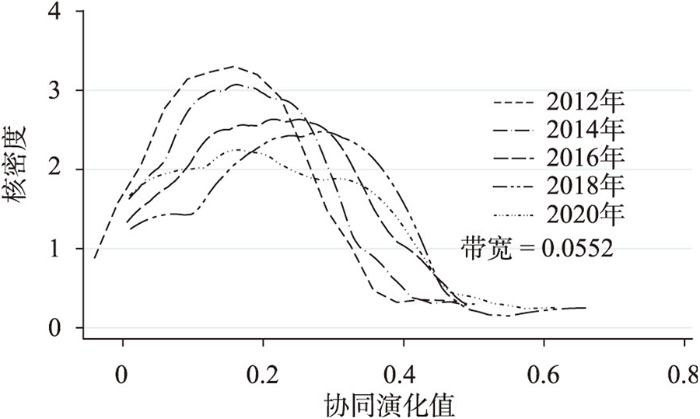
图4
2011—2020年山东省旅游经济与城市生态韧性协同演化核密度估计
Fig. 4
Kernel density estimation of co-evolution of tourism economy and urban ecological resilience from 2011 to 2020
为分析协同演化的空间分异特征,本文根据《山东省新型城镇化规划(2021—2035)》⑧(⑧参见:
图5
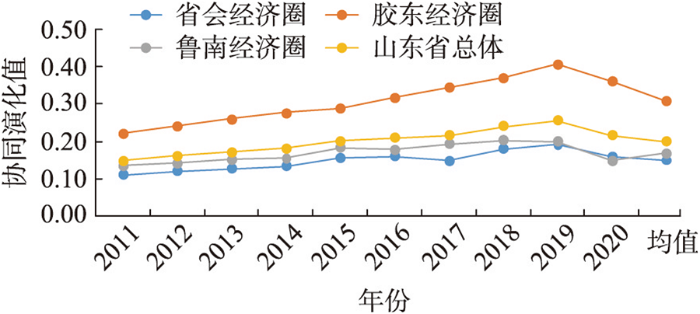
图5
2011—2020年三大经济圈旅游经济与城市生态韧性协同演化趋势
Fig. 5
Co-evolution trend of tourism economy and urban ecological resilience in three economic circles from 2011 to 2020
3.4 旅游经济与城市生态韧性协同演化的类别
本文采用自然间隔断点法对山东省17个地级市的两系统协同演化值进行划分(表4):高级协同阶段(0.4356, 0.7340)、较高级协同阶段(0.3596, 0.4355)、中级协同阶段(0.1122, 0.3595)和初级协同阶段(0.000, 0.1121)。
表4 2011—2020年山东省旅游经济与城市生态韧性协同演化分类
Tab. 4
| 地级市 | 2011年 | 2014年 | 2017年 | 2020年 | 2011—2020年 |
|---|---|---|---|---|---|
| 济南 | 中级协同(0.2306) 中—高 | 较高级协同(0.2777) 高—高 | 较高级协同(0.3221) 高—高 | 较高级协同(0.4004) 高—高 | 较高级协同 (0.3256) |
| 青岛 | 较高级协同(0.4066) 高—高 | 高级协同(0.4744) 高—高 | 高级协同(0.6084) 高—高 | 较高级协同(0.6155) 高—高 | 高级协同 (0.5355) |
| 烟台 | 中级协同(0.2215) 中—中 | 较高级协同(0.2757) 高—中 | 较高级协同(0.3352) 高—中 | 较高级协同(0.3534) 高—高 | 较高级协同 (0.3033) |
| 威海 | 中级协同(0.2125) 中—中 | 中级协同(0.2496) 中—低 | 较高级协同(0.2737) 高—低 | 中级协同(0.2416) 中—低 | 中级协同 (0.2595) |
| 潍坊 | 中级协同(0.1235) 中—中 | 中级协同(0.1845) 中—中 | 中级协同(0.2496) 中—中 | 较高级协同(0.2999) 高—高 | 中级协同 (0.2173) |
| 淄博 | 中级协同(0.1515) 低—低 | 中级协同(0.1915) 中—低 | 中级协同(0.2436) 中—中 | 较高级协同(0.2717) 高—中 | 中级协同 (0.2233) |
| 东营 | 初级协同(0.0584) 低—中 | 初级协同(0.0624) 低—中 | 初级协同(0.1015) 低—中 | 初级协同(0.0965) 低—中 | 初级协同 (0.1121) |
| 日照 | 中级协同(0.1205) 中—低 | 中级协同(0.1565) 中—低 | 中级协同(0.1985) 中—低 | 初级协同(0.1085) 低—低 | 中级协同 (0.1867) |
| 滨州 | 初级协同(0.0274) 低—低 | 初级协同(0.0444) 低—低 | 初级协同(0.0444) 低—低 | 初级协同(0.0464) 低—低 | 初级协同 (0.0404) |
| 德州 | 初级协同(0.0734) 低—低 | 初级协同(0.0865) 低—低 | 初级协同(0.0855) 低—低 | 初级协同(0.0865) 低—低 | 初级协同 (0.0881) |
| 聊城 | 初级协同(0.0694) 低—低 | 初级协同(0.0775) 低—低 | 初级协同(0.0684) 低—低 | 初级协同(0.0644) 低—低 | 初级协同 (0.0767) |
| 莱芜 | 初级协同(0.0196) 低—低 | 初级协同(0.0086) 低—低 | 初级协同(0.0104) 低—低 | 初级协同(0.0096) 低—低 | 初级协同 (0.0096) |
| 泰安 | 中级协同(0.2406) 中—中 | 较高级协同(0.3059) 中—中 | 较高级协同(0.2989) 高—中 | 较高级协同(0.2888) 高—中 | 较高级协同 (0.3029) |
| 济宁 | 中级协同(0.1355) 中—低 | 中级协同(0.2025) 中—高 | 中级协同(0.2466) 中—中 | 较高级协同(0.2888) 高—中 | 中级协同 (0.2244) |
| 菏泽 | 中级协同(0.2526) 中—低 | 中级协同(0.1956) 中—低 | 中级协同(0.2346) 中—低 | 中级协同(0.1135) 中—低 | 中级协同 (0.1914) |
| 枣庄 | 初级协同(0.0254) 低—低 | 初级协同(0.0624) 低—低 | 初级协同(0.1015) 低—低 | 初级协同(0.0965) 低—低 | 初级协同 (0.1121) |
| 临沂 | 中级协同(0.1375) 中—中 | 中级协同(0.1935) 中—高 | 中级协同(0.2526) 中—高 | 较高级协同(0.2918) 高—高 | 中级协同 (0.2244) |
注:A—B”表示“旅游经济—城市生态韧性”,例如“中—高”对应着旅游经济为中等水平、城市生态韧性为高韧性水平。
(1)初级协同区域:包括东营、滨州、德州、聊城、莱芜和枣庄等6个地级市,其协同演化平均值分别为0.1121、0.0404、0.0881、0.0767、0.0096和0.1121。研究期内,6个地级市的协同演化水平始终处于初级阶段。除东营以外,以上5个地级市的旅游经济与城市生态韧性均处于“双低”水平,可能原因是,该类地级市城市生态本底薄弱,人口密度高,排污治污设施标准低[41],不仅严重制约城市生态韧性增强,也难以为开展旅游活动提供基础保障,制约旅游经济可持续发展。东营城市生态韧性处于中等水平,而旅游经济则处于低水平,两者的不平衡发展是造成地区内协同演化水平较低的主要原因。
(2)中级协同区域:包括威海、潍坊、淄博、日照、济宁、菏泽和临沂等7个地级市,其协同演化的平均值分别为0.2595、0.2173、0.2233、0.1867、0.2244、0.1914和0.2244。在研究期末,潍坊、淄博、济宁和临沂的协同演化水平均从中级协同上升为较高级协同,反映出在经济步入“新常态”和“五位一体”发展理念的背景下,生态旅游、文化旅游成为潮流,加之严格的环境规制政策,各地区积极开展生态文明建设,旅游经济与城市生态韧性协同演化得到改善。2017—2020年威海协同演化水平由较高级降为中级协同,日照则由中级协同降为初级协同。可能原因是,一方面,受新型冠状病毒感染的影响日照和威海依托地理区位接纳境外旅游的优势持续下降,旅游经济由2019年的0.454降至2020年的0.161;另一方面,受青岛的人才“虹吸效应”影响,R&D人员流失现象严重,一定程度降低了协同系统演化的智库保障。
(3)较高级协同区域:包括济南、泰安和烟台,其协同演化的平均值分别为0.3256、0.3029和0.3033。2011—2020年,3个地级市协同演化水平均从中级协同上升为较高级协同,此后始终保持在较高级协同阶段。研究期内,济南城市生态韧性始终处于高韧性水平,旅游经济在2014年开始由中等水平升至高等水平。依托《山东省省会城市群经济圈发展规划》,以济南为首的省会经济圈被定位为全省改革开放先行区、改革开放示范区、生态文明和谐区,区内地级市生态文明建设起步早、基础好。
(4)高级协同区域:仅包括青岛,协同演化的平均值为0.5355。研究期内,青岛的旅游经济和城市生态韧性始终处于高等水平,均对两系统的协同演化发挥着显著的正反馈效应。青岛是山东省乃至中国东部沿海重要的经济中心城市,拥有强大的旅游产业势能,2021年旅游总收入占山东省旅游总收入的17.04%。此外,以青岛为中心的胶东经济圈的绿色开发建设先后被列入国家重大地区发展战略,城市生态文明建设起步早、发展成熟,生态韧性的正反馈效应较为持续和显著。
4 旅游经济与城市生态韧性协同演化的影响因素分析
4.1 GTWR模型计算结果
运用ArcGIS 10.6的GTWR插件进行影响因素的计算与分析,将时空距离参数比值设定为1,2011—2020年山东省城市生态韧性和旅游经济协同演化影响因子的GTWR回归模型相关参数如表5所示。其中,带宽为0.1158,AICc为-543.1240,调整后R2变为0.9816,大于OLS模型R2(0.9271),表明GTWR模型的解释效果优于OLS模型。因此,选择GTWR模型探究山东省旅游经济与城市生态韧性协同演化影响因素的时空非平稳性。
表5 GTWR的相关参数
Tab. 5
| 模型参数 | 带宽 | 残差平方和 | 残差估计标准差 | 赤池信息量准则 | R2 | 调整后R2 | 时空距离比 |
|---|---|---|---|---|---|---|---|
| 值 | 0.1158 | 0.1326 | 0.0283 | -543.1240 | 0.9770 | 0.9816 | 0.3811 |
4.2 协同演化的影响因素分析
山东省旅游经济与城市生态韧性协同演化的影响因素具有显著的空间异质性,且各因素对协同演化存在明显的个体差异(图6)。
图6
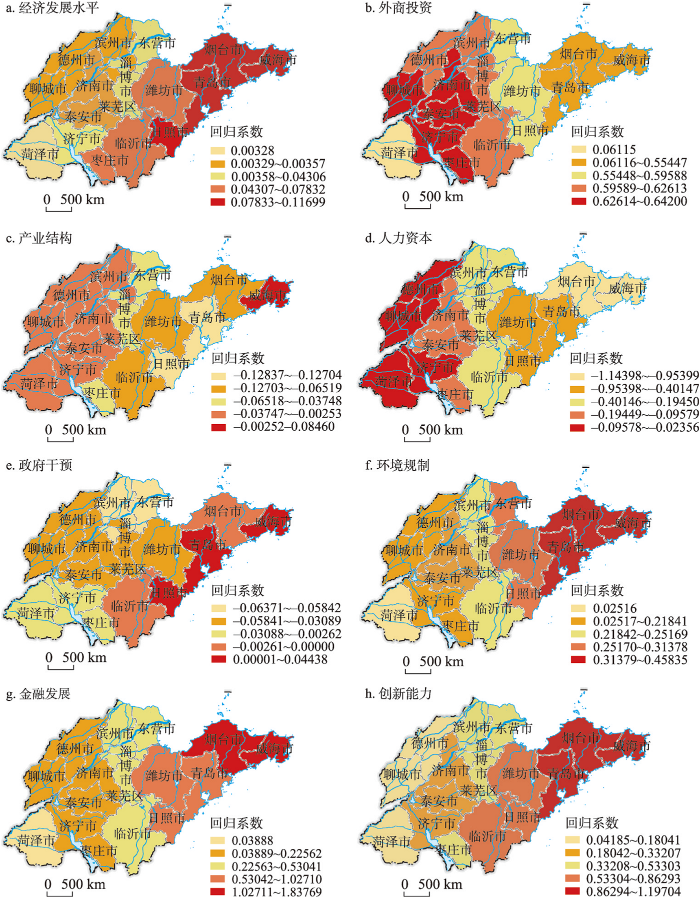
图6
山东省旅游经济与城市生态韧性协同演化影响因素的空间分布
Fig. 6
Spatial distribution of influencing factors on the co-evolution of tourism economy and urban ecological resilience in Shandong province
经济发展水平(ECON)对两系统协同演化主要表现为显著正向影响,推动作用整体呈现由东部沿海向西部内陆阶梯式递减,与山东省经济发展布局较为一致。具体来看,经济发展水平回归系数高值区集中分布在以青岛为中心的胶东经济圈,经济发展水平越高的城市对旅游资源配置和加强生态文明建设的调动力越强。然而,济南作为山东省政治、经济中心,其经济发展水平对协同演化的正向影响不显著,一定程度上印证了环境库兹涅茨曲线理论的相关内容。受资源依赖型的重工业发展影响,鲁南经济圈经济发展水平的回归系数较小。
外商投资(FDI)对两系统协同演化的影响以显著正向作用为主,表明山东省已较为成功地跨越了发展中地区普遍面临的“污染避难所”困境,整体呈现由西部内陆向东部沿海递减的带状分布格局。具体来看,外商投资在鲁南经济圈和省会经济圈的推动作用较为突出,胶东经济圈外商投资的正向推动作用较小,原因可能是胶东经济圈外商投资发展水平较高,地区内外商投资的角色转变较为成熟,依据边际效应递减规律,其正向推动作用逐渐减弱。
产业结构(STR)对两系统协同演化的作用主要表现为不显著负向影响,整体呈现“中部强、东西弱”的分布格局,与郭付友等在已有研究中得出的“产业结构因素对于山东省产业生态化发展起到负面影响作用”的结论一致[42]。现阶段山东省仍是以传统资源型重工业为主导,传统产业占整个产业的70%,其中70%都是钢铁、石油等重化工业⑨(⑨参见:
人力资本(HUMAN)对两系统协同演化的影响不显著,且为负值。其原因一方面可能与高素质人才外溢相关,技术创新与旅游业和城市生态文明建设的耦合程度较低;另一方面,现阶段山东省处于传统工业模式向“新技术、新产业、新业态、新模式”转变过程中,大城市的虹吸效应,推动人力资本高度集聚,进而加剧当地人地矛盾,最终降低人力资本的创新转化效率。例如,人力资本回归系数的低值区主要集中在胶东经济圈,高值区位于鲁南经济圈。
政府干预(GOV)对两系统协同演化的影响具有显著的空间异质性,表现为“胶东经济圈显著为正,鲁南经济圈和省会经济圈存在不显著负影响”。政府干预作为市场力量的替代机制而发挥作用,可以增强旅游市场活力、刺激旅游企业发展;通过对资源利用予以干预,积极消除负外部性。然而,超越市场作用力的政府干预则将对地区发展起到相反的作用[43]。鲁南经济圈和省会经济圈的部分地级市是典型的重工业城市,部分城市存在产业转型难、资本投入冗余等问题,过度的政府干预可能会降低企业参与城市生态文明建设的积极性。
环境规制(ENVI)对两系统协同演化始终表现为显著正向促进作用,与“波特假说”相符,呈现由东北部沿海向西南内陆递减的带状布局。具体来看,正向影响在胶东经济圈较为突出,该区域经济基础好,对外开放程度高,环境规制可以有效推动节能减排和生态环境的恢复。环境规制在鲁南经济圈的正向影响较小,可能原因是过高的资源投入和污染排放使得环境规制产生的“创新补偿”作用不明显。
金融发展(FDS)对两系统协同演化的影响及分布格局与环境规制较为一致。《山东省人民政府关于加快全省金融改革发展的若干意见》等文件发布,普惠金融服务下沉基层得到深入部署。然而由于资本的逐利性和政策的倾斜,导致山东省普惠金融在发达地区形成“资金洼地”,存在较大的地区差异。具体来看,金融发展回归系数的高值区主要分布在胶东经济圈,低值区主要处于鲁南经济圈。
创新能力(CREA)对两系统协同演化的回归系数基本为正,并均通过显著性检验,整体呈现“东强西弱”阶梯式递减格局,表明在高质量发展和生态保护兼顾的发展初期,提高以政府主导的创新能力是可行之策。高值区主要分布在胶东经济圈,回归系数均大于1;创新能力在鲁南经济圈的正向影响较小,据《山东省区域科技创新能力评价报告2020》数据显示,菏泽、临沂、济宁等地级市创新活跃度较低,与省内平均水平仍有较大差距。
5 结论与讨论
5.1 结论
本文依据演化韧性视角,构建了城市生态韧性评价指标体系,借助熵权-TOPSIS法分别测度了山东省旅游经济和城市生态韧性,运用空间分析工具和哈肯模型分别探讨了旅游经济和城市生态韧性的时空分异及两系统协同演化的内在机制和特征。主要结论为:
(1)山东省旅游经济总体表现为先持续上升后短暂下降趋势,呈现“高高集聚、低低集聚”的空间特征,高水平区域包括青岛、烟台、威海、济南和泰安,低水平区域主要分布在鲁西和鲁南地区。城市生态韧性总体表现为稳定增长的态势,呈现济南、青岛两个地级市“双核领跑”的空间格局,低韧性区域主要分布在鲁南地区。
(2)旅游经济是旅游经济与城市生态韧性协同演化的序参量,主导协同系统间要素的流动状态和互动关系。现阶段山东省旅游经济与城市生态韧性协同系统已形成正反馈机制,其协同演化水平呈现倒“V”型变化趋势,地区差异显著,形成“胶东经济圈>鲁南经济圈>省会经济圈”的空间格局。
(3)旅游经济与城市生态韧性协同演化呈现等级特征。高级与较高级协同区域主要为中心城市,如济南、青岛和烟台;中级协同区域包括威海、潍坊、淄博、日照、济宁、菏泽和临沂;东营、滨州、德州、聊城、莱芜和枣庄等属于初级协同区域,旅游经济和城市生态韧性均处于较低水平。
(4)旅游经济与城市生态韧性协同演化的内外影响因素存在时空差异。生活垃圾无害化处理率、每万劳动力R&D人员数量和人均公园绿地面积是制约协同演化的主要内部因素;经济发展水平、外商投资、环境规制、金融发展和创新能力是正向促进协同演化的外部因素,产业结构、人力资本是负向抑制协同演化的外部因素。其中,经济发展水平、环境规制和金融发展、创新能力的促进作用均呈现“东强西弱”阶梯式递减格局,外商投资与之相反;产业结构的负向作用整体呈现“中部强、东西弱”的空间分布。
5.2 讨论
在黄河流域生态保护和高质量发展的时代背景下,推动旅游经济高质量发展和提升城市生态韧性是必行之策。首先,本文将研究尺度聚焦于地级市尺度,旨在更深刻、合理地分析旅游经济与城市生态韧性协同演化的规律和异质性。其次,本文从“演化韧性”视角探讨山东省城市生态韧性,符合建设“韧性城市”的现实需求;同时,基于协同理论、运用哈肯模型探究旅游经济与城市生态韧性的协同演化特征,弥补了以往多进行耦合协调分析的不足,丰富了旅游经济学和城市生态学的研究视角。最后,本文通过时空地理加权回归模型对山东省旅游经济与城市生态韧性协同演化的影响因素进行探析,以期为两系统协同演化特征作出更为科学的解析。
山东省旅游经济与城市生态韧性呈现良性互动局面,但协同演化区域差异显著,各地市生态保护和高质量发展要树立“一体化”意识和“一盘棋”思想,提高旅游产业的互补性、增强生态保护过程中的溢出效应。旅游经济作为主导协同系统演化的序参量,对协同系统存在正反馈效应,其协同效应与旅游经济发展水平存在一定的空间对应关系,部分地级市旅游经济与城市生态韧性仍处于“双低”阶段。各地级市应因地制宜推动旅游高质量发展、切实践行城市生态文明建设。针对产业倚能倚重阻碍旅游经济与城市生态韧性协同演化的现实问题,三大经济圈要严格落实“四减四增”三年行动方案,加大传统产业转型升级力度。最后,通过分析旅游经济与城市生态韧性的协同演化特征,为黄河流域生态保护和高质量发展提出以下几点建议:
(1)旅游经济与城市生态韧性均对协同系统发挥正反馈效应的内在机制,说明实现生态保护和旅游经济的“双赢”是黄河流域未来发展的重要方向,流域内各地区应发挥黄河文化资源和自然生态的突出优势,注重优质资源的“强强联合”,推动流域形成串联和糅合上中下游文化及生态资源的黄河生态文旅带。
(2)依据旅游经济与城市生态韧性协同演化存在地区差异,中心城市协同演化水平较高这一现状,黄河流域各地区应增强中心城市的合作,通过建立互利联盟的方式组成黄河流域生态保护和高质量发展的排头兵,进而推动全流域协同发展。
(3)针对制约旅游经济与城市生态韧性协同演化的内外影响因素,黄河流域各区域应化被动为主动,聚焦拓展城市绿色空间、着重加强城市污染治理力度、提高人力资本的创新转换效率;与此同时,全流域要坚持绿色发展观,通过提升产业发展层次、推动传统产业低碳化改造、扶持发展现代化服务业等构建绿色产业体系,加快新旧动能转换。
需要说明的是,黄河流域自然地理千差万别、风土人情丰富多彩,后续研究有待拓展至黄河流域层面。此外,协同系统演化的驱动机制和优化路径也是今后研究的方向。
关联数据信息:本文关联实体数据集已在《全球变化数据仓储电子杂志(中英文)》出版,获取地址:
参考文献
Speech at the symposium on ecological protection and high-quality development of the Yellow River Basin
在黄河流域生态保护和高质量发展座谈会上的讲话
Dynamic evolution characteristics and driving factors of tourism ecological security in the Yellow River Basin
DOI:10.11821/dlxb202203015
[本文引用: 1]

It is of great theoretical and practical importance to measure and examine tourism ecological security in the Yellow River Basin (YRB). The purpose of this study is to promote coordinated and sustainable development of the tourism economy and ecological environment. From the perspective of watershed sustainable development, this paper constructs the theoretical framework and index system of tourism ecological security in the YRB based on DPSIR system model, and analyzes its dynamic evolution characteristics and driving factors by using improved TOPSIS method, kernel density estimation, spatial autocorrelation, traditional and spatial Markov chains and quantile regression panel method. The results showed that: (1) There has been an evolutionary trend toward a dual-core form of tourism ecological security over time, as its average value fluctuates and then rises. The overall tourism ecological security level was relatively low (0-0.55), shifting from the predominant risk level in 2008 (accounting for 89.04%) to the levels of predominant risk and deterioration in 2017 (60.27% and 31.51%, respectively). A large downward risk remains. (2) In terms of dynamic evolution characteristics, the transfer of tourism ecological security risks and sensitive levels had "path dependence" and "self-locking" effects. In practice, however, the probability of maintaining the initial state of the deterioration level and the critical safety level was relatively small. And the type of transfer was usually accomplished during a subsequent level transfer. Its dynamic change process was strongly influenced by regional factors. Its characteristics of dynamic evolution were characterized by significant spatial and temporal heterogeneity. (3) Tourism ecological safety was most significantly influenced by environmental pollution in lower-level units. The tourism load level had a greater positive marginal effect on higher-level areas; however, economic development and level of tourism development have a greater positive marginal effect on areas with lower ecological tourism security levels.
黄河流域旅游生态安全的动态演变特征及驱动因素
DOI:10.11821/dlxb202203015
[本文引用: 1]
科学测度与审视旅游生态安全对促进黄河流域旅游经济和生态环境协调可持续发展具有重要的理论和实践价值。从流域可持续发展视角,基于DPSIR系统模型构建黄河流域旅游生态安全理论框架和指标体系,采用改进TOPSIS法、核密度曲线、空间自相关、传统和空间马尔可夫链及面板分位数回归方法对其动态演化特征和驱动因素进行探析。结果表明:① 时间上,旅游生态安全均值波动下降后上升,呈收敛趋势,且有向“双核”形态演变的趋势。空间上,旅游生态安全值整体较低(0~0.55),由2008年以风险级为主(占89.04%)转变为2017年以风险级和恶化级为主(分别占60.27%和31.51%),且仍存在较大下行转移风险。② 动态演化特征上,不考虑邻域条件下,旅游生态安全风险级、敏感级转移具有“路径依赖”与“自身锁定”效应。而恶化级、临界安全级保持初始状态概率较小,且类型转移通常发生在相邻等级递次转移。邻域背景在其动态变化过程中起着重要作用,且其动态演化特征具有显著时空异质性。③ 影响因素方面,环境污染对低层级单元的旅游生态安全负向抑制作用较为明显,旅游负荷水平对较高层级地区旅游生态安全的正向边际效应略大,而旅游发展水平、经济发展水平等变量则对较低等级单元旅游生态安全的正向边际效应较大。
The carbon footprint of global tourism
DOI:10.1038/s41558-018-0141-x [本文引用: 1]
Soil conditions of picnic grounds in public forest parks
Impacts of outdoor recreation on natural vegetation
Economic growth and the environment
DOI:10.2307/2118443 URL [本文引用: 1]
Carrying capacity of water environment in public tourism resources based on matter-element model
Climate change and tourism: Time for environmental skepticism
DOI:10.1016/j.tourman.2014.02.014 URL [本文引用: 1]
Coordinated development of a coupled social economy and resource environment system: A case study in Henan province, China
DOI:10.1007/s10668-017-9926-8 URL [本文引用: 1]
Application of tourism carrying capacity assessment in beach tourism management
旅游承载力评估在海滩旅游管理中的应用
Spatial and temporal evolution of eco-efficiency of inter-provincial tourism in China based on ecological footprint
基于生态足迹的中国省际旅游生态效率时空演化
The spatio-temporal evolution of tourism eco-efficiency in the Yellow River Basin and its interactive response with tourism economy development level
黄河流域旅游生态效率时空演化及其与旅游经济互动响应
Study on high quality development of tourism economy in 18 key provinces along the One Belt and One Road Initiative: Based on the measurement of tourism resource conversion efficiency
DOI:10.13249/j.cnki.sgs.2020.09.012
[本文引用: 1]
From the perspective of tourism resource conversion efficiency, taking 18 key provinces along the ‘One Belt and One Road’ as the research target area, this paper applies the modified DEA model, Zou test and convergence test to explore the temporal and spatial variation rules and development trend of the tourism economic growth quality in 2008-2014 and 2014-2017 years two periods. The main contribution of this paper is to measure the conversion efficiency of tourism resources, which is an input factor. It overcomes the shackles that the existing literature only measures the comprehensive efficiency of tourism and cannot judge the conversion efficiency of tourism resources, and provides a new perspective for the study of high-quality development of tourism economy. The results show that: 1) In the past ten years, the average efficiency of tourism resources transformation in the 18 key provinces was only 0.312, far from the forefront of production, which further verifies that the development of China's tourism industry was still in the extensive growth mode of factor expansion, and the high-quality growth mode driven by efficiency had not yet formed. 2) After Chow test, it confirmed that 2014 was the mutation point of the time series of tourism resources conversion efficiency in the 18 key provinces along the ‘One belt and one road’, which provides a quantitative basis for the ‘One Belt and One Road’ initiative to enhance the transformation efficiency of tourism resources in various provinces. 3) From the perspective of space, in the past ten years, the development of tourism resource conversion efficiency in the provinces of the opening-up leading area, the external window area, the strategic fulcrum area and the core area of the silk belt had been unbalanced, with the average of 0.348, 0.311, 0.299 and 0.291, which were all at a low level of development and far from the forefront of production. 4) There were $\sigma$ convergence, absolute $\beta$ convergence and conditional $\beta$ convergence in the conversion efficiency of tourism resources of the 18 key provinces in 2008-2014 and 2014-2017, which shows that with the passage of time, the conversion efficiency of tourism resources of the 18 key provinces would converge to their steady-state level, and there was a ‘catch-up effect’ of the laggards on the advanced, especially in 2014-2017. In the three regions, there were ‘club’ convergence effects. During the research period, the efficiency of tourism resources conversion fluctuated frequently in each province of strategic fulcrum area, and the β convergence path which accorded with the steady value level of each province had not been found.Based on the analysis of the spatial and temporal evolution and development trend of tourism resource conversion efficiency of the 18 key provinces and regions along the line, the following suggestions are proposed: First, Build a high-quality growth evaluation system with ‘efficiency’ as the core. Second, Continue to push forward the supply side structural reform of tourism resources. Third, Give full play to the decisive role of market in allocating tourism resources. Finally, Establish the internal dynamic mechanism of technological innovation diffusion.
“一带一路”沿线重点省份旅游经济高质量发展研究: 基于旅游资源转换效率的测度
DOI:10.13249/j.cnki.sgs.2020.09.012
[本文引用: 1]
从旅游资源转换效率的视角,以“一带一路”沿线18个重点省份为研究靶区,运用修正的DEA模型等方法探究2008—2017年的旅游经济增长质量的时空演变及发展趋势。研究结论有:① 10 a间,18个重点省份旅游资源转换效率均值仅为0.312,远未达到生产前沿面。② 经过邹检验(Chow test),2014年为“一带一路”沿线18个重点省份旅游资源转换效率时间序列的突变点。③ 18个重点省份的旅游资源转换效率均存在σ收敛、绝对β收敛和条件β收敛;开放先行区、战略支点区未通过σ收敛检验、战略支点区未通过绝对β收敛。
The influence and spatial spillover effects of tourism economy on urban green development in China
DOI:10.11821/dlxb202110012
[本文引用: 1]
Ecological priority and green development has become one of China's national strategies. Additionally, the scientific understanding of the green externality of tourism economy and its spatial spillover is still insufficient. Therefore, in terms of theoretical and practical significance, it is necessary to demonstrate whether China's tourism economy can promote green development and reveal its spatial spillover characteristics. On the basis of constructing the spatial spillover mechanism of green development effect of tourism economy, this paper selects green total factor productivity (GTFP) as the evaluation index of urban green development level based on bibliometric analysis; integrates multi-source data and uses EBM-GML model to calculate and decompose the GTFP of 284 cities at prefecture level in China from 2005 to 2016; uses the spatial analysis method to describe the spatio-temporal pattern and spatial clustering of GTFP at prefecture level. Based on the spatial Durbin model, this paper reveals the impact of tourism economy on green development and spatial spillover effect. The results show that: (1) the annual average of GTFP in eastern, central, western and northeastern China showed an overall upward trend. Eastern China has the largest improvement in GTFP (accumulated growth of 48.08%), followed by the western region (accumulated growth of 44.18%) and the northeastern region (accumulated growth of 36.05%), while the central region has the lowest improvement (accumulated growth of 26.56%), so that the "Central Collapse" feature is obvious. Moreover, there is a spatial dislocation between China's GTFP pattern and its economic map at the prefecture level. (2) The tourism economy could significantly promote the growth of local GTFP in tourist destinations by simultaneously promoting green efficiency change (GEC) and green technological change (GTC). (3) The spatial spillover mechanism of tourism economy on green development is reflected in the fact that tourism economy can significantly improve the GEC in neighboring cities, but it cannot significantly promote the GTC in neighboring cities. (4) In terms of policy, it is necessary to strengthen the linkage development of tourism economy within the region, and build an innovative spillover mechanism for tourism destinations. In addition, it is feasible to promote the coordinated development of tourism destinations and neighboring industries, and create a regional industrial ecosystem and complex with deep participation in the tourism industry.
中国旅游经济对城市绿色发展的影响及空间溢出效应
DOI:10.11821/dlxb202110012
[本文引用: 1]
在“生态优先、绿色发展”战略背景下,针对旅游经济绿色产业外部性及其空间溢出的科学认识缺乏,论证中国旅游经济能否促进绿色发展并揭示其空间溢出特征具有理论和现实意义。选取绿色全要素生产率(GTFP)作为城市绿色发展水平评价指标;融合多源数据并利用EBM-GML模型测算并分解中国284个地级以上城市2005—2016年GTFP;利用空间分析方法刻画地市尺度下GTFP时空格局及聚类情况;依托空间杜宾模型揭示旅游经济对绿色发展的影响及空间溢出效应。结果表明:① 东部、中部、西部、东北城市GTFP年度均值呈现总体上升态势,但“中部塌陷”特征明显;地市尺度中国GTFP格局与经济版图存在空间错位。② 旅游经济具有良好的绿色发展效应,能够同时促进绿色技术效率和绿色技术进步,进而驱动目的地本地GTFP增长。③ 旅游经济对GTFP存在不显著的正向空间溢出,但对绿色技术效率具有显著正向空间溢出。④ 政策上应加强区域内旅游经济联动发展,构建旅游目的地创新溢出机制,推动旅游目的地与邻地产业分工协同发展,打造旅游业深度参与的区域产业生态圈和综合体等,以期强化中国旅游经济对绿色技术进步的空间溢出。
Temporal and spatial evolution of the coupling coordinated development between tourism resources development and ecological environment in China
我国旅游资源开发与生态环境耦合协调发展的时空演变
Spatiotemporal differentiation and driving force analysis of the high-quality development of urban agglomerations along the Yellow River Basin
The ecological protection and high-quality development (HQD) of the Yellow River Basin (YRB) have been promoted as national strategies. An urban agglomeration is the basic unit of the YRB used to participate in international competitions. Taking seven urban agglomerations covering 70 cities along the YRB as the sample, this paper establishes a high-quality evaluation system and uses the entropy method and exploratory spatial data analysis (ESDA) to analyze the HQD levels of the seven urban agglomerations along the YRB from 2009 to 2018. In addition, geographically-weighted regression (GWR) is adopted to analyze the influencing factors. The results show that: (1) the gap in the HQD of the seven urban agglomerations gradually narrows, showing a spatial pattern of “high in the east, low in the west, and depression in the middle”; (2) the HQD levels of the seven urban agglomerations have a strong spatial correlation, and the patterns of cold and hot spots have not changed substantially, showing the spatial distribution of “hot in the east, cold in the west”; (3) the degree of influence of each driving factor on the HQD differs among the seven urban agglomerations. The order is as follows: industrial structure upgrading index > proportion of R&D expenditure > urbanization rate > internet penetration rate > proportion of urban construction area > proportion of days reaching the air standard. These findings show that advanced industrial structure and technology are the two core driving forces for the HQD of the urban agglomerations along the YRB.
Towards an evolutionary perspective on regional resilience
DOI:10.1080/00343404.2014.959481 URL [本文引用: 1]
Resilience of and through urban ecosystem services
DOI:10.1016/j.ecoser.2014.07.012 URL [本文引用: 1]
Performance Based Planning of complex urban social-ecological systems: The quest for sustainability through the promotion of resilience
Challenging disaster administration: Toward community-based disaster resilience
Coupling relationship between urbanization and ecological resilience in the Pearl River Delta
DOI:10.11821/dlxb202104013
[本文引用: 1]
Urban resilience is an emerging research topic of urban studies, and its essence is the ability of cities to resist, recover and adapt to uncertain disturbances. This paper first constructs a "Size-Density-Morphology" urban ecological resilience evaluation system, and then uses the coupling coordination degree model to measure the degree of coupling coordination between urbanization and ecological resilience in the Pearl River Delta from 2000 to 2015, and conducts an in-depth discussion on its temporal and spatial characteristics. The results show that: (1) From 2000 to 2015, the urbanization level of cities in the study area generally increased while the level of ecological resilience declined. The coupling coordination degree between the two systems decreased from basic coordination to basic imbalance. (2) In terms of spatial distribution, the coupling coordination degree between ecological resilience and urbanization of cities presented a circle pattern that centered on the cities at the mouth of the Pearl River and increased toward the periphery. (3) Ecological resilience subsystems played different roles in the coupling coordination between urbanization and ecological resilience. Specifically, size resilience mainly played a reverse blocking role; the influence of morphological resilience was mainly positive and continued to increase over time; the effect of density resilience was positive and continued to decline and further became negative after falling below zero. Leading the coordinated development of regions with new urbanization, and improving ecological resilience by strictly observing the three areas and three lines, adapting to ecological carrying capacity, and rationally arranging urban green spaces, are the main path for achieving coordinated and sustainable development of urbanization and ecological resilience in the Pearl River Delta in the future.
珠三角地区城镇化与生态韧性的耦合协调研究
DOI:10.11821/dlxb202104013
[本文引用: 1]
城市韧性是新兴的研究话题,其实质为城市面对不确定性扰动的抵抗、恢复及适应能力。本文构建“规模—密度—形态”三维城市生态韧性评价体系,借鉴物理学耦合模型测算2000—2015年珠三角城市城镇化与生态韧性的耦合协调度,并对其时空变化特征进行深入探讨。结果表明:2000—2015年珠三角各市的城镇化水平总体不断提升,生态韧性水平持续降低,两者耦合协调度总体由基本协调向基本失调下滑。在空间分布上,珠三角地区城镇化与生态韧性的耦合协调度呈现出以珠江入海口城市为中心、向外围递增的圈层式格局。从生态韧性子系统对城镇化与生态韧性耦合协调的作用来看,规模韧性主要起反向阻滞作用;形态韧性的协调影响力主要为正向,且随时间推移不断增强;密度韧性的正向协调影响力持续下降,且在低于零值后负向增长。以新型城镇化引领区域协调发展,并通过严守三区三线、适应生态承载力、合理布局城市绿地等方法提高生态韧性,是未来珠三角实现城镇化与生态韧性协调可持续发展的主要路径。
Spatio-temporal analysis and simulation of urban ecological resilience: A case study of Hangzhou
城市生态韧性时空变化及情景模拟研究: 以杭州市为例
Dynamic evolution and obstacle factors of urban ecological resilience in Shandong Peninsula urban agglomeration
山东半岛城市群城市生态韧性的动态演化及障碍因子分析
Verify and study the coupling coordination development and the interactive stress between tourism and eco-environment in the Yellow River Basin
黄河流域旅游发展与生态环境耦合协调时空演变及交互胁迫关系验证
Coupling analysis and optimization measures of cultural resources endowment and tourism industry in Shandong
山东省文化资源与旅游产业协调发展评价与优化
Evolution and dynamic simulation of the temporal-spatial pattern of urban resilience in Harbin-Changchun urban group
DOI:10.13249/j.cnki.sgs.2020.12.006
[本文引用: 2]
The Harbin-Changchun Urban Group is an important growth pole leading the economic development of Northeast China. The improvement of urban resilience of the Harbin-Changchun Urban Group is of great significance to the promotion of the all-round revitalization of the Northeast region and the sustainable development of cities. This article takes 11 prefecture-level cities in the Harbin-Changchun Urban Group from 2010 to 2018 as examples, Constructing an urban resilience evaluation system based on the evaluation framework of “ecology-economy-society-engineering”. Using the entropy weight-TOPSIS evaluation model to comprehensively measure the urban resilience of the Harbin-Changchun Urban Group, And using ARCGIS spatial analysis tools, BP neural network model, etc. to explore its temporal and spatial pattern evolution and dynamic simulation research. The result showed that: ① The overall level of urban resilience in the Harbin-Changchun Urban Group is low. The higher and higher resilience is mainly distributed in the core area, which is distributed in “spots and scattered”. The low and lower resilience are mainly distributed in the peripheral areas, showing a spatial pattern of “widely distributed on the edge”. ② Judging from the characteristics of the types of evolution trends, from 2010 to 2018, more cities showed a divergent trend than a convergent trend, indicating that the spatial differences in urban resilience gradually increased during the evolution process. ③ Economic resilience, wage income, financial capital, public resource protection, education level, and transportation facilities are the main factors that affect the resilience of the “Harbin-Changchun” urban agglomeration. ④ In terms of dynamic simulation, from 2020 to 2030, the development of urban resilience will be slower, and the resilience level will gradually decrease, and the first-level and second-level resilience are the main ones. Cities with higher resilience levels account for a smaller proportion. In terms of future development trends, the temporal and spatial differences of urban resilience are obvious. The east-west direction shows a trend of “high in the east and low in the west”, with an “inverted U-shaped” distribution in the north-south direction, indicating that the high resilience points of individual core cities in the Harbin-Changchun Urban Group are prominent and Most marginal cities are characterized by low resilience.
哈长城市群城市韧性的时空格局演变及动态模拟研究
DOI:10.13249/j.cnki.sgs.2020.12.006
[本文引用: 2]
哈长城市群作为引领东北地区高质量发展的重要增长极,其城市韧性的提升对提高东北地区高质量发展的强韧性及可持续性具有重要意义。以2010—2018年哈长城市群11个地级市为例,基于“生态?经济?社会?工程”的评估框架构建城市韧性评价体系。采用熵权?TOPSIS评价模型对哈长城市群城市韧性进行综合测度,并运用ArcGIS空间分析工具、BP神经网络模型等方法探讨其时空格局演变规律及动态模拟。结果表明:① 哈长城市群城市韧性整体水平较低;较高、高度韧性主要分布在核心地区,呈“点状零散”分布,低度、较低韧性主要分布在外围地区,呈“边缘广泛分布”的空间格局。② 从其演化趋势类型特征看,2010—2018年,呈发散趋势的城市多于呈收敛趋势的城市,表明城市韧性在演化过程中空间差异呈逐渐增大趋势。③ 经济恢复力、工资收入、金融资本、公共资源保障、教育水平、交通设施水平等是影响哈长城市群城市韧性的主要因素。④ 在动态模拟方面,2020—2030年,城市韧性发展较缓慢,韧性等级逐渐降低,且以一级韧性和二级韧性为主,韧性等级较高的城市所占比重较少。在未来发展趋势上,城市韧性时空差异明显,东西方向上呈现“东高西低”态势,在南北方向上呈“倒U型”式分布,表明哈长城市群内部核心城市韧性高点突出,多数外围城市韧性偏低。
Progress and prospect of urban resilience research
DOI:10.18306/dlkxjz.2020.10.011
[本文引用: 3]
Under the background of global environmental change and urbanization, various risks and uncertainties have posed an important obstacle on urban security and urban sustainable development. As a potential new approach of urban risk management, urban resilience can improve the ability to resist, dissolve, and adapt when facing risks and uncertainties, and expound the adaptive scheme of risks in the process of rapid urbanization. Urban resilience has been a new topic in geography and related disciplines. Based on the origin and concept of urban resilience research, from the perspective of the impact of various factors (human, environmental, disaster) on urban resilience, this study constructed a theoretical framework of urban resilience, including evaluation and scenario simulation, and discussed the status of urban resilience research, pointing out that there are still many weak links in the theoretical framework, mechanism, practical application, and difference analysis of urban resilience research. Finally, the key directions of urban resilience research were also discussed. The theoretical framework should be used as a guide to promote multi-objective, multi-level, and multi-perspective systematic evaluation research. With the analysis of mechanism as support, studies should aim to achieve a new breakthrough in process simulation of urban resilience and decision making and early warning. Oriented by empirical research, studies should continue to strengthen the application model of multidisciplinary integration and exploration of urban resilience. Considering regional differences, further work should try to achieve a change in urban planning from the unified "one policy for multi-city" approach to the flexible "one policy for one city" approach.
城市韧性研究进展与展望
DOI:10.18306/dlkxjz.2020.10.011
[本文引用: 3]
在全球环境变化和快速城市化的背景下,各种不确定风险成为制约城市安全和可持续发展的重要障碍。城市韧性作为一种城市风险治理的新思路,如何提高城市抵御、消解、适应不确定风险的能力,建设有韧性能力的城市,正成为当前地理学及其相关学科领域亟待探索的新课题。论文在概述城市韧性的研究缘起与概念内涵的基础上,从多种要素(人文要素、环境要素、灾害扰动)对城市韧性的影响、城市韧性框架、城市韧性评价及模拟研究等方面出发,对可持续发展视角的城市韧性研究现状进行探讨,并指出当前城市韧性研究在理论框架、作用机理、实证研究、差异性分析等方面仍存在诸多薄弱环节。最后,对城市韧性重点研究方向进行展望,即应以理论框架为引领,推动多目标、多层次、多视角的系统评价研究;以机理解析为支撑,实现城市韧性的动态模拟与决策预警的新突破;以实证研究为导向,继续加强多学科融合和探索城市韧性的应用模式;遵循差异性规律,实现城市规划治理从统一的“多城一策”向灵活的“一城一策”转变。
Discussion on statistical monitoring and evaluation of common prosperity
共同富裕统计监测评价探讨
Towards an evolutionary perspective on regional resilience
DOI:10.1080/00343404.2014.959481 URL [本文引用: 2]
Spatio-temporal evolution characteristics of terrestrial ecological sensitivity in China
DOI:10.11821/dlxb202201011
[本文引用: 1]
Ecological sensitivity is one of the most important indicators used to evaluate regional ecological environment. Its research is significant to regional ecological governance and management. Therefore, six indicators including biodiversity, hydrothermal environment, soil salinization, land desertification, soil erosion and human disturbance from the perspectives of natural ecosystems, natural-social ecosystems, and social ecosystems and the entire-array-polygon indicator method were used to calculate terrestrial ecological sensitivity of China from 2000 to 2018. Besides, the spatio-temporal evolution characteristics were also analyzed with the grid coding method. The results showed that: (1) China's terrestrial ecological sensitivity was generally stable from 2000 to 2018, between 0.33-0.34. However, it declined from 0.342 in 2000 to 0.333 in 2018, which indicates that China's terrestrial ecological sensitivity is gradually improving. (2) There is significant spatial heterogeneity of ecological sensitivity in China, showing a spatial distribution pattern of "low in the east and high in the west, and low in the south and high in the north", and "high in urban areas and low in suburban areas". This is mainly due to the poor natural environment in the western and northern regions of China, poor ecological self-regulation ability, and being prone to be affected by external factors. (3) In terms of driving factors, China's terrestrial ecological sensitivity is greatly affected by soil (land) environmental factors. But at the same time, the influence of human disturbance factors is increasing year by year, which shows that China's terrestrial ecological environment management and protection work still has a long way to go.
中国陆地生态敏感性时空演变特征
DOI:10.11821/dlxb202201011
[本文引用: 1]
生态敏感性作为评价区域生态环境问题的重要指标之一,对区域的生态治理与管理工作具有重要意义。本文从自然生态系统、自然—社会复合生态系统、社会生态系统等视角选取生物多样性、水热环境、土壤盐渍化、土地荒漠化、土壤侵蚀和人类干扰6个指标,运用全排列多边形图示指标法对2000—2018年间中国陆地生态敏感性进行计算,并运用格网编码法对其时空演变特征进行分析。研究结果表明:① 2000—2018年间中国陆地生态敏感性总体稳定,生态敏感值稳定在0.33~0.34之间;但得益于21世纪以来中国实施了一系列生态环境治理与预防工作,敏感值在2000—2018年间持续下降,表明中国陆地生态敏感性状况正在逐渐好转。② 中国陆地生态敏感性空间异质性显著,呈现出“东低西高、南低北高”“城区高、郊区低”的空间分布格局。中国西部区域和北方区域自然环境恶劣,生态自我调节能力较差,易受外界因素的影响,而人类聚居区生态自我调节能力虽然较强,但由于人类活动强度较大,其敏感性反而较高。③ 中国陆地生态敏感性受土壤(地)环境因素影响较大,但人类干扰因素影响力也在逐年递增,这表明在经济快速发展的同时,中国的生态环境保护与治理工作仍然任重道远。
On the notion of regional economic resilience: Conceptualization and explanation
DOI:10.1093/jeg/lbu015 URL [本文引用: 1]
The coupling characteristics of the shipping network and trade between China and the countries along the 21st Century Maritime Silk Road
DOI:10.11821/dlxb202206016
[本文引用: 2]
As the material carrier of international trade, the shipping network that has been formed between China and the countries along the Belt and Road is an important support for the prosperity and development of the Maritime Silk Road. In this paper, a complex network model was used to characterize the port shipping network between China and the countries along the Maritime Silk Road in 2008 and 2018. Then, the coupling characteristics of the network and trade of various countries were analyzed by constructing an index system to reveal the shipping network's ability to support trade. Finally, spatial heterogeneity of influencing factors was analyzed by using geographically and temporally weighted regression model. The results show that: (1) on the whole, the port shipping network in 2008 and 2018 had obvious complex network characteristics. Network density increased by 111%, while its overall operating efficiency decreased by 8.73%. (2) The coordination degree between the shipping network and trade increased by 5%. It is also noted that most well-performed countries were distributed in East Asia and Southeast Asia. By 2018, about 36% of the shipping network of countries along the Maritime Silk Road lagged behind the level of trade, resulting in a significant shortage of shipping support. About 28% of the shipping elements of countries along the route were oversupplied. Most of the remaining countries evolved from low-level coordination to intermediate coordination. From a regional perspective, the coordination of these countries had obvious space club convergence. (3) There were obvious regional differences in the factors influencing the coupling relationship. In general, the scale of trade, the efficiency of port shipping and the economic benefit of foreign trade are the most important factors that promote the synergy effect of the shipping networks and trade, while the coverage of liner routes, port transit capacity and trade barriers are not so influential.
中国与“21世纪海上丝绸之路”沿线国家航运网络及经贸联系的耦合特征
DOI:10.11821/dlxb202206016
[本文引用: 2]
航运网络是国际经贸联系的物质载体,中国与沿线国已形成的海上航运网络是“21世纪海上丝绸之路”繁荣发展的重要支撑。本文截取2008年、2018年两个时间断面,首先运用复杂网络模型刻画中国与“海上丝路”沿线国的港口航运网络结构,进而通过构建指标体系分析该网络与各国经贸联系耦合特征,揭示航运网络对沿线贸易的支撑能力,最后结合时空地理加权回归模型分析其影响因素的空间异质性。结果表明:① 整体看,两个年份的港口航运网络均具有明显的复杂网络特征,网络稠密程度提升了111%,但网络整体运行效率下降了8.73%。② 港口航运网络与经贸联系的协调性上升了5%,明显上升的国家主要分布在东亚和东南亚。至2018年,约36%的沿线国与中国航运联系网络滞后于经贸联系水平,航运网络支撑能力明显不足;约28%的沿线国航运要素供给相对过剩;其余国家中多数已由低级协同优化为中级协同。从国际区域层面看,二者的协调性具有明显的空间俱乐部趋同现象。③ 耦合关系的影响因素存在明显的区域差异,但总体上,贸易规模、港口航运效率、外贸经济效益是促进航贸联系协同效应最主要因素,而航线覆盖面、港口中转能力、贸易壁垒影响较弱。
Research on system complexity of the digital society
数字化社会的系统复杂性研究
Research on evolution mechanism of China's big data industry based on Haken Model
基于哈肯模型的我国大数据产业演化机制研究
DOI:10.3969/j.issn.1004-910X.2020.03.015
[本文引用: 1]
大数据产业系统的演化机制研究是探究大数据产业发展规律的有效途径和重要工作。本文以我国17家大数据相关上市企业作为分析样本,采用自组织理论的哈肯模型,选取研发投入、劳动生产率、资本投入3个状态变量进行分析,建立大数据产业系统的演化方程。分析结果表明,大数据产业是一个远离平衡态的产业系统,其具有开放性、自我适应性、非线性作用以及涌现性等自组织演化特征;劳动生产率是我国大数据产业演化的序参量,支配着资本投入的行为;产业系统内部已建立劳动生产率不断增长的正反馈机制和资本投入递减的负反馈机制。有效揭示大数据产业的演化机制,为分析和预判我国大数据产业的发展变化规律并实现其快速发展提供理论参考。
Social-ecological resilience and community-based tourism in the commonwealth of Dominica
DOI:10.1080/14616688.2021.1878267 URL [本文引用: 1]
The evolution model of the tourism-ecology symbiosis and the determination of ecological security: A case study of Huangshan district, Anhui province, A key ecological functional zone of China
旅游与生态共生演进模式与生态安全判定: 以国家重点生态功能区安徽省黄山区为例
Synergistic evolution mechanism and the synergistic differences of financial ecosystem in provinces of “ the Belt and Road” area in China: The empirica analysis based on Haken Model
“一带一路”沿线省域金融生态系统协同演化机制与水平差异: 基于哈肯模型的实证分析
DOI:10.3969/j.issn.1004-910X.2021.12.007
[本文引用: 1]
为探究“一带一路”沿线省域金融生态系统协同演化机制,本文在引入协同学理论对系统协同演化机理进行分析的基础上,构建哈肯模型,利用2008~2019年“一带一路”沿线省域的基础数据,从子系统和次子系统层面进行实证,进一步探析沿线省域金融生态系统协同水平差异。结果表明:在子系统层面,金融生态环境是系统动态演化的序参量,金融生态环境的改善对金融主体发展具有协同增效应。在次子系统层面,金融主体子系统动态演化的序参量是银行业;金融生态环境子系统动态演化的序参量是对外开放程度、人文环境和诚信文化,并且对外开放程度与人文环境、诚信文化存在竞争关系,人文环境和诚信文化呈协作关系,3个序参量通过合作与竞争共同主宰金融生态环境的有序演化。在此期间,沿线省域金融生态系统协同水平差异较小且呈缩小态势,同时具有阶段性特征。
The driving forces of regional economic synergistic development in China: Empirical study by stages based on Haken model
DOI:10.11821/dlyj201409002
[本文引用: 1]
In recent years, regional economic pattern in China is transforming from single growth pole to multi growth poles, which means that regional economic synergistic development in China has reached a new level and related research on synergistic development has raised wide attention. Meanwhile, as the basic theory of regional economic synergistic development, synergetics is credible in explaining economic problems and Haken model, an important model of synergetics, is of interdisciplinary innovation and great applicability. Thus. Haken model is used to discuss the driving forces of regional economic synergistic development in China, aiming at finding the order parameter of systematic evolution. <br/>Firstly, this paper briefly introduces the connotation and characteristics of regional economic synergistic development and explains the driving factors from three aspects: regional comparative advantage (RCA), regional economic relation (RER), and regional industrial division (RID). Secondly, Haken model is used to find the order parameter from the three above-mentioned driving forces of regional economic synergistic development in China based on the panel data of 29 provinces in the last two decades (1992-2001 & 2002-2011). Model results show: the order parameter of regional economic synergistic development in China has changed from RCA in the first stage to RCA&RID in the second stage, reflecting better regional economic synergistic development; moreover, several characteristics are shown in the last decade (2002-2011) according to the comparison of the observed two decades: regional economic relation has been intensified and market segmentation has improved, indicating superior environment of regional economic synergistic development; regional economic synergistic development level in China has risen from primary level to intermediate level; the advantage of backwardness in central and western regions of China has been intensified gradually, also, the gradient difference of the three regions has been reduced.
中国区域经济协同发展的驱动因素: 基于哈肯模型的分阶段实证研究
DOI:10.11821/dlyj201409002
[本文引用: 1]
运用哈肯模型对影响中国区域经济协同发展的驱动因素进行实证研究,以发现控制区域经济系统演化的序参量。分析了区域经济协同发展的内涵及基本特征,从区域比较优势(RCA)、区域经济联系(RER)和区域产业分工(RID)三个方面解析了区域经济协同发展的驱动因素;运用协同学中的哈肯模型对1992-2001年、2002-2011年20年间中国29省市经济协同发展驱动因素进行分阶段序参量识别,结果表明:中国区域经济协同发展的序参量由1992-2001年的RCA转变为2002-2011年的RCA和RID,表明中国进入协同发展新阶段;后10年(2002-2011年)与前10年(1992-2001年)相比,呈现出以下特征:市场分割程度降低,协同发展环境得到优化;区域经济协同发展从初级阶段跃升至中级阶段;中西部地区后发优势逐步显现,三大地区梯级差异缩小。
Green development effect of tourism economy and its formation mechanism: Evidence from 92 tourism-dependent cities in China
旅游经济的绿色发展效应及其形成机制: 中国92个旅游依赖型城市的实证
Spatio-temporal characteristics of coupling coordination development between urbanization and eco-environment in Shandong Peninsula urban agglomeration
山东半岛城市群城镇化与生态环境耦合协调发展的时空格局
Spatial-temporal pattern and influencing factors of industrial ecology in Shandong province: Based on panel data of 17 cities
DOI:10.11821/dlyj020180474
[本文引用: 1]
This paper comprehensively constructs the performance evaluation index system of industrial ecology, and analyzes the industrial ecological level and its influencing factors of 17 cities in Shandong province by using a variety of measurement methods. The results show that: 1) The development of industrial ecology depends on the scale expansion and total growth of industrialization, and neglects the optimization and promotion of industrial structure and the lateral transfer feedback effect of economic factors, which will inevitably lead to the low efficiency of the resource allocation in the industrial environment system; 2) The level of industrial ecology is increasing, reflecting the development of industrial system and ecological environment system from antagonism to coordinated development, but its low growth rate shows that the process of light and clear industry is slow, and the way of improving the ecological quality of the regional industry is long and arduous; 3) Through the analysis of Global Moran’s I index, it is found that there is a relatively obvious spatial dependence of the industrial ecological level of various cities in Shandong province from 2005 to 2016. Among them, the industrial ecological level of Shandong is close to the spatial agglomeration from 2005 to 2008. And the regional spatial difference within this province with similar industrial ecological level is significant from 2009 to 2016, forming a spatial structure of the cross distribution between the high-value area and the low-value area of industrial ecology. Through the analysis of industrial ecological hotspots, it is found that the level of industrial ecology shows a strong tendency of spatial agglomerations, and the spatial patterns have significant difference that the eastern coastal belt are is always the hot spots while the western region, especially in southwestern parts, is always the cold spots; 4) Compared with the traditional OLS regression, the spatial econometric regression model has a better spatial correction effect. It is an inevitable choice to use the spatial econometric model to analyze the intensity of the industrial ecological factors. Through the spatial econometric regression model, it is found that the level of industrial ecology has obvious spatial autocorrelation, and the influencing factors of economic development level, industrial structure and foreign investment have obvious negative spillover effect, while those of government regulation and environmental regulation intensity have obvious positive spillover effects.
山东省产业生态化时空分异特征与影响因素: 基于17地市时空面板数据
DOI:10.11821/dlyj020180474
[本文引用: 1]
本文综合构建了产业生态化评价指标体系,并利用熵值法、耦合协调分析、探索性空间数据分析方法、空间计量等多种计量方法对2005—2016年山东省17地级市产业生态化水平时空分异特征与影响因素进行了综合研究,结果表明:① 产业生态化依赖于产业化物质消耗型规模增长,但不以结构优化为基础的产业化势必忽视经济要素的横向转移反馈作用与集群效应,导致资源配置的低效现象;② 产业生态化水平逐年递增反映出产业系统与生态环境系统由拮抗向良性共轭方向发展,但其增长率较低说明了产业轻型化与清型化进程滞缓,其质量提升之路漫长而艰巨;③ 产业生态化呈现东中西递减的空间梯度分异特征,东部沿海地区始终是热点区,西部地区尤其是鲁西南地区始终是冷点区;④ 产业生态化水平空间相关性较为显著,经济发展水平、产业结构、外商投资等因素负向溢出效应比较明显,而政府调控以及环境规制强度等因素正向溢出效应突出。
Evolution of economic efficiency and its influencing factors in the industrial structure changes in China
DOI:10.11821/dlxb201712005
[本文引用: 1]
The process of modern economic growth shows a close relationship between the industrial structure changes and the evolution of economic efficiency, which is specifically reflected in the stages and heterogeneity of regional development. This paper employs the DEA-BCC model and the Malmquist productivity index to analyze the static efficiency and the TFP changes of three industries at sectional and regional levels. Then, based on the DEA-Tobit two-stage analyzing framework, this paper establishes a panel data model to analyze the factors affecting the economic efficiency of three industries. The results show that, three industries are equipped with certain static scale efficiencies, but they still need to be optimized. The TFP of three industries have all improved from 1978 to 2014, but their contributions to the economic growth of three industries show a decreasing sequence, featured by apparent extension. The technical progress has significantly propelled the TFP growth, and the technical efficiency improvements have gradually shifted from pure technical efficiency to scale efficiency. The TFP changes can be divided into four stages. The dividends of institution, structure, factors and policies have all contributed to the TFP growth, while during the industrial structure adjustment stage, the institutional and structural dividends give way to the technical progress. Three industrial TFP changes present obvious regional differences. In general, Eastern China has comparative advantages, while Central China becomes the "concave area", and the TFP changes of the secondary and tertiary industries in Northeast China reflect serious issues of the structural transformation and upgrading. Due to the differences of the internal development laws of different industries, the factors influencing the economic efficiency show the relatively regional consistency and the sectional differences. The primary and tertiary industries changing effect, the non-agricultural level, the opening degree and the human resource endowment have significant positive effects on the economic efficiency of the primary, and the opening degree largely promotes the economic efficiency of the secondary industry, while the opening degree, the human resources endowment have significant negative impacts on the economic efficiency of the tertiary industry. Finally, this paper concludes with suggestions to the future policy-making.
中国产业结构变迁中的经济效率演进及影响因素
DOI:10.11821/dlxb201712005
[本文引用: 1]
现代经济增长过程表明,产业结构变迁与经济效率演进关系密不可分,具体反映在区域发展的阶段性与异质性上。运用DEA-BCC模型、Malmquist生产率指数分析中国三次产业静态综合效率与动态全要素生产率(TFP)的部门与区域变动情况,并基于DEA-Tobit两阶段分析框架构建面板计量模型,探究中国不同地区三次产业经济效率变动影响因素。研究表明:中国三次产业具备一定的静态规模效率,但仍有待优化;1978-2014年间,中国三次产业TFP均有提升,但一、二、三产业TFP增长对其部门经济贡献率依次递减,经济增长粗放型特征仍很明显;TFP增长主要源于技术进步,技术效率改进开始由以纯技术效率为主转向以规模效率为主;将三次产业TFP变动划分为四个阶段,制度、结构、要素、政策等红利对经济增长均有贡献,但在结构调整阶段,制度与结构红利让位于技术进步;三次产业TFP变动表现出显著的区域差异特征,总体上东部地区具有相对优势,中部地区表现为经济效率“凹地”,东北地区二、三产业TFP变动反映出严峻的结构转型升级问题。由于不同产业内在发展规律差异,其经济效率影响因素表现出区内相对一致性及部门差异性特征,其中一、三产业结构变动、非农化水平、对外开放程度、人力资源禀赋等对第一产业经济效率产生显著正向作用,对外开放程度显著促进第二产业经济效率提升,而对外开放程度、人力资源禀赋对第三产业经济效率产生显著的负面影响。最后讨论了结论的主要政策启示。
