

1 引言
柴达木盆地位于青藏高原东北部,处于西风区和东亚季风区的过渡地带,是对全球气候变化响应最敏感的地区之一[3]。柴达木盆地四周高山环绕,在盆地东部海拔3500 m到4200 m左右的中山地带的阳坡和半阴坡分布着祁连圆柏(Juniperus przewalskii Kom.)的天然林[4]。由于气候寒冷干旱,树木生长缓慢,且不易倒伏和腐烂,千年以上的古树得以存活至今。不同学者在此开展了大量的树轮气候学研究,国内超过2000 a的树轮序列均分布在该区。2003年张齐兵等[5]在都兰县建立了超过2300 a的树轮宽度序列,随后Sheppard等[6]重建了该区2500 a的年降水变化。2009年Liu等[7]利用乌兰和都兰地区采集的活树和古墓中树芯重建了区域过去2485 a温度变化过程。2010年邵雪梅等[8]在偏西偏北的德令哈地区建立当时国内最长的树轮宽度年表,达到了3585 a,并在2016年重建了区域干湿变化[9]。2019年王红丽等在更为干旱的诺木洪地区重建过去2900 a的降水变化[10]。在大空间尺度上,杨保等[11]在2014年利用多个样点的树轮宽度重建了青藏高原东北部过去3500 a的年降水量变化。随后,杨保等[12]利用氧同位素重建了该区过去6700 a降水量变化,是目前亚洲最长的树轮序列。但是这些样点均分布在柴达木盆地周边的山上(图1),而在更为干旱的柴达木盆地内部还没有相关气候序列。受海拔、地形、环流、云团等因素的影响,降水空间差异比较大,并且当前气候模型在区域降雨未来变化趋势和幅度上还存在重大分歧[13]。因此需要弥补降水变化研究空间不足,为气候模拟提供基础数据,以便更好的服务于社会经济发展。
图1
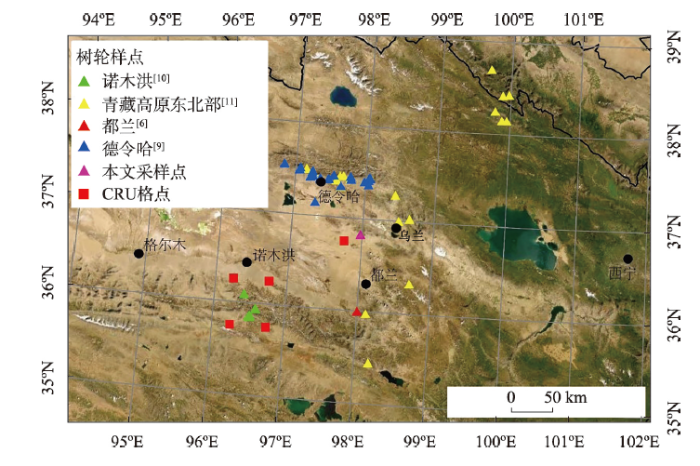
图1
采样点、CRU格点数据及其他重建对比序列位置
Fig. 1
Location of sampling sites, CRU grided data and other reconstructions
太阳是地球气候系统变化的能量来源,太阳辐射变化对地球气候能产生直接或者间接的影响[14],主要通过改变地表能量,影响大气环流,从而引起地表气候变化[15]。如太阳活动对印度季风降水[16]、北京地区降水[17]等有着重要影响。但太阳活动与降水关系较复杂,并且存在区域差异,其影响还受局地地形和气候的限制[18]。另外,强火山喷发也是影响气候变化的自然驱动因素之一,主要通过火山喷发形成的气溶胶减少到达地表太阳辐射,从而在年际尺度上引起地表降温[19],如1815 AD强火山喷发导致全球很多地区1816 AD无夏[20]。同时,火山气溶胶通过引起短波辐射变化导致降水变化[21]。已有研究表明,强火山喷发导致区域降水减少,或者发生极端干旱[22⇓-24],但在中国青藏高原地区相关研究还较少。
因此,本文拟利用更为干旱的柴达木盆地内部牦牛山西侧样点的树轮样芯重建过去超过2400 a的降水变化,增加空间点分布,为气候模拟提供验证数据;并分析该区降水量变化与太阳活动和强火山喷发的可能联系,为研究火山喷发对区域降水影响提供案例。
2 数据来源与研究方法
2.1 树轮数据
表1 树轮样芯采集样点信息
Tab. 1
| 样点编号 | 纬度(°N) | 经度(°E) | 海拔(m) | 坡度(°) | 坡向 | 树(棵)/芯(个) | 采样时间 |
|---|---|---|---|---|---|---|---|
| WL6a | 36.83 | 97.979 | 3588~3749 | 20 | 南 | 55/111 | 2017年7月 |
| WL6b | 36.87 | 97.939 | 3800~3950 | 40 | 南坡 | 33/71 | 2018年6月 |
| WL7 | 36.87 | 97.939 | 3780~3840 | 45 | 东、东南 | 64/135 | |
| WL8 | 36.89 | 97.93 | 3830~4020 | 35 | 南、东南 | 75/156 | |
| WL9 | 36.879 | 97.94 | 3740~3860 | 45 | 南、东南 | 102/211 |
2.2 气象数据
由于距离采样点最近的乌兰气象站数据年限较短(开始于2001年),本文选择了英国East Anglia大学气候研究中心(Climatic Research Unit, CRU)研制的格点数据与树轮数据进行相关分析。选取距采样点最近的格点,经纬度为36.75°N、97.75°E。数据包括1956—2017年月降水量、月平均最高温度、月平均温度和月平均最低温度(
2.3 研究方法
2.3.1 树轮宽度年表建立
对于采集的树轮样芯,首先在实验室自然风干,打磨等预处理之后,在显微镜下进行交叉定年,并利用LINTAB6树轮宽度测量系统获取树轮宽度数据(精度0.01 mm)。然后用COFECHA软件检测定年和宽度数据的准确性[25]。“Signal Free”方法能保留更多的气候信号[26],本文利用“Signal Free”方法建立树轮宽度年表。首先对每一条序列利用负指数函数或者斜率为负的直线拟合生长趋势,并对树轮宽度数据进行幂指数转换,之后用树轮宽度序列减去生长趋势,获得每个样芯的宽度指数序列。再把所有的树轮宽度指数序列进行双权重加权平均,得到树轮宽度指数序列(WCS)。然后用每条样芯原始测量值除以WCS,得到每条序列与年龄相关的生长曲线,并对该生长曲线迭代计算,直到“Signal-free”去趋势线不再发生变化[26]。最后建立反应区域气候变化的年表。该标准化过程利用RcsigFree程序完成(
2.3.2 树木生长与气候关系校准方程建立及验证
为了研究树木生长和气候关系,本文计算了器测时期(1956—2017 AD)树轮宽度年表与气候要素之间的Pearson's相关系数。因为气候条件对树木生长的影响有滞后效应,所以在计算相关系数的时候,考虑了上一年6月至当年9月的气候要素。为了确定相关关系是否由序列低频变化导致的,本文还计算了树轮年表和气候要素数据一阶差之间的相关系数,分析两者在高频上的相关关系。此外,本文还考虑了不同月份组合气候要素与树轮宽度年表之间的相关关系,来确定重建的月份。
图2
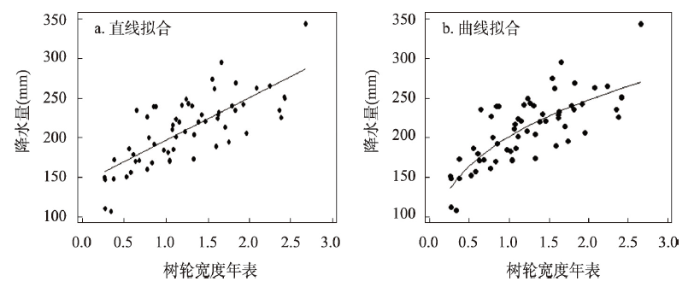
图2
上一年7月至当年6月降水量与年表散点图及拟合曲线
Fig. 2
Scatter plot and fitted curves of precipitation from previous July to current June and tree ring chronology
3 结果分析
3.1 树轮宽度年表统计特征
树轮宽度年表长度为2710 a(693 BC—2017 AD)(图3a)。“Signal-free”方法建立的树轮宽度公共区间序列的平均敏感度(MS)为0.504(表2),说明树轮宽度的年际变化比较大,对气候变化响应敏感。该数据与干旱区半干旱区相关研究类似[8,10]。平均一阶自相关系数为0.435,反映上一年的气候对树木生长有一定滞后影响。序列平均相关系数(Rbar),树内平均相关系数(Rbw),树间平均相关系数(Rbt)以及信噪比(SNR)均较高,说明该样点具有很好的代表性。总体样本信号强度(EPS)为0.982,一般认为其值大于0.85,就可以用来进行气候重建[27]。当5个树芯时,树轮宽度标准年表EPS值大于0.85。但为了树轮宽度年表更可靠,将392 BC作为重建起始年,此时为5棵树8个样芯,重建年表长度为2409 a(392 BC—2017 AD)。
图3
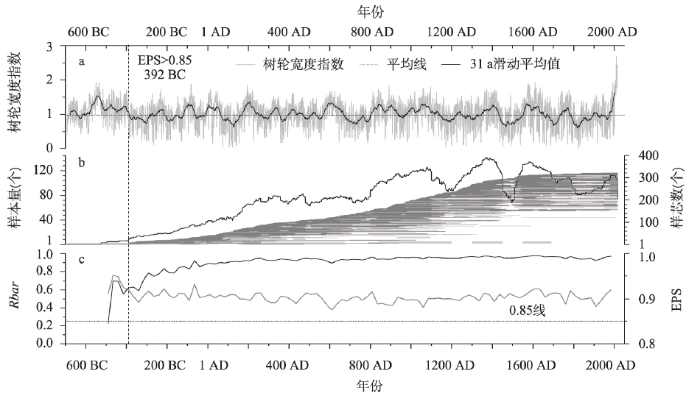
图3
树轮宽度年表图(a)、样本量和样芯数(b)及样本间平均相关系数(Rbar)和EPS曲线(c)
注:垂直虚线为EPS等于0.85对应的起始年。
Fig. 3
Tree ring width chronology (a), sample depth and number of cores (b), and Rbar and EPS (c)
表2 树轮标准年表公共区间分析的统计结果
Tab. 2
| 统计项 | 公共区间 | MS | AC1 | Rbar | Rbw | Rbt | EPS | SNR | PC1 |
|---|---|---|---|---|---|---|---|---|---|
| 统计值 | 1601—1900 AD | 0.504 | 0.435 | 0.507 | 0.909 | 0.5 | 0.982 | 55.425 | 53.8% |
注:MS为平均敏感度;AC1为一阶自相关系数;Rbar为所有序列平均相关系数;Rbw为树内平均相关系数;Rbt为树间平均相关系数;EPS为总体样本信号强度;SNR为信噪比;PC1为第一主成分方差解释量。
3.2 树木生长与气候要素关系
图4是树轮宽度年表与上一年6月至当年9月气候数据相关分析结果。从二者原始数据分析结果看,除了上一年11月,其他月份降水与树轮宽度年表均为正相关,但在0.05显著水平上,只有上一年7月和9月以及当年5—7月显著相关。温度与树轮宽度年表除了上一年7—9月和当年5—6月最高平均温度弱负相关外,其余均正相关,并且月平均最低温度与年表相关系数高于平均温度和平均最高温度(图4a)。在0.05显著水平上,月平均最低温度与年表除了当年9月外均显著相关,月平均温度与年表在上一年6月、11月和12月以及当年2—3月达到了显著水平,而月最高温度均没有达到显著水平。从一阶差数据分析结果来看,降水与树轮宽度年表在上一年8—9月以及当年5—6月显著正相关,上一年6月和11月显著负相关(p = 0.05),而上一年9月平均最低温和上一年6月平均最高温显著正相关,当年6月平均温度和平均最高温以及当年9月平均最低温显著负相关(p = 0.05)(图4b)。同样,本文还计算了不同月份组合气候数据与树轮宽度年表的相关系数,结果发现上一年7月至当年6月的降水与年表的相关最高,相关系数为0.753,一阶差后相关系数为0.712;而虽然上一年7月至当年6月平均最低温度及平均温度与年表的相关系数分别为0.63和0.488,达到了显著水平,但一阶差后相关系数仅为0.156和-0.072。该结果表明上一年7月至当年6月的降水量是该区域树木生长的主要限制因子。
图4
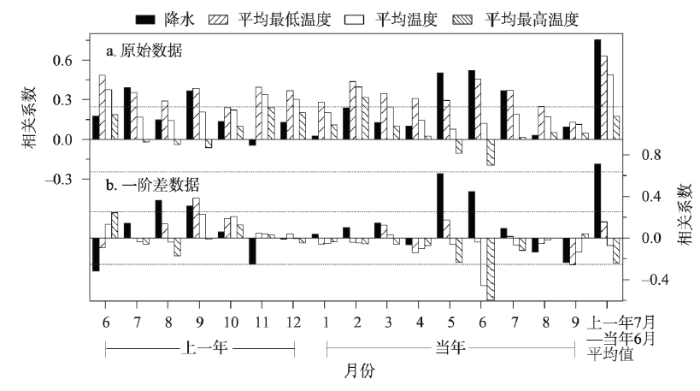
图4
1956—2017 AD树轮宽度年表与气象数据相关系数结果
Fig. 4
Correlation coefficients between the tree ring chronology and meteorological data during 1956-2017 AD
3.3 过去2400 a区域降水量变化
基于树轮宽度年表(SSFSTB)与气候数据相关关系分析结果,重建了392 BC—2017 AD上一年7月至当年6月的降水量(PREp76)变化,其转换方程为:
在器测时期(1957—2017 AD),该模型的方差解释量为64%,调整后的方差解释量为63.4%。器测时期的重建序列与器测数据在原始序列和一阶差序列上都有很好的一致性,并且一阶差序列的一致性更好(图5a、5b)。此外,利用留一法和分段检验方法对该模型进行了检验(表3)。留一法检验结果显示F值、符号检验(ST)、和乘积平均检验值(t)均达到了99%的置信水平,一阶差符号检验(ST1)也通过了95%的检验水平,误差缩减值(RE)为0.61,器测数据与重建数据相关系数为0.78。分段检验结果显示F值、ST、ST1和t值均通过了99%的检验水平。RE值分别为0.76和0.74,有效系数(CE)分别为0.56和0.55,均大于零,检验时段器测数据与重建数据的相关系数分别为0.77和0.75。该结果表明,重建降水量与器测值有较好的一致性,该重建方程是可靠的。为了进一步验证其空间代表性,本文计算了器测值及重建值与CRU格点(CRU TS 4.05,计算时间2022年10月9日)原始和一阶差后数据的空间相关系数(
图5
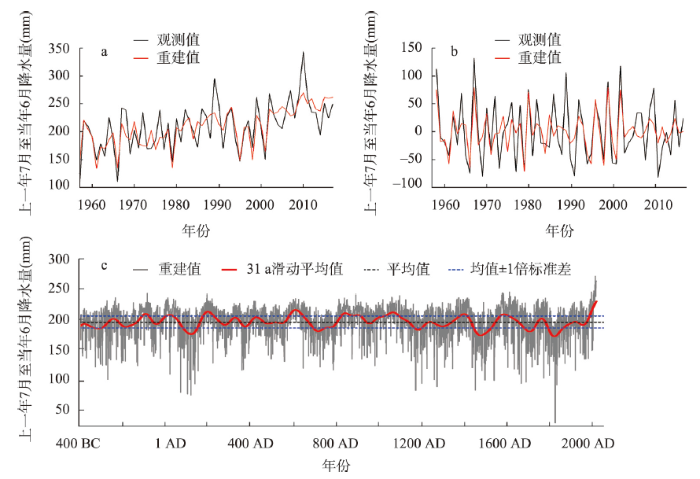
图5
1956—2017 AD观测值与重建值曲线对比(a)、一阶差曲线对比(b)及重建降水量与31 a滑动平均(FFT滤波)(c)
Fig. 5
Graph of original (a) and first difference (b) data between observed and reconstructed precipitation for the calibration period 1956-2017, and reconstructed precipitation and 31 a smoothing (FFT filter) (c)
表3 不同重建阶段校准和验证结果统计
Tab. 3
| 校准 | 验证 | |||||||||||
|---|---|---|---|---|---|---|---|---|---|---|---|---|
| 时段 | R2 | R2adj | F | SE | 时段 | ST | ST1 | t | RE | CE | r | |
| 1957—2017 | 0.640 | 0.634 | 104.96** | 0.06 | 1957—2017 | 49+** | 40+* | 4.12** | 0.61 | - | 0.78 | |
| 1957—1987 | 0.575 | 0.555 | 38.49** | 0.06 | 1988—2017 | 28+** | 22+** | 5.73** | 0.76 | 0.56 | 0.77 | |
| 1987—2017 | 0.590 | 0.576 | 41.75** | 0.05 | 1957—1986 | 24+** | 22+** | 3.12** | 0.74 | 0.55 | 0.75 | |
注:*为95%置信水平,**为99%置信水平。
图6
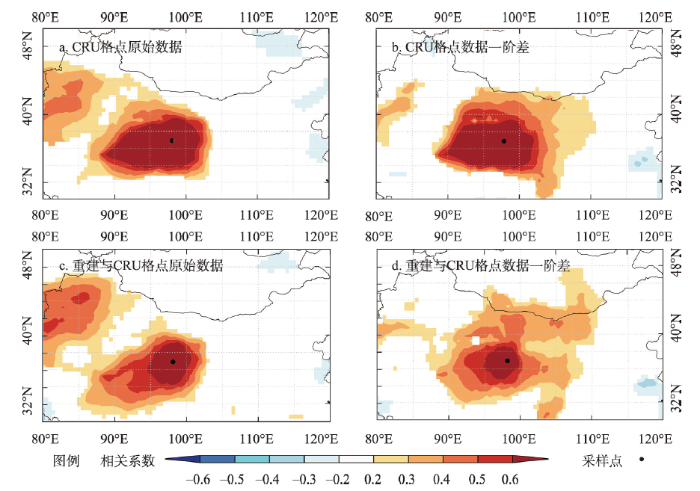
图6
重建序列空间相关分析
注:基于自然资源部标准地图服务网站GS(2019)1822号标准地图制作,底图边界无修改。
Fig. 6
Results of spatial correlation analysis
根据重建的区域年降水量变化看(图5c),该区域降水具有年际、年代际变化特征。在年际尺度上,1824 AD(29.87 mm)、121 AD(75.74 mm)、106 AD(77.35 mm)、73 AD(79.88 mm)、1172 AD(83.59 mm)、1451 AD(84.02 mm)、1271 AD(89.67 mm)、1831 AD(91.86 mm)、141 AD(93.94 mm)和1200 AD(94.61 mm)是10个最干旱的年份。由于采样点降水量是树木生长的限制因子,树轮宽度年表对干旱年反应的更好(图5a),所以在此不列湿润年。在年代际尺度上,将31 a滑动平均线大于均值(195.52 mm)一倍标准差(9.84 mm)降水量(205.36 mm)的年份作为湿润年,小于均值一倍标准差(185.68 mm)的年份判定为干旱年,剩余为正常降水年份。基于该标准,共有9个湿润期(106—75 BC、6—39 AD、179—229 AD、581—646 AD、823—914 AD、1026—1095 AD、1378—1414 AD、1567—1609 AD和1985—2017 AD)和7个干旱期(328—297 BC、86—151 AD、694—747 AD、1168—1199 AD、1444—1525 AD、1680—1725 AD和1792—1860 AD),其中823—914 AD湿润期持续时间最长,达92 a,1985—2017 AD是过去2400 a最湿润时期;1444—1525 AD干旱期持续时间最长,达82 a,1792—1860 AD是过去2400 a最干旱时期。
对重建结果进行了多窗谱周期分析(MTM),结果表明(图7),过去2400 a柴达木盆地东北部地区降水量存在2~8 a、40 a、80 a和225 a准周期变化(p < 0.01)。
图7
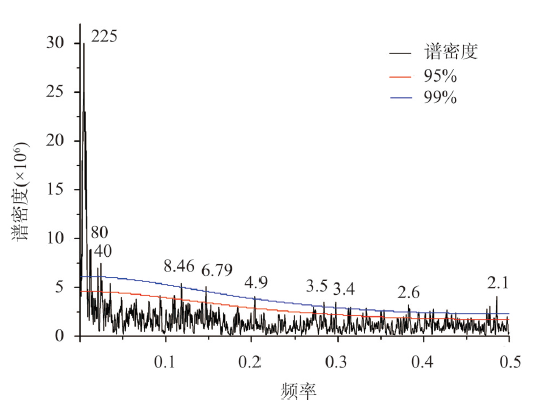
图7
多窗谱周期分析结果
注:图中数据为分析周期(a)。
Fig. 7
Power spectral analysis of the reconstructed precipitation using multiple taper methods
4 讨论
4.1 树轮年表质量控制
本文利用“Signal-free”方法建立年表,所用序列平均长度342.8 a,主要是由于一些树轮样芯有些时段轮宽太窄,以至于分辨不出年轮,只能将一根树轮样芯分成多个序列造成的。为了检查样芯分段是否会对年表序列产生影响,本文挑选了134个长于500 a的序列(序列平均长度为674.4 a),用同样的方法建立区域树轮宽度年表,并与利用全部序列建立的宽度年表进行比较。结果表明当树轮样芯数量达到30时(250—2017 AD),两个年表的相关系数为0.9;1000—2017 AD,两个年表相关系数为0.96。说明对树轮样芯进行分段后,两个年表差异不明显。
4.2 树木生长与气候要素关系
监测研究结果显示青藏高原东北部祁连圆柏形成层在5月中下旬开始活动,6月和7月是树木径向生长的主要时期[28⇓-30]。生长季前期和生长季早期的降水是影响树木生长的主要限制因子[28,31],并且5月降水对祁连圆柏的径向生长影响显著[29,32]。此外,5—6月份极端少降水年(1995 AD、1957 AD、1966 AD、2001 AD、1998 AD和1961 AD)分别对应年表中第5、4、2、7、6和1低值年。这也说明了当年5—6月降水量是树木生长的主要限制因子。而上一年7月至当年6月的降水量与树轮宽度年表相关达到最高,与中国及世界上其他干旱半干旱区研究结果相同[4,10,11,33⇓⇓⇓⇓⇓⇓ -40]。Fritts[41]研究认为在干旱半干旱区,上一年秋季、冬季及当年春季降水对树木生长有着重要的影响。7月份是树木生长的末期,但该月的降水经过下渗,仍能在土壤中保留一段时间,为树木下一个生长季的生长所需能量提供养份[42-43],同样8—9月的降水也为树木生长养份积累提供能量。上一年10月至当年4月,主要以降雪形式储存在地表,冬天具有保温作用,防止树木根部受到冻害,并为下一个生长季初期提供了水份。因此,上一年7月至当年6月降水量多,树木就会形成宽轮。
此外,上一年9月的温度与树轮宽度成正相关关系,说明上一年9月温度越高,树木能为下一年的生长积累更多能量。而当年6月平均最高温度与树轮宽度成负相关,说明生长季平均最高温度越高,地表水份蒸发越快,树木蒸腾作用越强,进一步增强了水份对树木生长的限制作用。
4.3 柴达木盆地东北部降水变化及与其他重建序列的对比
为了评估本文重建的过去2409 a柴达木盆地东北部降水量变化(WL)的可靠性,本文收集了邻近区域的4条利用树轮宽度重建的序列,包括柴达木盆地东南缘诺木洪地区过去2917 a年降水量序列(NMH)[10](图8b)、青藏高原东北部德令哈地区过去2847 a植物需水量序列(DLH)[9](图8c)、青海都兰县过去2431 a年降水量序列(DL)[44](图8d),以及青藏高原东北部过去3500 a年降水序列(NETP)[11](图8e),其方差解释量分别为47.9%、66.1%、61.1%和62.4%。本文重建的方差解释量为64%,略低于青藏高原东北部植物需水量重建,高于其他3个重建结果。本文重建的年降水序列与其他4条的相关系数分别为0.563、0.733、0.74和0.733(p < 0.001),该结果说明,5条重建序列在年际尺度上具有较好的一致性,但也存在差异。
图8
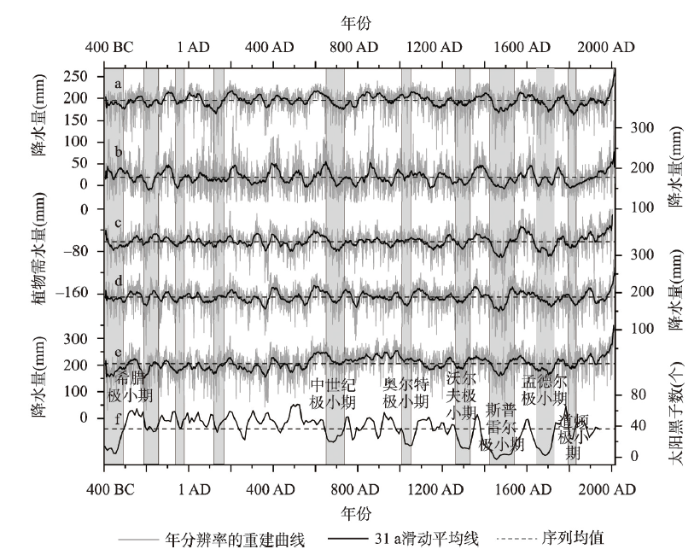
在本文研究区1824 AD最为干旱,这与NETP结果一致。历史文献记录揭示甘青宁地区1824 AD为特大旱灾年[45]。其他几个极端干旱年在周围区域重建序列中也都有体现。历史文献记载甘青宁地区1831 AD、1172 AD、1451 AD和1200 AD分别为大旱灾年、大旱灾年、局部旱灾年和个别地区旱灾年[45]。但在年际尺度上,5条序列变化也存在差异。2400 a不同序列反应的最干年份存在差异,WL和NETP为1824 AD,NMH为59 BC,DLH为1484 AD,而DL为202 BC。另外,一些干旱事件发生在不同年份,如NMH和DL发生在366 BC,而WL、DLH和NETP发生在367 BC;DLH、NMH和NETP在1796 AD发生干旱,而WL和DL发生在1797 AD。即使干旱事件发生在同一年,5条序列所揭示的干旱程度也各异。该结论表明虽然在青藏高原东北部重建了多条降水量变化曲线,但不同区域之间仍存在差异,反应了降水在区域上变率较大。这可能是由于影响该区域的环流系统强弱变化导致降水的区域差异[46]。
在年代际(30 a)尺度上,本文反映的7个干旱期在其他4条序列中也均有体现,尤其是1444—1525 AD、1680—1725 AD和1792—1860 AD这3个时期,5条降水变化序列一致性较好。历史文献记载[45]:1435—1455 AD西北地区连年大旱;1459—1474 AD,西北地区间断发生7次大面积旱灾,其间又有局部旱灾;1481—1490 AD,西北地区连续10年大旱,1484 AD和1485 AD最为严重;1493—1501 AD除1499年灾情不明外,其余均为大范围旱灾;1505—1522 AD西北旱灾不断,发生8次大旱;1800—1814 AD和1821—1847 AD西北地区分别发生大旱6次和13次,其间旱灾局部不断,主要发生在甘宁青地区,经常发生饿死人现象,甚至“骨肉相食”。此外,最近几十年来降水持续增加,近几年达到了降水最大期,这与气象数据显示结果一致[47-48]。但一些时段不同序列间在降水量峰值、降水量增加或者减少时间上存在不一致性,如300 BC和600 AD、1200 AD,与诺木洪降水存在差异;100 AD和300 AD年,与重建的青藏高原东北部植物需水量及青藏高原东北部降水量均存在差异;150 AD、400 AD、750 AD、900 AD和1900 AD,与都兰降水存在差异等。
为了更详细对比不同时间尺度上重建降水量与其他重建的异同,对所有的重建分别进行了5 a、11 a、40 a、100 a和200 a滑动平均并标准化,获得不同重建序列在不同时间尺度上的降水变化指数(图9)。在5 a尺度上,5条序列变化一致性较好,但在400—1000 AD和1800 AD后本文重建与其他重建在变幅上差异显著。在11 a尺度上,本文重建与诺木洪重建在300 BC、600 AD存在差异;与青藏高原东北部植物需水量序列在200 BC存在差异;与都兰和青藏高原东北部降水在500 AD、1000 AD左右存在不同。在40 a尺度上,与诺木洪降水在300 BC存在反相关变化;200 BC前后与青藏高原东北部植物需水量序列存在差异;与都兰和青藏高原东北部降水在900—1200 AD存在反相变化。在100 a尺度上,与诺木洪在300 BC、1 AD、300—500 AD变化不同,与青藏高原东北部植物需水量序列在200 BC和100 AD存在差异;与都兰和青藏高原东北部降水在1000 AD存在反相变化。在200 a尺度上,本文重建降水量与其他几条重建也存在一定差异,尤其是和青藏高原东北部降水变化。此外,不管在年代际尺度上还是世纪尺度上,本文重建降水量在变化幅度上均低于其他重建。
图9
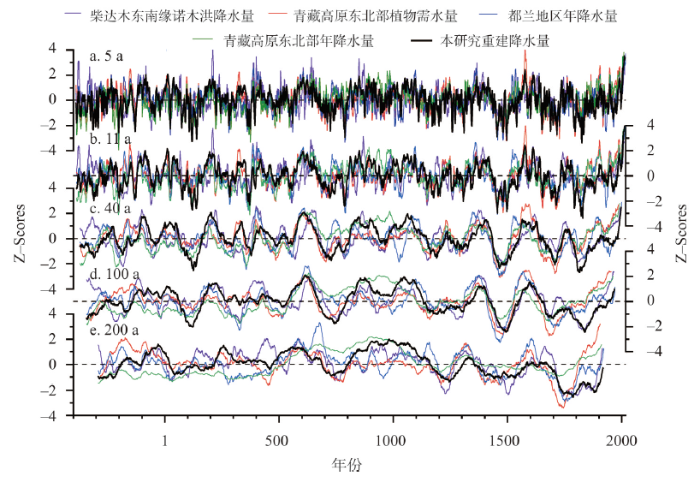
通过年际、年代际和世纪尺度上比对结果表明,不同区域的降水变化在不同时间尺度上虽然存在一致性变化,但在变化幅度上、变化时间上,以及极端干旱事件发生的年份上均存在差异,该差异可能是由于柴达木盆地所处位置导致的,它既受中高纬环流系统的影响,又受低纬环流影响,同时青藏高原大地形以及高原季风对盆地降水影响显著[46]。此外,采样点的空间位置、微生境差异、不同的去趋势方法、重建方法、重建的不确定性,以及重建空间尺度的大小都是导致不同降水序列变化差异的原因。该结果揭示了降水在区域上变率较大,也表明在柴达木盆地内部重建区域降水的必要性。
4.4 太阳活动对柴达木盆地东北部地区降水的影响
4.5 火山活动对柴达木盆地东北部地区降水的影响
火山活动是影响气候变化的主要因素之一[19]。为了探讨强火山喷发对本文研究区域降水的影响,本文选取了过去2400 a来的全球火山喷发指数(VEI)大于等于5级的强火山喷发记录,共计93次,其中VEI为7级的3次,喷发年份分别为942 AD、1257 AD和1815 AD;VEI为6级的火山喷发23次;VEI为5级的67次(
图10
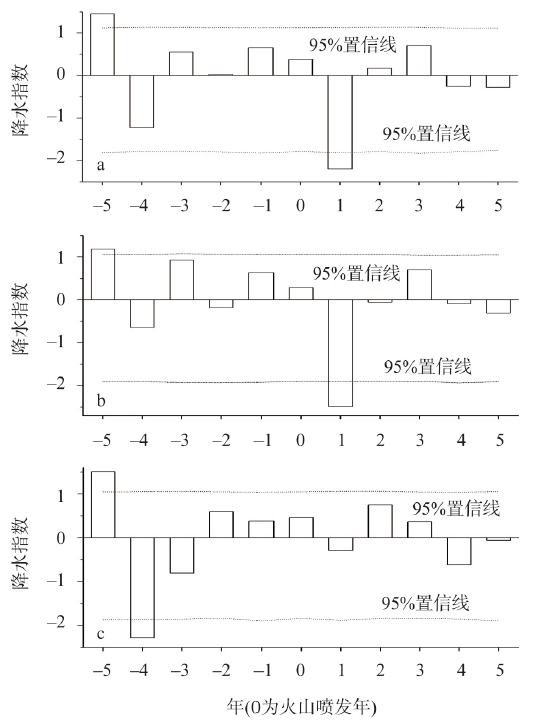
图10
不同区域VEI ≥ 5强火山喷发时序叠加分析
注:a为全球强火山;b为位于10°S~50°N的强火山;c为10°S~50°N区域外强火山。
Fig. 10
Superposed epoch analysis results of our reconstructed precipitation with VEI ≥ 5 large volcanic eruptions in different area
5 结论
基于在柴达木盆地东北部牦牛山西侧采集的329棵祁连圆柏的684根树轮样芯,建立了过去2710 a(693 BC—2017 AD)树轮宽度年表。对树轮宽度年表和1956—2017 AD CRU格点数据进行了相关分析,结果显示该宽度年表与上一年7月至当年6月降水量相关性最高。基于该相关关系,本文重建了该区过去2409年上一年7月至当年6月的降水量变化过程,器测时期(1957—2017 AD)的方差解释量达64%。该重建具有很好的空间代表性,其揭示了9个湿润期(106—75 BC、6—39 AD、179—229 AD、581—646 AD、823—914 AD、1026—1095 AD、1378—1414 AD、1567—1609 AD和1985—2017 AD)和7个干旱期(328—297 BC、86—151 AD、694—747 AD、1168—1199 AD、1444—1525 AD、1680—1725 AD和1792—1860 AD),其中823—914 AD湿润期持续时间最长,达92 a,1985—2017 AD是过去2400 a最湿润时期;1444—1525 AD干旱期持续时间最长,达82 a,1792—1860 AD是过去2400 a最干旱时期。多窗谱分析结果表明,本文研究区域降水量变化在过去2400 a存在2~8 a、40 a、80 a和225 a准周期变化。此外,过去2400 a的干旱期与太阳活动极小期对应一致,说明在年代尺度上太阳活动是研究区域降水量变化的影响因素之一。另外在中低纬度强火山喷发后的第一年该区域降水量减少显著,该结果反应了在年际尺度上强火山喷发是影响区域降水的重要因素之一。
参考文献
Past climates inform our future
Abrupt changes of precipitation in Delingha region, Qinghai for the last 1000 years
DOI:10.11821/xb200607005
[本文引用: 1]

Based on the tree ring width chronologies developed in Delingha region, Qinghai province, the annual precipitation variations for the last 1000 years has been reconstructed recently. In this study, we investigate the abrupt changes of precipitation for the last 1000 years. Smoothing t-test and smoothing F-test methods were used to search for possible abrupt changes in the mean value and the standard deviations of 30-year climatic average precipitation. Significant abrupt changes were found during the last 1000 years and we suggested that solar activity played an important role in influencing these changes. It is evident that the precipitation decreased significantly during the periods of the Wolf, Spoerer, Maunder and Dalton minima of solar activity, and the t-test verified the existence of statistically significant differences within these periods. The time and the direction of abrupt changes of precipitation coincided well with the abnormal variations of solar activity. The abrupt changes of precipitation in Delingha may link with the interdecadal changes of East Asian Summer Monsoon for the last century. The time of abrupt changes in Delingha was ahead the time of abrupt changes in eastern China, which may be an important indicator for long-term change forecast of precipitation.
青海德令哈地区千年来降水量的突变分析
Reconstruction of precipitation variation from tree rings in recent 1000 years in Delingha, Qinghai
A 2, 326-year tree-ring record of climate variability on the northeastern Qinghai-Tibetan Plateau
Annual precipitation since 515 BC reconstructed from living and fossil juniper growth of northeastern Qinghai Province, China
DOI:10.1007/s00382-004-0473-2 URL [本文引用: 1]
Annual temperatures during the last 2485 years in the mid-eastern Tibetan Plateau inferred from tree rings
Climatic implications of a 3585-year tree-ring width chronology from the northeastern Qinghai-Tibetan Plateau
DOI:10.1016/j.quascirev.2010.05.005 URL [本文引用: 2]
Reconstruction of biological drought conditions during the past 2847 years in an alpine environment of the northeastern Tibetan Plateau, China, and possible linkages to solar forcing
DOI:10.1016/j.gloplacha.2016.04.010 URL [本文引用: 4]
A 2917-year tree-ring-based reconstruction of precipitation for the Buerhanbuda Mts., Southeastern Qaidam Basin, China
DOI:10.1016/j.dendro.2019.04.002 URL [本文引用: 5]
A 3500-year tree-ring record of annual precipitation on the northeastern Tibetan Plateau
DOI:10.1073/pnas.1319238111
PMID:24516152
[本文引用: 4]
An annually resolved and absolutely dated ring-width chronology spanning 4,500 y has been constructed using subfossil, archaeological, and living-tree juniper samples from the northeastern Tibetan Plateau. The chronology represents changing mean annual precipitation and is most reliable after 1500 B.C. Reconstructed precipitation for this period displays a trend toward more moist conditions: the last 10-, 25-, and 50-y periods all appear to be the wettest in at least three and a half millennia. Notable historical dry periods occurred in the 4th century BCE and in the second half of the 15th century CE. The driest individual year reconstructed (since 1500 B.C.) is 1048 B.C., whereas the wettest is 2010. Precipitation variability in this region appears not to be associated with inferred changes in Asian monsoon intensity during recent millennia. The chronology displays a statistical association with the multidecadal and longer-term variability of reconstructed mean Northern Hemisphere temperatures over the last two millennia. This suggests that any further large-scale warming might be associated with even greater moisture supply in this region.
Long-term decrease in Asian monsoon rainfall and abrupt climate change events over the past 6700 years
Robustness and uncertainties in the new CMIP5 climate model projections
DOI:10.1038/nclimate1716 URL [本文引用: 1]
Solar influences on climate
Precipitation variation in Delingha, Qinghai and solar activity over the last 400 years
青海德令哈地区近400年来的降水量变化与太阳活动
Possible association between Indian monsoon rainfall and solar activity
The effect of solar activity on the annual precipitation in the Beijing area
DOI:10.1088/1009-9271/4/2/189 URL [本文引用: 1]
Impact of solar activity on precipitation in the United States
Volcanic eruptions and climate
DOI:10.1029/1998RG000054 URL [本文引用: 2]
The explosive volcanic eruption signal in northern hemisphere continental temperature records
DOI:10.1007/BF00139431 URL [本文引用: 1]
Constraints on future changes in climate and the hydrologic cycle
DOI:10.1038/nature01092 URL [本文引用: 1]
Strong link between large tropical volcanic eruptions and severe droughts prior to monsoon in the central Himalayas revealed by tree-ring records
DOI:10.1016/j.scib.2019.05.002 URL [本文引用: 2]
Tree-ring oxygen isotope recorded precipitation variations over the past two centuries in the northeast Chinese Loess Plateau
DOI:10.1002/joc.7562 URL [本文引用: 2]
Influence of volcanic eruptions on the climate of the Asian monsoon region
Computer-assisted quality control in tree-ring dating and measurement
A "signal-free" approach to dendroclimatic standardisation
DOI:10.1016/j.dendro.2007.12.001 URL [本文引用: 2]
On the average value of correlated time-series, with applications in dendroclimatology and hydrometeorology
DOI:10.1175/1520-0450(1984)023<0201:OTAVOC>2.0.CO;2 URL [本文引用: 1]
Is precipitation a trigger for the onset of xylogenesis in Juniperus przewalskii on the north-eastern Tibetan Plateau?
DOI:10.1093/aob/mcu259
PMID:25725006
[本文引用: 2]
A series of studies have shown that temperature triggers the onset of xylogenesis of trees after winter dormancy. However, little is known about whether and how moisture availability influences xylogenesis in spring in drought-prone areas.Xylogenesis was monitored in five mature Qilian junipers (Juniperus przewalskii) by microcore sampling from 2009 to 2011 in a semi-arid area of the north-eastern Tibetan Plateau. A simple physical model of xylem cell production was developed and its sensitivity was analysed. The relationship between climate and growth was then evaluated, using weekly wood production data and climatic data from the study site.Delayed onset of xylogenesis in 2010 corresponded to a negative standardized precipitation evapotranspiration index (SPEI) value and a continuous period without rainfall in early May. The main period of wood formation was in June and July, and drier conditions from May to July led to a smaller number of xylem cells. Dry conditions in July could cause early cessation of xylem differentiation. The final number of xylem cells was mainly determined by the average production rate rather than the duration of new cell production. Xylem growth showed a positive and significant response to precipitation, but not to temperature.Precipitation in late spring and summer can play a critical role in the onset of xylogenesis and xylem cell production. The delay in the initiation of xylogenesis under extremely dry conditions seems to be a stress-avoidance strategy against hydraulic failure. These findings could thus demonstrate an evolutionary adaptation of Qilian juniper to the extremely dry conditions of the north-eastern Tibetan Plateau.© The Author 2015. Published by Oxford University Press on behalf of the Annals of Botany Company. All rights reserved. For Permissions, please email: journals.permissions@oup.com.
Climatic forcing of xylem formation in Qilian juniper on the northeastern Tibetan Plateau
DOI:10.1007/s00468-015-1333-x URL [本文引用: 2]
Environmental drivers for cambial reactivation of Qilian Junipers (Juniperus przewalskii) in a semi-arid region of northwestern China
Growth rate rather than growing season length determines wood biomass in dry environments
DOI:10.1016/j.agrformet.2019.02.031 URL [本文引用: 1]
Drought limits wood production of Juniperus przewalskii even as growing seasons lengthens in a cold and arid environment
Tree-ring based reconstructions of precipitation for the southern Canadian Cordillera
DOI:10.1023/B:CLIM.0000037487.83308.02 URL [本文引用: 1]
Reconstructed precipitation on a centennial timescale from tree rings in the western Tien Shan Mountains, Central Asia
DOI:10.1016/j.quaint.2014.10.054 URL [本文引用: 1]
Precipitation reconstruction for the southern Altay Mountains (China) from tree rings of Siberian spruce, reveals recent wetting trend
DOI:10.1016/j.dendro.2014.06.003 URL [本文引用: 1]
Precipitation over the past four centuries in the Dieshan Mountains as inferred from tree rings: An introduction to an HHT-based method
DOI:10.1016/j.gloplacha.2013.04.010 URL [本文引用: 1]
Tree-ring-based reconstruction of precipitation in the Bighorn Basin, Wyoming, since 1260 AD
DOI:10.1175/1520-0442(2004)017<3855:TROPIT>2.0.CO;2 URL [本文引用: 1]
Precipitation reconstruction for the Khakassia region, Siberia, from tree rings
DOI:10.1177/0959683617729450 URL [本文引用: 1]
Annual precipitation variation inferred from tree rings since AD 1770 for the western Qilian Mts., northern Tibetan Plateau
DOI:10.3959/2008-2.1 URL [本文引用: 1]
Precipitation reconstruction from Hailar pine (Pinus sylvestris var. mongolica) tree rings in the Hailar region, Inner Mongolia, China back to 1865 AD
DOI:10.1016/j.palaeo.2009.08.012 URL [本文引用: 1]
Tree ring-based reconstruction of annual precipitation in the south-central United States from 1750 to 1980
DOI:10.1029/WR024i001p00163 URL [本文引用: 1]
Weekly diameter growth of shortleaf pine and white oak as related to soil moisture
Reconstruction dataset of annual precipitation from tree ring width of Sabina przewalskii at Dulan, Qinghai of China (411 BC-2020)
基于祁连圆柏树轮宽度重建的青海都兰年降水量数据集(411 BC—2020)
Analysis of precipitation and atmospheric circulation characteristics in Qaidam Basin during 1981-2017
柴达木盆地1981—2017年降水及大气环流特征分析
The truth and inter-annual oscillation causes for climate change in the Qinghai-Tibet Plateau
青藏高原气候变化的若干事实及其年际振荡的成因探讨
The impact of climatic warm-wet of the Tibetan Plateau on the water resources and environment in Qaidam Basin
青藏高原暖湿化对柴达木水资源与环境的影响
An 850-year tree-ring-based reconstruction of drought history in the western Qilian Mountains of northwestern China
DOI:10.1002/joc.4208 URL [本文引用: 1]
Precipitation variations of Longxi, northeast margin of Tibetan Plateau since AD 960 and their relationship with solar activity
DOI:10.5194/cp-4-19-2008 URL [本文引用: 1]
Linking Holocene East Asian monsoon variability to solar forcing and ENSO activity: Multi-proxy evidence from a peatland in Northeastern China
DOI:10.1177/0959683621994662 URL [本文引用: 1]
The origin of monsoons
DOI:10.1175/1520-0469(2001)058<3497:TOOM>2.0.CO;2 URL [本文引用: 1]
The global monsoon across time scales: Mechanisms and outstanding issues
DOI:10.1016/j.earscirev.2017.07.006 URL [本文引用: 1]
Regional differences in temperature response in China to the large volcanic eruptions since the 20th century
DOI:10.18306/dlkxjz.2016.03.007
[本文引用: 1]
Based on the chronology of 62 large volcanic eruption events (Volcanic Explosivity Index≥4) since 1901 and gridded CRU TS v.3.22 monthly dataset from the Climatic Research Unit at the University of East Anglia, we examined the effects of large volcanic eruptions by different eruptive latitude bands and seasons on regional difference of temperature in China, using superposed epoch analysis (SEA). The results show that temperature decreased in most regions in 1~2 years after large volcanic eruptions at all latitude bands, but there were clear differences in cooling intensity of different regions and seasons. After volcanic eruptions in high latitude areas, temperature decreased in Northeast and Southeast China by 1.2°C in the winter half-year and 2.0°C in the summer half-year. After middle- and lower-latitudes volcanic eruptions, the cooling regions of the winter half-year were Tibet, Southeast, and Central East China, where the temperature decreased by 1.3~2.2°C; the cooling effects in the summer half-year were less intense than in the winter half-year. After equatorial volcanic eruptions, the winter half-year temperature significantly decreased in Northeast, Southeast, and Tibet, and the cooling magnitudes were greater than 1.2°C; the post-volcanic summer half-year temperature decreased slightly in Northwest and Central East. In some regions secondary cooling occurred in the third year after large volcanic eruptions, and the cooling intensity was even stronger than the initial temperature drop. However, we did not find significant relationship between the cooling magnitude and region and the eruptive seasons of large volcanos of the same latitude bands.
20世纪以来强火山喷发对中国温度变化区域差异的影响
DOI:10.18306/dlkxjz.2016.03.007
[本文引用: 1]
本文根据1901年以来的62次强火山(VEI≥4)喷发年表和英国东安格利亚大学气候研究中心发布的格点气温资料(CRU TS v.3.22),采用时序叠加分析方法,辨识了不同纬度、不同季节强火山喷发对中国温度变化区域差异的影响。结果表明:不同纬度强火山喷发后的1~2年,中国温度基本以下降为主,但降温强度存在显著的区域与季节差异。高纬火山喷发后的显著降温区域发生在东北和东南地区,冬半年温度下降达1.2°C,夏半年温度下降2.0°C;中低纬火山喷发后,冬半年温度的显著下降区域发生在青藏、东南和东中部地区,幅度为1.3~2.2°C,夏半年温度下降幅度比冬半年小;赤道火山喷发后,冬半年温度显著下降区域发生在东北、东南和青藏地区,且降温幅度均大于1.2°C,夏半年西北和东中部地区降温幅度偏小。此外,强火山喷发后第3年,部分地区还出现二次降温现象,降幅甚至超过第一次;然而,同一纬度强火山喷发后,其所造成的降温幅度和降温区域差异与强火山喷发的季节关系不大。
Effects of Mount Pinatubo volcanic eruption on the hydrological cycle as an analog of geoengineering
Significant decadal-scale impact of volcanic eruptions on sea level and ocean heat content
DOI:10.1038/nature04237 URL [本文引用: 1]
