

1 引言
应对全球气候变化已成为世界共识。作为全球最大的发展中国家,中国也积极主动承担减排责任。2020年9月,国家主席习近平向全世界庄严承诺:二氧化碳排放力争于2030年前达到峰值,2060年前实现碳中和。在随后的气候雄心峰会上,习近平主席又进一步宣布了国家自主贡献的新目标,即到2030年单位国内生产总值二氧化碳排放将比2005年下降65%以上。自此,“双碳”目标上升为国家重大发展战略[1],各地区、各行业应如何助力这一目标的实现成为亟待研究的现实问题。在服务经济全球化的趋势背景下,中国服务业在促进经济增长,拉动就业等方面成效显著。然而,研究证明,服务经济发展的过程并非是“绿色”和“无污染”的[2],其发展所产生的大量能耗与污染排放问题同样不容忽视。随着传统高碳行业节能潜力的不断释放,充分挖掘服务业的减排效益已成为学界研究的重要内容。与此同时,在经济发展和“双碳”目标的双重约束下,对服务业碳强度展开研究更具现实意义。为此,本文综合探讨了中国服务业碳强度的时空交互特征及其跃迁机制,其研究前沿紧扣时代需求,是积极落实“双碳”国家战略在重点行业率先开展的一次积极探索。
碳强度即单位国内生产总值的二氧化碳排放,它是衡量区域减排绩效的重要指标[3]。目前,国内外学者已经围绕碳强度开展了大量研究。在研究视角上,学界关注的焦点不局限于工业、建筑、电力等传统高耗能产业[4⇓-6],还探讨了土地利用与贸易隐含的碳强度问题[7-8]。研究尺度涉及全国、区域、省域以及城市等层面[9⇓⇓-12],且以省域单元的研究居多。在研究内容上,除了碳强度的测算外,还包含碳强度的预测模拟[13]、时空异质性与非均衡性[14]、影响机制[15]以及减排成效评价[16]等方面,这些都极大地丰富了碳强度领域的研究成果。但是,受限于服务经济发展对环境影响的认知偏差,服务业环境效应的相关研究起步较晚。既有研究主要集中于服务业能耗[17]、碳排放[18-19]、碳效率[2]的定量核算工作,也有学者将碳强度问题进一步延伸至交通运输业[20]、旅游业[21]、商业[22]等细分服务行业层面。在研究方法上,学者常采用核密度估计、空间自相关(Moran's I指数)、基尼系数、α收敛与绝对β收敛等方法[23⇓⇓-26],来揭示服务业碳排放或效率的空间演化、区域差异、邻近关联性以及空间收敛特征。然而,上述方法侧重于探讨区域自身的发展变化,或囿于截面数据的空间特征,忽视了时间与空间要素的耦合与连续,难以真实反映研究对象局部空间结构的动态交互规律。影响服务业环境效应的因素复杂多样,现有的研究主要分为两类,一类是借助STIRPAT模型[27]、结构分解模型[28]、EKC模型[29]、Tobit模型[30]等方法,从经济发展、产业结构、能源强度、人口密度等多因素角度综合探讨对服务业碳排放或效率的影响;另一类是专注于考察某一特定要素对服务业环境效应的影响,如服务出口贸易[31]、雾霾污染[32]、高铁建设[33]等。这些研究为后续实证考察服务业环境效应的驱动因素提供了参考依据,但遗憾的是,对于不同分位数条件下的服务业碳强度及其影响因素的研究成果仍较缺乏。
总体而言,学界围绕碳强度、服务业环境效应等方面已开展了较为系统的研究,为进一步的拓展研究奠定了坚实的理论基础。但现有研究主要集中于服务业碳排放或效率问题,对于服务业碳强度目标的考量仍显不足。其次,尽管已有学者基于地理学角度对服务业环境效应的空间分异进行了分析,但大多局限于空间差异与关联作用的截面特征,缺乏从时空交互的视角研究其空间关系、格局与变迁。最后,在对影响因素的揭示上,已有研究多借助传统的分解方法或回归模型来考察分析服务业环境效应的影响因素,但却忽略了不同服务业碳强度水平下驱动因素的异质性。事实上,各地区在经济、技术以及污染排放等方面都存有一定差异,若仍延续已有的研究方式,可能会忽略服务业碳强度的发展阶段与区域差异,不利于国家和各级政府因地制宜地制定服务业减排政策。
鉴于此,本文通过多种空间分析方法的综合应用,研究2005—2019年中国服务业碳强度的时空演进与动态交互特征。在此基础上,借助分位数回归与时空跃迁的嵌套分析框架,来探索不同跃迁类型下服务业碳强度的驱动机制模式。一方面,以期能够增进对服务业碳强度现状及其动态变迁规律的宏观认知,揭示多要素影响下服务业碳强度跃迁变化的驱动模式;另一方面,在实践上将有助于充分挖掘服务业的节能减排潜力,并依据不同跃迁类型下各类驱动模式作用效果的差异性,为制定“共同但有区别”的服务业减排政策提供参考依据,从而服务于“双碳”目标下构筑低碳服务业的实践需要。
2 研究方法与数据来源
2.1 Moran's I指数
采用空间自相关分析法中的全局Moran's I指数,分析全国各省服务业碳强度在空间上的相关性及集聚程度。Moran's I指数的值域为[-1, 1],当指数值为0时,表明不存在空间相关关系;当该值越接近1时,表明区域单元间的空间正相关性越强,集聚程度越高。具体公式如下:
式中:n为研究单元(省份)的数量;
2.2 探索性时空数据分析(ESTDA)
2.2.1 LISA时间路径
式中:U为相对长度;β为弯曲度;N为研究单元数量;d(Li, t, Li, t+1)为研究单元i在t到t+1年间的移动距离。若U、β均大于1,表明研究单元在研究期内具有更加动态的局部空间结构与依赖方向,反之,则相反。
2.2.2 时空跃迁
表1 时空跃迁类型
Tab. 1
| 类型 | 具体表达式 |
|---|---|
| Ⅰ类 | HHt→LHt+1、HLt→LLt+1、LLt→HLt+1、LHt→HHt+1 |
| Ⅱ类 | HHt→HLt+1、HLt→HHt+1、LLt→LHt+1、LHt→LLt+1 |
| Ⅲ类 | HHt→LLt+1、LHt→HLt+1、HLt→LHt+1、LLt→HHt+1 |
| Ⅳ类 | HHt→HHt+1、LLt→LLt+1、LHt→LHt+1、HLt→HLt+1 |
2.2.3 时空交互可视化
依据LISA时空移动轨迹的协方差系数大小,邻接省域间的动态关联关系可以划分为强正向关联(0.5~1)、弱正向关联(0~0.5)、强负向关联(-1~-0.5)与弱负向关联(-0.5~0)4种类型。当协方差系数值大于0时,为正向关联状态,表明邻接省域在时空变迁过程中处于正向协同的发展状态;当该数值小于0时,为负向关联状态,表明邻接省域之间存在一定程度的时空竞争;当该数值为0时,说明邻接省域之间不存在动态关联关系。
2.3 分位数回归
假设变量Y的概率分布为:
τ的分位数定义为:
则F(y)的分位数q(τ)的最小化目标函数为:
式中:
2.4 影响因素选取与数据来源
学界围绕碳强度或服务业环境效应的驱动因素已经做了大量的研究工作。其中,STIRPAT及其扩展模型应用最广,且已涉及能源利用、污染排放、生态效率等各类环境领域的研究[9]。STIRPAT模型不仅可以考量传统的人口、富裕和技术因素的影响,还可以在模型中进一步纳入城镇化水平、对外贸易等其他驱动因素,有助于综合考察影响环境压力的多重复杂因素[27]。参考STIRPAT模型,本文选取人口、富裕程度、技术水平作为影响服务业碳强度的基础因素[23,41 -42]。除此之外,服务业发展与城镇化密切相关,城镇化进程的加速,居民的生活方式和消费习惯都可能会发生变化[43],从而影响能源需求。服务产业结构是衡量服务业发展层次的重要标尺。一般来说,服务业内部结构升级意味着传统高耗能服务行业比重的下降与“高附加值”“高技术”的新兴现代服务产业比重的上升[26,44],因此其产业结构的优化不仅将促进服务业生产率提升,而且会对能源利用产生重要影响[30]。环境规制作为一种约束力量,可以通过强制手段倒逼企业实施技术创新,推动服务业绿色发展[23]。综上,从人口、富裕程度(经济发展水平)、技术水平、城镇化水平、服务产业结构、环境规制等方面综合探讨中国服务业碳强度时空跃迁的要素驱动模式(表2)。与此同时,纳入富裕程度的二次项(SA),以验证服务经济发展水平与碳强度之间是否符合EKC假说。
表2 相关变量描述
Tab. 2
| 变量名称 | 缩写 | 指标定义 | 单位 |
|---|---|---|---|
| 人口密度 | P | 年末常住人口总数/行政区面积 | 人/km2 |
| 经济发展水平 | A | 人均服务业增加值 | 元/人 |
| 技术水平 | T | 能源强度(能耗总量/服务业增加值) | t/万元 |
| 服务产业结构 | IS | 传统高耗能流通服务行业增加值的比重 | % |
| 城镇化水平 | UB | 城镇人口占总人口比重 | % |
| 环境规制 | ER | 环境治理投资/GDP | % |
相关数据来源如下:各省份(暂未包括港澳台及西藏)服务业能耗数据和碳排放系数主要来自各年份《中国能源统计年鉴》和相关研究成果[45];各类变量的数据主要来自相应年份的《中国统计年鉴》、各省统计年鉴以及EPS数据库。个别数据缺失,采用插值法予以补充,并将有关经济数据统一折算为2005年不变价。此外,在实证分析前对各变量进行对数化处理,以降低异方差和非平稳性。
3 结果分析
3.1 中国服务业碳强度时序演化与空间相关性分析
全国服务业碳强度均值从2005年0.612 t/万元升高至2019年0.768 t/万元,整体呈现波动上升的态势(图1)。而同一时期的工业[5]、农业[46]等行业的碳强度却逐步下降,减排潜力不断释放。尽管服务业碳强度与两大行业相比仍具有一定优势,但其“绿色、低碳”属性正在逐渐削弱。从各年份的具体变化来看,大致可以分为两个阶段。其中,2005—2012年是第一阶段,在此阶段服务经济高速发展,但囿于对服务业环境效应的认知偏差,其能源消耗量也大幅增多,呈现“粗放型”发展方式,碳强度上升到最高值0.835 t/万元。2013年后随着国家总体减排方略的持续推进以及能耗“双控”行动的有效开展,服务业碳强度均值有所下滑,但与“双碳”目标的要求仍有一定差距。具体到各省份来看,在研究初期,山西、天津、山东、云南、贵州、新疆以及东三省地区的服务业碳强度均高于全国平均水平。而到了研究期末,天津和山东已退出高碳强度地区,东北三省、中部、西部多数省份的服务业碳强度仍然较高。总体来看,2005—2019年服务业碳强度高于全国均值的地区有所减少,其中东部多数省份和中南部部分地区减少趋势最为明显。尽管如此,中国服务业碳强度整体仍呈现非均衡性,存在区域减排差异与极化现象。
图1
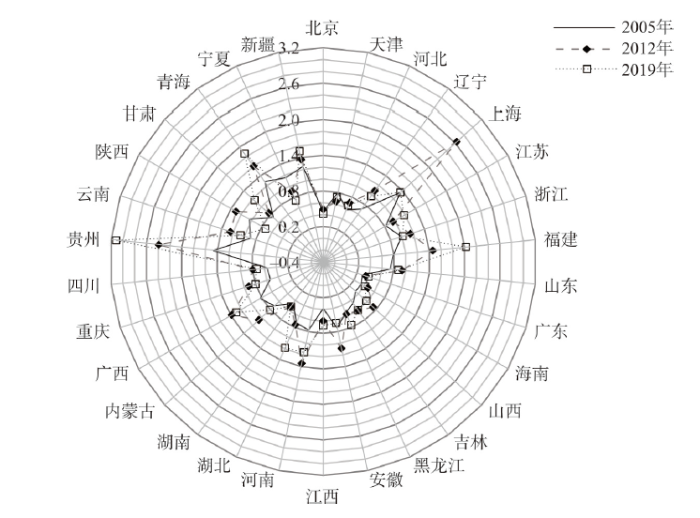
图1
中国省域服务业碳强度变化(t/万元)
Fig. 1
Changes in carbon intensity of China's provincial service industry (t/104 yuan)
图2
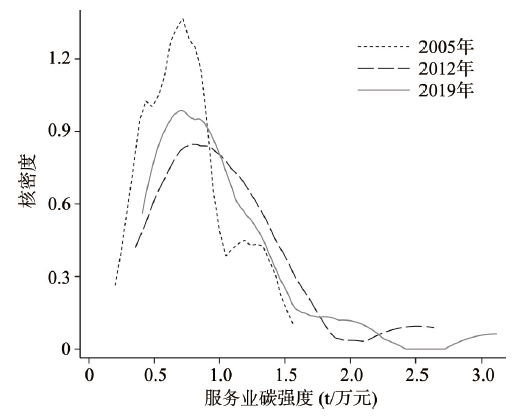
图2
中国服务业碳强度的核密度曲线
Fig. 2
Kernel density curve of carbon intensity in China's service industry
为进一步了解中国服务业碳强度总体差异及其动态演进特征,运用核密度估计法,对2005年、2012年和2019年的服务业碳强度进行分析,并绘制核密度曲线图(图2)。从分布位置看,2005—2019年核密度曲线的主峰呈现先右移再左移的趋势,说明在样本期内中国服务业碳强度整体水平先上升后下降,这与前文的客观事实相印证。从分布形态看,在研究期内,主峰峰值先下降再上升,波峰形态也呈现“陡峭—扁平—陡峭”的演变特征,说明中国服务业碳强度总体差异存在动态收敛趋势。从分布延展性看,呈现向右拖尾现象,且延展性存在拓宽特征,表明中国服务业碳强度高值区的空间差距在逐渐扩大,如贵州、黑龙江的服务业碳强度均已超过2 t/万元以上。总体来看,中国服务业碳强度的离散程度先上升后下降,但与此同时,少数高碳强度地区出现极化效应,与其他地区的差距越来越大。
核密度曲线仅反映了中国服务业碳强度的区域差异与时序变化特征,本文借助全局Moran's I指数进一步探究碳强度的空间关联特征。由表3可知,2005—2019年间,Moran's I指数均为正值,说明各省服务业碳强度具有一定的空间正向相关性,空间聚类现象较为明显。从研究期内的变化情况来看,全局Moran's I指数呈现“下降—上升—稳定”3个阶段,说明服务业碳强度的空间相关性在研究初期有所减弱,但在后期逐渐趋于稳定,空间集聚水平的波动越来越小。
表3 中国服务业碳强度的Moran's I
Tab. 3
| 年份 | Moran's I | Z值 | 年份 | Moran's I | Z值 |
|---|---|---|---|---|---|
| 2005 | 0.283 | 2.771*** | 2013 | 0.211 | 2.195** |
| 2006 | 0.273 | 2.706*** | 2014 | 0.184 | 2.074** |
| 2007 | 0.250 | 2.596*** | 2015 | 0.185 | 2.052** |
| 2008 | 0.091 | 1.165 | 2016 | 0.184 | 2.042** |
| 2009 | 0.123 | 1.391* | 2017 | 0.184 | 2.026** |
| 2010 | 0.107 | 1.286 | 2018 | 0.184 | 2.064** |
| 2011 | 0.140 | 1.616* | 2019 | 0.166 | 1.693* |
| 2012 | 0.158 | 1.807* |
注:*、**、***分别表示10%、5%、1%的水平上显著,下同。
3.2 中国服务业碳强度时空交互特征分析
3.2.1 LISA时间路径分析
根据公式(1)~(2)计算得到LISA时间路径的相对长度与弯曲度,可进一步验证中国服务业碳强度是否具有稳定的局部空间结构与空间依赖方向[47]。由图3a可知,山西、新疆、青海、吉林、贵州、内蒙古、黑龙江等地相对长度均大于全国平均水平,表明其局部空间结构具有强烈的动态性,主要是由于这些地区处于产业结构调整的关键时期,在大力发展服务经济的同时,伴随着大量的能源消耗与碳排放,使其碳强度呈现较强的局部空间波动性。而广东、福建、浙江、江苏、北京等地的相对长度较短,且多在0.6以下,这些省区主要处于东部沿海发达地区,服务业所占比重较高,且已形成较为稳定的集约型发展模式,因此构成相对稳定的局部空间结构。总的来看,全国多数地区的LISA相对长度较小,整体呈现出较为稳定的局部空间格局。
图3
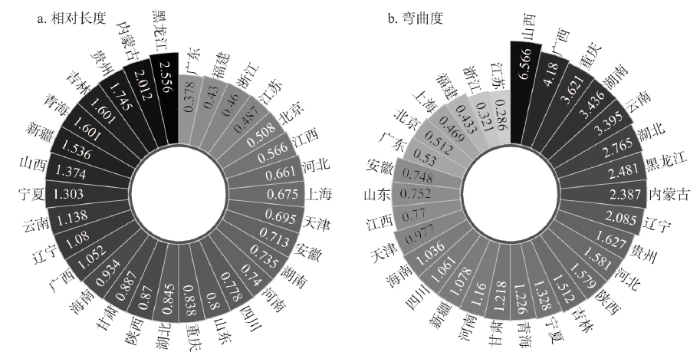
由图3b可知,内蒙古、黑龙江、湖北、云南、湖南、重庆、广西、山西等中西部地区的弯曲度均在2以上,远超全国平均水平,表现为更加波动的空间依赖方向。原因可能在于,这些地区大多邻近碳强度高值区与低值区的集聚中心或临界处,因而其服务业碳强度的动态变迁过程受领域的空间影响较大,呈现出动态的变动方向与空间依赖关系。江苏、浙江、福建、上海、北京、广东等东部沿海地区的弯曲度最小,主要是由于这些地区与周边领域省份的服务业发展模式、能耗结构等都具有较高的相似度,空间依赖的波动相互牵制与影响,从而弯曲度较小。
3.2.2 LISA时空跃迁分析
通过时空跃迁矩阵可进一步分析局部空间关联类型的相互转移状态。由表4可知,2005—2019年中国服务业碳强度的空间关联格局相对稳定,不同类型之间的跃迁较少,整体呈现出一定的转移惰性。在4种时空跃迁类型中,属于IV类型的省份数量最多,空间凝聚度较高,说明在整个研究期间,各省服务业碳强度的局部空间结构具有明显的路径依赖特征。其中,云南、贵州、内蒙古、黑龙江、青海、新疆等地都属于HHt→HHt+1与HLt→HLt+1类型,表明中部、西部多数地区的高碳强度属性非常稳定,是制约中国服务业协同减排的关键区域。值得注意的是,属于I、II、III跃迁类型的省份共有6个,这些地区将成为驱动中国服务业碳强度跃迁的重点省区,应给予更多的减排政策关注。总体来说,中国多数省份的服务业碳强度受领域的空间影响较小,其自身因素对空间关联结构的影响较大,具有较强的路径依赖或空间锁定特征。
表4 中国服务业碳强度时空跃迁矩阵
Tab. 4
| 跃迁类型 | HHt+1 | HLt+1 | LHt+1 | LLt+1 |
|---|---|---|---|---|
| HHt | IV类(蒙辽吉黑滇青新) | II类 | I类(宁) | III类(陕) |
| HLt | II类 | IV类(琼黔鄂) | III类 | I类(津) |
| LHt | I类(甘) | III类 | IV类(桂川渝) | II类(晋) |
| LLt | III类(湘) | I类 | II类 | IV类(京冀沪苏浙皖闽赣鲁豫粤) |
3.2.3 时空交互可视化
在经济发展与减排的过程中,邻近省域之间可能存在时空竞争或合作共赢关系。本文借助时空拓扑网络图进一步探究邻接省域之间的空间关联特征。由图4可知,服务业碳强度的时空网络格局主要以正向关联为主,负向关联仅有13对,占比不到20%,表明在中国服务业碳强度时空变迁的过程中具有较强的空间整合性。在所有的负向关联中,天津与河北、内蒙古与辽宁、山东与河南、河南与陕西、陕西与甘肃、甘肃与宁夏呈现出强负向关联状态,反映出邻接省域间减排的不均衡特征。这些地区在服务业碳强度的演化过程中存在一定程度的时空竞争,这可能是由于区域减排政策的封闭性,或是邻接省份之间长期存在的空间不协调性,如区域经济发展水平、自然资源禀赋存在空间异质性、以及低碳建设投资与低碳技术等支持性因素的不均衡,最终导致省际间减排的竞争关系进一步加剧。另一方面,上海与浙江、浙江与福建、福建与广东、云南与贵州、山西与内蒙古呈现出强正向关联,这些邻接省域服务业碳强度的演化过程具有较高的相似度,地域性集中的态势显现,因此成为正向协同的发展区域。总的来说,开展服务业低碳行动需要从区域视角进行统筹,避免省际间减排政策的封闭性,促进区域整体减排协作。
图4
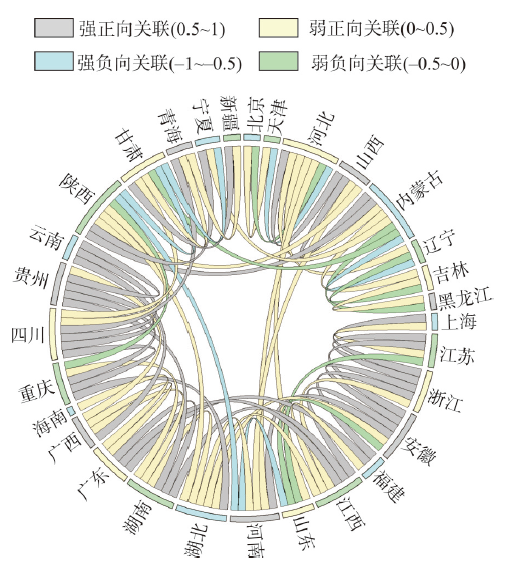
图4
中国服务业碳强度的时空拓扑网络
Fig. 4
Spatiotemporal topology network of carbon intensity in China's service industry
3.3 中国服务业碳强度跃迁机制分析
3.3.1 分位数回归结果
将服务业碳强度(CEI)、人口密度(P)、经济发展水平(A)、技术水平(T)、环境规制(ER)、城镇化水平(UB)、服务产业结构(IS)等纳入分位数回归模型,并借鉴相关研究[48],选取0.1、0.25、0.5、0.75、0.9共5个分位点进行估计。为减少伪回归,在实证分析前需要进行平稳性检验。本文选取LLC和Fisher-ADF单位根检验方法对各变量进行平稳性检验(表5),发现所有变量均通过了5%水平上的显著性检验,表明各变量是平稳的,表明各变量是平稳的,可直接进行参数估计。此外,经检验,各变量指标的平均方差膨胀因子(VIF)为4.04,最大值为8.65,低于10的警戒值,因此在回归分析中可以忽略多重共线性的问题。从分位数回归的估计结果来看(表6),人口密度在各个分位点上表现出对服务业碳强度不同程度的负向作用;服务业经济发展水平在高分位阶段表现为正向促进作用,但其二次项系数为负,说明经济发展水平对碳强度的影响存在拐点;技术水平表现为正向驱动效应,且随着分位点升高不断增大;环境规制在各个分位点上均未通过显著性检验;服务产业结构在低分位阶段促进了碳强度的增加;城镇化水平在各个分位点上始终保持抑制效应。
表5 变量单位根检验
Tab. 5
| 变量 | lnCEI | lnP | lnA | lnSA | lnT | lnER | lnUB | lnIS |
|---|---|---|---|---|---|---|---|---|
| LLC检验值 | -25.504*** | -3.5941*** | -26.639*** | -10.812*** | -7.866*** | -3.016** | -8.189*** | -75.863*** |
| ADF检验值 | 147.833*** | 159.213*** | 162.872*** | 166.735*** | 150.390*** | 141.245*** | 111.345*** | 149.843*** |
表6 分位数回归与OLS估计结果
Tab. 6
| 变量 | 分位点 | OLS | ||||
|---|---|---|---|---|---|---|
| 0.1 | 0.25 | 0.5 | 0.75 | 0.9 | ||
| lnP | -0.309*** | -0.340*** | -0.274*** | -0.289*** | -0.370*** | -0.322*** |
| lnA | 1.331 | 0.269 | 0.639* | 0.853** | 0.865*** | 1.841** |
| lnSA | -0.066 | -0.010 | -0.033* | -0.046*** | -0.045** | -0.099** |
| lnT | 1.053*** | 1.077*** | 1.080*** | 1.093*** | 1.102*** | 1.003*** |
| lnER | -0.016 | 0.006 | 0.010 | 0.004 | 0.002 | 0.001 |
| lnUB | -0.539*** | -0.437*** | -0.403*** | -0.407*** | -0.493*** | -0.486* |
| lnIS | 0.183*** | 0.131*** | 0.083*** | 0.048 | 0.024 | 0.053 |
| Cons | -1.495* | 3.138 | 1.204 | 0.421 | 1.126 | -4.298 |
3.3.2 时空跃迁与分位数回归嵌套
按照分位点的大小,可以将分位数回归划分为高分位(0.5~0.9)与低分位(0.1~0.5)两个阶段,同时可根据影响因素的差异化作用方向,进一步构建出高分位制约、高分位驱动、低分位制约与低分位驱动四种分位响应类型,继而可与时空跃迁类型进行深度嵌套[40](表7)。高分位制约的特性主要是抑制服务业高碳强度区的增长,其中同向制约表示邻近省域也受到限制,反向发展表示邻近省域发生跃迁或维持在高值区。高分位驱动使服务业碳强度始终保持在高值区,其中同向发展表示同时驱动邻近省域的碳强度增长,反向发展表示未受到明显的驱动效应影响。低分位制约的特性是保持自身服务业碳强度处于低值区,其中同向制约表示邻近省域同样受到制约,反向发展则表示邻近省域完成向上跃迁或维持在高值区。低分位驱动将促进服务业低碳强度区向上跃迁,其中同向发展表示邻近省域也发生跃迁或维持在高值区,反向发展表示对邻近省域尚未充分发挥驱动效应。
表7 时空跃迁与分位响应类型的嵌套
Tab. 7
| 分位响应类型 | 对应跃迁方向 | 对应跃迁类型 |
|---|---|---|
| 高分位制约 | 同向制约 | HHt→LLt+1与HLt→LLt+1 |
| 反向发展 | HHt→LHt+1与HLt→LHt+1 | |
| 高分位驱动 | 同向发展 | HHt→HHt+1与HLt→HHt+1 |
| 反向发展 | HHt→HLt+1与HLt→HLt+1 | |
| 低分位制约 | 同向制约 | LLt→LLt+1与LHt→LLt+1 |
| 反向发展 | LLt→LHt+1与LHt→LHt+1 | |
| 低分位驱动 | 同向发展 | LLt→HHt+1与LHt→HHt+1 |
| 反向发展 | LLt→HLt+1与LHt→HLt+1 |
3.3.3 时空跃迁的驱动机制模式
在上述分析的基础上,将高、低分位点的影响因素与时空跃迁类型深度嵌套,建立产业—技术驱动、人口—城镇化制约、技术—规制驱动、经济—人口—城镇化制约4种服务业碳强度时空跃迁的驱动/制约模式(图5)。
图5
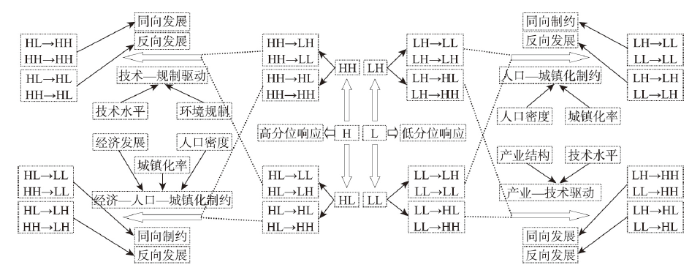
图5
中国服务业碳强度时空跃迁驱动机制模式
Fig. 5
The driving mechanism of spatiotemporal transition of carbon intensity in China's service industry
人口—城镇化制约模式。人口密度、城镇化水平是抑制低碳强度省份跃迁的主要因素,低分位制约类型属于此类模式。人口密度一般会对碳强度产生双向影响[49]。一方面,人口密度可以通过规模效应降低边际减排成本;另一方面,人口密度提升可能会导致集聚不经济的现象,过度拥挤会造成各类竞争成本上升,从而产生过度的能源需求。从本文实证结果来看,人口密度对于服务业碳强度的抑制作用尤其关键,这与莫惠斌等的发现相类似,他们认为人口集聚有助于降低碳排放量[41]。受益于人口密度增加所带来的的集聚效应与规模效应,能够促进地区公共设施与知识服务的共享,加快集聚经济的形成,从而有助于降低服务行业的能源消费需求,优化能耗结构。此外,城镇化水平对服务业碳强度同样产生负向抑制效应,且通过了1%水平上的显著性检验。随着城镇化进程的加速,集约化生产生活方式的推广,能够推动服务产业人才、技术的集聚,加快服务企业之间的知识溢出与创新资源共享[44],这些都有助于提升服务业运行效率,进一步抑制服务业碳强度的提升。结合前文分析(表4、表7),在低分位阶段,北京、上海、江苏、浙江、广东、广西、四川等地受此制约模式的影响较大,服务业碳强度始终保持在低值区。其中,东部沿海的多数省份属同向制约类型,其领域省份的服务业碳强度同样受到了抑制作用;而广西、四川、重庆等地属反向发展类型,其领域省份的服务业碳强度增长较快,人口密度与城镇化水平未充分发挥制约效应。
产业—技术驱动模式。服务产业结构与技术水平是驱动服务业碳强度低值聚集区跃迁的主要因素,低分位驱动属于此种模式。技术水平对产业能耗同样具有正向和负向两种影响[49]。从本文的实证结果来看,技术水平对服务业碳强度起到正向驱动效应。原因可能在于,一方面,技术水平的变化会刺激服务产业的经济活动,进而可能诱发新的能源消费和需求[9],导致能源消费的规模经济效应难以形成;另一方面,技术水平在应用推广过程中可能存在时滞性阻碍,其减排效应尚未充分显现[50]。此外,服务产业结构对碳强度的促进效应同样显著。在研究期间,中国服务业整体处于规模扩张阶段,产业结构仍以传统高耗能的低端服务业为主,同时,服务产业内部结构优化调整的速度较慢,新兴现代服务产业的“高技术”与“高知识密集性”的优势尚未对服务业碳强度起到明显的制约作用[26]。受此模式的驱动效应,原本服务业碳强度的低值区逐渐开始向上跃迁,只有湖南、甘肃等地属于此类型,远小于低分位制约类型的省份数量,说明在低分位阶段,人口—城镇化制约模式的影响范围更广。
经济—人口—城镇化制约模式。高分位制约适用于此类模式。在此模式下,人口密度与城镇化水平对于高碳强度省份仍然保持显著的抑制作用,并随着分位点的升高制约效应逐步增强。与此同时,服务业经济发展水平及其二次项在高分位阶段也都通过了显著性检验,并呈现出“正—负”效应,表明人均服务业增加值与碳强度呈非线性关系,在一定程度上验证了服务经济发展支持“环境库兹涅茨曲线”假说,这与王恕立等的研究结果相一致[51]。在经济发展水平达到拐点前,服务业碳强度会随着人均服务业增加值的增加而增大,在此阶段,服务产业整体表现为粗放型的规模扩张[52]。当人均服务业增加值达到一定水平后,服务产业的增长方式开始向集约型转变,规模经济、知识溢出效应等正外部性不断凸显,减排效率提升,服务业碳强度受到进一步制约。结合前文分析,天津、陕西、宁夏等地受此模式的制约效应显著,由原来的高碳强度地区逐渐向低值区跃迁。其中,天津与陕西属同向制约类型,邻域省份服务业碳强度的增长也受到阻碍;宁夏属于反向发展地区,邻域省份服务业碳强度保持增长,没有受到抑制作用的影响。
技术—规制驱动。高分位驱动适用于此种模式。在此驱动模式下,技术水平仍然是促进服务业碳强度增长的主要因素。其中,中部和西部的多数省份受此驱动模式的影响较大,尤其是西部地区呈现出明显的同向发展趋势,在自身服务业碳强度升高的同时,带动邻域省份碳强度的增长,内蒙古、辽宁、吉林、黑龙江、云南、青海、新疆等地均属于此种类型。而海南、湖北等地属反向发展地区,邻域省份服务业碳强度下降,减排差距逐渐显现。此外,环境规制对于服务业碳强度也表现为正向驱动效应,但未能通过显著性检验。孟辉等的研究也验证了这一点,他们发现政府环境规制并未对服务业绿色发展起到充分的支持效果[52]。原因可能在于,其一,环境规制作为一种约束力量,会使服务企业的治污成本增加,从而可能进一步挤占企业的研发投资[53],阻碍节能技术创新;其二,高分位地区的服务业能耗在研究期内大幅增加,并仍呈现增长态势,导致环境规制效应尚未充分体现;其三,可能是由于政府在环境治理的过程中缺乏有效的监管和绩效控制,导致相关规制手段尚未形成有效约束。
总体而言,自东南至西北,中国服务业碳强度的跃迁模式逐渐呈现出“同向制约—反向发展—同向发展”的阶梯递变格局(图6)。其中,西北、东北的多数省份主要表现为同向发展趋势,服务业碳强度居高不下;东部与东南部地区为同向制约区域,与此区域相邻省域的服务业碳强度均维持在低值区。从分位响应类型来看,低分位制约主要分布在东部沿海地区,高分位驱动主要分布在西北、西南和东北地区,这两种驱动/制约类型影响省域范围较广;只有少数省份受低分位驱动与高分位制约的作用效应。
图6
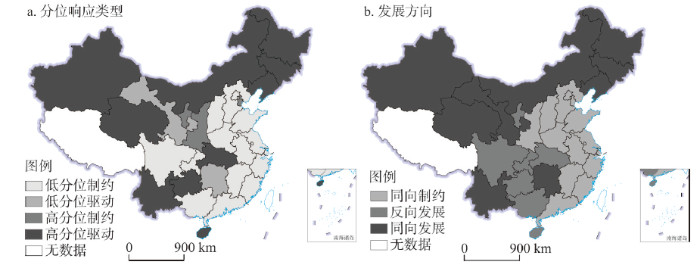
图6
中国服务业碳强度分位响应类型及发展方向空间格局
注:基于自然资源部标准地图服务网站GS(2019)1829号标准地图制作,底图边界无修改。
Fig. 6
Spatial pattern of response types of quantile regression and development direction
4 结论与讨论
本文以中国各省域服务业碳强度为研究对象,运用多种空间分析方法,分析了2005—2019年中国服务业碳强度的差异格局和时空依赖动态演化,并通过时空跃迁与分位数回归的嵌套,进一步探究了服务业碳强度跃迁的要素驱动模式。得到结论如下:
(1)研究期内中国服务业碳强度均值先上升后波动下降,整体呈现空间非均衡性。核密度估计的结果反映了碳强度总体差异呈缩小态势,但少数高碳强度地区出现极化效应,与其他地区的差距越来越大。此外,空间自相关Moran's I指数均为正值,表明省际服务业碳强度具有一定的空间正向相关性,在空间分布上呈现出空间聚类现象。
(2)基于ESTDA的时空动态过程分析表明,研究期内中国服务业碳强度的空间关联格局整体呈现出一定的转移惰性,具有较强的路径依赖或空间锁定特征。其中,东部沿海地区具有相对稳定的局部空间结构与空间依赖方向,中西部地区则相反。此外,在服务业碳强度时空变迁的过程中存在邻接省域间减排的不均衡特征,如天津与河北、内蒙古与辽宁、山东与河南等地都存在一定程度的时空竞争,因此开展服务业低碳行动须充分发挥区域之间的协同减排效应,避免省际间减排政策的封闭性。
(3)服务业碳强度时空跃迁的要素驱动/制约模式可以分为4类,即产业—技术驱动、人口—城镇化制约、技术—规制驱动以及经济—人口—城镇化制约模式。其中,东部沿海省份主要受人口—城镇化制约模式的影响,西北、西南和东北的多数地区主要受技术—规制驱动模式的影响。自西北至东南,中国服务业碳强度的跃迁模式逐渐呈现出“同向制约—反向发展—同向发展”的阶梯递变格局。
“十四五”是实现“双碳”目标的重要机遇期[48]。随着工农业减排边际效益的不断下降,充分挖掘服务业的降碳潜力成为未来碳排放“双控”工作的重要抓手。在此背景下,探讨服务经济发展与碳排放之间的动态关系极具现实意义。由于各省区经济发展的阶段性差距,中国服务业碳强度存在明显的空间异质性,因此针对不同碳强度水平的省份因地制宜地开展低碳行动尤为关键。本文通过对中国服务业碳强度时空交互特征与差异格局演化的深入研究,能够更好的理清服务业碳强度的发展阶段与动态演化规律。同时结合分位数回归与时空跃迁的深度嵌套,能够进一步明晰不同碳强度水平下减排措施实施效果的差异性,从而有效避免了均值回归的理想化处理模式[9],更好地反映了现实情况,并为制定“共同但有区别”的服务业碳减排政策提供参考依据。
得到政策启示如下:对于具有较强空间稳定性的北京、上海、江苏、浙江、广东、广西等低分位制约类型区而言,其重点在于对服务业碳强度抑制因素(如人口密度、城镇化水平)的改进和强化。具体来说,应基于地区差异制定合理的人口政策,充分发挥人口密度优化所带来的规模效应与集聚效应[49],着力推进新型城镇化建设,实现公共资源和服务设施的集约利用,进一步提升能源资源的配置效率,以保持低碳集聚的稳定性。对于云南、贵州、内蒙古、黑龙江、青海、新疆等高分位驱动类型区,则需重点关注服务业碳强度正向驱动因素的控制和优化。这些地区的服务产业应着力推进传统能源利用技术的转换升级,大力发展具有“绿色偏向”的低碳技术,并加速相关低碳技术的应用与推广,以破除技术应用存在的时滞性阻碍。对于天津、陕西等高分位制约类型,服务经济发展水平是抑制其碳强度的主要因素之一,因此可基于经济发展与碳强度之间的非线性关系,通过政府与市场双轮驱动,加快服务经济水平越过拐点,实现经济发展与碳排放的脱钩[29]。对于湖南、甘肃等低分位驱动类型,除了实施上述低碳技术措施外,还应持续深化服务业供给侧结构性改革,以“新发展理念”与”高质量发展”为导向,优先扶持低能耗、低污染的新兴现代服务产业,加快服务产业内部结构的调整优化。此外,各地区还应积极助力服务业从能耗“双控”向碳排放“双控”的转变,逐步建立服务业指标分解机制,同时应因地制宜调节环境规制强度,并加大对服务企业节能技术创新的政策扶持力度,进一步降低因环境规制产生的成本负担效应。总体而言,各地区服务业的低碳发展不仅应统筹考虑各类驱动/制约因素,还需要结合不同要素驱动/制约类型和跃迁路径,强调差异化的服务业减排措施,同时也离不开区域之间的协同减排,避免省际间减排政策的封闭性。
囿于数据所限,本文仅研究了2005—2019年中国服务业碳强度变化情况,后续有待进一步丰富样本数据,以更为深入地探索服务业碳强度时空动态过程及其作用机制规律。此外,还可引入地理探测器模型,来考察分析影响服务业碳强度的不同因素之间的交互作用效应,以丰富和完善服务业碳强度的影响机理。最后,在“双碳”目标的要求下,对于服务业碳强度的研究不应局限于发展现状与过往的时空变迁规律,还应结合LSTM、ARIMA-BP等模型,对今后关键时间节点的服务业碳强度开展预测与模拟研究,这将是后续研究的重点方向。
参考文献
Carbon emission reduction responsibility allocation in China's manufacturing industry under the targets of carbon peak and carbon neutrality
“双碳”目标下中国制造业的碳减排责任分配
Embodied CO2 emissions and efficiency of the service sector: Evidence from China
Optimal intensity targets for greenhouse gas emissions trading under uncertainty
Spatial correlation network and driving effect of carbon emission intensity in China's construction industry
DOI:10.3390/buildings12020201 URL [本文引用: 1]
Study on the change of China's industrial carbon emission intensity from the perspective of sector structure
DOI:10.31497/zrzyxb.20200311 URL [本文引用: 2]
中国工业碳排放强度变化的结构因素解析
Carbon intensity and benchmarking analysis of power industry in Tianjin under the context of cap-and-trade
碳交易背景下天津市电力行业碳排放强度与基准线
Spatial differentiation in the intensity and efficiency of carbon emission from land use in Guangdong province in past two decades
20年来广东省土地利用碳排放强度与效率空间分异研究
Changes and driving factors of embodied carbon emissions intensity in China's export trade: Based on CMRIO and SDA model
中国出口贸易隐含碳排放强度变动及驱动因素研究: 基于CMRIO-SDA模型
Spatial spillover effect and driving forces of carbon emission intensity at city level in China
DOI:10.11821/dlxb201906005
[本文引用: 4]

Since the Paris Climate Change Conference in 2015, reducing carbon emission and lowering carbon intensity has become a global consensus to deal with climate change. Due to different economic development stages, carbon intensity is regarded as a better index to measure regional energy-related carbon emissions. Although previous scholars have made great efforts to explore the spatiotemporal patterns and key driving factors of carbon intensity in China, the results lack the perspective from city level because of limited availability of statistical data of city-level carbon emission. In this study, based on carbon intensity of 283 cities in China from 1992-2013, we used the kernel density estimation, spatial autocorrelation, spatial Markov-chain and quantile regression panel model to empirically reveal its spatial spillover effects and explore the critical impact factors of carbon intensity at the city level. Our result indicates that although the total carbon emission increased during the study period, carbon intensity saw a gradual decline and regional differences were shrinking. Secondly, the city-level carbon intensity presented a strong spatial spillover effect and diverse regional backgrounds exerted heterogeneous effects on regions. Thirdly, quantile panel data analysis result showed that for low-intensity cities, on the one hand, FDI and transport sector were main contributing factors, and economic growth, technical progress and high population density negatively affected carbon intensity. On the other hand, industrial activity, extensive growth of investment and urban sprawl were key promoting factors for high-intensity cities, and population density was beneficial to emission reduction task. Furthermore, technological advance has not exerted negative influence on carbon intensity in high-intensity cities. At last, we suggested that Chinese government should take different carbon intensity levels into full consideration before policy making.
中国城市碳排放强度的空间溢出效应及驱动因素
DOI:10.11821/dlxb201906005
[本文引用: 4]
采用核密度估计、空间自相关、空间马尔科夫链和面板分位数回归等方法对1992-2013年全国283个城市碳排放强度的空间溢出效应和驱动因素进行了分析。① 核密度估计结果表明,中国城市碳排放强度总体均值下降,差异在逐步缩小。② 空间自相关Moran's I指数表明城市碳排放强度存在显著的空间集聚性且空间集聚性在逐渐增强,但空间集聚水平的变化逐年缩小。③ 空间马尔科夫链分析结果表明:第一,中国城市碳排放强度存在马太效应,低强度与高强度的城市在相邻年份转移过程中呈现维持初始状态的特征。第二,城市碳排放“空间溢出”效应明显,且不同区域背景下溢出效应存在异质性,即若与碳排放强度低的城市为邻,该城市的碳强度能够增加向上转移的概率,反之亦然。④ 面板分位数结果显示:在碳排放强度低的城市,经济增长、技术进步、适当的人口密度起到减排作用;外商投资强度与交通排放是使碳强度增大的主要因素。在碳排放强度高的城市,人口密度是重要的减排因素,技术进步暂时没起减排作用;工业排放、粗放式的资本投资以及城市土地蔓延则是碳强度上升的主要因素。
An overview of the inequality in China's carbon intensity
DOI:10.1007/s10098-021-02050-x URL [本文引用: 1]
Spatial spillover effects of directed technical change on urban carbon intensity, based on 283 cities in China from 2008 to 2019
Spatial effects and transmission mechanism of inter-provincial carbon emission intensity in China
中国省际碳排放强度的空间效应及其传导机制研究
Prediction of China's carbon emission intensity under the goal of carbon peak: Analysis based on LSTM and ARIMA-BP model
“碳达峰”目标下中国碳排放强度预测: 基于LSTM和ARIMA-BP模型的分析
Inequality and driving forces of energy-related CO2 emissions intensity in China
中国化石能源燃烧碳排放强度非均衡性及其演变的驱动力分析
Analysis of carbon emission intensity, urbanization and energy mix: Evidence from China
DOI:10.1007/s11069-016-2248-6 URL [本文引用: 1]
Evaluation on the effectiveness of provincial emission reduction in the process of carbon emission intensity decline in China's energy industry
DOI:10.11821/dlyj020190688
[本文引用: 1]
In this paper, the correction coefficient was applied to measure energy industry efficiency of emission reduction in each province. According to the energy industry carbon emission intensity and output value share of each province, the identity of national carbon emission intensity in China's energy industry was established from top to bottom, and the contribution rate of each province, energy industry carbon emission intensity and output value share in each province to the decline of national carbon emission intensity in energy industry was obtained by using LMDI-I decomposition method. Following the idea of “emission reduction efficiency - carbon emission intensity contribution - comprehensive contribution by province - the relationship between provincial emission reduction efficiency and the comprehensive contribution of province”, the emission reduction effectiveness of each province in the process of carbon emission intensity decline in China energy industry was evaluated. The results indicate that (1) the carbon emission intensity in China' energy industry shows a downward trend year by year, and the carbon emission intensity decreased by 45% in 2016 than that in 2005. (2) More than half of the provinces are efficiency areas for emission reduction and the number of provinces is increasing, while most of the provinces that do not meet the emission reduction standards are located in economically underdeveloped areas, and there are significant differences in emission reduction paths between provinces. (3) The contribution rate of energy industry carbon emission intensity in most provinces shows an upward trend, and the regional differences gradually decrease. (4) The competing momentum of comprehensive contribution by province is strong, and most provinces have contributed to the decline of carbon emission intensity in China energy industry, and the eastern region is the main contribution area, where the comprehensive contribution grade of many provinces develops positively. (5) The number of provinces with good emission reduction effectiveness is the largest, the general areas are scattered in the eastern coastal area and a few inland areas, and the spatial pattern of the poor areas remains stable in the western region. In the future, provinces should not only choose the low-carbon development path according to their own emission reduction effectiveness characteristics, but also form a benign interaction with the decline of national carbon emission intensity.
中国能源行业碳排放强度下降过程中的省际减排成效评价
DOI:10.11821/dlyj020190688
[本文引用: 1]
采用矫正系数衡量各省份的减排有效性,根据各省份能源行业碳排放强度及产值份额构建自上而下的全国能源行业碳排强度恒等式,运用LMDI-Ⅰ分解方法获取各省份、各省份能源行业碳排放强度及产值份额对全国能源行业碳排放强度下降的贡献率,并遵循“减排有效性-碳排放强度贡献-省份综合贡献-减排有效性与省份综合贡献关系”的思路对中国能源行业碳排放强度下降过程中各省份的减排成效进行评价。结果显示:① 中国能源行业碳排放强度呈逐年下降趋势,2016年能源行业碳排放强度较2005年下降45%。② 超过一半的省份为减排有效区且数量呈增加趋势,而减排未达标的省份多数为经济欠发达地区,各省份间的减排路径存在显著差异。③ 多数省份能源行业碳排放强度的贡献率呈上升趋势,省份差异逐渐缩小。④ 省份减排综合贡献的进位赶超势头强劲,绝大多数省份对全国能源行业碳排放强度的下降作出了贡献,且多个省份的综合贡献等级呈正向发展,东部地区是主要的降排贡献区。⑤ 减排成效良好省份数量最多,中等区多散布于东部沿海地区及少数内陆地区,欠佳区在西部地区空间格局保持相对稳定。未来各省份不仅要根据自身的减排成效特征因地制宜的选择低碳发展道路,还应与全国碳排放强度的下降形成良性互动。
Estimating energy service demand and CO2 emissions in the Chinese service sector at provincial level up to 2030
DOI:10.1016/j.resconrec.2018.02.030 URL [本文引用: 1]
Decomposition analysis of carbon emissions growth of tertiary industry in Beijing
The output as well as carbon dioxide emissions of tertiary industry have increased continuously in Beijing. Therefore, the tertiary industry has become a new field that needs to be explored for energy saving and emission reduction. This paper calculates the direct and indirect carbon dioxide emissions of tertiary industry in Beijing from 2005 to 2012 using the input-output analysis method. The results indicate that both the direct and indirect carbon dioxide emissions increased continuously and the latter grew more quickly than the former. The growth of the direct and indirect carbon dioxide emissions of tertiary industry was decomposed, which showed that four factors influence the growth of carbon emission of the tertiary industry, including the changes of industrial scale, industrial structure, energy consumption intensity and carbon coefficient. The results show that the industrial scale advancement and the direct energy carbon coefficient change promote the increase of direct carbon dioxide emissions, while the shift of industrial structure and the change of direct energy consumption intensity have the restrain on it. The industrial scale enlargement, industrial structure shift and the indirect energy carbon emission coefficient change promote the growth of indirect carbon dioxide emissions, while the indirect energy consumption intensity change has a restrain.
The materiality of the immaterial service sectors and CO2 emissions in Uruguay
DOI:10.1016/j.ecolecon.2014.12.003 URL [本文引用: 1]
Spatial differentiation and clustering of transport carbon intensity in China's provincial region
中国省域交通碳排放强度空间分异与聚类分析
Could the ETS reduce tourism-related CO2 emissions and carbon intensity? A quasi-natural experiment
DOI:10.1080/10941665.2020.1819837 URL [本文引用: 1]
Do commercial building sector-derived carbon emissions decouple from the economic growth in tertiary industry? A case study of four municipalities in China
DOI:10.1016/j.scitotenv.2018.08.078 URL [本文引用: 1]
Spatial differentiation and driving factors of green total factor productivity in China's service industry
中国服务业绿色全要素生产率的空间分异及驱动因素研究
Energy efficiency of Chinese service sector and its regional differences
DOI:10.1016/j.jclepro.2017.09.020 URL [本文引用: 1]
Regional disparity and dynamic evolution of carbon emission reduction maturity in China's service industry
Research on spatial convergence of carbon productivity in China's service industry
中国服务业碳生产率的空间收敛性研究
Waste generation flows and tourism growth: A STIRPAT model for Mallorca
DOI:10.1111/jiec.12420 URL [本文引用: 2]
The CO2 emission changes in China's transportation sector during 1992-2015: A structural decomposition analysis
DOI:10.1007/s11356-019-07094-7 URL [本文引用: 1]
Spatiotemporal characteristics and EKC testing of CO2 emissions from China's service industry
中国服务业CO2排放的时空特征与EKC检验
Impact of structure on unified efficiency for Chinese service sector: A two-stage analysis
DOI:10.1016/j.apenergy.2018.09.033 URL [本文引用: 2]
Green productivity effects of service export: A study based on the panel data of service sectors in 9 developing economies
服务出口贸易的绿色生产率效应研究: 基于9个发展中经济体细分行业数据的经验分析
Research on the impact of haze pollution on the green development of service industry: An empirical study of spatial econometrics based on provincial panel data
雾霾污染对服务业绿色发展的影响研究: 基于省级面板数据的空间计量经济学实证
The impact of high-speed rail on green productivity of star-rated hotels
高铁对星级饭店绿色生产率的影响
Spatiotemporal patterns of energy carbon footprint and decoupling effect in China
DOI:10.11821/dlxb202101016
[本文引用: 1]
The global environment issue resulting from carbon emissions has aroused worldwide concern for governments, the public and scientific communities. A precise measurement of the time-resolved and spatial distribution characteristics of carbon dioxide (CO2) and carbon footprint as well as its long-period evolution mechanism, can help clarify the relationship between environmental carbon load and economic growth, and are critical references to the formulation of scientific carbon emission reduction targets with reasonable and differential emission reduction policies. In this study, the mainland of China is taken as the research object. According to the quantitative correlations between DMSP-OLS nighttime light image data and carbon emission statistics, the carbon emission panel data model was simulated for China's carbon emissions in the period 2000-2013, and then the spatiotemporal evolving trend and spatial distribution characteristics of carbon emissions in the 14-year research period were discussed using Theil-Sen Median trend analysis and Mann-Kendall test method. Based on the framework of exploratory spatial-temporal data analysis (ESTDA), the spatial pattern and spatiotemporal dynamic evolution of carbon footprint from 2001 to 2013 were analyzed from the perspective of spatiotemporal interaction. In the three periods, the decoupling effect between environmental carbon load and economic growth of 336 prefecture-level cities were analyzed using the improved Tapio decoupling model. The results show that the overall carbon emissions in China had been on the rise from 2000 to 2013, in which the stable-slow rise type was dominant. China's carbon footprint and carbon deficit increased year by year, and the central and western regions became the focus of the growth of carbon footprint and carbon deficit from 2001 to 2013. At different administrative city scales, the spatial distribution pattern of carbon footprint and carbon deficit show obvious administrative orientated and spatial zonal differentiation characteristics. The annual average of global Moran's I index of each level unit is 0.491, which indicates that there is a significant spatial auto-correlation feature in the carbon footprint of China's prefecture-level units. The relative length of the LISA time path is greater in the north than in the south, and it tends to increase from the coastal areas to the central and western regions. The curvature of LISA time path decreases from coastal areas to inland areas on the whole. The curvature of northeast and central regions is higher, while that of eastern and western regions is lower. There is a different trend of the decoupling effect of environmental carbon load in China. Meanwhile the expansion-connection and expansion of negative decoupling regions continuously increased and spatially agglomerated, presenting an "E"-shaped distribution pattern from the north to the south. The national average decoupling elastic value is gradually increasing, while the coefficient of variation continues to decline, and the decoupling type has a significant evolution trend. Therefore, the unbalanced trend of economic growth and carbon emissions in China will continue for a certain period.
中国能源碳足迹时空格局演化及脱钩效应
DOI:10.11821/dlxb202101016
[本文引用: 1]
利用DMSP-OLS夜间灯光数据和碳排放统计数据,构建碳排放面板数据模型,模拟了2000—2013年中国的碳排放量。运用探索性时空数据分析(ESTDA)框架体系,从时空交互视角分析2001—2013年碳足迹的空间格局和时空依赖动态演化;利用改进的Tapio脱钩模型对3个时间段336个地级单元环境碳负荷与经济增长之间的脱钩效应进行综合分析。研究表明:① 2000—2013年,中国的碳排放在时空演变上既表现出稳中有进的总体特征,也存在快速增长的阶段特征。② 碳足迹和碳赤字均呈逐年增长趋势,年均增长率分别为4.82%和5.72%;碳足迹和碳赤字整体北方大于南方,不同的行政单元尺度下碳足迹和碳赤字空间异质性特征明显。各地级单元碳足迹变异系数逐步增大,存在极为显著的空间自相关特征。③ LISA时间路径相对长度北方大于南方,且呈由沿海地区向中西部地区递增的趋势;LISA时间路径弯曲度整体上则由沿海地区向内陆地区递减。④ 综合脱钩指数整体以弱脱钩型为主,但弱脱钩型城市数量持续减少,扩张连接、扩张负脱钩区域数量逐渐增多且向中西部及东北地区聚集分布;全国平均脱钩弹性值逐步增长,变异系数持续下降。
STARS: Space-time analysis of regional systems
DOI:10.1111/j.0016-7363.2005.00675.x URL [本文引用: 2]
A framework for exploratory space-time analysis of economic data
DOI:10.1007/s00168-011-0470-4 URL [本文引用: 1]
Visualizing regional income distribution dynamics
DOI:10.1007/s12076-010-0048-2 URL [本文引用: 2]
Space-time interaction of provincial inequality of international tourism in China: The comparison between main tourist markets
DOI:10.11821/dlyj201602013
[本文引用: 1]
<p>The integration of space and time generates much closer interaction between geography and other social sciences, and provides a new perspective for understanding the role of geography in tourist flow distribution. China has become one of the world's most popular tourist destinations. However, there are significant disparities in volume and structure of China's international tourist flow between the coastland and inland. Tourism behavior involves the cross-regional movement at spatio-temporal dimension. Accordingly, an insight into spatial-temporal distribution and inter-regional co-opetition relationships is very helpful to develop destination marketing strategy. Based on the perspective of space-time interaction, this paper explored the inter-provincial inequality of international tourist flow in China from 1997 to 2013. LISA time path, space-time transition and visualization were employed for spatial-temporal data analysis. It concludes that: ① the polarization effects of the main port cities (Beijing, Shanghai, Guangzhou) tend to be weaken, and along with the rise of new growth poles located in the central and western regions, inter-provincial inequality tend to be reduced. ② The spatial distribution of international tourist flow obeys to the distance-decay rule-the short-range international tourist market is more spatially concentrated than the long-haul market. ③ The local spatial structure of European market is simplest, Southeast Asian market is the most complex. Space-time dependence effect has the greatest impact on the dynamic of regional system of North-American market; the Japanese-Korean market is of the least influence. The inter-provincial growth of inner Yangtze River Delta shows a significant space-time dependence, but the space-time dependence of Beijing and her neighbors, Guangdong and her neighbors are rather faint, in spite of the two provinces' own high growth rate; the local spatial structures of these backward provinces situated in the central and western regions are stable due to their slower growth rate. ④ The inter-provincial collaborative growth is the main theme of Chinese international tourism development. However, the situation of co-opetition varies from one province to another. ⑤ There exists an intense spatial cohesion among provinces, and their own market roles are relatively stable; Space-time transition probability varies from one province to another and from one market to another. Some suggestions are made to promote regional balanced development, such as continuing to increase supports for backward provinces; breaking administrative barriers for the circulation of tourism factors; necessitating the cooperation between touristic backward and advanced provinces as well as self-improvement of the formers; cultivating and strengthening the booming tourism growth poles located in the central and western regions; making more efforts to the advertising & marketing for the long-haul market.</p>
中国国际旅游省份差异的时空交互特征: 基于主要客源市场的对比
DOI:10.11821/dlyj201602013
[本文引用: 1]
运用LISA时间路径、时空跃迁、可视化等方法,对比研究1997-2013年中国主要国际客源市场的客流省份分布动态特征。研究表明:① 京沪粤极化减弱,中西部新兴增长极崛起,区域差异趋于缩小。② 客流分布遵循距离衰减规律,近程市场客流分布较远程集中。③ 欧洲市场局部空间结构最简单,东南亚最复杂;日韩市场受时空依赖影响最小,北美洲最大,东南亚次之;江浙沪间客流增长的时空依赖效应以溢出为主;而京粤对邻域以极化为主;中西部旅游欠发达省份局部空间结构稳定,增长缓慢。④ 国际旅游发展以省份间协同增长为主,局部空间竞合态势不同。⑤ 客流分布空间凝聚强,省份市场地位相对稳定;时空变迁概率因区域、市场而异。应打破行政壁垒,发挥空间溢出效应,促进要素流通;欠发达省份既要加强区域合作,也要不断自我完善;壮大中西部新兴旅游增长极;加大远程市场营销力度。
Quantile regression for longitudinal data
DOI:10.1016/j.jmva.2004.05.006 URL [本文引用: 1]
Research on spatial and temporal evolution of carbon emission intensity and its transition mechanism in China
中国碳排放强度的时空演进及跃迁机制
Spatio-temporal evolution and spatial effect mechanism of carbon emission at county level in the Yellow River Basin
DOI:10.13249/j.cnki.sgs.2021.08.003
[本文引用: 2]
Carbon emission control is the main problem and measure of ecological protection and high-quality development in the Yellow River Basin. Carbon emission at county level research can provide more accurate theoretical support for collaborative governance and sustainable development of the Yellow River Basin. Spatial panel model, spatial autocorrelation analysis and spatial Markov chain with regional background and nearest neighbor as spatial lags were used to analyze the spatiotemporal pattern and spatial effect of carbon emissions in counties of the Yellow River Basin from 2000 to 2017, the results showed that: 1) the carbon emission in the Yellow River basin has increased dramatically since 2000; the high carbon emissions areas, Shandong province and the boundary between Shaanxi, Gansu, Ningxia and Inner Mongolia, expands to the outer circle layer and the axial direction, forming the spatial pattern of high in the east and low in the west; 2) there is a phenomenon of “club convergence”; the high carbon emission counties converge in Shandong province and the boundary between Shaanxi, Gansu, Ningxia and Inner Mongolia; the low carbon emission counties converge in the southwest; the comparison between 2000 and 2017 shows that county carbon emission type has strong stability; counties which tranfered from higher carbon emission type to lower carbon emission type are concentrated in the southeast region, while counties that change in the opposite direction are concentrated in Inner Mongolia. 3) high carbon spillover effect and low carbon locking effect are important forces to shape the spatiotemporal pattern and the former is stronger; the regional background enhances “club convergence” and the convergence of surrounded outliers and its acting force was stronger than the nearest neighbor; the probability of carbon emission type transition in insignificant regions increased; 4) the spatial panel model shows that increase of carbon emissions and its spatial effect are promoted by young population structure, large economy, industrial structure dominated by the secondary industry, high living standard and high public expenditure; economy and industrial structure are important driving factors.
黄河流域县域碳排放的时空格局演变及空间效应机制
DOI:10.13249/j.cnki.sgs.2021.08.003
[本文引用: 2]
利用空间面板模型、空间自相关分析和以区域背景与最近邻状况为空间滞后的空间马尔科夫链对2000—2017年黄河流域县域碳排放时空格局与空间效应进行分析,结果表明:① 2000年以来黄河流域碳排放量激增,由山东全域和陕甘宁蒙交界的高值区向外圈层与轴向扩张,形成东高西低碳排放格局;② 存在“俱乐部趋同”现象,高碳排放县集聚于山东全域和陕甘宁蒙交界,低碳排放县集聚于西南部;2000年与2017年对比发现县域碳排放类型稳定性强,较高碳排放变为较低碳排放的县集中在东南部区域,而相反方向转变的县集中在内蒙古;③ 高碳溢出效应与低碳锁定效应是塑造时空格局的重要作用力,前者作用力更强;区域背景增强了“俱乐部趋同”与被包围异常值趋同,作用力强于最近邻状况,不显著区域内碳排放类型转变概率提高。④ 空间面板模型结果显示年轻人口结构、大经济规模、二产为主产业结构、高生活水平和高公共支出促进了碳排放量增加与空间效应作用,其中经济规模与产业结构是重要驱动因素。
The drivers of energy-related CO2 emissions in Brazil: A regional application of the STIRPAT model
DOI:10.1007/s11356-021-14097-w URL [本文引用: 1]
Provincial energy efficiency of China quantified by three-stage data envelopment analysis
DOI:10.1016/j.energy.2018.10.063 URL [本文引用: 1]
Is the development of Chinese service industry definitely green? Based on analysis of environmental total factor efficiency of service industry
服务业发展是绿色的吗? 基于服务业环境全要素效率分析
New provincial CO2 emission inventories in China based on apparent energy consumption data and updated emission factors
DOI:10.1016/j.apenergy.2016.03.073 URL [本文引用: 1]
Dynamic evolution of China's agricultural carbon emission intensity and carbon offset potential
中国农业碳排放强度动态演进及碳补偿潜力
The space-time transition characteristics and its driving mechanism of county-scale inbound tourism in Zhejiang province
DOI:10.11821/dlyj201606014
[本文引用: 1]
County-scale tourism has been recognized as one of the important base units that supports the tourism industry development in China and has also been regarded as the new direction of inbound tourism in the future. The lack of research on county-scale inbound tourism hinders people's cognition and attention to the development in small scale inbound tourism destination. With the help of ESTDA analytical framework and spatial variation function, the spatial correlation characteristics of county-scale inbound tourism in counties of Zhejiang province are simulated. Then the space-time evolution characteristics and types of inbound tourism are measured in each county by means of LISA time path and the space-time transition. In this way, nesting the quantile regression model and space-time evolution type is achieved, which also promotes the construction of space-time transition driving mechanism model. The result shows that the county-scale inbound tourism in Zhejiang has the obvious feature of spatial aggregation—with Hangzhou playing a dominant role. Moreover, the spatial self-organizing feature is increasingly reinforced while its spatial differences are gradually lessened, the latter of which can be reflected at the local level. On the one hand, the revolution pattern of county-scale inbound tourism in this province is feature by significantly positive space integration; on the other hand, there is a degree of transfer inertia between counties. Apart from that, it is shown that the inbound tourism of the backward counties located in the northwest and southeast parts has a relatively dynamic local spatial feature. To be more specific, Changshan county has the most significant volatility in the spatial dependence while the Daishan county has the best stability. In addition, the space-time transition driving patterns of county-scale inbound tourism in Zhejiang are divided into four categories (driving the industry-structure driving pattern, the economy-service restriction modes, the trade-industry driving pattern and the location-resource restriction modes), which present an obvious evolution process which starts from synthetic development and then gradually turns into synthetic restriction from northeast to southwest area. There are less driving areas and more restricted areas at low quantile level, while more driving areas and less restricted areas at high quantile level. And the four main patterns imply different influence mechanisms.
浙江省县域入境旅游时空跃迁特征及驱动机制
DOI:10.11821/dlyj201606014
[本文引用: 1]
县域旅游是支撑中国旅游产业发展的重要基础单元,也是未来入境旅游发展的新方向,当下对县域入境旅游研究的缺失阻碍着对小尺度入境旅游地发展的认知和重视。以浙江省县域为研究对象,借助空间变差函数模拟了浙江县域入境旅游空间格局的演变特征。进一步通过LISA时间路径、时空跃迁测度了各县市入境旅游时空跃迁特征及类型,并将分位数回归与时空跃迁类型相嵌套,建立了四种时空跃迁驱动机制模式。结果表明:浙江省县域入境旅游具有明显的空间集聚特征,“一杭独大”特征显著,且空间自组织性逐年增强,区域入境旅游核心县市扩散效应不断增加,核心县市辐射区域差异逐渐缩小,空间差异主要体现在局部方向;浙江省县域入境旅游空间格局的演化具有较强的正向空间整合性,县域类别之间存在一定的转移惰性,东南—西北区域的入境旅游落后县市具有相对动态的局部空间特征,常山县在空间依赖方向上具有最大的波动性,岱山县在空间依赖方向上具有最大的稳定性;产业—结构驱动、经济—服务制约、贸易—产业驱动、区位—资源制约四种驱动模式呈现出自东北至西南逐渐由同向发展到同向制约的演化过程,此外四种模式背后隐含着不同的影响机理。
The spatiotemporal pattern evolution and influencing factors of CO2 emissions at the county level of China
DOI:10.11821/dlxb202112016
[本文引用: 2]
County is the pivotal platform and region unit to realize the new-type urbanization. The study of county-level CO2 emissions is of great significance to improve China's urbanization strategy, accelerate the achievement of ecological civilization and low-carbon transformation. Based on the data of China's county-level CO2 emissions from 2000 to 2017, this paper analyzed the overall tendency, regional differences, spatiotemporal pattern and agglomeration characteristics of per capita CO2 emissions. Meanwhile, under the STIRPAT model and EKC hypothesis, this study employed the panel quantile regressions to explain the dynamic impact of socio-economic development on per capita CO2 emissions. The main conclusions show that: (1) China's county-level CO2 emissions show an increasing trend of rapid growth followed by slow growth. The regional disparity of per capita CO2 emissions is distinct and shows a more uneven trend. (2) On the whole, China's county-level CO2 emissions present a spatial pattern of "high in the north and low in the south". The per capita CO2 emissions level in economically developed areas is much higher than that in other areas, thus brings about an obvious spatial polarization effect. (3) There is a significant positive spatial correlation of per capita CO2 emissions within counties. The number of counties with High-High concentration gradually increases and the distribution center gradually moves to Northwest China, while the number of Low-Low concentration counties decreases continuously and they were mainly distributed in the central and southern regions. The agglomeration type of county-level per capita CO2 emissions presents a spatial locking effect. (4) Population density and government expenditure have an inhibitory effect on county-level per capita CO2 emissions, while the scale of secondary industry output value and carbon emission intensity have significant promotive influence. And there is an inverted "N-shaped" relationship between economic development and per capita CO2 emissions in the counties with low- and middle-level emissions. The adjustment of socio-economic development structure plays a critical role in achieving China's total CO2 emission reduction target. Therefore, the policy makers of emission reduction strategy should consider the regional disparity to realize the development and transformation of backward counties. And the key urban agglomerations should play a leading role in carbon emission reduction simultaneously. In addition, improving energy use efficiency through technological innovation should be the key way to the reduction of carbon emissions in China's counties at the present stage.
中国县域碳排放的时空演变及影响因素
DOI:10.11821/dlxb202112016
[本文引用: 2]
县域是实现新型城镇化的重要平台和关键地域单元,揭示县域碳排放的时空格局演变及其驱动因素对于完善中国新型城镇化战略和促进生态文明建设、绿色转型发展具有重要意义。本文使用2000—2017年中国县域碳排放数据,分析了县域人均碳排放的总体变化、区域差异、时空格局及集聚特征,并在STIRPAT模型和环境库茨涅茨曲线(EKC)假说下,运用面板分位数回归解释社会经济发展对县域人均碳排放的动态影响。结果表明:① 中国县域人均碳排放呈现先急后缓的增长趋势。人均碳排放水平差异加大,且呈上升趋势,西部地区县域人均碳排放差距悬殊。② 县域人均碳排放总体上呈现“北高南低”的空间格局,经济发达地区的人均碳排放远高于其他地区,空间极化效应明显。③ 县域人均碳排放具有显著的空间正相关性,高—高集聚的区县数量逐渐增多且分布重心向西北移动,而低—低集聚的区县数量不断减少,主要集中于中南地区,县域人均碳排放集聚类型具有空间锁定效应。④ 人口密度、政府财政支出对县域人均碳排放具有抑制作用,第二产业产值规模、碳排放强度则存在显著的正相关性,中低碳排放水平区县的经济发展和人均碳排放之间呈现倒“N”型曲线关系,社会经济发展结构的调整是实现整体碳减排的关键。因此,政府减排策略的落实应考虑区县碳排放的阶段性差异,实现落后地区发展和转型“两手抓”的同时发挥重点城市群、都市圈在碳减排中的先导作用。此外,通过技术创新提高能源利用效率应作为现阶段县域碳减排的主要手段。
Regional inequality, spatial spillover effects and influencing factors of China's city-level energy-related carbon emissions
DOI:10.11821/dlxb201803003
[本文引用: 3]
Carbon emissions are increasing due to human activities related with the energy consumptions for economic development. Thus, attention has been paid to the reduction of the growth of carbon emissions and formulation of policies for addressing climate change. Although most studies have explored the driving forces behind carbon emissions in China, literature lacks studies at the city-level due to a limited availability of statistics on energy consumptions. In this study, based on China's city-level remote sensing carbon emissions from 1992 to 2013, we applied the spatial autocorrelation, spatial Markov-chain transitional matrices, dynamic spatial panel model and Sys-GMM to empirically estimate the key determinants of carbon emissions at the city-level and discuss its spatial spillover effects in consideration of spatiotemporal lag effects and different geographical and economic weighting matrices. Results indicated that the regional inequalities of city-level carbon emissions decreased over time and presented an obvious spatial spillover effect and high-emission "club" agglomeration. In addition, the evolution of the emission pattern has the characteristic of obvious path dependence. Panel data analysis results indicated that there was a significant U-shaped curve that can reflect the relationship between carbon emissions and GDP per capita. In addition, carbon emissions per capita are increasing with economic growth for most cities. High-proportion of secondary industry and extensive growth of investment exerted significantly positive effects on China's city-level carbon emissions. Conversely, rapid population agglomeration, the improvement of technology level, the increase of trade openness and road density play an inhibiting role in carbon emissions. Therefore, in order to reduce carbon emissions, the Chinese government should inhibit the effects of promotion factors and enhance the effects of mitigation factors. Combining with the analysis of results, we argued that optimizing the industrial structure, streamlining the extensive investment, increasing the level of technology and improving the road accessibility are the effective ways to increase energy savings and reduce carbon emissions in China.
中国城市能源消费碳排放的区域差异、空间溢出效应及影响因素
DOI:10.11821/dlxb201803003
[本文引用: 3]
基于1992-2013年中国城市遥感模拟反演碳排放数据,采用空间自相关、空间马尔科夫矩阵和动态空间面板数据模型,在同时考虑碳排放的时空滞后效应和不同地理经济空间权重矩阵的条件下,对城市碳排放的演化路径和关键影响因素进行了定量识别和减排政策探讨。研究表明,中国城市能源消费碳排放的区域差异正逐步缩小,空间上呈现出明显的高排放俱乐部集聚特征,同时碳排放类型演化具有明显的路径依赖特征;面板数据模型估计结果表明经济增长与人均碳排放呈现显著的倒“U”型曲线关系,而绝大多数城市的人均碳排放处于随经济发展而增加的阶段,二产偏重的经济结构和投资的粗放增长共同正向作用于城市碳排放,而人口的集聚效应、技术水平的提升、对外开放度和公路运输强度的增加则共同抑制城市碳排放水平的提高。因此未来要抑制促增因素和发挥促降因素的作用才能有效降低城市碳排放;优化产业结构、精简粗放投资、增加研发强度以及提升公路通达性是未来实现中国城市节能减排的有效途径。
Can technological advance improve energy effect: A empirical study based on industrial sectors in China
技术进步能提高能源效率吗? 基于中国工业部门的实证检验
Total factor productivity growth in the service industry in China under environmental constrains
环境约束下的中国服务业全要素生产率增长
Structural differences and influencing factors of green development of China's service industry green technical efficiency measurement based on Bootstrap-DEA model
中国服务业绿色发展的结构性差异及影响因素研究: 基于Bootstrap-DEA模型的绿色技术效率测度
