

1 引言
控制农业源非二氧化碳温室气体排放有利于中国全面落实温室气体减排政策与行动,对提升中国应对气候变化的国际形象,推动农业可持续发展具有重要意义。工业革命以来,约有35%的温室气体辐射强迫源自非二氧化碳温室气体排放[1],非二氧化碳温室气体的减排对于全球应对气候变化、实现净零排放同样不容忽视。目前农业活动排放了全球约40%的甲烷(CH4)和约60%氧化亚氮(N2O),农业源非二氧化碳温室气体占全球人为温室气体排放总量的10%~12%[2],且这一比例正在逐年递增[3]。IPCC第六次评估第一工作组报告(AR6 WGⅠ)指出,当前大气CH4水平比过去80万年中的任何时候都要高,远远高于AR5中列出的安全限值,并首次用一整章篇幅讨论CH4等“短期气候因素”对于气候变化的影响[4]。在中国,农业是重要的非二氧化碳温室气体排放来源。中国“十四五”规划和2035年远景目标纲要指出,要加大甲烷等其他温室气体控制力度。根据FAOSTAT的数据(
目前,农业源非二氧化碳温室气体核算、减排以及情景模拟研究已经引起了全球学者和决策者的广泛关注。现有研究表明,由于区域间农业结构和发展阶段存在差异,不同区域农业源非二氧化碳温室气体排放类型与来源差异很大[8-9]。农业源非二氧化碳温室气体评估方法主要包括生命周期评估(Life Cycle Assessment, LCA)方法[10-11]、Meta分析方法[12-13]、脱氮分解模型(Denitrification-Decomposition, DNDC)14-15]、可计算一般均衡模型(Computable General Equilibrium model, CGE)[16-17]、IPCC排放系数法[18-19]等。其中,IPCC排放系数法对于不同区域具有较强的适应性[20],联合国粮农组织(FAO)、世界银行(WB)、世界资源研究所(WRI)、全球大气研究排放数据库(EDGAR)等机构和数据库均选用此方法编制农业非二氧化碳温室气体排放清单[21]。
农业源非二氧化碳温室气体未来情景模拟预测方面,已有学者在系统测算农业温室气体排放总量的基础上,通过分解农业温室气体排放制约因素,探索非二氧化碳温室气体未来情景,为农业源非二氧化碳温室气体未来减排研究奠定了一定基础[22⇓-24]。研究表明,若要实现2 ℃升温阈值目标,在2030年以前全球需要至少每年减少1 Gt CO2-eq的农业源非二氧化碳温室气体排放[25]。采取具有成本效益的农业、畜牧业等行业减缓情景 (CH4氧化、牲畜生产力提升、氟化物监测回收等)下,中国非二氧化碳温室气体的排放将在2036年前后达到峰值[26]。此外,秸秆还田[27]、退耕还林还草[28]、增加能源作物产量[29]等情景将有效抵消农业温室气体排放。征收碳税也将有效减少非二氧化碳温室气体排放,但政策效率在高碳税和低碳税间差异不大[30]。总的来看,相比于单一措施情景而言,多措并举的复合情景是减少温室气体排放的有效手段[31]。
农业源非二氧化碳温室气体与全球气候变化紧密相关,具有巨大的减排潜力,但目前国内外相关研究鲜有关注农业源非二氧化碳温室气体排放强度时空演化特征,主要围绕农业源非二氧化碳温室气体的单一措施情景模拟开展,并未结合区域特征制定不同的未来发展情景,难以充分服务于农业源非二氧化碳温室气体减缓路径与适应策略的制定,仍存在一定的局限性。因此,本文基于环境与经济发展的时空耦合视角,分析中国2000—2019年农业源非二氧化碳温室气体排放与强度时空格局演变特征,解析各地区农业源非二氧化碳温室气体排放影响机理并模拟未来排放情景,直接指导农业源非二氧化碳温室气体未来减排策略的提炼,对于把握现阶段中国农业转型过程,探索农业绿色发展路径,推动“双碳”目标实现具有重要意义。
2 研究方法与数据
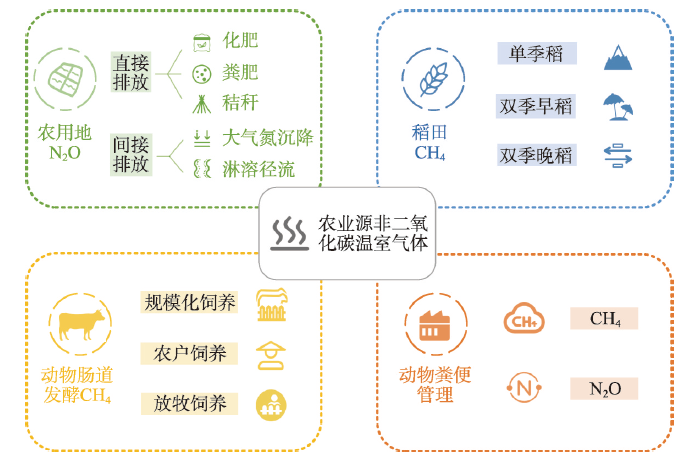
农业源非二氧化碳温室气体主要包括4个部分:一是农用地N2O排放,二是稻田CH4排放,三是动物肠道发酵CH4排放,四是动物粪便管理CH4和N2O排放(图1)。农用地N2O排放包括两部分:直接排放和间接排放,其中直接排放又分为化肥排放、粪肥排放和秸秆排放,间接排放则包括大气氮沉降引起的和由淋溶径流引起的N2O间接排放;稻田CH4排放类型按照播种时间分为单季稻、双季早稻、双季晚稻3类;动物肠道发酵CH4排放根据饲养方式分为规模化饲养、农户饲养和放牧饲养3类来源;动物粪便管理排放分为粪便中的有机物在贮存和处理过程中厌氧环境下产生的CH4排放和氮在硝化或反硝化过程中的产生的N2O排放两类。
图1
2.1 农业源非二氧化碳温室气体排放核算模型
本文采用IPCC排放系数法核算各省(市、区)农业源非二氧化碳温室气体排放量。排放因子参考《IPCC 2006年国家温室气体清单指南2019修订版》和国家发改委《省级温室气体清单编制指南(试行)》公布的数据,如公式(1)所示。
式中:E表示农业源非二氧化碳温室气体排放总量(以CO2-eq计);Ei表示各来源农业源非二氧化碳温室气体排放量;EFi和ai分别表示各来源农业源非二氧化碳温室气体排放因子和活动量;x为N2O和CH4的全球增温潜势(GWP100)换算因子。IPCC国家温室气体清单指南指出,100年时间尺度上,对于CH4,x = 27.9;对于N2O,x = 273。采用自然断点法对各省(市、区)农业源非二氧化碳温室气体排放量进行分级。
2.1.1 农用地N2O排放核算方法
农用地N2O排放包括直接和间接排放两部分。农用地N2O直接排放包括含氮化肥、粪肥和秸秆还田产生的排放。由于农业生产中化肥施用量远高于粪肥[32],且粪肥施用量数据难以统计,因此仅考虑含氮化肥和秸秆还田产生的农用地N2O直接排放,公式如下:
式中:N2O直接表示农用地N2O直接排放量;N化肥表示化肥(氮肥和复合肥)中的氮输入量;N秸秆表示秸秆还田(地上秸秆还田氮和地下根氮)氮输入量;EF直接表示农用地N2O直接排放因子(表1)。
表1 农用地N2O直接排放因子(kg N2O-N/kg N)
Tab. 1
| 区域 | EF直接 | 范围 |
|---|---|---|
| 内蒙古、新疆、甘肃、青海、西藏、陕西、山西、宁夏 | 0.0056 | 0.0015~0.0085 |
| 黑龙江、吉林、辽宁 | 0.0114 | 0.0021~0.0258 |
| 北京、天津、河北、河南、山东 | 0.0057 | 0.0014~0.0081 |
| 浙江、上海、江苏、安徽、江西、湖南、湖北、四川、重庆 | 0.0109 | 0.0026~0.022 |
| 广东、广西、海南、福建 | 0.0178 | 0.0046~0.0228 |
| 云南、贵州 | 0.0106 | 0.0025~0.0218 |
注:数据来源于文献[
其中,秸秆还田氮输入量计算公式如式(3):
式中:N秸秆表示秸秆还田氮;j表示第j类农作物;Mj表示作物籽粒产量;Lj表示作物的经济系数;βj表示作物的秸秆还田率;Kj表示作物的秸秆含氮率;αj表示作物的根冠比。考虑到数据的可获取性,参考国家统计局(
表2 主要农作物参数
Tab. 2
| 农作物类别 | 籽粒含氮率 | 秸秆含氮率 | 经济系数 | 根冠比 | 秸秆还田率[34⇓-36] |
|---|---|---|---|---|---|
| 水稻 | 0.01 | 0.00753 | 0.489 | 0.125 | 0.323 |
| 小麦 | 0.014 | 0.00516 | 0.434 | 0.166 | 0.765 |
| 玉米 | 0.017 | 0.0058 | 0.438 | 0.17 | 0.093 |
| 高粱 | 0.017 | 0.0073 | 0.393 | 0.185 | 0.04 |
| 大豆 | 0.06 | 0.0181 | 0.425 | 0.13 | 0.093 |
| 麻类 | 0.0131 | 0.0131 | 0.83 | 0.25 | 0.093 |
| 薯类 | 0.004 | 0.011 | 0.667 | 0.05 | 0.3992 |
| 油菜籽 | 0.00548 | 0.00548 | 0.271 | 0.15 | 0.6185 |
| 蔬菜类 | 0.008 | 0.008 | 0.83 | 0.25 | 0.6185 |
| 烟叶 | 0.041 | 0.0144 | 0.83 | 0.2 | 0.6185 |
农用地N2O间接排放来自施肥土壤和禽畜粪便氮氧化物(NOx)和氨(NH3)挥发经过大气氮沉降引起的N2O排放(N2O沉降)以及土壤氮淋溶或径流损失进入水体而引起的N2O排放(N2O淋溶)。其中,大气氮沉降引起的N2O排放计算公式如式(4):
式中:N禽畜表示禽畜粪便的氮输入量;N输入表示农用地氮输入量。根据《省级温室气体清单编制指南(试行)》,N禽畜和N输入的挥发率推荐值分别为20%和10%,排放因子为0.01。
淋溶径流引起的N2O排放计算公式如式(5):
式中:N2O淋溶表示淋溶径流引起的N2O间接排放;氮淋溶和径流损失的氮量占农用地氮输入量的20%来估算;淋溶径流引起的氧化亚氮排放因子为0.0075。
2.1.2 稻田CH4排放核算方法
稻田CH4排放主要是由于稻田因淹水厌氧发酵产生的CH4排放,计算方法如下:
式中:
表3 稻田CH4排放因子(kg/hm2)
Tab. 3
| 地区 | 单季稻 | 双季早稻 | 双季晚稻 |
|---|---|---|---|
| 华北 | 234.0 | - | - |
| 东北 | 168.0 | - | - |
| 华东 | 215.5 | 211.4 | 224.0 |
| 华中、华南 | 236.7 | 241.0 | 273.2 |
| 西南 | 156.2 | 156.2 | 171.7 |
| 西北 | 231.2 | - | - |
2.1.3 动物肠道发酵CH4排放核算方法
动物肠道发酵CH4排放是由于动物消化道内饲料被寄生的微生物发酵,并由动物口、鼻和直肠排出体外的CH4,不包括粪便的CH4排放。动物肠道发酵CH4排放源包括奶牛、非奶牛、水牛、山羊、绵羊、猪、马、驴、骡和骆驼,计算公式如下:
式中:
表4 动物肠道发酵CH4排放因子(kg/(头 a))
Tab. 4
| 饲养方式 | 奶牛 | 非奶牛 | 水牛 | 绵羊 | 山羊 | 猪 | 马 | 驴/骡 | 骆驼 |
|---|---|---|---|---|---|---|---|---|---|
| 规模化饲养 | 88.1 | 52.9 | 70.5 | 8.2 | 8.9 | 1 | 18 | 10 | 46 |
| 农户散养 | 89.3 | 67.9 | 87.7 | 8.7 | 9.4 | ||||
| 放牧饲养 | 99.3 | 85.3 | - | 7.5 | 6.7 |
2.1.4 动物粪便管理温室气体排放核算方法
动物粪便管理排放包括CH4和N2O排放两部分。其中,CH4排放是指在畜禽粪便施入到土壤之前动物粪便贮存和处理所产生的CH4、N2O排放是指施入土壤前存储及处理所产生的N2O,排放源包括奶牛、非奶牛、水牛、山羊、绵羊、猪、马、驴、骡和骆驼,计算公式如式(8):
式中:
表5 动物粪便管理温室气体排放因子(kg/(头 a))
Tab. 5
| 动物 类型 | 华北 | 东北 | 华东 | 华中、华南 | 西南 | 西北 | |||||||||||
|---|---|---|---|---|---|---|---|---|---|---|---|---|---|---|---|---|---|
| CH4 | N2O | CH4 | N2O | CH4 | N2O | CH4 | N2O | CH4 | N2O | CH4 | N2O | ||||||
| 奶牛 | 7.46 | 1.846 | 2.23 | 1.096 | 9.33 | 2.065 | 8.45 | 1.710 | 6.51 | 1.884 | 5.93 | 1.447 | |||||
| 非奶牛 | 2.82 | 0.794 | 1.02 | 0.913 | 3.31 | 0.846 | 4.72 | 0.805 | 3.21 | 0.691 | 1.86 | 0.545 | |||||
| 水牛 | - | - | - | - | 5.55 | 0.875 | 8.24 | 0.860 | 1.53 | 1.197 | - | - | |||||
| 绵羊 | 0.15 | 0.093 | 0.15 | 0.057 | 0.26 | 0.113 | 0.34 | 0.106 | 0.48 | 0.064 | 0.28 | 0.074 | |||||
| 山羊 | 0.17 | 0.093 | 0.16 | 0.057 | 0.28 | 0.113 | 0.31 | 0.106 | 0.53 | 0.064 | 0.32 | 0.074 | |||||
| 猪 | 3.12 | 0.227 | 1.12 | 0.266 | 5.08 | 0.175 | 5.85 | 0.157 | 4.18 | 0.159 | 1.38 | 0.195 | |||||
| 家禽 | 0.01 | 0.007 | 0.01 | 0.007 | 0.02 | 0.007 | 0.02 | 0.007 | 0.02 | 0.007 | 0.01 | 0.007 | |||||
| 马 | 1.09 | 0.330 | 1.09 | 0.330 | 1.64 | 0.330 | 1.64 | 0.330 | 1.64 | 0.330 | 1.09 | 0.330 | |||||
| 驴/骡 | 0.6 | 0.188 | 0.6 | 0.188 | 0.9 | 0.188 | 0.9 | 0.188 | 0.9 | 0.188 | 0.6 | 0.188 | |||||
| 骆驼 | 1.28 | 0.330 | 1.28 | 0.330 | 1.92 | 0.330 | 1.92 | 0.330 | 1.92 | 0.330 | 1.28 | 0.330 | |||||
注:数据来源于文献[
2.2 农业源非二氧化碳温室气体排放强度核算方法
本文核算了两类排放强度(GHGI),即单位农业增加值排放强度(GHGI1)和单位农地面积排放强度(GHGI2),计算公式分别为:
式中:GHGI1,j和GHG2,j分别为区域j的单位农业增加值排放强度(t CO2-eq/万元)和单位农地面积排放强度(kg CO2-eq/km2);Ej为农业源非二氧化碳温室气体排放量;Gj为区域j的农业增加值;Aj为区域j的农地面积,即耕地面积加牧草地面积。采用自然断点法对各省(市、区)农业源非二氧化碳温室气体排放强度进行分级。
2.3 农业源非二氧化碳温室气体排放情景预测模型
可拓展的随机环境影响评估(Stochastic Impacts by Regression on Population, Affluence, and Technology, STIRPAT)模型能够对人口、经济、技术与环境之间的关系进行评估,能够应用于温室气体排放未来预测[37]。STIRPAT模型的基本形式为:
式中:I、P、A、T分别表示环境状况、人口、经济发展和技术进步;b、c、d分别为3个驱动因素的弹性系数,a为常数项,
本文中环境状况(I)具体指农业源非二氧化碳温室气体排放。人口规模的扩大和收入水平的增加将改变农产品需求,进而可能引起农业温室气体排放的变化。此外,城镇化水平、农业机械化水平、农业生产稳定程度以及农村经济发展规模都将对农业生产结构和生产效率产生影响,并最终影响农业源非二氧化碳温室气体排放。因此,农业源非二氧化碳温室气体排放量的变化是人口规模、人均收入水平、农业生产技术以及城镇化水平共同作用的结果,参考李阳等的研究[38],引入农业机械化水平、农业有效灌溉面积、农业总产值、农村人口规模等要素对STIRPAT模型进行拓展,具体形式如式(13)所示:
式中:P表示人口规模;A表示人均GDP,反映人均收入水平;T表示农业机械总动力,反映农业机械化水平;G表示农业有效灌溉面积,反映农业生产经营状况和稳定程度;AG表示农业总产值,反映农村经济发展规模;RP表示农村人口规模,反映城镇化水平。
为了验证中国农业源非二氧化碳温室气体环境库兹涅兹曲线(Environmental Kuznets Curve, EKC)是否存在,本文将人均GDP的二次项和三次项引入模型,探究人均GDP与农业源非二氧化碳温室气体排放之间的“U”型和“N”型关系。具体模型如式(14)所示:
基于文献调研、政策文件和既有数据变化率设置低、中、高3种变化等级(表6),将2000—2019年数据代入STIRPAT模型进行分析,根据区域特征设定情景组合,并将拟合结果作为基准模型,预测2020—2050年各地区农业源非二氧化碳温室气体排放情况。
表6 各因素变化率设定
Tab. 6
| 变量 | 时段 | 变化等级(%) | 数据来源 | ||
|---|---|---|---|---|---|
| 低 | 中 | 高 | |||
| 人口规模 | 2020—2030 | 0.50 | 1.00 | 1.50 | [37] |
| 2031—2040 | 0.10 | 0.60 | 1.10 | ||
| 2041—2050 | -0.30 | 0.20 | 0.70 | ||
| 人均GDP | 2020—2030 | 2.50 | 3.50 | 5.50 | [39] |
| 2031—2040 | 2.00 | 3.00 | 4.50 | ||
| 2041—2050 | 1.50 | 2.50 | 3.50 | ||
| 农业机械化 | 2020—2030 | 3.00 | 3.50 | 4.00 | [40] |
| 2031—2040 | 2.50 | 3.00 | 3.50 | ||
| 2041—2050 | 2.00 | 2.50 | 3.00 | ||
| 有效灌溉面积 | 2020—2030 | 0.07 | 0.10 | 0.13 | 统计数据拟合 |
| 2031—2040 | 0.10 | 0.13 | 0.16 | ||
| 2041—2050 | 0.15 | 0.18 | 0.21 | ||
| 农业产值 | 2020—2030 | 2.90 | 3.30 | 3.40 | [41] |
| 2031—2040 | 3.10 | 3.50 | 3.60 | ||
| 2041—2050 | 3.20 | 3.60 | 3.70 | ||
| 农村人口 | 2020—2030 | -2.00 | -3.50 | -5.00 | [37] |
| 2031—2040 | -1.00 | -2.00 | -3.50 | ||
| 2041—2050 | -0.50 | -0.50 | -2.00 | ||
2.4 数据来源
本文所采用的各类型水稻播种面积数据来源于《中国农业年鉴》《中国农村统计年鉴》以及地方统计年鉴;动物存栏量、化肥施用量数据来自《中国统计年鉴》《中国农业年鉴》《中国畜牧业年鉴》和地方统计年鉴;耕地面积和牧草地面积来自《中国国土资源年鉴》《中国环境年鉴》。
3 结果分析
3.1 农业源非二氧化碳温室气体排放时空格局演变
中国农业源非二氧化碳温室气体排放量相对稳定,动物肠道发酵CH4和稻田CH4是农业源非二氧化碳温室气体最主要的来源(图2)。由于大牲畜尤其是反刍动物的肠道发酵,动物肠道发酵CH4占比始终维持在47%以上。根据《省级温室气体清单编制指南》的推荐值,奶牛肠道发酵CH4排放因子为88.1 kg/(头 a)(规模化饲养状态下),为绵羊的10.74倍,猪的88倍。动物肠道发酵CH4排放量与其较大的排放因子息息相关。在2007年,由于禽流感疫情以及自然灾害(例如淮河大洪水),对畜牧业生产造成较大冲击[42],中国农业源非二氧化碳温室气体排放量经历了一次较大幅度的下降。2011年国家相继印发《全国畜牧业发展第十二个五年规划》《全国畜禽养殖污染防治“十二五”规划》《畜禽规模养殖污染防治条例》,强调推动环境友好型高效畜牧业生产[43],畜牧业非二氧化碳排放增长速度也因此放缓。近年来,由于受到猪瘟等牲畜疾病影响[44],动物肠道发酵CH4与动物粪便管理N2O排放量均有所下降。
图2
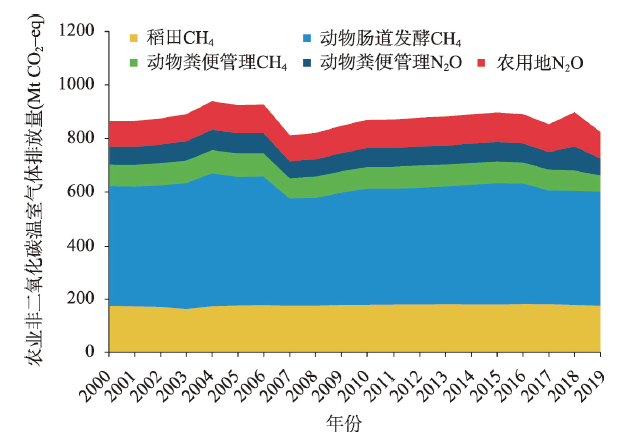
图2
2000—2019年中国农业源非二氧化碳温室气体排放量
Fig. 2
Agricultural non-CO2 greenhouse gases emissions from 2000 to 2019
2000—2019年各省与各区域农业源非二氧化碳温室气体分时段累计排放量如图3所示。农业源非二氧化碳温室气体排放时段差异相对较小,省际和区域间差异相对明显。具体来看,北京、河北、山西、浙江、安徽、福建、山东、河南、广东、广西、四川、贵州和陕西农业源非二氧化碳温室气体排放量逐时段下降。北京、天津和上海作为直辖市,城市化程度较高,农业占比较低,因此产生的排放也较少(图3a)。而在宁夏,较小的国土面积限制了农业发展规模,导致农业源非二氧化碳温室气体排放量较低。分区域来看,西南、华东和华中地区对中国农业源非二氧化碳温室气体排放贡献较大,最主要的排放区由华东转移至西南地区(图3b)。为分析农业源非二氧化碳温室气体排放来源特征时空演变状况,选取2000年、2005年、2010年、2015年、2019年5个关键时间节点,进一步讨论各省农业源非二氧化碳温室气体排放及来源类型。
图3

图3
2000—2019年各省与各区域农业源非二氧化碳温室气体分时段累计排放量
Fig. 3
Cumulative agricultural non-CO2 greenhouse gases emissions by province and by region in periods from 2000 to 2019
从时空特征来看,在保持农业源非二氧化碳温室气体排放总量相对稳定的前提下,东部沿海地区的农业源非二氧化碳温室气体排放逐渐向西部内陆地区转移(图4)。东部沿海地区经济较为发达,城镇化水平普遍较高,发展重心已由第一产业转向第二、第三产业,农业源非二氧化碳温室气体排放量普遍降低。近年来随着农业集约化发展程度加深,内陆地区农业发展增速较快,但农业现代化水平相对落后[45],导致农业源非二氧化碳温室气体排放增加。其中,内蒙古是农业源非二氧化碳温室气体排放增长最快的省,年均增长率为3.88%。四川、湖南始终是农业源非二氧化碳温室气体排放的高值区,年排放量保持在50.31 Mt CO2-eq以上。广西、河南先后退出农业源非二氧化碳温室气体高排放序列,年均下降率分别为2.88%和1.98%。
图4
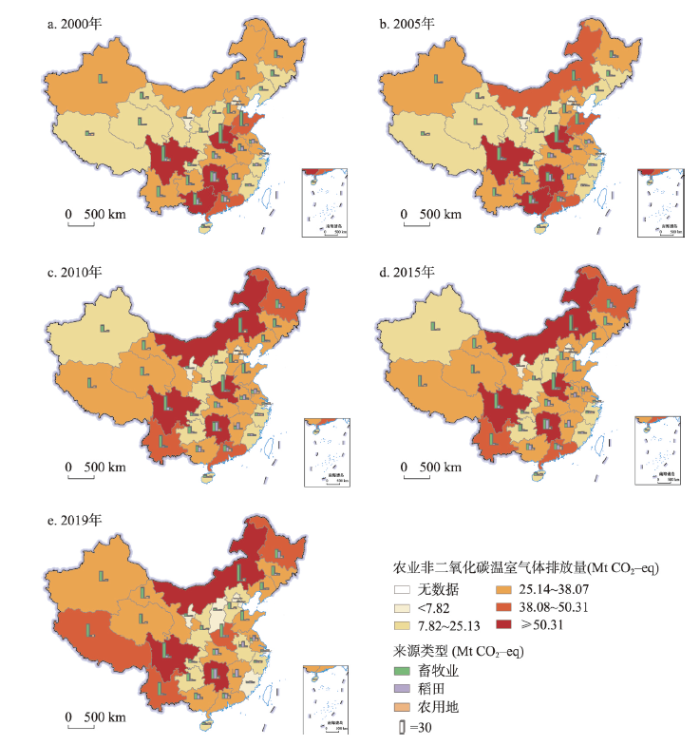
图4
2000—2019年各省份农业源非二氧化碳温室气体排放及来源类型
注:基于自然资源部标准地图服务网站GS(2019)1825号的标准地图制作,底图边界无修改。
Fig. 4
Agricultural non-CO2 greenhouse gases emissions and source types by province in 2000-2019
各省农业源非二氧化碳温室气体来源结构与当地农业特征息息相关,除西藏外变化均不显著。长江中下游地区水稻一年两熟,是重要的水稻主产区,稻田是该地区农业源非二氧化碳温室气体最主要的来源。除此之外,其他地区农业源非二氧化碳温室气体主要来源依然是畜牧业。西藏、内蒙古畜牧业非二氧化碳温室气体排放量增长较快。西藏畜牧业非二氧化碳温室气体排放占比由2000年的57.12%增长至2019年的87.01%,而在内蒙古,尽管畜牧业非二氧化碳温室气体排放量由2000年的2320.01 Mt CO2-eq增长到了2020年的4564.95 Mt CO2-eq,但对农业源非二氧化碳温室气体排放的贡献率由2000年的87.72%下降至2019年的86.97%。青海多为盐碱地,并不适合水稻种植,因此稻田的非二氧化碳温室气体排放贡献始终为0。农用地排放在各省农业源非二氧化碳温室气体排放中占比均为最小,仅有上海、浙江、海南、陕西农用地排放占比超过20%。
3.2 农业源非二氧化碳温室气体排放强度变化情况
排放强度是衡量区域农业源非二氧化碳温室气体经济效率的重要指标[46]。从单位农业增加值农业源非二氧化碳温室气体排放强度时空分布来看(图5a~5c),2000年仅有东部的辽宁、北京、天津、河北、山东、江苏、浙江、上海、福建排放强度较低,大致呈现由东到西阶梯增长的分布特征。在此之后,由于畜牧业集约化以及工业化水平的提高,中国农业源非二氧化碳温室气体排放高值区向北转移,加之这些地区经济社会发展相对缓慢,农业发展受资源环境约束严重[47],较低的农业增加值无法分担日益增长的农业源非二氧化碳温室气体排放,导致2019年单位农业增加值农业源非二氧化碳温室气体排放强度高值区集中在“胡焕庸线”西侧的农牧交错带上。此外,从天然草地到农田的土地利用转换增加了农地N2O通量,也在一定程度上影响了农牧交错带农业源非二氧化碳温室气体排放量[48]。这也在一定程度上反映了“胡焕庸线”以西地区,尤其是农牧交错带农业生产方式粗放且效率较低的问题。中国单位农地面积农业源非二氧化碳温室气体排放强度与单位农业增加值排放强度呈现截然相反的分布特征(图5d~5f)。各省单位农地面积农业源非二氧化碳温室气体排放强度大致呈现以“胡焕庸线”为界的“西低东高”分布特征,“胡焕庸线”以西均为强度低于39.22 kg CO2-eq/km2的低排放区。而在“胡焕庸线”以东,全国43%的国土面积[49]承担了全国约65%的农业源非二氧化碳温室气体排放,加之大量农业用地转化为建设用地,这也是单位农地面积排放强度高值区聚集在“胡焕庸线”以东的主要原因。
图5

图5
2000—2019年各省单位农业增加值与单位农地面积农业源非二氧化碳温室气体排放强度
注:基于自然资源部标准地图服务网站GS(2019)1825号的标准地图制作,底图边界无修改。
Fig. 5
Agricultural non-CO2 greenhouse gases emission intensity per unit of agricultural value added and per unit of agricultural land area in 2000, 2010, and 2019
2000—2019年除天津、上海外,各省非二氧化碳温室气体单位农业增加值排放强度降低(图6a)。天津、上海单位农业增加值排放强度增幅不大,分别为0.01 t CO2-eq/万元、3.57 t CO2-eq/万元。西北、西南地区农业源非二氧化碳温室气体排放在全国的占比增加,但单位增加值排放强度分别降低4.58和4.67 t CO2-eq/万元,农业发展质量有所提升。尤其是青海,单位农业增加值排放强度下降幅度最大,下降26.75 t CO2-eq/万元。图6b是各省及地区单位农地面积农业源非二氧化碳温室气体排放强度变化情况。上海单位农地面积排放强度在2000—2019年间增长166.49 kg CO2-eq/km2,增幅最大,年均增长率为3.64%,这与上海农业用地面积的大量减少有关[50]。然而,华东地区单位农地面积排放强度整体呈下降趋势。“胡焕庸线”以西各省单位农地面积排放强度均表现为增加,但增幅不大;“胡焕庸线”以东除东北三省、天津以及江苏外强度降低。
图6
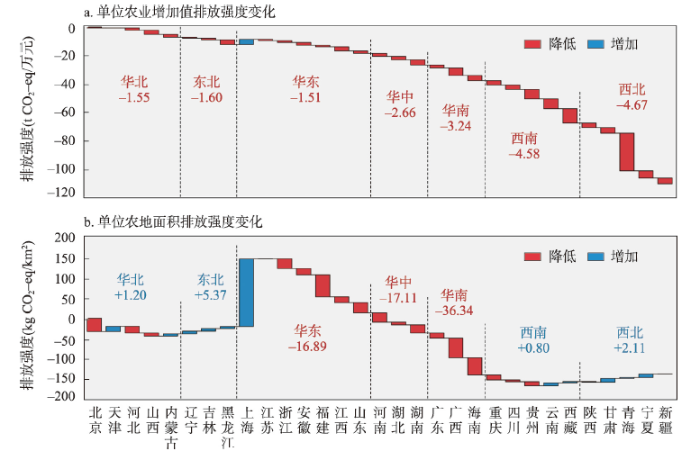
图6
2000—2019年各省份单位农业增加值与单位农地面积农业源非二氧化碳温室气体排放强度变化
Fig. 6
Variation of agricultural non-CO2 greenhouse gases emission intensity per unit of agricultural value-added and per unit of agricultural land area from 2000 to 2019
3.3 农业源非二氧化碳温室气体排放情景预测
为进一步研究中国各地区农业源非二氧化碳温室气体排放影响因素并开展情景预测,采用STRIPAT模型对各地区排放量进行分解。首先采用2000—2019年各地区面板数据对模型进行多重共线性检验,发现VIF均大于10,表明数据具有严重的多重共线性,因此选用岭回归(Ridge Regression)进行检验。基于Hausman检验,各地区p值均通过了1%水平的显著性检验,故使用固定效应的岭回归模型。STRIPAT模型回归结果如表7所示。在华北和西南地区,人口规模的增加对农业源非二氧化碳温室气体排放具有显著的正向作用,但农村人口增加所起的作用相反。农村人口的增加在华东、华南、西南地区将显著促进农业源非二氧化碳温室气体排放,然而,在城镇化率相对较高的华北地区,农村人口的增加将抑制地区农业源非二氧化碳温室气体排放。人均收入水平的增加对华北、东北、华中地区农业源非二氧化碳温室气体排放均起负向作用,在其他地区不显著。农业机械化水平的提高将显著促进华北、东北、华东以及华中地区农业源非二氧化碳温室气体排放,而在西北地区起抑制作用。
表7 STRIPAT模型回归结果
Tab. 7
| 自变量 | lnI | ||||||
|---|---|---|---|---|---|---|---|
| 华北 | 东北 | 华东 | 华中 | 华南 | 西南 | 西北 | |
| lnP | 0.9729**(2.00) | 0.3959(0.82) | 0.0438(0.17) | 0.6970(1.02) | -0.0538(-0.60) | 1.4046***(5.16) | -0.5323(-1.07) |
| lnA | -0.4615***(-2.90) | -0.1222*(-1.85) | 0.0592(1.10) | -0.3177**(-2.20) | -0.0008(-0.01) | 0.0021(1.10) | 0.2449(0.173) |
| lnT | 0.5630***(5.26) | 0.3585***(3.50) | 0.1195**(2.24) | 0.6023***(4.38) | 0.1227(0.66) | -0.0259(-0.42) | -0.2602**(-2.15) |
| lnG | 0.0169(0.09) | -0.2729***(-3.42) | -0.4589**(-2.44) | 0.3084(1.43) | 0.3706**(2.61) | 0.0205(0.33) | 0.6223***(4.46) |
| lnAG | 0.2424(1.23) | 0.2123***(3.27) | -0.3617***(-4.76) | -0.0655(-0.44) | -0.2662*(-1.54) | 0.1364(1.00) | -0.1467(-0.66) |
| lnRP | -0.6409*(-1.72) | -0.0015(-0.01) | 0.3445**(-2.30) | -0.2682(-0.80) | 0.3531***(3.43) | 0.7608***(3.51) | -0.0751(-0.29) |
| 常数项 | -4.0850(-0.91) | -0.0422(-0.01) | 17.2279***(5.04) | -0.9455(-0.15) | 7.7315***(4.44) | -2.6712***(-4.55) | 13.0838***(5.47) |
| R2 | 0.9849 | 0.9783 | 0.8262 | 0.9612 | 0.9733 | 0.9664 | 0.9567 |
注:括号内为t统计量;***、**、*分别表示在1%、5%和10%的显著性水平上显著。
在原有STRIPAT模型基础上,分别引入人均GDP的二次项和三次项,以验证农业源非二氧化碳温室气体排放与人均GDP之间的EKC关系(表8)。回归结果显示lnA、(ln A)2、(lnA)3的系数符号分别为c < 0、m > 0、n < 0,表明农业源非二氧化碳温室气体排放与人均GDP之间呈现倒“N”型曲线关系。结合2000—2019年农业源非二氧化碳温室气体排放量来看,目前中国农业源非二氧化碳温室气体排放已经越过了高峰拐点,处于下降阶段。根据EKC假说,这表明经济发展已经达到技术效应、结构效应超越规模效应的新阶段。然而,结合前文研究结果,中国各区域农业源非二氧化碳温室气体排放存在明显空间差异,且在各地区影响因素不尽相同。针对此问题,根据各地区农业源非二氧化碳温室气体排放影响因子特征设定不同情景,分别预测各地区未来农业源非二氧化碳温室气体趋势。
表8 农业源非二氧化碳温室气体EKC曲线检验
Tab. 8
| 自变量 | lnI | ||
|---|---|---|---|
| 模型(1) | 模型(2) | 模型(3) | |
| lnP | -0.3184***(-6.25) | -0.3970***(-7.17) | -0.3532***(-6.27) |
| lnA | -0.0843***(-3.09) | -0.1755***(-4.65) | -0.1415***(-3.66) |
| (lnA)2 | - | 0.03781***(3.47) | 0.0994***(4.74) |
| (lnA)3 | - | - | -0.0290***(-3.43) |
| lnT | 0.2691***(7.75) | 0.3216***(8.55) | 0.3150***(8.44) |
| lnG | 0.1252**(2.06) | 0.1236**(2.05) | 0.1045*(1.74) |
| lnAG | 0.0253(0.55) | 0.0723(1.53) | 0.0234(0.48) |
| lnRP | 0.2779***(3.321) | 0.3501***(4.08) | 0.3634***(4.27) |
| 常数项 | 5.2715***(6.19) | 4.2522***(4.76) | 4.6929***(5.25) |
| R2 | 0.6374 | 0.6422 | 0.6379 |
注:括号内为t统计量;***、**、*分别表示在1%、5%和10%的显著性水平上显著。
考虑到不同因子在不同地区的影响方向和影响程度差异,在剔除不显著的影响因子之后,在7个地区分别进行情景组合,形成基准情景、绿色发展情景和粗放发展3类情景对2020—2050年农业源非二氧化碳温室气体排放进行预测,具体情景设置如表9所示。
表9 情景设置
Tab. 9
| 地区 | 情景 | P | A | T | G | AG | RP |
|---|---|---|---|---|---|---|---|
| 华北、东北 | 粗放发展情景 | 高 | 低 | 高 | 低 | 高 | 低 |
| 绿色发展情景 | 低 | 高 | 低 | 高 | 低 | 高 | |
| 华东、华中 | 粗放发展情景 | 高 | 低 | 高 | 低 | 低 | 高 |
| 绿色发展情景 | 低 | 高 | 低 | 高 | 高 | 低 | |
| 华南、西南、西北 | 粗放发展情景 | 高 | 高 | 低 | 高 | 低 | 高 |
| 绿色发展情景 | 低 | 低 | 高 | 低 | 高 | 低 |
注:基准情景均保持中等变化速率。
基于STRIPAT模型的2020—2050年全国各地区农业源非二氧化碳温室气体排放情景预测值如图7所示。除西北地区外,其他地区农业源非二氧化碳温室气体排放均呈现绿色发展情景<基准情景<粗放发展情景的特征。基准情景下,西北地区农业源非二氧化碳温室气体排放于2040年出现最低值,随后开始增长,而在其他两种情景下始终保持下降趋势。在华北和东北地区,随着各影响因子变化放缓,排放量增速降低。华东和华南地区排放量随时间变化而降低。绿色发展情景下,华中地区农业源非二氧化碳温室气体排放量有微弱增长,其他情景下增速较快。在西南地区,绿色发展情景和基准情景下排放量呈下降趋势,但在粗放发展情景下将会增加。预测结果表明,尽管中国总体农业源非二氧化碳温室气体排放已经进入下降阶段,但分地区来看,华北、东北和华中地区农业源非二氧化碳温室气体排放仍将增长,面临一定的减排压力。根据区域特征设置合理的减排措施是实现区域农业源非二氧化碳温室气体减排的有效手段。
图7
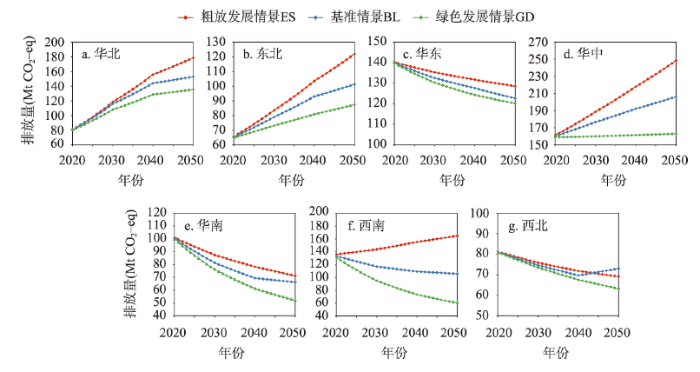
图7
各地区农业源非二氧化碳温室气体排放量情景预测
Fig. 7
Regional agricultural non-CO2 greenhouse gases emissions scenario simulation
4 结论与讨论
4.1 结论
本文基于IPCC系数法对2000—2019年中国4种来源农业源非二氧化碳温室气体排放进行了核算,分析并对比了单位农业增加值排放强度和单位农地面积排放强度时空演化规律;基于STRIPAT模型解析了人口、经济、技术因素对各地区农业源非二氧化碳温室气体的影响机理,对未来各地区排放趋势进行了情景预测,并识别了中国农业源非二氧化碳温室气体排放EKC曲线形态。本文为把握现阶段中国农业源非二氧化碳温室气体排放规律,探索未来农业源非二氧化碳温室气体减排路径提供了数据支撑和决策支持。
(1)动物肠道发酵CH4是中国最主要的农业源非二氧化碳温室气体来源,东部沿海地区的农业源非二氧化碳温室气体排放逐渐向西部内陆地区转移。中国农业源非二氧化碳温室气体排放随时间变化不明显,省际和区域间差异相对明显。四川、湖南、内蒙古对中国农业源非二氧化碳温室气体排放贡献率最高。
(2)2019年单位农业增加值排放强度与单位农地面积排放强度以“胡焕庸线”为轴对称分布。“胡焕庸线”以西地区尤其是农牧交错带上单位农业源非二氧化碳温室排放的经济效率相对较低,“胡焕庸线”以东地区单位农地面积农业源非二氧化碳温室排放强度显著高于西侧。
(3)中国农业源非二氧化碳温室气体排放与人均GDP之间呈现倒“N”型的EKC曲线关系,但各区域影响因素存在明显差异。尽管中国总体农业源非二氧化碳温室气体排放已经进入下降阶段,但华北、东北和华中地区仍面临一定的减排压力。根据区域发展特征制定合理的绿色发展情景是全面实现农业源非二氧化碳温室气体减排的关键。
4.2 讨论
畜牧业非二氧化碳温室气体排放,尤其是动物肠道发酵产生的CH4是中国农业源非二氧化碳温室气体排放最主要的来源。控制畜牧业非二氧化碳温室气体排放将是未来中国农业源非二氧化碳温室气体减排的关键。畜牧业在农业部门的温室气体减排潜力多达一半[51],对于实现1.5 ℃温控目标至关重要[2],但与发达国家相比中国畜牧业生产力仍存在一定差距[52]。基于本文的结论,动物肠道发酵CH4在中国农业源非二氧化碳温室气体排放中占比最高,是控制农业源非二氧化碳温室气体排放,缓解气候变化的有效手段[53]。具体来看,匹配饲料蛋白质含量与畜禽营养需求,提高饲料效率对于实现动物肠道发酵CH4减排将发挥至关重要的作用[54],饲料能量密度增加不到10%,就可以减少50%的畜牧业温室气体排放[55]。由于国内畜牧业生产严重依赖饲料进口,世界其他地区饲料效率的变化对中国农业源非二氧化碳温室气体排放也将产生重要影响[56]。因此,开发边际土地生产饲料,实现作物生产与畜牧业生产的有机连接也是推动农业源非二氧化碳温室气体减排的重要措施。此外,采用固液分离系统代替传统的动物粪便管理液体系统[57],通过厌氧处理、堆肥等手段实现CH4的末端处理[58]也对缓解动物肠道发酵CH4排放具有协同作用。
本文核算了2000—2019年中国农业源非二氧化碳温室气体排放并探究了其时空演变规律,进行了未来情景预测,但由于仅考虑了稻田CH4,农用地N2O、动物肠道发酵CH4、动物粪便管理CH4和N2O 4类最主要的农业源非二氧化碳温室气体来源,核算与预测数据结果可能小于真实值。在未来的研究中,应采取更为细分的来源类型和省级划分的排放系数进行核算,以期获得更为准确的结论,畜牧业、稻田非二氧化碳温室气体排放的影响机理与情景预测也值得深入探究。
参考文献
Agricultural non-CO2 emission reduction potential in the context of the 1.5 ℃ target
DOI:10.1038/s41558-018-0358-8 URL [本文引用: 2]
Global anthropogenic non-CO2 greenhouse gas emissions: 1990-2020
Long-term marginal abatement cost curves of non-CO2 greenhouse gases
Regional agricultural research in contributing to national economic development
DOI:10.11821/dlxb202012007
[本文引用: 1]

The Institute of Geographic Sciences and Natural Resources Research, Chinese Academy of Sciences (IGSNRR, CAS) is one of the research institutes that carried out the earliest regional agricultural research in China. Based on the original research laboratory on agricultural geography, under the leadership of Prof. Wu Chuanjun and Prof. Deng Jingzhong, the institute always followed the purpose of "meeting the requirements of the state, and establishing subjects by task". Based on the periodic and regional characteristics of agricultural production and development and taking full advantages of comprehensiveness and regionality of geography, it completed a series of prospective, macroscopic, strategic and leading regional agricultural research achievements, including the preliminary opinions on national agricultural regionalization, Xinjiang agricultural regionalization, etc., Those achievements have becomes classic references for regional agricultural research and provided decision support for agricultural macro-control at national and local levels. Carrying on 80 years of experience in theoretical exploration, the IGSNRR, will has constantly expanded and enriched the connotation and value of regional agricultural research based on the existing research on agricultural resources investigation and planning, agricultural ecological hydrology and climate, food production and security, cultivated land protection and management, agricultural economic management and policy innovation, sustainable development of rural regional system, etc. In addition, it will undertake an important task of serving the formulation and implementation of national strategies and leading the innovation and development of basic disciplines.
面向国民经济主战场的区域农业研究
DOI:10.11821/dlxb202012007
[本文引用: 1]
中国科学院地理科学与资源研究所作为国内开展区域农业研究最早的研究机构之一,坚持遵循“面向国家需求,以任务带学科”的宗旨,基于农业生产及发展的阶段性和地域性特点,充分发挥地理学综合性和区域性的学科优势,完成了一系列前瞻性、战略性、引领性的区域农业研究成果,包括全国农业区划初步意见、新疆地区农业区划等,不仅成为区域农业研究的经典参考,同时也为国家及地方层面农业宏观调控提供了决策支持。承载80年的理论探索与经验总结,新时期地理资源所将在现有农业资源调查与区划、农业生态水文与气候、典型区粮食生产与安全、耕地利用保护与管理、农业经济管理与政策创新、乡村地域系统可持续发展等研究领域基础上,不断拓宽与丰富区域农业研究的内涵与价值,担负起服务国家战略制定实施、引领基础学科创新发展的时代重任。
Views on agricultural green production from the perspective of system science
从系统科学视角探讨农业生产绿色转型
Structural change as a key component for agricultural non-CO2 mitigation efforts
Improving reporting of national greenhouse gas emissions from forest fires for emission reduction benefits: An example from Australia
Greenhouse gas emission of Hulunbuir family pasture sheep, based on full life-cycle analysis
基于全生命周期分析的呼伦贝尔家庭牧场肉羊温室气体排放
Influencing factors of CH4 emissions from double cropping paddy fields in Hunan Province, China based on Meta-analysis
Meta分析湖南省双季稻田甲烷排放影响因素
A global meta-analysis of crop yield and agricultural greenhouse gas emissions under nitrogen fertilizer application
Assessment of N2O emission reduction potential in greenhouse vegetable fields based on DNDC model
基于DNDC模型的设施菜地N2O减排潜力评估
Modeling CH4 and N2O emission patterns and mitigation potential from paddy fields in Shanghai, China with the DNDC model
Agricultural subsidies and global greenhouse gas emissions
Agricultural production is strongly affected by and a major contributor to climate change. Agriculture and land-use change account for a quarter of total global emissions of greenhouse gases (GHG). Agriculture receives around US$600 billion per year worldwide in government support. No rigorous quantification of the impact of this support on GHG emissions has been available. This article helps fill the void. Here, we find that, while over the years the government support has incentivized the development of high-emission farming systems, at present, the support only has a small impact in terms of inducing additional global GHG emissions from agricultural production; partly because support is not systematically biased towards high-emission products, and partly because support generated by trade protection reduces demand for some high-emission products by raising their consumer prices. Substantially reducing GHG emissions from agriculture while safeguarding food security requires a more comprehensive revamping of existing support to agriculture and food consumption.
Dynamic computable general equilibrium simulation of agricultural greenhouse gas emissions in China
Spatial and temporal characteristics of non-carbon dioxide greenhouse gas emissions from agricultural sources in the Yangtze River Economic Belt
长江经济带农业源非二氧化碳温室气体排放的时空特征
China's agricultural green total factor productivity based on carbon emission: An analysis of evolution trend and influencing factors
Developing FFCO2 emission inventory with high spatio-temporal resolution: Methodology and prospects
DOI:10.11821/dlxb202203011
[本文引用: 1]
According to the statistics of the United Nations Environment Program (UNEP), fossil fuel (FF) CO2 emission comprises a major proportion of global anthropogenic greenhouse gas emissions. The inverse modeling approach was proposed to verify the results of the traditional bottom-up inventory based on atmospheric concentration (remote sensing and ground-based measurement) in the refinement to the 2006 IPCC Guidelines for National Greenhouse Gas Inventories on the 49th IPCC Plenary Session in 2019. This approach would further promote the development of high-resolution FFCO2 emission inventory which serves as the spatially and temporally distributed form of emission inventory and the prior input data for the inverse model. This paper hereby summarized the spatial distribution and temporal disaggregation approaches of high-resolution FFCO2 emission inventory from global and national scales to a city-wide scale, and put forward the future research prospects based on the specific requirements for high-resolution emission inventories in this 2019 refinement to the IPCC Guidelines: (1) the refined IPCC methodology will help to further improve the spatial and temporal resolution and the accuracy of FFCO2 emission inventories; and the high-resolution FFCO2 emission inventory concerning indirect emissions is emerging. (2) It is a good practice to compile a high-resolution FFCO2 emission inventory with the detailed spatial and temporal information from facility-level emission data, the remote sensing images and the intelligent transportation big data, while the use of geospatial surrogate data or proxy variables, and modeling such as regression, assimilation and artificial neural network, is also necessary to improve the accuracy of the estimates both spatially and temporally when the directly applicable data are unavailable. (3) The uncertainty information of the spatial distribution and temporal disaggregation should be qualitatively or quantitatively analyzed. The atmospheric inversion verification approach, as an independent and objective accounting method, will play an important role in QA/QC and verification of the high-resolution FFCO2 emission inventory.
高时空分辨率FFCO2排放清单的构建方法及研究展望
DOI:10.11821/dlxb202203011
[本文引用: 1]
化石能源(FF)CO<sub>2</sub>排放是全球人为温室气体排放的主体,作为衔接国家排放清单和大气反演验证途径的关键环节,2019年联合国政府间气候变化专门委员会(IPCC)对《国家温室气体清单指南》进行修订,势必将推动高分辨率FFCO<sub>2</sub>排放清单的进一步规范发展。本文结合修订版指南中对于高分辨率排放清单的具体要求,从全球尺度、国家及以下尺度两个层面对高时空分辨率FFCO<sub>2</sub>排放清单的构建方法进行梳理和归纳,并对其研究趋势进行展望。① IPCC方法学的进一步修订与完善,将有助于进一步提高FFCO<sub>2</sub>排放清单的时空分辨率和精度;而构建包含间接排放的高分辨率FFCO<sub>2</sub>排放清单正在兴起。② 作为大气反演模型的先验数据,采用自下而上的部门方法,直接获取排放统计数据,是编制高分辨率FFCO<sub>2</sub>排放清单的首要途径;而通过替代变量及建模途径进行排放总量的时空分配,也是编制高分辨率FFCO<sub>2</sub>排放清单的必要手段。③ 清单的不确定性分析中,需要考虑时空分配所带来的不确定性信息;基于大气观测的反演验证途径将作为独立于排放清单的一种客观核算手段,将在清单的质量保证/质量控制与验证中发挥重要作用。
Greenhouse gas abatement in Norwegian agriculture: Costs or benefits?
Effects of straw carbon input on carbon dynamics in agricultural soils: A meta-analysis
DOI:10.1111/gcb.12517
PMID:24395454
[本文引用: 1]
Straw return has been widely recommended as an environmentally friendly practice to manage carbon (C) sequestration in agricultural ecosystems. However, the overall trend and magnitude of changes in soil C in response to straw return remain uncertain. In this meta-analysis, we calculated the response ratios of soil organic C (SOC) concentrations, greenhouse gases (GHGs) emission, nutrient contents and other important soil properties to straw addition in 176 published field studies. Our results indicated that straw return significantly increased SOC concentration by 12.8 ± 0.4% on average, with a 27.4 ± 1.4% to 56.6 ± 1.8% increase in soil active C fraction. CO2 emission increased in both upland (27.8 ± 2.0%) and paddy systems (51.0 ± 2.0%), while CH4 emission increased by 110.7 ± 1.2% only in rice paddies. N2 O emission has declined by 15.2 ± 1.1% in paddy soils but increased by 8.3 ± 2.5% in upland soils. Responses of macro-aggregates and crop yield to straw return showed positively linear with increasing SOC concentration. Straw-C input rate and clay content significantly affected the response of SOC. A significant positive relationship was found between annual SOC sequestered and duration, suggesting that soil C saturation would occur after 12 years under straw return. Overall, straw return was an effective means to improve SOC accumulation, soil quality, and crop yield. Straw return-induced improvement of soil nutrient availability may favor crop growth, which can in turn increase ecosystem C input. Meanwhile, the analysis on net global warming potential (GWP) balance suggested that straw return increased C sink in upland soils but increased C source in paddy soils due to enhanced CH4 emission. Our meta-analysis suggested that future agro-ecosystem models and cropland management should differentiate the effects of straw return on ecosystem C budget in upland and paddy soils. © 2014 John Wiley & Sons Ltd.
Effect of mid-season drainage on CH4 and N2O emission and grain yield in rice ecosystem: A meta-analysis
DOI:10.1016/j.agwat.2018.12.025 URL [本文引用: 1]
National contributions to climate change mitigation from agriculture: Allocating a global target
DOI:10.1080/14693062.2018.1430018 URL [本文引用: 1]
China's non-CO2 greenhouse gas emissions: Future trajectories and mitigation options and potential
Effects of different straw returning modes on greenhouse gas emissions and crop yields in a rice-wheat rotation system
DOI:10.1016/j.agee.2016.02.027 URL [本文引用: 1]
Characteristics of CO2 and N2O emissions under different land-use types in Loess Hilly region of China
黄土丘陵区不同土地利用类型土壤CO2、N2O通量特征
Assessment of liquid biofuel potential from energy crops within the sustainable water-land-energy-carbon nexus
Nitrogen tax and set-aside as greenhouse gas abatement policies under global change scenarios: A case study for Germany
DOI:10.1007/s10640-020-00425-0 URL [本文引用: 1]
The role of nitrogen in climate change and the impacts of nitrogen-climate interactions in the United States: Foreword to thematic issue
Decomposition of factors contributed to the increase of China's chemical fertilizer use and projections for future fertilizer use in China
我国化肥施用量持续增长的原因分解及趋势预测
Study of the status and distribution of crop straw resource in Hubei Province
湖北省主要农作物秸秆资源分布特征及还田现状
Assessment of nitrous oxide emissions from Chinese agricultural system and low-carbon measures
中国农业系统N2O排放量评估及低碳措施
Status of crop straw utilization and equipments in Shandong Province
山东省农作物秸秆利用与装备现状
DOI:10.13733/j.jcam.issn.2095-5553.2019.02.28
[本文引用: 1]
根据山东省农作物秸秆利用工作实际,阐述现阶段山东省农作物秸秆利用工作思路和现状,介绍山东省农作物秸秆利用典型案例和装备现状,指出现阶段山东省农作物秸秆利用中存在的问题,针对这些问题,提出山东农作物秸秆利用建议。
Assessment and prediction of carbon neutrality in the eastern margin ecotone of Qinghai-Tibet Plateau
青藏高原东缘生态过渡带碳中和评估与预测
Analysis of influencing factors and peak forecast of non-CO2 greenhouse gas emissions from provincial agricultural sources in China
中国省域农业源非CO2温室气体排放的影响因素分析与峰值预测
Scenario simulations for the peak of provincial household CO2 emissions in China based on the STIRPAT model
Decoupling analysis and scenario prediction of agricultural CO2 emissions: An empirical analysis of 30 provinces in China
Northward shift of historical methane emission hotspots from the livestock sector in China and assessment of potential mitigation options
DOI:10.1016/j.agrformet.2019.03.022 URL [本文引用: 1]
Classification of the coupling patterns between agricultural production system transition and their environmental effects in the plain farming regions
DOI:10.11821/dlyj020210699
[本文引用: 1]
The green transformation of agriculture has become an inevitable choice of rural vitalization and agricultural/rural reforms, and exploring the relationship between agricultural production system transition and its environmental effects is urgently needed, thus fueling the high-quality development. Based on the typological method, this paper divides the agricultural transition models into the transformation from traditional management into modern agriculture in suburban regions and the transformation from traditional management into modern intensive agriculture in exurb regions. The agricultural production patterns in plain regions can be classified into modern intensive agriculture in suburban regions, traditional management agriculture in suburban regions, modern intensive agriculture in exurb regions, and traditional management agriculture in exurb regions. Furthermore, this paper constructs an analytical framework, which takes the “the adaptive reactions of the main body-elements changes-environmental responses” as the mainline, to analyze the mechanism and characteristics of agricultural production system transition and its environmental effects from the dimensions of drawing force, supporting force and tractive force. The mechanism of the environmental effect of the transformation of the agricultural production system in the Huang-Huai-Hai Plain is the disturbance to the agricultural ecosystem by the irrational input of capital, technology, and labor under the goal of increasing production and income and the constraints of regional natural conditions. The coupling patterns of agricultural production and their environmental effects are encapsulated into modern intensive agriculture in suburban regions with severe pollution, modern intensive agriculture in suburban regions with moderate pollution, modern intensive agriculture in exurb regions with severe pollution, and modern intensive agriculture in exurb regions with moderate pollution. In light of the results, policy recommendations are provided.
平原农区农业生产系统转型及其环境效应的耦合类型划分
DOI:10.11821/dlyj020210699
[本文引用: 1]
农业绿色转型已经成为乡村振兴与农业农村深化改革的必然选择,亟待探索农区农业生产转型与其环境效应的空间分异规律与地域类型,从而推进农业的高质量发展。本文基于类型学视角采用判别法将黄淮海平原农区的农业生产类型划分为城市近郊现代集约型、城市近郊传统经营型、城市远郊现代集约型和城市远郊传统经营型。从拉力、支撑力及引导力的视角,构建以“发展主体适应-要素变化-环境响应”为主线的分析框架,解读了农业生产系统转型及其环境效应的动力机制和特征。黄淮海平原农业生产系统转型负向环境效应的形成机制为在增产增收的目标导向及区域自然条件约束下,资本、技术及劳动力的非理性投入对农业生态系统的扰动。将农业生产系统转型与环境效应的耦合类型划分为城郊现代集约高强度污染型、城郊现代集约中度污染型、城市远郊现代集约高强度污染型和城市远郊现代集约中度污染型。基于以上分析,从普适性与异质性视角提出了相应的政策启示与优化调控策略,以期实现平原农区农业生产系统的可持续健康转型。
Accounting of greenhouse gas emissions in the Chinese agricultural system from 1980-2020
中国农业系统近40年温室气体排放核算
Evaluation on the development level of agricultural and rural modernization by regions in China
中国分地区农业农村现代化发展水平评价
County-level carbon emission accounting and Major Function Oriented Zones in western regions: Taking Sichuan province as an example
西部地区县域碳排放核算及主体功能区解析: 以四川省为例
Adaptive evolution mechanism of rural human-land system in farming-and-pastoral areas of northern China
DOI:10.11821/dlxb202102017
[本文引用: 1]
The theory on the cyclic adaptaion between society and ecosystem sheds new light on the evolution and internal structure of human-land system. This paper introduces the risk index (RI) and adaptation capacity index (ACI) to evaluate the rural human-land system, and sets up an evaluation index system for the adaptability of rural human-land system, under the effects of climate change and policy implementation. On this basis, the stages, features, control factors, and evolution mechanism were examined for the adaptability of rural human-land system in Darhan Mumingan United Banner from 1952 to 2017. The main results are as follows: (1) The evolution of the rural human-land system can be divided into three stages, namely, the reorganization and rapid development stage from 1952 to 2002 (population: +260%; cultivated land area: +13%; livestock: +134%; degradated grassland area: +16.33%), the rapid to stable development stage from 2003 to 2010 (population: +2.8%; cultivated land area: -2.3%; livestock: -13.6%; degradated grassland area: -10.7%), and the stable to release stage from 2011 to 2017 (population: -2.6%; cultivated land area: -0.2%; livestock: -10.6%; degradated grassland area: -3.8%). (2) With the elapse of time, the ACI of the rural human-land system went through a slow rise (-0.016-0.031), a slow decline (0.031-0.003), and a rapid rise (0.003-0.088). In terms of space, the adaptability is high in the middle, moderate in the north, and low in the south. (3) The adaptability evolution of the rural human-land system was mainly controlled by the per-capita effective irrigation area (22.31%) and the per-capita number of livestocks (23.47%) from 1990 to 2000, the desertification area of land (25.06%) and the land use intensity (21.27%) from 2000 to 2005, and the per-capita income of farmers and herdsmen (20.08%) and the per-capita number of livestocks (18.52%) from 2010 to 2007. (4) Under the effects of climate change and policy implementation, the cyclic adaptaion of the rural human-land system was propelled by the interactions between two kinds of subjects: farmers and herdsmen, and rural communities. The interaction affects the adaptive behavior of the two kinds of subjects, which in turn drives the cyclic evolution of the system. As a result, the system structure and functions developed alternatively between coordinated and uncoordinated states. Small-scale adaptive behaviors of farmers and herdsmen have a profound impact on the evolution of rural human-land system.
北方农牧交错区人地系统演化特征与影响机理: 以内蒙古达茂旗为例
DOI:10.11821/dlxb202102017
[本文引用: 1]
社会—生态系统适应性循环理论为理解人地系统结构与功能演变提供了新思路与分析框架。本文采用风险—适应能力指数评估乡村人地系统适应性,构建气候变化与政策实施双重驱动的农牧复合型乡村人地系统适应性评价体系,对1952—2017年达茂旗建旗以来乡村人地系统适应性循环演化的阶段、特征、主控因子及影响机理进行研究。结果显示:① 乡村人地系统经历了重组—快速发展阶段(1952—2002年),人口数量增长260%,耕地面积增长13%,牲畜数量增长134%,草场面积退化增加了16.33%;快速发展—稳定守恒阶段(2003—2010年),人口数量增长2.8%,耕地面积减少2.3%,牲畜数量减少13.6%,草场退化面积减少10.7%;稳定守恒—释放阶段(2011—2017年),人口数量减少2.6%,耕地数量减少0.2%,牲畜数量减少10.6%,草场退化面积减少3.8%。② 乡村人地系统适应性指数时间上呈现出缓慢上升(-0.016~0.031)、缓慢下降(0.031~0.003)、快速上升(0.003~0.088)的变化过程,空间上呈现“中部高度适应、北部中度适应、南部低度适应”格局。③ 1990—2000年系统适应性演化主控因子是人均有效灌溉面积(22.31%)、人均牲畜头数(23.47%),2005年是土地沙化程度(25.06%)、土地利用强度(21.27%),2010—2017年是农牧民人均收入(20.08%)、人均牲畜数量(18.52%)。④ 在气候暖干化与政策实施驱动下,农牧户与乡村社区两个尺度主体相互联系构成了乡村人地系统适应性循环演化层级结构,尺度间的关联作用影响着不同尺度主体适应行为,从而影响系统适应性循环演化趋势,使系统结构与功能呈现“协调—不协调”的循环往复波动发展态势。同时,小尺度的农牧户生计适应行也深刻影响着乡村人地系统未来的演化方向。
Nitrous oxide emissions from an agro-pastoral ecotone of northern China depending on land uses
DOI:10.1016/j.agee.2015.08.011 URL [本文引用: 1]
Analysis of the Bole-Taipei Line as the divide for regional coordinated development: Evidence from greenhouse gas emissions of Chinese cities
DOI:10.11821/dlxb202112015
[本文引用: 1]
As the international political and economic situation has been undergoing profound changes, achieving regional coordinated development is essential for China to form a new development pattern dominated by the domestic economic cycle. The Bole-Taipei Line, which is perpendicular to the Hu Huanyong Line and is proposed by Professor Fang Chuanglin in February 2020, has the potential to be an appropriate representative of the coordinated and balanced line of China's regional development. By investigating the spatio-temporal distribution of greenhouse gas emissions among 338 Chinese cities from 2005 to 2015, and making use of the Theil index and the Gini coefficient that are appropriate for measuring the spatial equality on both sides of the Bole-Taipei Line and within the southwest and northeast parts, respectively, this paper attempts, for the first time, to underpin the scientific basis of the Bole-Taipei Line as China's regional coordinated development line. We find that: (1) Overall emissions of the carbon dioxide (CO2), methane (CH4), nitrous oxide (N2O) and fluorinated greenhouse gas show a balanced distribution on both sides of the Bole-Taipei Line, and there are small regional differences in sectoral CO2 emission intensity and per capita CO2 emissions. (2) There is a generally balanced distribution of greenhouse gas emission intensity and per capita emissions, as well as the sectoral CO2 emission intensity and per capita emissions within the southwest and northeast parts of the Bole-Taipei Line. The industrial and agricultural sectors serve as the major emitters of greenhouse gases and therefore require a low-carbon transition towards a more balanced distribution of greenhouse gas emissions on both sides of the Bole-Taipei Line. In conclusion, the greenhouse gas emissions as a measure of the magnitude of human activities on both sides of the Bole-Taipei Line are relatively balanced, which has justified the scientific robustness and rationality of the Bole-Taipei Line as a strategic line for socioeconomic development, and provided novel insights into China's regional coordinated development.
博台线作为中国区域发展均衡线的佐证分析: 以城市温室气体排放为例
DOI:10.11821/dlxb202112015
[本文引用: 1]
国际政治经济形势正在发生深刻变化,实现区域协调均衡发展对于形成以国内大循环为主的新发展格局至关重要。方创琳于2020年2月提出垂直于胡焕庸线的博台线可以表征中国区域发展的均衡格局。本文通过对中国338个地级市的温室气体排放水平进行分析,旨在论证博台线作为中国区域发展均衡线的合理性和可能性。结果显示:① 2015年二氧化碳(CO<sub>2</sub>)、甲烷(CH<sub>4</sub>)、氧化亚氮(N<sub>2</sub>O)和含氟温室气体总量以博台线为界呈南北对称的空间分布格局,且博台线两侧各类温室气体的排放强度和人均排放量分布基本均衡,各产业部门CO<sub>2</sub>排放强度和人均排放量的区域差异均较小;② 博台线西南半壁和东北半壁内各类温室气体排放在GDP和人口维度上总体呈均衡分布态势,且各部门CO<sub>2</sub>排放强度和人均排放量的空间分布也较为均衡。总体而言,博台线两侧表征人类活动强度的温室气体排放水平较为均衡,一定程度上反映出其作为中国区域发展战略均衡线的科学性与合理性。
Role of land use changes on ammonia emissions from agricultural ecosystems in the Yangtze River Delta region from 2000 to 2018
2000—2018年长三角土地利用变化对农田生态系统氨排放的影响
Greenhouse gas mitigation potentials in the livestock sector
DOI:10.1038/nclimate2925 URL [本文引用: 1]
China's future food demand and its implications for trade and environment
DOI:10.1038/s41893-021-00784-6 URL [本文引用: 1]
Ruminants, climate change and climate policy
DOI:10.1038/nclimate2081 URL [本文引用: 1]
Technical options for the mitigation of direct methane and nitrous oxide emissions from livestock: A review
DOI:10.1017/S1751731113000876 URL [本文引用: 1]
Biomass use, production, feed efficiencies, and greenhouse gas emissions from global livestock systems
DOI:10.1073/pnas.1308149110
PMID:24344273
[本文引用: 1]
We present a unique, biologically consistent, spatially disaggregated global livestock dataset containing information on biomass use, production, feed efficiency, excretion, and greenhouse gas emissions for 28 regions, 8 livestock production systems, 4 animal species (cattle, small ruminants, pigs, and poultry), and 3 livestock products (milk, meat, and eggs). The dataset contains over 50 new global maps containing high-resolution information for understanding the multiple roles (biophysical, economic, social) that livestock can play in different parts of the world. The dataset highlights: (i) feed efficiency as a key driver of productivity, resource use, and greenhouse gas emission intensities, with vast differences between production systems and animal products; (ii) the importance of grasslands as a global resource, supplying almost 50% of biomass for animals while continuing to be at the epicentre of land conversion processes; and (iii) the importance of mixed crop–livestock systems, producing the greater part of animal production (over 60%) in both the developed and the developing world. These data provide critical information for developing targeted, sustainable solutions for the livestock sector and its widely ranging contribution to the global food system.
Importing food damages domestic environment: Evidence from global soybean trade
Mitigating greenhouse gas and ammonia emissions from swine manure management: A system analysis
DOI:10.1021/acs.est.6b06430 URL [本文引用: 1]
Impact of agricultural agglomeration on agricultural non-point source pollution: Evidences from the threshold effect based on the panel data of prefecture-level cities in China
DOI:10.11821/dlyj020181090
[本文引用: 1]
The environmental effect of agricultural agglomeration is more complicated than that of other industries, but there is a deficiency of the research on it. This study calculated the level of agricultural agglomeration and the emissions of agricultural non-point pollutants in Chinese prefecture-level cities by using the panel data of these cities on the basis of the theoretical analysis. Then we investigated the spatial and temporal characteristics of agricultural agglomeration and agricultural non-point source pollution and the threshold effect of agricultural agglomeration level on agricultural non-point source pollution based on GIS spatial analysis and econometric model. The main conclusions can be drawn as follows: (1) Agricultural agglomeration and agricultural non-point source pollution of COD, TN and TP show different characteristics in temporal variation, spatial distribution, spatial correlation and spatial trends. (2) Agricultural agglomeration has single threshold effect on COD, TN and TP pollution, and positive correlation with them. When the level of agricultural agglomeration is below the threshold value, it contributes to agricultural pollution significantly, and as the level of agglomeration becomes higher than the threshold value, the situation of rapid pollution will be mitigated. (3) The change from agricultural agglomeration to emissions of three agricultural non-point source pollutants develops in two stages. This change depends on the intensification and restriction of the scale effect, structure effect, technical effect, social effect and cumulative effect on the emissions of agricultural non-point source pollution produced by agricultural agglomeration and it is reflected in the concrete agricultural production behavior. With the increase of agricultural agglomeration, the effect of each effect is obvious and the level of pollution increases significantly, however, the inhibition ability of pollution emission is improved and the external effect of negative environment is weakened at the stage of crossing the threshold. (4) The agricultural economic level and agricultural production conditions aggravate the COD, TN and TP agricultural non-point source pollution to some extent; the structure of animal husbandry industry and environmental regulation have a positive correlation with COD and TP agricultural non-point source pollution; the improvement of producer quality can affect farmers' production behavior and improve the agricultural environment. (5) The effect of agricultural agglomeration on pollution reduction of COD agricultural non-point source pollution is weak and COD agricultural non-point source pollution is more serious and mainly from animal husbandry.
农业集聚对农业面源污染的影响: 基于中国地级市面板数据门槛效应分析
DOI:10.11821/dlyj020181090
[本文引用: 1]
农业集聚的环境效应相比其他产业更为复杂,然而学术界对此探讨较少。在理论分析的基础上,利用2007—2015年中国337个地级市面板数据,核算农业集聚水平与农业面源污染排放量,并采用空间分析技术、计量模型,实证探究农业集聚与农业面源污染的时空特征及农业集聚对农业面源污染的门槛效应。结果显示:① 农业集聚与COD、TN、TP三种农业面源污染在时序变化、空间布局、空间关联以及空间趋势变化上特征相异。② 农业集聚对COD、TN、TP农业面源污染皆呈现正相关的单门槛效应。低于门槛值阶段,农业集聚水平的提高显著加剧了农业污染,集聚水平跨过门槛值后,污染加剧形势有所缓和。③ 农业集聚与农业面源污染之间经历的两个阶段,取决于规模效应、结构效应、技术效应、社会效应、累积效应分别对农业面源污染排放的加剧与制约作用。随着农业集聚水平提高,各效应增污作用明显,导致污染水平显著提高,进入高于门槛值的阶段,各效应对污染排放的抑制能力提升,削弱了部分负环境外部效应。④ 农业经济水平、农业生产条件在一定程度上加剧了COD、TN、TP污染;畜牧业结构、环境规制对COD、TP污染存在显著的正相关关系;生产者素质的提高可以影响农户生产行为并改善农业环境。⑤ 农业集聚对COD污染的降污效应较弱,农业COD污染较为严重且主要来源于畜牧业养殖,畜牧业污染防治亟待加强。
Spatio-temporal evolution of global food security pattern and its influencing factors in 2000-2014
DOI:10.11821/dlxb202002009
[本文引用: 1]
Food security is the basic foundation in accomplishing of the overall Sustainable Development Goals (SDGs). As the objective in SDGs of "halving the proportion of hungry people by 2015" has not been achieved as scheduled, it will become more challenging to realize its final goal of zero hunger by 2030. So exploring the underlying causes of global food security pattern from perspectives of spatio-temporal evolution is badly needed. In this paper, a comprehensive evaluation method with multi-indices was applied to evaluate the food security level of 172 countries in 2000-2014 based on an established global database with country-specific time series data. Then the spatial pattern and changing characteristics of global food security by country was conducted through the spatial autocorrelation analysis. Upon this basis, the underlying factors affecting the food security pattern were further identified and analyzed with a multiple nonlinear regression method. The findings and results show that: (1) The global food security pattern can be summarized as "high-high and low-low agglomerations" of socio-economic status and food security level. The most food secure countries are mainly distributed in the regions with more advanced economy such as North America, Oceania, parts of East Asia, and Western Europe. On the contrary, the least food secure countries are mainly distributed in sub-Saharan Africa, South Asia, West Asia, and parts of Southeast Asia. (2) At 99% confidence level, Western Europe and sub-Saharan Africa are respectively the hot and cold spots in global food security landscape, while in non-aggregation areas such as Haiti and North Korea, there exist long-term food insecurity problems. (3) The spatio-temporal pattern of global food security is generally stable, but the internal changes in the extremely insecure groups are significant. The countries with the most changeable levels of food security are also the countries with the most food insecurity. (4) Annual mean temperature, per capita GDP, the proportion of people who have access to clean water, and political stability are the key factors affecting the global food security pattern. The study indicates that while the global food security situation has improved since 2000, there was a reverse sign or omen in 2013. Affected by climate change, residents' purchasing power, infrastructure condition, and political and economic stability, global food security has in fact been volatile and some areas in the world are still facing acute food security problems. In addressing this challenge, a food security strategy based on the four dimensions, i.e. food supply, food access, food use and political stability, and a worldwide rural revitalization approach, is highly recommended. Meanwhile, it is necessary to progressively introduce some diversified modes of production such as urban agriculture to build a more resilient food system in those fully urbanized regions.
2000—2014年全球粮食安全格局的时空演化及影响因素
DOI:10.11821/dlxb202002009
[本文引用: 1]
粮食安全是实现可持续发展整体目标的基础,由于“至2015年使饥饿人口比例减半”的千年发展目标并未如期实现,使得2030年零饥饿目标的实现面临更大挑战。鉴于此,亟需从全球粮食安全格局的时空演化中寻找全球粮食安全问题的内在原因。在建立粮食安全评价因子数据集和粮食安全影响因素数据集的基础上,运用多指标综合评价法评价2000—2014年172个国家的粮食安全水平;进而通过空间自相关分析研究全球粮食安全格局的空间模式与变化特征;在此基础上运用多元非线性回归方法分析粮食安全格局的影响因素。结果表明:① 全球粮食安全格局呈现出社会经济发展与粮食安全水平“高—高集聚、低—低集聚”的空间模式,其中高值区主要分布在除东欧以外的欧洲区域、北美洲、大洋洲和东亚部分国家,低值区主要集中在撒哈拉以南非洲、南亚和西亚地区、以及东南亚部分国家;② 在99%的置信水平上,欧洲和撒哈拉以南非洲分别是全球粮食安全格局的热点和冷点,在非集聚区,海地和朝鲜等国存在长期粮食不安全问题;③ 全球粮食安全格局总体稳定,但极不安全和不安全组的内部变化明显,粮食安全水平波动最大的国家也是粮食最不安全的国家;④ 年平均气温、人均国内生产总值、获得洁净用水的人口占比、政治稳定与无暴力程度是全球粮食安全格局的主要影响因素。研究表明,自2000年以来,全球粮食安全状况有所改善,但2013年出现趋势性逆转。受气候变化、居民购买力、健康卫生水平和政治经济稳定性影响,全球粮食安全始终波动不稳,局部区域目前仍面临突出的粮食安全问题。为此,建议制定基于粮食供给、食物获取、食物利用和政治稳定性四大支柱的粮食安全战略,并通过全球乡村振兴策略来推动粮食安全建设,同时逐步引入城市农业等多元化生产方式,使高度城市化区域建立起更富弹性的食物系统。
