

1 引言
冰川、冻土和积雪是冰冻圈主要的组成要素[1]。高原变暖放大效应、海拔依赖型变暖,以及山地积雪、高原冰川、冻土对气候变暖的响应机制,是当前气候变化研究的热点问题[2]。其中,海拔依赖型变暖(Elevation-dependent warming)是变暖速率随着海拔高度增加,系统性变化的空间模态与物理现象[3]。与青藏高原“亚洲水塔”类似,中国许多山地系统也承载着区域水资源调控的作用[4⇓-6]。气候迅速变暖,导致高山积雪融化,会降低山地淡水资源储存能力[7],增加了区域水安全的风险,也易诱发山体滑坡、流域洪水、生态退化等自然灾害事件[8⇓⇓⇓-12]。因此,关注山地积雪时空变化规律,量化海拔依赖型变暖与积雪响应的关系,成为“山地—平原”城市群科学适应气候变化和有效制定水资源管理措施的前提条件和关键领域。
东亚冬季风是中国中东部积雪异常的重要影响因素之一[25]。1999年后东亚冬季风由偏弱转为偏强,中国冬季气温变化从“全国一致型”转变为“北冷南暖型”,中国冬季低温、暴雪、冷冻灾害发生呈现极端化[26]。例如,2008年南方低温冰冻雨雪天气影响中国20个省(区、市),灾害影响涉及电力、交通、农业以及人民生活等方面,直接经济损失和受灾人口为历史同期同类灾害之最[27]。2016年雨雪冰冻天气再袭南方,中国76个站点低温破极值,两广、港澳台等地出现气象记录以来仅有的一次降雪天气,刷新了中国降雪最南界线[28]。2020年冬季风异常在季节内存在强弱转换,造成中国气候呈现“前冬冷干、后冬暖湿”,其中陕西西北部、西藏东南部冬季降水偏多2倍以上[29]。可见,全球变暖背景下变暖趋势毋容置疑,冬季气候也呈现极端化。因此,从遥感监测出发,关注近年来秦岭南北积雪日数时空变化规律,也是对中国南北过渡带冬季气候是否呈现极端化的验证。
作为东亚冬季风年代际变化的遥相关调控因素,厄尔尼诺—南方涛动(ENSO)与东亚冬季风强弱具有明显的负相关关系[30]。同时,青藏高原积雪异常与ENSO呈显著的正相关,两者与东亚季风区海陆热力差异呈现显著的负相关[31]。20世纪初,青藏高原积雪偏少,耦合赤道中东太平洋海温偏低,增强中国东部季风区海陆热力差异,将导致冬春环流改变[32⇓-34]。在环流年代转变下,中国南北过渡带积雪日数如何响应,是否呈现增加趋势需进一步验证。需要说明的是,近年来,学界对ENSO研究呈现精细化,即空间上关注赤道中东太平洋不同海区海温异常与中国气候的响应差异性,时间上更加重视前秋或冬季ENSO对东亚气候的影响滞后效应[35⇓-37]。基于上述认识,综合ENSO对东亚气候影响的滞后性和青藏高原环流影响的持续性,挖掘秦岭南北积雪异常的遥相关预警信号,将有助于中国南北过渡带冬季区域综合风险防范体系构建。
基于此,本文利用2000—2019年MODIS积雪物候数据,对中国南北过渡带积雪日数时空变化进行分析;以海拔依赖型变暖为理论基础,量化积雪日数的垂直地带规律;以不同海区厄尔尼诺指数(Oceanic Niño Index, NINO)和青藏高原环流异常为切入,识别积雪日数异常的遥相关信号,以期为中国南北过渡带科学适应气候变化提供理论依据。
2 数据来源与研究方法
2.1 数据来源
本文数据主要包括遥感监测积雪产品、环流指标和大气环流再分析数据。
在遥感数据方面,2000—2019年秦岭南北积雪日数数据为郝晓华等[38]根据高空间分辨率无云Landsat-5 TM/Landsat 8 OLI影像,使用隐马尔可夫时空建模和微波雪深数据插值两步去云,在中国的林区和非林区分别改进MODIS产品标准的积雪提取算法,并结合温度数据、水体数据开发的2000—2020年MODIS中国积雪物候数据集。该数据集来源于国家冰川冻土沙漠科学数据中心(
地表2 m气温、大气比湿、纬向、经向风等大气环流资料来源于美国国家环境预报中心和国家大气研究中心(
积雪日数具有跨季节性,秦岭南北积雪时段主要为11月—次年3月。为了分析秦岭南北积雪日数变化的影响,综合考虑3方面因素,即海温—大气环流影响因子对东亚冬季气候影响的滞后性、遥相关机制的清晰性及积雪异常前期预警的实践意义,本文在已有研究结果基础上[19],选取两类与秦岭南北积雪变化密切相关的环流因子,作为积雪日数变化的影响因素。
9个表征不同海区的厄尔尼诺指数(NINO)为:NINO 1+2区、NINO 3区、NINO 4区、NINO 3.4区、NINO W区、NINO C区、NINO A区、NINO B区、NINO Z区;青藏高原南部气压指数(TPI-S)和北部气压指数(TPI-N)为两个表征青藏高原气压异常的环流指数(图1),上述数据来源国家气候中心变化与预测研究室发布的130项环流指数数据集。
图1
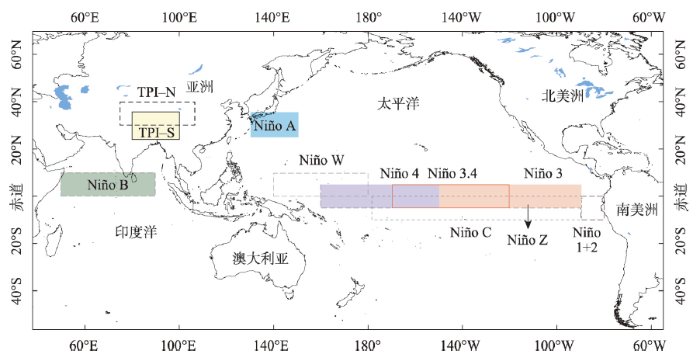
图1
厄尔尼诺指数和青藏高原气压指数空间位置分布
Fig. 1
Spatial location of Oceanic Niño indexes and Tibetan Plateau pressure indexes
不同海区海温异常相关分析目标是识别中部型、东部型或综合海区海温异常与积雪日数相关性强弱,挖掘秦岭南北积雪异常的ENSO遥相关预警信号。
2.2 研究方法
2.2.1 趋势分析法
结合Sen+Mann-Kendall趋势分析方法[39],对秦岭南北积雪日数变化趋势进行分析,计算公式如下:
式中:β 为积雪日数趋势度;xi和xj为逐像元积雪日数;ti和tj分别为年份。若β值为正,表示积雪日数逐年增多;若β值为负,表示积雪日数逐年降低。积雪日数变化趋势显著性通过Mann-Kendall趋势值检验。
2.2.2 积雪日数海拔依赖规律分析
为了对比中国南北过渡带积雪日数空间特征,以1000 m等高线为划分标准,在保证山地与流域的完整性基础上,将研究区划分为关中平原、秦岭山地、汉江谷地和大巴山区等4个子区(图2)。进而从空间剖面线和时间演变两个角度,对秦岭南北积雪日数的垂直地带规律进行分析。
图2
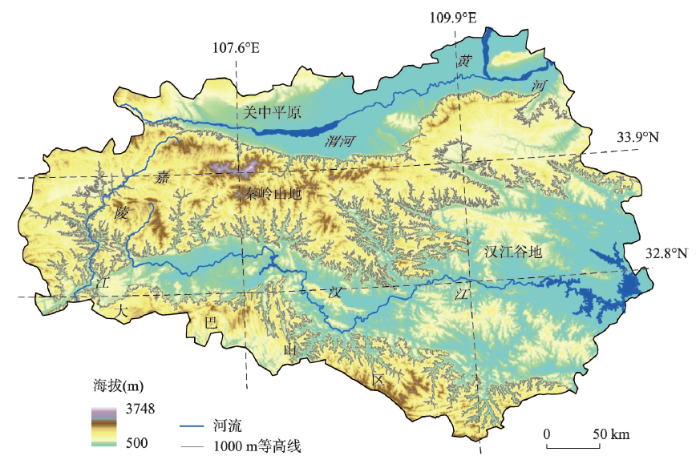
图2
秦岭南北地理环境与典型剖面线位置
Fig. 2
Geographical environment and four typical profiles in the north and south of Qinling Mountains
选取107.6°E、109.9°E经线和32.8°N、33.9°N纬线,统计4个典型剖面线不同高度积雪日数。其中,107.6°E自北向南经过主要地形单元为:渭北旱塬→关中平原→秦岭北麓→太白山→秦岭南麓→汉江谷地→大巴山区;109.9°E自北向南经过主要地形单元为:关中平原→秦岭北麓→华山→丹江河谷→流岭→鹘岭→汉江谷地→竹溪→大巴山区;32.8°N自西向东经过主要地形单元为:嘉陵江谷地→米仓山→大巴山→安康盆地→汉江谷地;33.9°N自西向东经过主要地形单元为:两当盆地→嘉陵江上游→太白山→终南山→丹江河谷→东秦岭。
以5年为时间段,划分2000—2004年、2005—2009年、2010—2014年和2015—2019年4个时段;以50 m为等高度间隔,统计500~3600 m范围内,秦岭南北全区、秦岭山区、大巴山区逐海拔段积雪日数均值。识别3个积雪日数40 d、60 d、80 d不同时段对应海拔高度变化,分析2015—2019年和2000—2004年不同海拔高度积雪日数差值规律,计算2000—2019年积雪日数与海拔高度相关性时间变化规律,定量分析山地效应对积雪日数的影响。
2.2.3 积雪日数与海气异常的去趋势相关分析
借助相关分析方法,分析秦岭南北4个子区积雪日数与秋季、冬季不同海区海温异常、青藏高原气压异常的相关特征。
首先,计算2000—2019年11个海温、大气环流秋冬两季指数,以及秦岭南北4个子区积雪日数。建立20年秦岭南北4个子区积雪日数yi、11个海温—大气环流秋冬指数xi,与所对应时刻ti一元线性回归方程。
式中:a1和a2为回归常数;b1和b2为回归系数;利用最小二乘法,计算a和b。
其次,对积雪日数yi和海温、大气环流指数xi进行去趋势,获得积雪日数去趋势序列Yi以及海温、大气环流指数去趋势序列Xi。去趋势目的为:滤除趋势信息,保留时间序列的年代际波动信息。
去趋势相关系数计算方法如下:
式中:r为积雪日数与9个NINO指数、2个青藏高原气压指数的去趋势相关系数;Xi为第i年海温或大气环流去趋势指数;Yi为第i年秦岭南北4个子区积雪去趋势日数;
2.2.4 积雪日数异常水汽条件分析
水汽输送通量指单位时间内,流经单位截面积的水汽质量,分为水平、垂直水汽输送通量,其数值和方向,表示水汽来源、输送路径和强弱。水汽通量散度,可描述水汽的辐合辐散状况。
在单位气柱内,整层水汽输送通量Q和水汽通量散度D计算公式如下:
式中:g为重力加速度;q为大气比湿;P为气压;Ps为积分下界气压,取地面气压;Pt为300 hPa;V为该单位气柱内各层大气风速;Q包括纬向qu和经向qv的水汽通量。其中,水汽通量散度为正时,表征区域水汽辐散,不利于区域降水形成;水汽通量散度为负时,表征区域水汽辐合,有利于区域降水形成。
为了减少文章内容冗余,选取受人类活动影响较小的秦岭山地为代表,以±0.5标准差为标准,识别积雪偏多和偏少年;计算积雪偏多(偏少)年对应11月—次年3月逐月气温、水汽通量和散度均值,提取0 ℃等温线分布位置,对比秦岭南北积雪异常年气温、水汽通量空间格局的差异性。
3 结果与分析
3.1 秦岭南北积雪日数时间变化特征
冬季,南下冷空气受秦岭山地阻挡,加之秦岭南坡下坡风引起的绝热下沉增温,抑制了冷空气进入汉江谷地,导致关中平原积雪日数(9.5 d)远高于汉江谷地(5.1 d),低于秦岭山地(10.9 d)和大巴山区(10.3 d)。在波动程度上,秦岭南北4个子区积雪日数标准差关系为:汉江谷地<大巴山区<秦岭山地<关中平原,说明关中平原和秦岭山地积雪日数年际波动性较大,更易出现极端降雪天气(表1)。
表1 秦岭南北不同分区积雪日数变化统计特征
Tab. 1
| 积雪日数 | 关中平原 | 秦岭山地 | 汉江谷地 | 大巴山区 | 秦岭南北 |
|---|---|---|---|---|---|
| 2000年(d) | 8.2 | 11.0 | 4.6 | 9.6 | 8.3 |
| 2010年(d) | 4.7 | 13.2 | 6.7 | 14.9 | 9.9 |
| 2019年(d) | 2.4 | 6.8 | 2.4 | 8.4 | 5.0 |
| 均值(d) | 9.5 | 10.9 | 5.1 | 10.3 | 9.0 |
| 标准差(d) | 7.8 | 6.3 | 3.4 | 5.7 | 5.3 |
| 变化率(%) | -70.9 | -38.4 | -47.4 | -12.5 | -40.1 |
| 趋势值(d/10a) | -2.7 | -1.0 | -0.5 | -1.3 | -1.3 |
注:均值、标准差、变化率和趋势值计算时段均为2000—2019年。
在变化速率上,关中平原积雪日数由2000年的8.2 d下降到2019年的2.4 d,20年间变化速率为-2.7 d/10a,高于大巴山区(-1.3 d/10a)和秦岭山地(-1.0 d/10a);汉江谷地积雪日数下降幅度最小,为-0.5 d/10a。说明全球变暖背景下,受人类活动影响较大、纬度更偏北的关中平原,积雪日数下降响应更为明显。
在年代际变化上,秦岭南北积雪日数变化存在明显的转折性。以2013年为分界,前期秦岭山地、汉江谷地和大巴山区积雪日数呈上升趋势;后期秦岭南北积雪日数呈现断崖式下降。除2017—2018年积雪日数偏多之外,2014—2019年积雪日数多为负距平(图3)。近年来,秦岭南北增温再回升,是区域积雪日数出现年代转折的重要原因。
图3
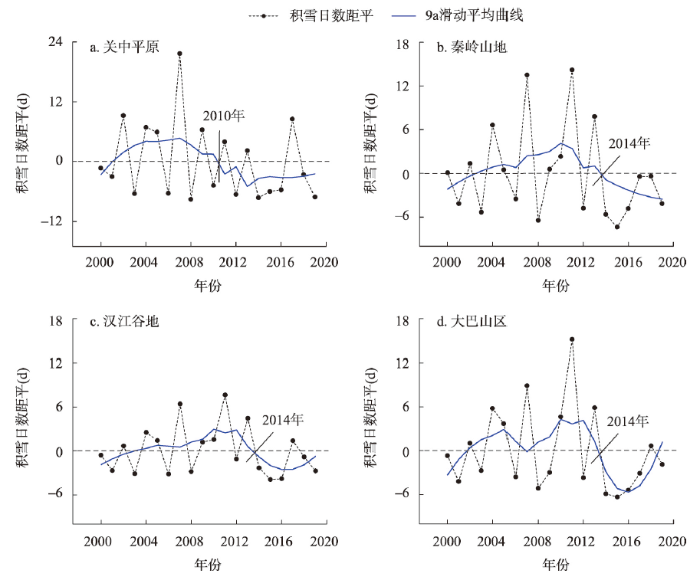
图3
2000—2019年秦岭南北积雪日数变化特征
Fig. 3
Variation of snow cover days in the north and south of Qinling Mountains during 2000-2019
3.2 秦岭南北积雪空间变化特征
为了对比2000—2013年和2014—2019年两阶段秦岭南北积雪空间变化特征,将积雪日数划分3个等级,即低值区(<8 d)、中值区(8~10 d)和高值区(≥10 d)。具体变化特征为:
(1)空间格局特征。2000—2013年秦岭南北积雪日数高值区栅格比重为35.1%,空间连片分布于秦岭分水岭以北、渭河南岸以及大巴山区;积雪日数中值区栅格比重最小,为15.3%,空间集中分布于渭河中段北岸;积雪日数低值区栅格比重为49.6%,分布于汉江谷地、嘉陵江流域海拔1000 m以下的区域(图4a)。
图4
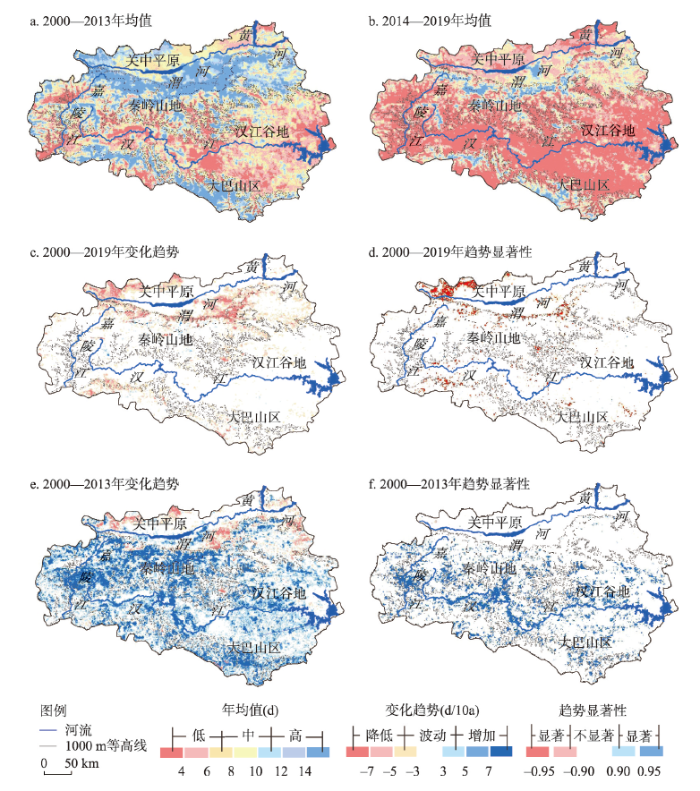
图4
秦岭南北积雪日数空间格局与趋势变化特征
Fig. 4
The average and trend pattern of snow cover days in the north and south of Qinling Mountains
随着中国南北过渡带气温由“增温减缓”转为“再次变暖”,2014—2019年区域积雪日数高值区栅格比重下降为8.6%,空间上以秦岭山地分水岭为中心呈线性分布,大巴山区积雪日数已降低到4 d以下。全区积雪日数低值区栅格比重上升为84.5%,从图4b可以看出,除秦岭山地东段和渭河南岸部分区域积雪日数维持在6~10 d之外,其他区域积雪已少有超过4 d的长时间积雪保持。
(2)空间趋势特征。空间栅格尺度揭示秦岭南北积雪变化规律,与前文4个子区趋势分析结果基本变化一致,即近20年区域积雪日数并未呈现出明显的线性趋势,变化过程以年代波动为主,97.9%区域积雪日数变化趋势不显著(图4c、4d)。
3.3 秦岭南北积雪日数时空变化的影响因素
3.3.1 典型地形剖面海拔与积雪日数对应规律
“山谷南北交替”的地形对积雪日数变化具有重要的影响。除东西穿越大巴山的32.8°N剖面线之外,其他3个剖面积雪日数与海拔拟合分析,均呈现出显著的相关关系(图5)。
图5
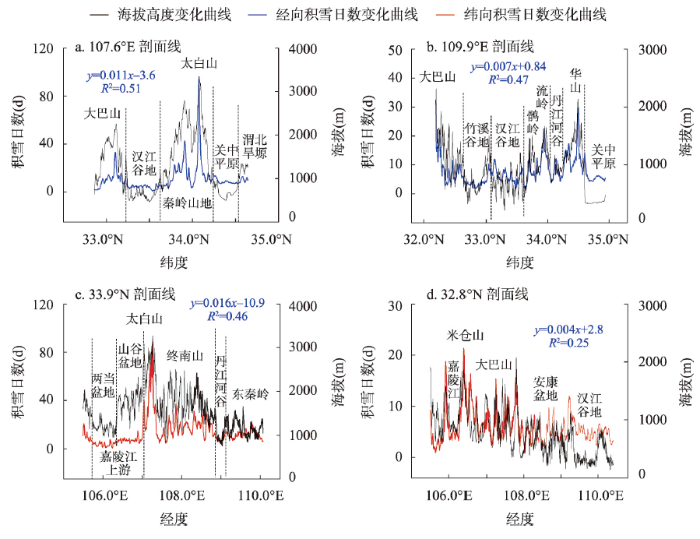
图5
秦岭南北典型剖面海拔与积雪日数的对应关系
Fig. 5
Corresponding relationship between snow cover days and altitude from west to east (33.9°N and 32.8°N), and from north to south (107.6°E and 109.9°E) in the north and south of Qinling Mountains
3.3.2 量化秦岭南北地形与积雪日数的变化规律
前文以剖面为基础,线性拟合海拔与积雪日数的关系,无法有效揭示垂直地带规律的非线性特征。本文以50 m为等高距,统计秦岭、大巴山区不同海拔带积雪日数多年均值,回答“积雪日数垂直递增率转折是否存在关键海拔带”“秦岭山地和大巴山垂直递增规律是否存在差异”等问题(图6)。
图6
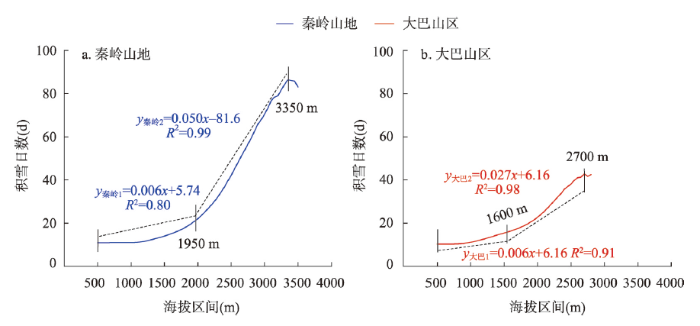
图6
秦岭山地与大巴山区海拔与积雪日数相关关系
Fig. 6
Correlation analysis between snow cover days and altitude for the Qinling and Daba Mountains
从年代变化分析,2000—2019年秦岭南北积雪日数与海拔相关系数均高于0.90,相关性先增加后减少,说明区域积雪日数与海拔垂直变化的关系受气温、降水等因素影响,并非一成不变,而是存在明显的年际波动(图7a)。
图7
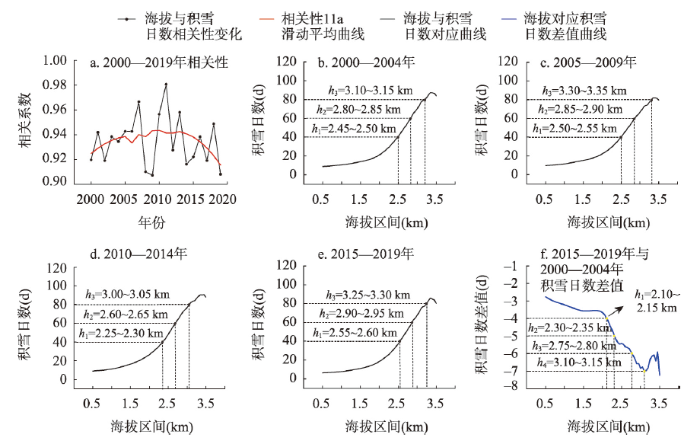
图7
秦岭南北积雪日数垂直地带规律的时间变化特征
Fig. 7
Vertical zonality change of snow cover days in the north and south of Qinling Mountains
统计3个积雪日数40 d、60 d、80 d的4个时段对应海拔高度变化,发现不同时期积雪日数指数分布的垂直地带规律依然明显,不同积雪日数所处海拔高度也在波动上升。以2000—2004年为基准期,其他3个阶段中,积雪日数为80 d的高度变化过程为:升高(200 m)→降低(-100 m)→升高(150 m),60天高度变化过程为:升高(50 m)→降低(-200 m)→升高(100 m),40 d高度变化过程为:升高(50 m)→降低(-200 m)→升高(100 m)。整体而言,秦岭南北积雪日数海拔高度处于波动变化(图7b~7e)。
对2015—2019年与2000—2004年不同海拔带积雪日数差值进行分析,2100~2150 m是第一个海拔转折点,2100 m以下区域,积雪日数差值在-4 d以下,随海拔变化增加,积雪差值增加速率相对较缓;3100~3150 m是第二个海拔转折点,2100~3150 m高度带随着海拔增加,积雪日数差值增加速率明显增大。3150 m以上区域,积雪日数差值随海拔高度增加先减少后增大(图7f)。
由此可见,2100~3150 m海拔带是积雪日数(静态)垂直增加带,也是积雪日数(动态)加速减少带,符合变暖海拔依赖性规律(Elevation-dependent Warming)的认知,即海拔越高,积雪日数对增温响应速率越快。
3.3.3 识别秦岭南北积雪异常的海气异常指数
图8为2000—2019年秦岭南北4个分区积雪日数与秋季/冬季ENSO、青藏高原气压异常的相关性分析。将线性趋势滤除,以秋季和冬季相关关系为基础,划分4种环流异常组合关系:秋季信号主导型、冬季信号主导型、秋冬持续主导型和弱相关型。
图8
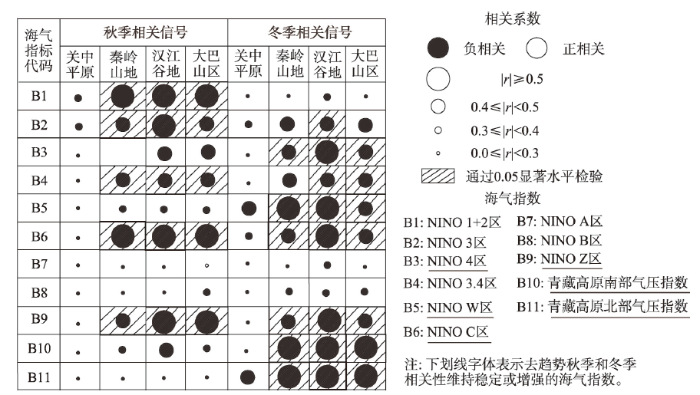
图8
秋季/冬季ENSO、青藏高原气压指数与秦岭南北积雪日数去趋势相关性分析
Fig. 8
Detrended correlation analysis between snow cover days and ENSO, Tibetan Plateau pressure index in the north and south of Qinling Mountains
秦岭南北4个子区积雪日数与秋季、冬季海气异常均呈现出负相关,不同分区相关显著程度存在差异。其中,关中平原积雪日数与秋季/冬季9个海温、2个大气环流指标相关性均未通过0.05显著水平检验,秦岭山地、汉江谷地和大巴山区为海温、大气异常的显著相关集中分布区。
在季节主导类型上,秋季信号主导型的海气指数为:NINO 1+2区、NINO 3区;冬季信号主导型的海气指数为:NINO 4区、NINO W区和青藏高原气压指数;秋冬持续主导型海气指数为:NINO C区和NINO Z区。对于衡量西太平洋海温异常的NINO A区、赤道印度洋海温异常的NINO B区海温指数而言,秋冬两季指数与区域积雪日数变化的相关性整体偏低。
以海气异常信号持续时间最长、相关性最高为判断标准,识别秦岭山地、汉江谷地和大巴山积雪异常响应最敏感的前兆海气异常信号。由此推论,当赤道太平洋NINO C区和NINO Z区秋冬海温持续偏低,青藏高原冬季气压偏低时,秦岭以南3个子区积雪日数往往异常偏多。
基于遥感积雪日数的栅格平均,导致上述海温、环流相关分析损失了空间信息,使得结论存在不确定性。在此,本文绘制了赤道太平洋NINO C区和NINO Z区秋冬海温异常指数、冬季青藏高原南/北气压指数与秦岭南北积雪日数相关性分布图,更加精细地识别显著相关的区域(图9)
图9
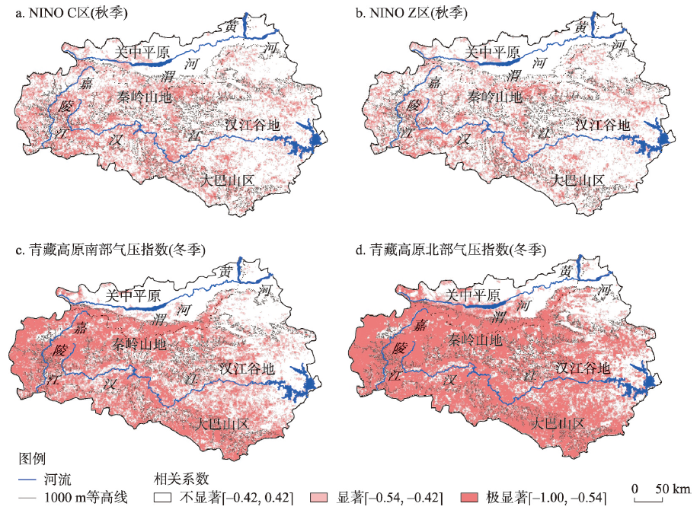
图9
秋季NINO C/Z区海温异常、冬季青藏高原气压指数与秦岭南北积雪日数相关性空间格局
Fig. 9
Detrended correlation analysis between snow cover days and NINO C/Z sea surface temperature anomaly, Tibetan Plateau pressure index in the north and south of Qinling Mountains
结果表明:① 整体上,秦岭南北积雪日数与秋季NINO C区和NINO Z区海温、冬季青藏高原南部和北部气压呈现显著的负相关关系,与前文分析结果一致。② 4个海温、大气指数显著负相关空间格局相对一致,仅是显著程度略有差异。其中,青藏高原冬季气压指数显著栅格占比(TPI—S:59.0%;TPI—N:73.7%)要高于赤道太平洋中部海温指数(NINO C区:36.9%;NINO Z区:32.3%),青藏高原冬季北部气压指数(TPI—N:73.7%)显著栅格占比要高于南部气压指数(TPI—S:59.0%)。对于极显著栅格占比而言,4个海温、大气指数显著相关比重分别为:TPI—N(58.5%)>TPI—S(41.4%)>NINO C区(13.1 %)>NINO Z区(10.3 %)。
空间上,以青藏高原北区气压指数为例,显著栅格占比关系为汉江谷地(32.9%)>秦岭山地(24.6%)>大巴山区(10.6%)>关中平原(5.7%)。可以清晰看出,当青藏高原北部冬季气压异常偏低时,秦岭以南积雪日数显著偏长,而关中平原的渭河北岸、秦岭山地东段,是积雪日数相关性偏弱的集中分布区。
青藏高原积雪偏少,导致高原面感热热源增加,高原面气压降低。耦合赤道中部太平洋海温偏低,增强中国东部季风区海陆热力差异,有利于沿海暖湿水汽向内陆输送,增加了雨雪概率,为遥感监测积雪日数延长提供了物质基础[31]。
值得一提的是,ENSO对中国冬季气候影响并非简单的线性关系。当太平洋海温年代尺度振荡(PDO)处于正位相时,ENSO对东亚冬季风影响并不显著;当PDO处于负位相时,ENSO对东亚冬季风的影响增强[30]。本文积雪日数研究时段为:2000—2019年恰处于PDO转为负位相,这意味着ENSO与东亚季风关联在增强。ENSO与PDO位相配置年代转折,可能是NINO C区、NINO Z区秋季海温与秦岭以南积雪日数异常显著相关的关键环流机制,未来需要深入探索。
3.3.4 秦岭南北积雪异常的气温与水汽条件分析
为了深入地分析秦岭南北积雪异常的气温与水汽条件,以±0.5标准差为标准,本文对秦岭山地积雪日数异常年进行识别。其中,积雪日数偏多年为2004年、2007年、2011年和2013年,偏少年为2001年、2003年、2006年、2008年、2012年、2014年、2015年、2016年和2019年。计算降雪偏多(偏少)年对应11月—次年3月逐月气温、水汽通量和散度均值,并提取0 ℃等温线分布位置(图10)。
图10
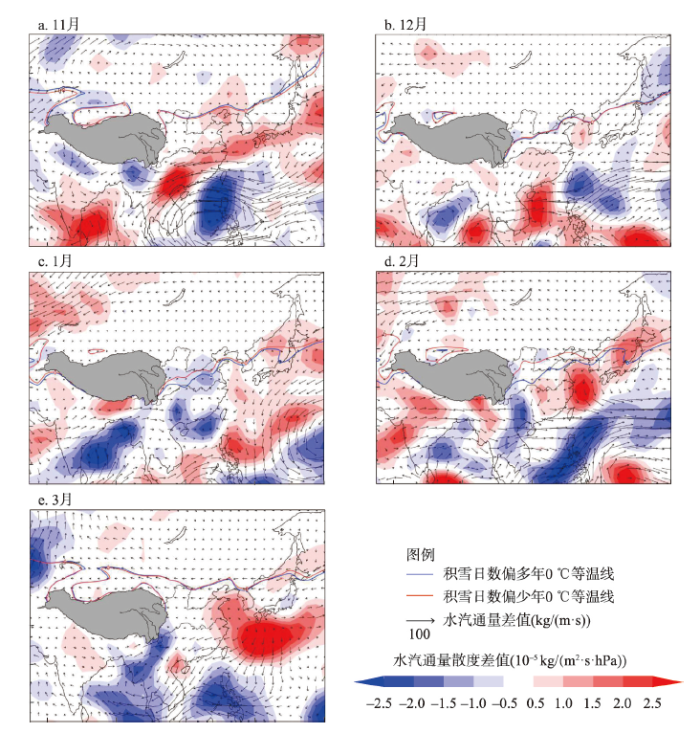
图10
秦岭南北积雪日数异常年0 ℃等温线和水汽通量、水汽通量散度异常的空间分布
注:图中青藏高原范围为张镱锂等绘制的2021年版青藏高原界线,详见参考文献[42]。
Fig. 10
Spatial changes of the 0 ℃ isotherm, integrated moisture flux and its divergence for snow cover days anomaly in positive and negative years over the north and south of Qinling Mountains
从水汽输送角度分析,与偏少年相比,除在1月积雪日数偏多年,秦岭南北存在一个弱水汽辐合区,其他月份水汽通量散度、水汽输送强度没有明显的差异,也无明显的由南向北的水汽输送异常。
上述结果说明,1月和2月是气温影响积雪日数异常的关键月,低温是积雪偏多年的主导气象因素。冷空气南下,秦岭南北气温偏低,减缓了积雪消融,有利于区域冰雪的物质积累,延长冷季遥感监测积雪日数。
4 结论与展望
基于2000—2019年MODIS中国积雪物候产品,本文对秦岭南北积雪时空变化特征进行分析,探讨了积雪日数的垂直地带规律;综合考虑ENSO对东亚气候影响的滞后性,青藏高原冬季积雪异常对中国中东部气候影响的持续性,识别了积雪日数异常的遥相关前秋或冬季预警信号。得到主要结论如下:
(1)空间格局上,受秦岭山脉对冷空气屏障作用的影响,2000—2019年汉江谷地是秦岭南北积雪日数的低值区,关中平原年平均积雪日数略低于秦岭山地、大巴山区。2013年前后,秦岭南北积雪日数高值区比重由35.1%下降为8.6%,空间上以秦岭山地分水岭为中心呈线性分布。
(2)地形效应上,“山谷南北交替”的地形对秦岭南北积雪日数空间分异具有重要的影响。秦岭山地和大巴山区积雪日数随海拔变化呈现指数增加。秦岭山地以1950~2000 m为临界点,大巴山区以1600~1650 m为临界点,低海拔地区积雪日数随海拔升高速率低于高海拔地区。
(3)响应关键区,2100~3150 m海拔带是秦岭南北积雪日数随海拔增加,呈指数变化的加速带,也是年代波动的积雪日数变化的关键带。以2000—2004年为基准期,2015—2019年,3个积雪日数40 d、60 d、80 d对应海拔高度分别升高了100 m、100 m和150 m。
(4)影响因素上,NINO C区和NINO Z区秋冬海温、青藏高原冬季高压是秦岭山地、汉江谷地和大巴山区积雪异常的有效指示信号。当赤道太平洋NINO C区和NINO Z区秋冬海温持续偏低,对应拉尼娜事件;青藏高原积雪偏少,对应冬季高压偏低时,秦岭山地、汉江谷地和大巴山区积雪日数往往异常偏多。
(5)融雪条件上,与积雪日数偏少年相比,秦岭南北积雪日数偏多年1月和2月0 ℃等温线位置偏南,为增加冰雪物质积累、延缓冰雪消融提供了气温条件。积雪日数偏多年1月存在一个弱水汽辐合区,增加了降雪可能性,有利于区域冰雪物质积累,延长冷季遥感监测积雪日数。
关于秦岭南北积雪日数时空变化特征及其影响因素研究,尚有许多工作值得探索。
同时,相比平坦地表,山地环境具有复杂性,以遥感为基础的积雪产品,遥感影像几何和光谱畸变问题始终存在[44]。遥感“病态”反演在山区尤为严重,对积雪“变暖海拔依赖性规律”揭示带来不确定性。《秦岭国家气候观象台建设发展方案(2022—2027年)》为认识山地积雪变化提供了机遇,建议在建成“一横三纵”秦岭气象剖面观测系统中,应加强秦岭山地积雪观测,为认识中国南北过渡带冬季气候变化提供数据基础。
(2)积雪垂直地带规律的启示。张百平等[23]提出带幅是地理地带性因素和区域因素综合作用的结果,是山地垂直带谱结构特征的关键参数。通过秦岭中部山地落叶阔叶林带内部结构分析,发现中国南北过渡带存在世界最宽的山地垂直带—山地落叶阔叶林垂直带。该垂直带超过正常山地垂直带1000 m阈值,上限可达2800 m。本文研究发现,秦岭山地2100~3150 m海拔带,是积雪日数(静态)垂直增加带,也是积雪日数(动态)加速减少带,且山地海拔越高,积雪日数对增温响应速率越快。可以看出,秦岭山地超级垂直带与积雪日数变化敏感带具有重合性。在未来研究中,需要关注气候变暖背景下,积雪“变暖海拔依赖性规律”是否影响山地落叶阔林垂直带结构变化。
(3)积雪日数异常分析的概念模型。本文将积雪日数影响因素初步分为4个层次:① 积雪日数异常本质是受“积累—消融”机制影响,直接影响因素为降雪与气温;② 局地地形(阴坡、阳坡、谷地等)、下垫面性质(草地、林地等)、人类活动强度等;③ 域内因素(局地降温、水汽输送异常等);④ 域外因素(海气遥相关机制)。基于上述4个层次,可以构建秦岭南北积雪异常分析的概念模型,系统阐释积雪日数异常的影响因素。
本文仅对秦岭南北积雪日数异常气温、水汽条件进行分析,属于概念模型的第二层次;同时,探讨了不同海区厄尔尼诺指数、青藏高原气压异常对研究区积雪异常的相关关系,属于概念模型的第四层次,即域外遥相关分析。值得一提的是,积雪日数异常,本研究分析时间尺度为年代际。积雪遥感物候数据集在一定程度上,限制了次季节或季节尺度大气环流分析。在未来研究中,需要结合典型的降雪异常事件,对域内环流机制进行系统研究。
(4)秦岭南北积雪消融机制具有复杂性。本文揭示秦岭南北积雪日数偏多年,1月和2月0 ℃等温线明显偏南,为增加冰雪物质积累、延缓冰雪消融提供了气温条件。12月、2月和3月中国东部沿海向内陆输送的水汽,提供了降雪形成的水汽条件。可以看出,积雪偏多年气温异常偏低和水汽输送组合关系在时间上并不匹配,即气温偏低不完全对应水汽输送异常,这加剧了中国南北过渡带积雪异常变化机制研究的复杂性。在未来,需要结合典型的降雪事件,利用数值模拟方法,对秦岭山脉的冷空气屏障作用进行分析;丰富相对湿度、气温、水汽量、近地面风速等气象因子,从冰雪物质积累和消融两个视角,识别影响秦岭南北冷季积雪异常的关键气象因子。
参考文献
Several research frontiers of climate change over the Tibetan Plateau
DOI:10.7522/j.issn.1000-0240.2021.0029
[本文引用: 1]

Under the background of global change, the cryosphere and atmosphere over the Tibetan Plateau (TP) are changing rapidly, which seriously affects the ecological environment of “Asian Water Tower” and “the Third Pole”. This paper reviews some issues in the research on climate change over the TP in recent years, including the change of extreme climate events over the TP and its relationship with the atmospheric circulation, the amplified warming and the physical mechanism of elevation dependent warming, applicability of modern reanalysis data, the bias and inaccuracy of climate models in the areas with scarce data over the TP, and the projection and risk study of climate change over the TP under the different warming threshold. Finally, some important issues and associated scientific challenges in the study of climate change over the TP are identified and their prospects are discussed. Addressing these will support the implementation of the Belt and Road Initiative.
青藏高原气候变化若干前沿科学问题
DOI:10.7522/j.issn.1000-0240.2021.0029
[本文引用: 1]
在全球变化的背景下,青藏高原冰冻圈和大气圈正在发生快速变化,对“亚洲水塔”和“第三极”的生态环境带来深刻影响。研究并梳理了近年来青藏高原气候变化的若干前沿科学问题的研究进展,如高原极端气候事件变化及其与大气环流的关系;高原变暖放大效应及海拔依赖型变暖的物理机制;再分析资料在高原气候变化应用的适用性;气候模式在高原资料稀缺地区的模拟偏差特征及不确定性;以及不同升温阈值下高原气候变化的预估及其风险等。同时展望了高原气候变化研究的前沿问题和科学难点。认清高原气候变化研究的前沿科学问题,可为“一带一路”倡议顺利实施提供科学依据。
Elevation-dependent warming in mountain regions of the world
DOI:10.1038/nclimate2563 URL [本文引用: 1]
Restriction of economic development in the Hengduan Mountains Area by land and water resources
DOI:10.11821/dlxb202009013
[本文引用: 1]
As a part of the supply of ecosystem services, land and water resources are an important factor restricting economic development in mountainous areas. Taking the Hengduan Mountains Area as a case study, we evaluated the degree of matching between land and water resources and economic development using the Gini coefficient method. Furthermore, the sensitivity of economic growth to land-water factors was analyzed by establishing an extended Cobb-Douglas function based on the individual stochastic effect model. In addition, the growth drag model was introduced to measure the restriction of land-water resources on economic development in the study area quantitatively. The research produced several important results: (1) From 2006 to 2015, the fluctuation ranges of the Gini coefficient between land and water resources and gross domestic product (GDP) in the study area were 0.265-0.298 and 0.389-0.424, respectively. The satisfaction by water resources in different industries was relatively reasonable, but the utilization of land resources for economic development was not satisfactory, especially in the secondary and tertiary industries. (2) The sensitivity analysis results showed that the elasticity of land resources in the region was about twice that of water resources. The cumulative contribution rate of land resources was significantly higher than that of water resources, and the contribution of land resources to economic growth was greater than that of water resources. (3) The average growth drag values of land and water resources were 0.012 and 0.022, respectively, indicating that both land and water resources had obvious restraining effects on the economic development, which was greatly restricted by land resources. The research showed that effective development of mountainous areas in China should focus on the sufficient land-water resources demanded by economic growth. Utilizing the potential of land-water resources and increasing their supply can reduce restriction on economic growth and promote sustainable development.
横断山区水土资源利用与经济增长的匹配关系
DOI:10.11821/dlxb202009013
[本文引用: 1]
水土资源不仅是山区生态系统服务供给的一部分,同时也是山区经济发展的重要投入要素。本文以横断山区为研究对象,利用基尼系数法评估水土资源和经济发展之间的匹配状况,同时基于个体随机效应模型建立拓展的Cobb-Douglas生产函数模型实现了经济增长对水土要素的敏感性分析,引入经济增长阻尼模型定量测算了水土资源对横断山区经济发展的制约程度。结果表明:① 2006—2015年横断山区水资源、土地资源与GDP的区域基尼系数波动范围分别为0.260~0.298和0.389~0.424,水资源对不同产业的满足程度相对合理,而对土地资源的利用与经济发展较不匹配,尤其是第二、三产业;② 敏感性分析结果表明,横断山区土地资源的产出弹性是水资源2倍左右,土地资源的累计贡献率明显高于水资源,土地资源要素对经济增长贡献大于水资源要素。③ 水土资源增长阻尼平均水平分别为0.012和0.022,说明水资源和土地资源对横断山区经济发展均产生明显的约束作用,且受土地资源的限制较大。研究表明中国山区发展需要更加重视水土资源开发利用与经济增长需求的匹配,充分挖掘水土资源的利用潜力提高供给可以降低其对经济增长的制约程度。
Spatio-temporal coupling characteristic of water-land elements and its cause in typical mountains
DOI:10.11821/dlxb201911006
[本文引用: 1]
Water and land resources are the foundation for human wellbeing. The coupling of water-land elements in mountainous areas is closely related to the functionality of production-living-ecology space, whose coupling process and features are closely related to ecosystem services and sustainable socio-economic development in mountainous areas. Through constructing a more scientific coupling index of water-land elements (CIWL), the present study conducted a large-scale and long-term analysis of the coupling characteristics of the Taihang Mountains, Hengduan Mountains and Guizhou-Guangxi karst mountains. The influencing factors of the coupling index in each period were analyzed by employing geodetector method. The results show that: (1) The three mountainous areas are significantly different in spatial differences of coupling index of water-land elements. The Taihang Mountains are dominated by water deficiency, while the Hengduan Mountains are by the balanced area. The Guizhou-Guangxi mountainous areas are dominated by water deficiency and the abundant areas. (2) In terms of the vertical differentiation, the coupling of water-land elements of the three major mountainous areas varies at 1300 m, 1800-3400 m and 500-1500 m, respectively, with the coupling index of water-land elements in ecological functional sub-regions indicating that the forest ecological sub-region > forest grass ecological sub-region > agro-ecological sub-region. (3) Natural factors and human factors are responsible for spatial differentiation of coupling index, among which, the climate is a dominant driving factor, the topography and land use type are secondary, and the human factors are superimposed on the natural factors, jointly causing the complexity and variation of the coupling of water-land elements. The coupling index of water and land elements established in this paper has deepened the study of spatial-temporal processes of water and land interaction in mountainous areas, thereby providing a decision-making reference for coping with the sustainable development of mountainous areas in a changing environment.
典型山地水土要素时空耦合特征及其成因
DOI:10.11821/dlxb201911006
[本文引用: 1]
水土资源是人类生存的基础,山地水土要素耦合性与“三生空间”的功能性密切相关,其耦合的时空过程及规律关乎山区的生态服务与经济社会可持续发展。通过构建更加科学的水土要素耦合指数对太行山地、横断山地、黔桂喀斯特山地水土要素耦合特征进行大尺度、长时序的分析,并采用地理探测器方法分析了各时期水土耦合的影响因素。结果表明:① 三大山地水土要素耦合空间差异十分显著。太行山地以缺水区为主,横断山地以平衡区为主,黔桂喀斯特山地平衡区和充沛区兼有。② 垂直分异上,三大山地水土要素耦合指数分别在1300 m、1800~3400 m、500~1500 m处发生变异。各山地水土要素耦合指数在生态功能亚区表现为,林地生态亚区>林草复合生态亚区>农业生态亚区。③ 三大山地水土要素耦合的空间异质性是自然要素和人文要素综合作用的结果。其中,气候要素为主导驱动,地形地貌和土地利用居次,人为作用叠加在自然作用之上,加剧了水土要素耦合的时空复杂性和变异性。本文构建的水土要素耦合指数,加深了山地水土要素相互作用的时空过程研究,可为促进变化环境下的山区可持续发展提供决策依据。
Increasing dependence of lowland populations on mountain water resources
DOI:10.1038/s41893-020-0559-9 URL [本文引用: 1]
Winter melt trends portend widespread declines in snow water resources
DOI:10.1038/s41558-021-01014-9 URL [本文引用: 1]
Estimating snow-cover trends from space
DOI:10.1038/s41558-018-0318-3 URL [本文引用: 1]
Patterns and trends of Northern Hemisphere snow mass from 1980 to 2018
DOI:10.1038/s41586-020-2258-0 URL [本文引用: 1]
Snow depth variability in the Northern Hemisphere mountains observed from space
Accurate snow depth observations are critical to assess water resources. More than a billion people rely on water from snow, most of which originates in the Northern Hemisphere mountain ranges. Yet, remote sensing observations of mountain snow depth are still lacking at the large scale. Here, we show the ability of Sentinel-1 to map snow depth in the Northern Hemisphere mountains at 1 km² resolution using an empirical change detection approach. An evaluation with measurements from ~4000 sites and reanalysis data demonstrates that the Sentinel-1 retrievals capture the spatial variability between and within mountain ranges, as well as their inter-annual differences. This is showcased with the contrasting snow depths between 2017 and 2018 in the US Sierra Nevada and European Alps. With Sentinel-1 continuity ensured until 2030 and likely beyond, these findings lay a foundation for quantifying the long-term vulnerability of mountain snow-water resources to climate change.
Hotspots of snow cover changes in global mountain regions over 2000-2018
Changes in seasonal snow water equivalent distribution in High Mountain Asia (1987 to 2009)
Spatiotemporal variability of temperature in northern and southern Qinling Mountains and its influence on climatic boundary
DOI:10.11821/dlxb201801002
[本文引用: 2]
A study on temperature variations in the northern and southern Qinling Mountains is performed using temperature series at 70 meteorological stations for the period 1970-2015. Temporal trends, spatial characteristics, 0 ℃ isotherm displacement and the number of days with active accumulated temperature above 10 ℃ are evaluated, using extreme-point symmetric mode decomposition (ESMD), spatial analysis and other climate diagnosis methods. The significance of climatic boundary line of the Qinling Mountains is explored in the context of global warming. Four new insights have been achieved: (1) The changing trends of temperature in the northern and southern Qinling Mountains over the past 46 years are synchronous, with the warming process shown as a 'non-smooth, nonlinear, and ladder-shaped' pattern. The evolution process can be divided into three periods: the low stationary fluctuation period in 1960-1993, followed by a rapid increase period in 1994-2002, and finally a warming stagnation period in 2003-2015. (2) The ESMD decomposition indicates that the changing trends of temperature over the northern and southern Qinling Mountains are dominated by interannual fluctuation, and have no obvious linear trend. (3) The spatial variation of temperature in the Qinling Mountains is characterized by 'synchronous warming, and differential north-south change'. In the north, the spatial variation of temperature is relatively consistent, while in the south low temperature centers are observed at Xixiang-Ankang basin and Shangdan basin. (4) The Qinling Mountains, as a climatic boundary line, still play a major/obvious role; however, there exists difference in the response of temperature variations to global warming over the north and south of the Qinling Mountains. The northern boundary of north subtropical zone extends upward along the southern Qinling Mountains; while warming zone extends by the form of enclave in the northern Qinling Mountains due to rapid urbanization and mountain blocking.
1970—2015年秦岭南北气温时空变化及其气候分界意义
DOI:10.11821/dlxb201801002
[本文引用: 2]
基于秦岭南北70个气象站点观测资料,辅以极点对称模态分解方法(ESMD),对秦岭南北近期气温时空变化特征进行分析,进而以日平均温≥ 10 ℃积温天数为主要指标,以1月0 ℃等温线变化为辅助指标,探讨秦岭山脉的气候分界意义。结果表明:① 1970-2015年秦岭南北气温变化具有同步性,呈现出“非平稳、非线性、阶梯状”的增暖过程,变化阶段可分为:1970-1993年为低位波动期、1994-2002年为快速上升期、2003-2015年为增温停滞期;② ESMD信息分解结果表明,秦岭南北气温变化以年际波动为主导,并未呈现出明显的线性增暖趋势;③ 在空间上,秦岭南北气温趋势呈现“同步增温,南北分异”的响应特征,即秦岭以北地区空间增温具有一致性,秦岭以南地区则呈现“西乡—安康盆地交界”、“商丹盆地”两个低值中心;④ 在气候变暖背景下,秦岭作为气候分界线的作用依然明显,但是南北响应方式存在差异。其中,秦岭以南,北亚热带北界沿山地“垂直上升”,汉江谷地热量资源逐年增加;秦岭以北,尽管以城市带为中心的增温区不断延展,但是冷月气温偏低的格局并未改变。
South-to-North Water Diversion stabilizing Beijing's groundwater levels
Groundwater (GW) overexploitation is a critical issue in North China with large GW level declines resulting in urban water scarcity, unsustainable agricultural production, and adverse ecological impacts. One approach to addressing GW depletion was to transport water from the humid south. However, impacts of water diversion on GW remained largely unknown. Here, we show impacts of the central South-to-North Water Diversion on GW storage recovery in Beijing within the context of climate variability and other policies. Water diverted to Beijing reduces cumulative GW depletion by ~3.6 km, accounting for 40% of total GW storage recovery during 2006-2018. Increased precipitation contributes similar volumes to GW storage recovery of ~2.7 km (30%) along with policies on reduced irrigation (~2.8 km, 30%). This recovery is projected to continue in the coming decade. Engineering approaches, such as water diversions, will increasingly be required to move towards sustainable water management.
Climatology of snow in China
DOI:10.13249/j.cnki.sgs.2012.010.1176
[本文引用: 1]
:Climatic characteristics of snowfall, snow days, snow belt north of 25°N in China is analyzed using the daily snow observation data. The following results have been obtained in the analysis.1) Snow season length and snow days have the feature of latitudinal distribution in the east, with the Da Hinggan Mountains recording the longest (>210 d) snow season, and no snow or only occasional snow all year round in the south of the Yangtze River. In the west, Qinghai Province has the longest (>300 d) snow season, followed by the junction areas of Yunnan, Sichuan and the Tibet. Snow season length in northern Xinjiang is close to the north of Northeast China. The least snowfall occurs in the southeast, and Northeast and northern Northwest record the higher snowfall more (>30 mm),and Qinghai and Tibet are characterized by the highest snowfall(>60 mm). Maximum snowfall intensity is in the Yangtze-Huaihe region. 2) Snow belts are divided based on snowfall frequency: the Northeast and eastern Inner Mongolia, Northern Xinjiang, the Qinghai-Tibet Plateau, and the Qinling Mountains are snow-frequent belts. Southern Yunnan, Sichuan Basin, coastal areas of Jiangsu and Zhejiang and other areas are permanent snow-free belts.The other areas are snow-ordinary belts and snow-occasional belts. 3) The percentage of snowstorm days to total snow days is generally low in all of the regions. The highest percentage is seen for light snow days to total snow days. In view of the ratio of snowfall of all categories to total snowfall, the proportion of snowstorm witnesses the lowest value, followed by heavy snow, and light snow has the highest value in the north of Northeast, North, Northwest, Xinjiang and eastern Tibet Plateau. However, Southeast China is characterized by lowest value of the ratios for light snow, and the highest value for snowstorm. 4) The double-peak distribution of snowfall within the year is seen in northern Northeast, Northwest, Xinjiang and eastern Tibet Plateau, and the Yellow-Huai River basins and Southeast have a single-peak distribution of snowfall. 5) The total snow days, heavy snow days, medium snow days and light snow days generally increase with increasing latitude in the East of China, meanwhile with increasing altitude in the West; with increasing latitude, the total snowfall intensity has a decreasing trend in both the East and the West, also the small snow intensity in the West.
中国降雪气候学特征
DOI:10.13249/j.cnki.sgs.2012.010.1176
[本文引用: 1]
利用逐日地面降雪观测资料,分析中国25ºN以北范围内降雪量、降雪日数、雪带分布和各强度降雪的气候学特征,得到以下结论:① 雪季长度与年降雪日数在东部呈纬向分布,大兴安岭北部最长(>210 d),长江以南最短(常年无雪或偶尔降雪);在西部青海省南部和西藏自治区北部最长(>300 d),滇、川、藏交界处及新疆自治区北部较长,南疆较短(<60 d)。年降雪量东南部最少,东北和西北北部较多(>30 mm),青海和西藏降雪量最多(>60 mm)。平均降雪强度江淮一带最大。② 根据雪季降雪频次划分中国的雪带,东北大部、内蒙自治区东部、新疆北部、青藏高原大部、秦岭等地区为常年多雪带;长江以南的滇南、四川盆地、江浙沿海等地区为永久无雪带;其余地区为常年降雪带和偶尔降雪带。③ 不同区域各级降雪日数占总降雪日数的比例都是暴雪日数最少,大雪日数其次,小雪日数最多;但中雪降雪量占总降雪量的比例在东北北部、华北、西北、新疆、东南、青藏高原东部等区域仅高于小雪降雪量,而在黄-淮地区仅次于暴雪降雪量。④ 降雪年内分配在东北北部、西北、新疆、青藏高原东部等地区都呈双峰型,最多雪时节在早冬和晚冬、早春,隆冬时节并不是降雪最多时间,黄-淮和东南地区呈单峰型,东南地区峰值更陡。⑤ 总降雪日数和除暴雪外的各等级降雪日数与地理位置关系较明显,在中国东部主要随着纬度升高增加,在中国西部随海拔高度增加而增加;随着纬度升高,东部和西部的总降雪强度都减小,西部的小雪强度也减小。
The characteristics and causes of the snow cover variation in the Taibai Mountains during 1962-2014
1962—2014年秦岭主峰太白山地区积雪变化特征及其成因分析
Analysis on the variation characteristics of regional alpine snow cover events in the Qinling Mountains
DOI:10.7522/j.issn.1000-0240.2021.0129
[本文引用: 1]
Using a total of 37 a high mountain snow observation data from 32 national meteorological stations in the Qinling Mountains in Shaanxi Province from 1980 through 2016, statistical analysis has been done of the regional alpine snow cover processes with 5 or more consecutive days with snow cover more than or equal to 3 days. The regional stable alpine snow cover processes of long-term alpine snow cover process with 5 or more weather stations with continuous snow cover days greater than or equal to 20 days, 5 or more weather stations with continuous snow cover days greater than or equal to 60 days, have been studied also. The results show that in the Qinling Mountains from 1980 through 2016 there were 114 regional alpine snow cover events, including 29 regional long-term alpine snow cover events and 6 regional stable alpine snow cover events. Regional alpine snow cover events occurred from November to April (the cold season), among them 60% occurring in winter (December to February). There were 6 regional stable snow cover events with an average of 73.7 days per snow cover event. The longest regional stable snow cover event, totally lasting 81 days, occurred from November 7, 2003 to April 18, 2004. The number of regional alpine snow events was the highest in the 1980—1989 (44 times), followed by 1990—1999 and 2000—2009 (29 times each), and the least one in 2010—2016 (12 times). The average temperature and precipitation in winter had significantly correlated with the atmospheric circulation index, and had significantly negatively correlated with the Tibetan Plateau Index, the Indo-Burma Basin Intensity Index, the Antarctic Oscillation Index and the Western Pacific Subtropical High West Point Index. Beside, they had clearly positively correlated with the Pacific Trade Wind Index and the Asian Polar Vortex Area Index. In the context of climate warming, the regional snow cover events in the Qinling Mountains had showed a significant reduction trend in 1980—2016, with a reduction rate of -0.8 times/10a. The average number of long-term incidents in various epochs was once a year in the 1980s, 0.9 times a year in the 1990s and only 0.4 times per year in the 1910s. After 2004, there was no regional stable mountain snow cover event in the Qinling Mountains. In 1980—2016, there were 161 snow events in Taibai Station, including 58 long-term snow cover events and 37 snow-stabilizing events. At the 37 a, the regional alpine snow cover events at Taibai Station had showed a decreasing trend with a reduction rate of -0.47 times per 10 years.
秦岭区域性高山积雪事件变化特征分析
DOI:10.7522/j.issn.1000-0240.2021.0129
[本文引用: 1]
为了研究秦岭高山积雪事件变化特点,利用秦岭陕西境内32个国家气象站1980—2016年度共37年高山积雪观测记录,统计分析5个或者5个以上气象站连续积雪日数≥3 d的区域性高山积雪事件、5个或者5个以上气象站连续积雪日数≥20 d的区域性长时间高山积雪事件、5个或者5个以上气象站连续积雪日数≥60 d的区域性稳定高山积雪事件,结果表明:秦岭1980—2016年度共出现区域性高山积雪事件114次,其中包含区域性长时间高山积雪事件29次,区域性稳定高山积雪事件6次。区域性高山积雪事件均发生在冷季(11月—次年4月),其中60%的区域性高山积雪事件发生在冬季(12月—次年2月)。6次区域性稳定高山积雪事件都发生在12月—次年3月。区域性高山积雪事件1980—1989年度最多(44次),其次是1990—1999年度和2000—2009年度(各29次),2010—2016年度最少(12次)。1980—2016年度,区域性高山积雪事件呈现明显减少趋势(通过α=0.01的信度检验),减幅为-0.86次?(10a)<sup>-1</sup>,区域性高山稳定积雪事件次数与冷季平均气温呈显著的负相关关系(通过α=0.01的信度检验)。
The variation characteristics of snow cover in the Mount Hua from 1953 to 2016 and its relationship to air temperature and precipitation
DOI:10.7522/j.issn.1000-0240.2019.0077
[本文引用: 1]
The basic variation characteristics of snow cover in the Mount Hua and its relationship to temperature and precipitation were analyzed by using linear tendency estimate, M-K inspection, correlation analysis and path analysis, based on the snow cover observation data in the Mount Hua weather station from 1953 to 2016 and satellite remote sensing data from 1989 to 2016. The results demonstrated that: (1) Average days of snow cover were 78.5 d. Snow cover mainly occurred from October to the following May. The beginning date of snow cover had delayed; the ending date of snow cover had advanced; the days from the beginning to the ending had decreased; the days of snow cover had decreased significantly with the rates of winter half year and winter from 1953 to 2016; the annual, winter half year and winter snow days had significantly reduced by 8.3 d?(10a)-1, 7.6 d?(10a)-1, 4.7 d?(10a)-1, respectively. There was no significant decreasing trend of annual maximum snow depth and annual accumulated snow depth had decreased significantly with the rate of 88.2 cm?(10a)-1 from 1981 to 2016. Monthly decreasing trend of snow cover days, maximum snow depth and accumulated snow depth were the most significant in March during the 36 years. There was no obvious decrease of snow cover area, light snow cover area and deep snow cover area in the Mount Hua from 1989 to 2016. (2) From 1953 to 2016 average temperature had risen, precipitation had decreased, the days of snow cover had a significant negative correlation with average temperature and a significant positive correlation with precipitation in the Mount Hua. Temperature was the key factor impacting snow cover days in year, winter half year and winter. The annual, winter half year and winter days of snow cover all had changed abruptly in the years close to the year that average temperature changed abruptly. (3) Average temperature and precipitation had significantly correlated with atmospheric circulation index in winter half year and in winter from 1953 to 2016. The snow cover days of winter and winter half year had negatively correlated with atmospheric circulation indexes, such as Tibet Plateau Region index, India-Burma Trough intensity index, Antarctic Oscillation and Western Pacific Sub Tropical High Western Ridge Point index, and had positively correlated with East Pacific 850 hPa Trade Wind index and Asia Polar Vortex area index significantly.
1953—2016 年华山积雪变化特征及其与气温和降水的关系
Spatio-temporal variation of cold-season snowfall in the south and north of the Qinling Mountains during 1970-2018
DOI:10.13249/j.cnki.sgs.2022.01.016
[本文引用: 2]
<p>Snowfall in China has significant uncertainty and spatial differences, and its response to climate change is complex. Therefore, it is of great scientific significance to analyze the characteristics of snowfall along the north-south transition zone of the Qinling Mountains. Based on the daily meteorological data of 72 stations, we analyzed the type of snowfall (rain, snow, and sleet) along the northern and southern boundaries of the Qinling Mountains in the cold season (occurred from November to the following May) during 1970/1971-2018/2019. The study focuses on the spatiotemporal variation of snowfall, and the response relationship between snowfall, air temperature and wet bulb temperature was analyzed. According to the continuous change characteristics of the sea surface temperature anomaly in summer, autumn and winter Niño 3.4, we further identified the 4 types ofdifferent development El Niño-Southern Oscillation (ENSO) events to reveal that the relationships between different developing ENSO events and snowfall anomalies. The results showed that 1) Snowfall in the north and south of the Qinling Mountains showed a fluctuating deceasing trend in winter. Compared with the average snowfall in 1970-2000, there was a trend that in the south slope of the Qinling Mountains (warm temperate zone) decreased by 3.1 mm in recent 29 years, which was basically equal to the snowfall in the Guanzhong Plain (17.1 mm). 2) Considering the isoline of 1000 m as the dividing boundary, the snowfall in the low-altitude valley (<1000 m) did not show an obvious changing trend, while the snowfall in the high-altitude mountain area (>1000 m) showed a significant decrease. 3) As for the response relationship between snowfall and temperature, the air temperature or wet bulb temperature increased by 1.0℃ from November to March of the second year, and the snowfall in alpine area of the Qinling Mountains decreased by 23.1 mm and 24.3 mm respectively. However, the air temperature or wet bulb temperature increases by 1.0℃ from north to south, the snowfall decrease by 3.0 mm and 2.8 mm in zonality, respectively. 4) The analysis showed that from the perspective of disaster-forming factors, the types of ENSO events affecting the snow anomaly to the north and south of the Qinling Mountains are mainly successive El Niño events. When the successive El Niño/La Niña events occurred, anomalously more snowfall in Guanzhong Plain. When the developing La Niña events occurred, anomalously less snowfall in the Qinling and Dabashan Moutains. When the developing El Niño events occurred, the below normal snowfall in eastern of region and Guanzhong Plain.</p>
1970—2018年秦岭南北冷季降雪量时空变化及其影响因素
DOI:10.13249/j.cnki.sgs.2022.01.016
[本文引用: 2]
基于72个气象站点逐日观测数据,对1970/1971—2018/2019年秦岭南北冷季(11月~次年5月)降水类型(降雪、降雨和雨夹雪)进行识别;重点关注降雪时空变化特征,探讨降雪与气温、湿球温度的响应关系;依据“夏季-秋季-冬季”Niño 3.4区海温异常状态,细化4种不同发展过程的厄尔尼诺-南方涛动(ENSO)事件,分析降雪异常与不同ENSO事件的对应关系。结果表明:① 相比气候平均态(1970—2000年),1990—2018年,秦岭南坡(山地暖温带)降雪量下降了3.1 mm,基本与关中平原降雪量(17.1 mm)持平;② 空间趋势上,低海拔河谷地带降雪量以年代波动为主,山地高海拔地区为降雪下降区;③ 秦岭高山地区气温或湿球温度每升高1.0℃,降雪量分别下降23.1 mm和24.3 mm;从地带性角度分析,由北向南气温或湿球温度每升高1.0℃,秦岭南北降雪量分别下降3.0 mm和2.8 mm;④ 当厄尔尼诺/拉尼娜持续型发生时,关中平原降雪异常偏多;当拉尼娜发展型发生时,秦岭山地和大巴山区降雪异常偏少。当厄尔尼诺发展型发生时,秦岭南北降雪异常呈现“东西分异”,秦岭山地东部和关中平原为降雪异常偏少区。
Estimation of air temperature based on MODIS and analysis of mass elevation effect in the Qinling-Daba Mountains
DOI:10.11821/dlyj020190164
[本文引用: 1]
As a huge mountain range in the North-South boundary of China, the Qinling-Daba Mountains are characterized by prominent mass elevation effect (MEE) and play an important role in the azonality pattern of climate and ecology in central China. The essence of the MEE is the warming effect of mountains, as huge mountain and plateau absorbs more solar radiation compared with the free atmosphere of the same altitude and then releases in the form of long-wave radiation external heat, making the internal mountain temperature higher than the external in the same altitude of free atmosphere. Therefore, the temperature difference between the mountain interior and the periphery has been suggested as an appropriate indicator to quantify the MEE. To analyze MEE of the Qinling-Daba Mountains, MODIS land surface temperature (LST) data, STRM-1 DEM data and observation data from 118 meteorological stations were combined to estimate monthly mean air temperature by ordinary linear regression (OLS) and geographical weighted regression (GWR) methods in the Qinling-Daba Mountains. Air temperature at an altitude of 1500 m (the average elevation of the Qinling-Daba Mountains) in the interior of the Qinling-Daba Mountains was calculated by a fixed lapse rate and compared with that in the periphery. The results show that: (1) Compared with OLS method, the GWR method has higher accuracy with R 2 > 0.89 and the root mean squared error (RMSE) = 0.68-0.98 ℃. (2) The monthly mean temperature at the altitude of 1500 m estimated by GWR presents a gradual upward trend from east to west. In the western Qinling Mountains, the annual average temperature and temperature in July at the altitude of 1500 m increase about 6 ℃ and 4.5 ℃ compared with the eastern flank, while in the Daba Mountains, they are about 8°C and 5 ℃ higher in the west than in the east. (3) From south to north, with the Hanjiang River as the boundary, the monthly mean temperature at the altitude of 1500 m tends to rise from the rim of the mountains to the ridge. (4) Compared with the lower valleys in Hanzhong and western Henan, the monthly mean temperatures at the altitude of 1500 m are approximately 3.85-9.28 ℃, 1.49-3.34 ℃ and 0.43-3.05 ℃ higher those in the great undulating high mountains in the western Qinling-Daba Mountains, the great undulating middle-high mountains in the Qinling Mountains and the great undulating middle mountains in the Daba Mountains, respectively, and the average temperature difference is about 3.50 ℃. This shows that the MEE of the Qinling-Daba Mountains is obvious and its impact on the distribution patterns of mountain climate and ecology needs to be further studied.
基于MODIS的秦巴山地气温估算与山体效应分析
DOI:10.11821/dlyj020190164
[本文引用: 1]
秦巴山地作为横亘在中国南北过渡带的巨大山脉,其山体效应对中国中部植被和气候的非地带性分布产生了重要的影响,山体内外同海拔的温差是表征山体效应大小较为理想的指标。本研究结合MODIS地表温度(LST)数据、STRM-1 DEM数据和秦巴山地的118个气象站点的观测数据,分别采用普通线性回归(OLS)和地理加权回归(GWR)两种分析方法对秦巴山地的气温进行估算,在此基础上将秦巴山地各月气温转换为同海拔(1500 m,秦巴山地平均海拔)气温,对比分析秦巴山地的山体效应。结果表明:① 相比OLS分析,GWR分析方法的精度更高,各月回归模型的R <sup>2</sup>均在0.89以上,均方根误差(RMSE)在0.68~0.98 ℃之间。② 利用GWR估算得到的同海拔气温,从东向西随海拔升高呈现了明显的升高的趋势,秦岭西部山地比东段升高约6 ℃和4.5 ℃;大巴山西部山地年均和7月份同海拔的气温较东段升高约8 ℃和5 ℃。③ 从南向北,以汉江为分界,秦岭与大巴山的同海拔的气温均呈现出由山体边缘向内部升高的趋势。④ 秦巴山地西部大起伏高山,秦岭大起伏高中山和大巴山大起伏中山,相比豫西汉中中山谷地,各月均同海拔气温分别升高了约3.85~9.28 ℃、1.49~3.34 ℃和0.43~3.05 ℃,平均温差约为3.50 ℃,说明秦巴山地大起伏中高山的山体效应十分明显。
Variations in January temperature and 0 ℃ isothermal curve in Qinling Mountains based on DEM
基于DEM的秦岭山地1月气温及0 ℃等温线变化
Spatial structures of altitudinal belt and their significance for determining the boundary between warm temperate and subtropical zone in Qinling-Daba Mountains
秦巴山地垂直带谱结构的空间分异与暖温带—亚热带界线问题
DOI:10.11821/dlxb201905004
[本文引用: 1]
秦巴山地垂直带谱结构的空间分异对于揭示秦巴山地地域结构复杂性和过渡性、探索中国复杂的生态地理格局具有重要的意义。本文从文献中搜集了秦巴山地33个山地垂直带谱,建立了秦巴山地数字垂直带谱体系,从纬向、经向和坡向3个维度分析了山地垂直带谱的结构、特征、数量、高度以及分布模式。结果表明:① 纬向上从南向北基带由亚热带常绿阔叶林带逐渐转变为暖温带落叶阔叶林带;垂直带结构由复杂逐渐变得简单;优势带由山地针阔混交林和山地常绿落叶阔叶混交林转变为山地落叶阔叶林带;② 经向上山地垂直带结构呈现复杂—简单—复杂的特征;常绿落叶阔叶混交林带和山地落叶阔叶林带的海拔呈现了二次曲线分布模式;山地针阔混交林带的海拔则呈现显著的线性降低趋势;③ 坡向方面,秦岭北坡和南坡基带均为暖温带落叶阔叶林带,但南坡含有常绿成分;大巴山北坡为亚热带常绿落叶阔叶混交林带,大巴山南坡为亚热带常绿阔叶林带;秦岭和大巴山北坡优势带类似,均为山地针阔混交林带或山地落叶阔叶林带,但大巴山南坡具有独特的山地常绿落叶阔叶混交林优势带,这表明了大巴山比秦岭更适合作为暖温带和北亚热带的分界线,但是未来还需使用土壤和气候指标进行系统的分析。
The finding and significance of the super altitudinal belt of montane deciduous broad-leaved forests in central Qinling Mountains
DOI:10.11821/dlxb202209007
[本文引用: 2]
Mountain altitudinal belts are the miniature of horizontal differentiation and succession of climatic and vegetational zonation. However, altitudinal belts' vertical range, transition model, inner structure and combining pattern vary from place to place. In Mt. Taibai of the central section of China's north-south transitional zone, we have found an altitudinal belt with the largest range in the world, namely, the montane deciduous broad-leaved forest, which extends continuously from the mountain base to about 2800 m, including basal oak belt, typical oak belt of two sub-belts and cold-tolerant pioneer birch belt of two sub-belts, which could otherwise develop independently. Characterized by a "three layers and five sub-belts" structure, this "super altitudinal belt" is much vertically broader than the threshold of 1000 m for normal altitudinal belts. Its formation is closely related with its transitional geographic location, integral spectrum of altitudinal belts in central Qinling Mountains, rich and diverse species of deciduous woody plants, and their strong competitiveness. The finding of the super altitudinal belt has multiple significance: Its existence is another significant physio-geographic feature of China's north-south transitional zone; it shows that an altitudinal belt may have rather complex inner structure and broad vertical range in some special mountain environment. This broadens our understanding of altitudinal belt structures and their mechanisms, and is of great significance for developing structural theory for montane altitudinal belts. This finding also demonstrates that there are many big questions for us to explore and study in the north-south transitional zone, and it is expected that our finding could trigger in-depth study of local climate and biodiversity responsible for the formation of this super belt, and of the complex structure and ecological effect of China's north-south transitional zone.
秦岭中部山地落叶阔叶林超级垂直带的发现与意义
DOI:10.11821/dlxb202209007
[本文引用: 2]
山地垂直带谱是气候和植被水平地带变化和更替的缩影,垂直带的带幅、带间过渡方式、带内结构和垂直带组合方式都表现出高度的异质性和复杂性。本文发现在中国南北过渡带中部太白山发育了世界上最宽的山地垂直带——山地落叶阔叶林垂直带。该垂直带从基带到典型垂直带再到先锋性垂直带皆为山地落叶阔叶林,3种本来可以独立存在的垂直带,连续分布形成了包含3个栎林亚带、2个桦林亚带的“三层五亚带”超级垂直带,远远超过正常情况下山地垂直带1000 m的阈值,且其上限达到了海拔2800 m。它的形成与秦岭所处的过渡性地理位置、秦岭中部垂直带谱的完整性、丰富的落叶木本植物种群及其形成的强大群落竞争优势等因素紧密相关。超级垂直带的发现有多方面的意义:它是中国南北过渡带又一重要的标志性自然地理特征;它表明山地垂直带在特殊的山地环境中可以具有非常复杂的内部结构和宽大带幅,这扩展了我们对山地垂直带谱结构及机理认识的广度,对于创建山地垂直带谱结构理论具有十分重要的意义;超级垂直带的发现,也说明中国南北过渡带还有很多科学内容有待我们去探索和发现,希望本文能起到抛砖引玉的作用,引起学界对超级垂直带形成的气候和生物多样性因素、地理过渡带的结构和生态效应等重大问题进行深入研究。
The finding and significance of the super altitudinal belt of montane deciduous broad-leaved forests in central Qinling Mountains
DOI:10.11821/dlxb202207013
[本文引用: 1]
A clear understanding of the precipitation variation patterns at high altitudes of the Qinling Mountains is a prerequisite for an in-depth understanding of the characteristics of this mountain range as China's north-south transitional zone and its important role of water resources in the Middle Route of South-North Water Transfer Project. However, understanding the precipitation changes in the mountainous areas of the Qinling Mountains has been hindered by limited effective precipitation observation data in these mountainous areas. An analysis of precipitation data measured from June 1, 2018, to May 31, 2019, at an altitude of 3760 m at the Mount Taibai of the Qinling Mountains revealed that the annual precipitation at this altitude can reach 1300 mm, which is much more than the 600-800 mm annual precipitation recorded in the Hanjiang Basin and the Guanzhong Plain. On this basis, the persistence of annual and seasonal precipitation patterns in the Qinling Mountains was examined by kriging, inverse distance weighted interpolation, and ANUSPLIN methods, as well as GPM-corrected data (GPM-cal) and ERA5 reanalysis data. Accurate high-altitude precipitation values could not be obtained using kriging and IDW. However, GPM-cal, ANUSPLIN, and ERA5 data could more accurately portray the variation of annual precipitation with topography in the Qinling Mountains. An analysis of water vapor fluxes showed that the Mount Taibai has significant blocking, forcing, and intercepting effects on southward moist airflow below the 600 hPa height owing to its high terrains, making its southern slope a regional center of high precipitation values. Combining high mountain precipitation observations, ANUSPLIN, multi-source grid point information, and data correction methods is an effective way to understand precipitation formation and variation in the Qinling Mountains.
秦岭中部山地降水的垂直变化研究
DOI:10.11821/dlxb202207013
[本文引用: 1]
明确秦岭高海拔山区降水的变化规律,是深入理解秦岭作为中国南北地理过渡带特征、认识秦岭水资源在南水北调中线工程中重要作用的前提。但秦岭高海拔地区长期缺乏有效的降水观测数据,导致对其降水变化缺乏了解。利用2018年6月1日—2019年5月31日秦岭太白山海拔3760 m实测降水数据,发现在秦岭海拔3760 m处年降水量可达1300 mm,远高于汉江盆地和关中平原600~800 mm的年降水量。在此基础上,检验了克里金(Kriging)、反距离加权(IDW)和薄盘样条(ANUSPLIN)插值方法,以及GPM修正数据(GPM-cal)和ERA5再分析资料对秦岭中部山地年和季节降水空间模态的再现效果,各方案均能揭示秦岭高山区是降水高值中心,且降水随海拔的升高而增大,但利用克里金、反距离加权插值方案不能得到准确的高海拔降水值,与此相比,GPM-cal数据、薄盘样条插值与ERA5资料能较准确刻画秦岭中部山地年降水量随地形的变化。水汽通量分析显示,秦岭凭借高大地形对600 hPa高度以下的南来湿润气流具有明显的阻挡、强迫和拦截作用,使其南坡成为区域降水高值中心。结合高山区降水观测、薄盘样条插值、多源格点资料和数据修正方法,是认识秦岭山地降水形成和变化的有效途径。
Decadal change of heavy snowfall over northern China in the mid-1990s and associated background circulations
DOI:10.1175/JCLI-D-19-0815.1 URL [本文引用: 1]
Characteristics and internal dynamical causes of the interdecadal variability of East Asian winter monsoon near the late 1990s
20世纪90年代末东亚冬季风年代际变化特征及其内动力成因
Chinese ice storm: Its socioeconomic-ecological impact and sustainability lessons learned
DOI:10.1175/2010BAMS2857.1 URL [本文引用: 1]
A comparative study of the two weather processes with cold and snowing in southern China in 2008 and 2016
中国南方2008年与2016年两次低温雨雪冰冻天气过程对比分析
Interdecadal variability of the East Asian winter monsoon and its possible links to global climate change
东亚冬季风的年代际变化及其与全球气候变化的可能联系
Decadal change in the correlation pattern between the Tibetan Plateau winter snow and the East Asian summer precipitation during 1979-2011
DOI:10.1175/JCLI-D-12-00587.1 URL [本文引用: 3]
An interdecadal change in the influence of ENSO on the spring Tibetan Plateau snow-cover variability in the early 2000s
DOI:10.1175/JCLI-D-21-0348.1 URL [本文引用: 1]
Influence of Tibetan Plateau snow cover on East Asian atmospheric circulation at medium-range time scales
The responses of atmospheric variability to Tibetan Plateau (TP) snow cover (TPSC) at seasonal, interannual and decadal time scales have been extensively investigated. However, the atmospheric response to faster subseasonal variability of TPSC has been largely ignored. Here, we show that the subseasonal variability of TPSC, as revealed by daily data, is closely related to the subsequent East Asian atmospheric circulation at medium-range time scales (approximately 3-8 days later) during wintertime. TPSC acts as an elevated cooling source in the middle troposphere during wintertime and rapidly modulates the land surface thermal conditions over the TP. When TPSC is high, the upper-level geopotential height is lower, and the East Asia upper-level westerly jet stream is stronger. This finding improves our understanding of the influence of TPSC at multiple time scales. Furthermore, our work highlights the need to understand how atmospheric variability is rapidly modulated by fast snow cover changes.
Review of snow cover variation over the Tibetan Plateau and its influence on the broad climate system
Progress in the study of impacts of different types of ENSO on the East Asian monsoon and their mechanisms
不同类型ENSO对东亚季风的影响和机理研究进展
Spatial-temporal variation of summer precipitation in China based on ENSO development process
DOI:10.31497/zrzyxb.20220316 URL [本文引用: 1]
基于ENSO发展过程的中国夏季降水时空变化特征
The diversity of ENSO evolution during the typical decaying periods determined by an ENSO developing mode
DOI:10.1175/JCLI-D-21-0892.1 URL [本文引用: 1]
China MODIS daily 500 m snow area product dataset
中国MODIS逐日无云500 m积雪面积产品数据集
Estimates of the regression coefficient based on Kendall's tau
DOI:10.1080/01621459.1968.10480934 URL [本文引用: 1]
A numerical study on the relationship between the spring-winter snow cover anomalies over the northern and southern Tibetan Plateau and summer precipitation in east China
青藏高原南、北积雪异常与中国东部夏季降水关系的数值试验研究
The decadal relationship between atmospheric heat source of winter and spring snow over the Tibetan Plateau and rainfall in east China
青藏高原大气热源和冬春积雪与中国东部降水的年代际变化关系
Redetermine the region and boundaries of Tibetan Plateau
DOI:10.11821/dlyj020210138
[本文引用: 1]
With the advances in research of the Tibetan Plateau (TP) and the deep understanding of multi-disciplinary research, coupled with the progress of geographic big-data, earth observation science and technology, this research systematically discussed the principles, methods and basis for determining the boundaries of the TP. It analyzed the macro landform structures (plateau surface, low basin and deep-cut valley lowland on the edge of the TP) within the TP and the fundamental characteristics of the geographic units' composition in TP's surrounding areas. Based on the high resolution remote sensing images, DEM data and geomorphologic maps etc., the boundary of TP with a 1:1000000 scale is defined through a comparative study of geomorphological features with the support of Arcmap 10.5. The results show that the Tibetan Plateau stretches from the foot of the Himalayas in the south to the foot of the Kunlun Mountains and the Qilian Mountains in the north, with a total length of 1560 km. While it spans about 3360 km from the Hindu Kush Mountains and the Pamir Plateau in the west, to the eastern foot of Hengduan Mountains in the east. The TP, lying between 25°59′26″N-40°1′6″N and 67°40′37″E-104°40′43″E, covers a total area of 3083.44 × 103 km2, with an average altitude of 4320 m. Geographically, the TP is located in Southwest China and eight other countries including India, Pakistan, Tajikistan, Afghanistan, Nepal, Bhutan, Myanmar and Kyrgyzstan. The TP in Chinese section has an area of 2580.90 × 10 3 km2, accounting for around 83.7% of the total area, with an average altitude of 4400 m. In China's part, the TP spans in six provincial-level regions: Tibet Autonomous Region (TAR), Qinghai province, Gansu province, Sichuan province, Yunnan province and Xinjiang Uygur Autonomous Region. Among them, the main parts of TAR and Qinghai are the major section of the TP, which accounted for 60.6% of the total area of the plateau.
再论青藏高原范围
DOI:10.11821/dlyj020210138
[本文引用: 1]
伴随青藏高原研究的深入,高原内外多学科研究程度和认识的提高,及地理大数据、地球观测科学和技术的进步,对青藏高原范围提出了新的要求。本研究系统论述了确定青藏高原范围的原则、依据和方法,分析探讨了高原地貌宏观结构(高原面、高原内低盆地与高原边缘河谷低地等)和周围边界各自然地段构成的基本特征。采用ArcMap软件,通过遥感影像和DEM数据及新资料对高原地貌比较研究,实现了1:100万比例尺地图精度的青藏高原范围的界定。研究表明,青藏高原北起西昆仑山-祁连山山脉北麓,南抵喜马拉雅山等山脉南麓,南北最宽达1560 km;西自兴都库什山脉和帕米尔高原西缘,东抵横断山等山脉东缘,东西最长约3360 km;范围为25°59′26″N~40°1′6″N、67°40′37″E~104°40′43″E,总面积为308.34万km<sup>2</sup>,平均海拔约4320 m。在行政区域上,青藏高原分布于中国、印度、巴基斯坦、塔吉克斯坦、阿富汗、尼泊尔、不丹、缅甸、吉尔吉斯斯坦等9个国家。其中中国境内的青藏高原面积约258.09万km<sup>2</sup>(占高原总面积的83.7%),平均海拔约4400 m,分布在西藏、青海、甘肃、四川、云南和新疆等6省区,西藏和青海两省区主体分布在高原范围内(约占高原总面积的60.6%)。
A dataset of snow cover phenology in China based on AVHRR from 1980 to 2020
1980—2020年AVHRR中国积雪物候数据集
