

1 引言
1965—2014年中亚地区升温速率明显高于全球或北半球同期平均水平,且模拟数据也显示未来百年中亚发生极端高温事件和极端降水的频率将显著增大,这将对中亚农业生产产生不利影响[1-2]。中亚大湖区的棉花产量位于世界第三位,其中乌兹别克斯坦素有“白金之国”之称,2000年以来棉花年均产量约110.6万t,是中国棉花的主要进口国之一[3]。乌兹别克斯坦属于典型的大陆性气候,夏季高温少雨;南部7月平均温度为37 ℃,北部为32~33 ℃,且1950年后气温超过40 ℃的天数一直呈增加趋势;平均年降水量191 mm且主要集中在冬季和春季[4]。由于生长季降水缺乏,乌兹别克斯坦难以发展雨养农业,特别是近些年水资源短缺和高温导致的气象干旱已经成为限制棉花生产的重要因素。因此在全球增温的背景下,研究气象干旱对棉花产量的影响将有助于深入认识中亚棉花产业的发展前景、科学预测中国与中亚棉花产业的合作潜力。
已有研究发现干旱胁迫严重限制了棉花的生长发育,如株高、叶干重、茎干重、叶面积指数、果节数、纤维质量、冠层和根系发育等均受到影响[5-6],棉花叶片的净光合速率、蒸腾速率、气孔导度、羧化效率和水势等明显下降[7-8]。植物生长箱中开展的棉花生育控制试验发现,在干旱胁迫下,海岛棉的干物质积累将下降50%,且气孔导度、光合速率和蒸腾速率也有不同程度的下降,并最终影响产量的形成[9]。田间试验也发现当土壤含水量从田间持水量的75%下降至40%时,产量约下降20%~60%[10⇓-12];全生育期内灌溉量减少25%~75%时,棉花产量降低17.1%~55.8%[13⇓-15]。也有研究认为当干旱胁迫发生在不同棉花生育期时,对棉花产量的影响大小存在差异,如初花期受干旱胁迫将导致棉花产量损失约60%;而干旱发生在蕾期、盛花期和吐絮期时,棉花产量将降低25%~35%[16⇓-18]。近年来,研究人员通过传统的数理统计方法,结合作物模型和区域气候模型对棉花产量进行预测,该方法由于充分考虑了气候条件、土壤特征和管理措施等对作物生产的影响,且克服了以往受气象要素空间差异的影响而无法开展大尺度模拟的缺点,目前在评估区域尺度上未来棉花生产潜力方面得到了广泛应用[19-20]。如研究表明由于未来温度和降水变化存在显著的区域性差异,中国西北部、希腊北部地区棉花的产量将提高[21-22],而在澳大利亚东部、埃塞俄比亚北部等地区棉花产量将明显下降[19,23]。此外,CO2浓度升高对棉花产量也有积极影响,但CO2的肥效作用同样因地区而异[24⇓⇓-27],且未来升温和降水变化对棉花产量的影响甚至可能抵消CO2浓度升高的贡献[28-29]。
由于以往在中亚地区棉花大田试验数据积累较少,气候、土壤等相关信息也较为缺乏,因此涉及到气候变化对中亚棉花生产影响的研究还很少。目前主要基于田间试验数据,开展了调整播期[30]、施氮量[31]、灌溉制度[32]、水分胁迫[33]、覆盖地膜[34]等措施对乌兹别克斯坦棉花产量的影响研究,但在全球增暖的大背景下,极端气候事件频发,干旱仍然是未来影响中亚棉花生产的重要因素。因此,本文利用2014年和2021年在乌兹别克斯坦塔什干地区开展的棉花田间试验数据,CMIP6模式模拟的2021—2100年气象数据,借助APSIM-Cotton模型,模拟了未来两个时段(2021—2050年和2061—2090年)气象干旱对中亚棉花产量的影响,并辨识了CO2浓度变化在其中的贡献。研究结果将为制定中亚棉花应对气候变化的适应方案提供科学依据,为未来开展中国与中亚各国棉花产业合作模式提供数据参考。
2 数据与方法
2.1 研究区概况
乌兹别克斯坦是中亚最大的棉花生产国和出口国,棉花生产对乌兹别克斯坦经济起着重要作用。该国每年大约生产83万t棉纤维,棉花生产面积约占全国灌溉土地的40%,2018—2019年生产面积约117万hm2 [30]。本文选择乌兹别克斯坦塔什干地区作为研究区域。该区域属于温带大陆性干旱气候,气温年较差大,7月平均最高气温达37.3 ℃,1月平均最低气温为-1.0 ℃,年平均气温15.6 ℃;年平均降水量316 mm,夏季降水不足50 mm;年日照时数2692~2889 h,无霜期207~230 d。
2.2 田间试验设计
2014年和2021年在乌兹别克斯坦科学院遗传与植物实验生物研究所赞格阿塔实验站(Institute of Genetics and PEB of AS of Uzbekistan,41°10'N, 69°7'E),进行了不同播种密度、灌溉水平和灌溉方式的棉花大田试验。试验地土壤类型为灰漠土,0~1.5 m深度内土壤容重为1.38~1.47 g/cm3,且土壤没有盐碱化现象发生。供试棉花品种分别为中熟品种“布哈拉-6”和“布哈拉-8”,其生育期均为120 d左右且产量较为接近。具体田间试验设计方案为:2014年试验区面积约6 hm2,棉花于4月21日播种;试验设3个棉花播种密度,分别为9万株/hm2、18万株/hm2、24万株/hm2;播种深度为50 mm;播种前施入基肥417 kg/hm2,生育期追肥310 kg/hm2;全生育期灌溉总量300 mm,灌溉方式为地面滴灌,每区滴灌4~6次,每次6 h。2021年试验区面积约0.5 hm2,棉花于5月7日播种;试验设两个棉花播种密度和两个灌溉水平,播种密度分别为14万株/hm2和26万株/hm2,灌溉水平分别为全生育期滴灌160 mm和275 mm,灌溉方式为地面滴灌,每区分别滴灌8次和13次;此外,还设置了播种密度为9万株/hm2,全生育期沟灌900 mm的对照试验;5个试验区的棉花播种深度均为30 mm;整个生育期施肥1050 kg/hm2。记录的棉花生育期包括播种、出苗、现蕾、开花、吐絮和收获等。棉花成熟时对试验区内所有的植株进行测产,测定项目包括纤维重量、种子产量等质量指标。
2.3 气象观测与模拟数据
气象数据主要包括观测数据和CMIP6气候模式模拟数据。气象观测数据中,逐日最高气温、逐日最低气温、逐日降水量数据为乌兹别克斯坦塔什干气象站(41°15′N, 69°16′E)1961—1990年的地面气象观测资料(
表1 ISIMIP提供的5个气候模式基本信息
Tab. 1
| 模式名称 | 所属机构及国家 | 分辨率(°N×°E) |
|---|---|---|
| GFDL-ESM4 | NOAA-GFDL 美国 | 1°×1.25° |
| UKESM1-0-LL | MOHC 英国 | 1.25°×1.875° |
| MPI-ESM1-2-HR | MPI-M 德国 | 0.9375°×0.9375° |
| IPSL-CM6A-LR | IPSL 法国 | 1.26°×2.5° |
| MRI-ESM2-0 | MRI 日本 | 1.125°×1.125° |
本文利用Distance between Indices of Simulation and Observation(DISO)指数作为量化模式模拟能力的指标[37],该指数综合了相关系数(CC)、均一化均方根误差(NRMSE)和均一化绝对误差(NAE)等统计量,通过三维空间坐标系中模拟场和观测场之间的距离来评价各模型的模拟能力[38]。通过分析各模式和模式集合平均(MME)数据对塔什干站所在格点(41.25°N, 69.25°E)4—9月逐日平均温度、最高温度、最低温度、降水量和太阳辐射的模拟能力,发现相较于单一模式,MME对气象要素的模拟能力更强(图1)。其中MME与观测数据之间的相关系数分别为0.992、0.991、0.988、0.801和0.978,均通过99%置信水平的显著性检验;5个气候因子的模拟值与观测数据的NAE均小于0.2;MME与观测数据之间的NRMSE分别为0.026、0.024、0.036、0.913和0.028;MME与观测数据之间的DISO指数分别为0.027、0.036、0.048、0.955和0.180,其中逐日平均温度、最低温度、降水量的DISO指数均小于其他5个模式,最高温度和太阳辐射的DISO指数仅略高于IPSL-CM6A-LR。因此,本文使用模型集合平均数据代表本研究区域的温度、降水和辐射变化。
图1
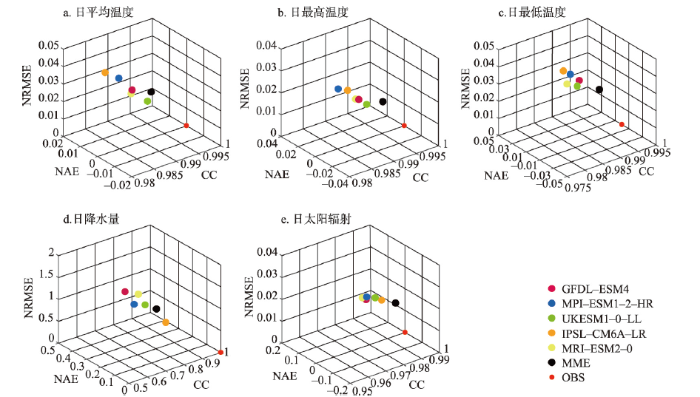
图1
1961—1990年5个气候模式模拟的塔什干地区日平均温度、日最高温度、日最低温度、日降水量和日太阳辐射变化相对于观测数据的DISO指数
注:OBS代表观测场;点到OBS的距离代表DISO指数。
Fig. 1
DISO index program for daily mean temperature, daily maximum temperature, daily minimum temperature, daily precipitation, and daily solar radiation for the historical period of 1961-1990
为了预测气象干旱条件下未来棉花产量,本文选取了SSP1-2.6、SSP3-7.0和SSP5-8.5等3个共享社会经济路径下的气候变化数据[39]。其中SSP1-2.6代表了低脆弱性、低减缓挑战组合的低强迫情景,2100年辐射强迫稳定在约2.6 W/m2;SSP3-7.0代表了高社会脆弱性与较高人为辐射强迫组合的中高强迫情景,2100年辐射强迫稳定在约7.0 W/m2;SSP5-8.5代表了21世纪高度化石燃料发展的高强迫情景,是唯一可以实现至2100年排放高至8.5 W/m2的路径,也是应对和适应气候变化最具挑战性的未来气候情景。
2.4 气象干旱指标的选取
标准化降水蒸散指数(SPEI)是近年来广泛使用的一种衡量干旱状况的干旱指数,该指标综合考虑了降水和蒸散发对局地干湿状况的作用,且具备了多时间尺度的特征,目前已被应用在中亚区域干旱的评估和预估工作中[40-41]。本文采用以3个月为步长的SPEI(SPEI-3)分析棉花生育期内的干湿变化特征,该指标通过计算降水量与潜在蒸散的差值并进行正态标准化得到,其中潜在蒸散由Hargreaves公式计算获得[42-43]。由于5—8月是影响棉花生育期的重要时段,因此主要讨论5—8月的SPEI-3变化。结合中亚高温少雨的气候特征,将干旱等级设定为轻微干旱:-1.5<SPEI-3 ≤ 0;严重干旱:-3.0<SPEI-3 ≤ -1.5;极端干旱:SPEI-3 ≤ -3.0,并统计了在对应时段内各等级的干旱发生概率(时段内某等级干旱发生的年数占总年数的百分比)。
据统计,1961—1990年塔什干地区5—8月严重干旱发生的概率为16.7%,极端干旱发生的概率为0。未来情景下,干旱发生频率将显著增大,本文主要分析未来严重干旱和极端干旱下棉花的产量变化。
2.5 APSIM-Cotton 模型
APSIM(Agricultural Production Systems sIMulator)模型由澳大利亚联邦科工组织(CSIRO)和昆士兰州政府的农业生产系统研究组(APSRU)共同开发,可以精确地模拟气候、基因型、土壤和农场管理因素对作物生产的影响[44]。模型自1996年建立以来,已经从种植系统模型演变为农业生态系统模型。APSIM以土壤模块为核心,通过与作物模块耦合来模拟作物生长发育,是相对于其他作物模型的独特优势。APSIM在不同气候带的土壤条件下,对作物结构和轮作顺序调整、作物生长发育、产量预测及不同种植方式下水资源管理等具有良好的模拟能力[45⇓⇓⇓-49],可模拟不同作物的关键生理过程[50-51],特别适用于评价气候波动和环境变化对农作物生产潜力及耕作措施经济效益的影响。目前已开发了针对不同作物的子模型,并应用于模拟小麦、油菜、玉米、马铃薯、棉花、大豆等30种不同作物的产量。其中,APSIM-Cotton模型主要由棉花模块、土壤水分模块、土壤N模块、地表留茬模块、管理模块组成。土壤水分模块中土壤风干含水率(Air dry)、萎蔫系数(LL15)、最大田间持水量(DUL)、饱和含水量(SAT)、棉花利用下限(cotton LL)等参数均通过田间实际观测获取(图2)。驱动模型中需要输入气象、作物品种、管理措施等参数。因此,本文以试验站已知的土壤和气象条件为基础,利用田间试验获得的棉花生产管理数据对棉花品种参数进行调试。
图2
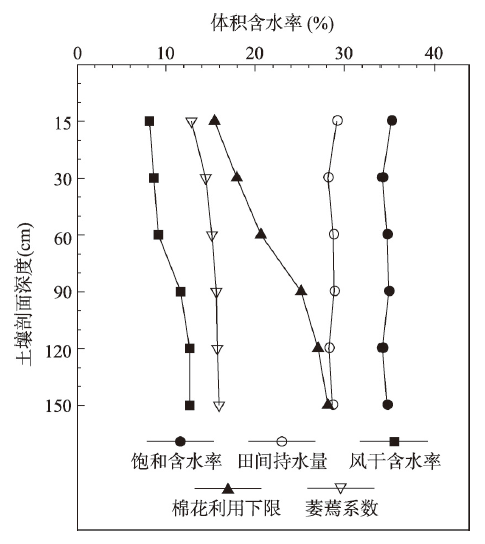
图2
赞格阿塔实验站不同深度的土壤水分参数
Fig. 2
Hydraulic properties of the soil used in simulations at Tashkent station
2.6 APSIM模型适应性评价方法及情景设计
表2 APSIM-Cotton模型调整的主要品种特征参数
Tab. 2
| 参数名称 | 定义 | 单位 | 校准值范围 | 参数值 |
|---|---|---|---|---|
| PERCENT_L | 衣分 | % | 35~45 | 42 |
| SCBOLL | 单铃籽棉重量 | g/boll | 3.8~7.0 | 6 |
| BCKGNDRETN | 棉铃保留的比例 | - | 0.2~1.0 | 0.9 |
| RESPCON | 呼吸常数 | - | 0.015~0.025 | 0.02306 |
| SQCON | 果节产生经验系数 | - | 0.01~0.03 | 0.0206 |
| FLAI | 叶面积指数修正值 | - | 0.5~1.0 | 0.87 |
| DDISQ | 播种到现蕾的有效积温(日温≥12 ℃) | d∙℃ | 300~450 | 450 |
| FRUDD1~8 | 蕾铃生长不同阶段所对应的有效积温(日温≥12 ℃) | d∙℃ | 与生育时段相关 | 60、210、380、405、510、620、795、930 |
在利用APSIM-Cotton模型模拟未来产量变化时,仍选用布哈拉-6品种,播种日期为4月21日,播种密度为9万株/hm2,播种深度为50 mm;灌水总量为600 mm,其中播种前灌水120 mm;蕾期灌水100 mm;花铃期灌水240 mm;吐絮期灌水140 mm;播种前施160 kg/hm2尿素,生育期内充分施氮且不考虑病虫害。CO2浓度设定源于国际应用系统分析研究所(IIASA)提供的CO2浓度变化数据(
表3 未来气候情景下2021—2090年大气CO2浓度设定(µmol/mol)
Tab. 3
| 时段 | SSP1-2.6 | SSP3-7.0 | SSP5-8.5 |
|---|---|---|---|
| 2021—2030年 | 430 | 437 | 437 |
| 2031—2040年 | 452 | 477 | 480 |
| 2041—2050年 | 466 | 522 | 537 |
| 2061—2070年 | 474 | 628 | 703 |
| 2071—2080年 | 471 | 690 | 815 |
| 2081—2090年 | 462 | 759 | 945 |
3 结果与分析
3.1 模型适应性分析结果
利用2021年的气象数据和田间试验数据对APSIM-Cotton模型模拟结果进行有效性验证(表4),结果表明,不同播种密度试验下棉花实测产量和模拟产量的相对误差在调参年份和验证年份均小于10.4%,生育期长度实测值和模拟值的相对误差均小于4.7%。说明APSIM-Cotton模型能够准确地模拟不同播种密度下的棉花生育期和产量变化,在塔什干具有较好的适用性。
表4 塔什干棉花产量与生育期天数的验证结果
Tab. 4
| 调参验证 | 播种密度 (万株/hm2) | 灌溉方式 | 灌溉量(mm) | 产量(kg/hm2) | 生育期天数(d) | ||||
|---|---|---|---|---|---|---|---|---|---|
| 实测值 | 模拟值 | 相对误差(%) | 实测值 | 模拟值 | 相对误差(%) | ||||
| 调参 | 9 | 滴灌 | 300 | 1750.0 | 1723.3 | -1.5 | 110 | 111 | 0.9 |
| 18 | 滴灌 | 300 | 2360.0 | 2114.9 | -10.4 | 109 | 110 | 0.9 | |
| 24 | 滴灌 | 300 | 2920.0 | 2799.0 | -4.1 | 110 | 113 | 2.7 | |
| 验证 | 14 | 沟灌 | 900 | 1386.2 | 1329.9 | -4.1 | 134 | 132 | -1.5 |
| 14 | 滴灌 | 275 | 1810.6 | 1950.5 | +7.7 | 127 | 124 | -2.4 | |
| 14 | 滴灌 | 160 | 1102.0 | 1063.6 | -3.5 | 124 | 125 | +0.8 | |
| 26 | 滴灌 | 275 | 2914.4 | 2739.4 | -6.0 | 127 | 121 | -4.7 | |
| 26 | 滴灌 | 160 | 1772.4 | 1882.7 | +6.2 | 124 | 121 | -2.4 | |
3.2 不同情景下中亚地区气候变化特征
2021—2090年棉花生育期期间(4月15日—9月15日),SSP1-2.6、SSP3-7.0和SSP5-8.5等3种情景下,塔什干的最高温度、最低温度和平均气温均呈明显上升趋势(通过α = 0.01显著性水平),SSP1-2.6情景平均气温的温升速率为0.1 ℃/10a,SSP5-8.5情景的平均气温的温升速率则达0.8 ℃/10a;降水仅在SSP5-8.5情景下呈显著下降趋势,降水距平百分率下降3.8%/10a(通过α = 0.05显著性检验),其他两种情景均无明显变化(图3)。具体来说,SSP1-2.6、SSP3-7.0和SSP5-8.5等3种排放情景下,与1961—1990年相比,2035年(2021—2050年)平均最低温度升温1.7 ℃(波动范围:1.4~2.1 ℃)、2.0 ℃(1.7~2.5 ℃)和2.1 ℃(1.8~2.7 ℃);2075年(2061—2090年)升温分别为2.1 ℃(1.8~2.7 ℃)、4.3 ℃(3.5~5.3 ℃)和5.3 ℃(4.3~6.5 ℃);且逐月升温幅度为5月最小、8月最大(图3b)。不同SSP排放情景下2035年塔什干的平均最高温度较1961—1990年分别升高1.5 ℃(1.2~1.9 ℃)、1.7 ℃(1.1~2.1 ℃)和1.9 ℃(1.3~2.4 ℃);2075年则分别升高2.0 ℃(1.5~2.4 ℃)、4.1 ℃(3.5~4.8 ℃)和5.2 ℃(4.6~5.9 ℃);且逐月升温幅度为6月最小、8月最大,最高温度的升温幅度略低于最低温度的升温量(图3c、3d)。不同SSP排放情景下2035年塔什干的平均温度较1961—1990年分别升高2.2 ℃(1.8~2.6 ℃)、2.3 ℃(1.8~2.8 ℃)和2.5 ℃(1.9~3.1 ℃);2075年则分别升高2.6 ℃(2.1~3.1 ℃)、4.7 ℃(4.1~5.6 ℃)和5.7 ℃(5.0~6.7 ℃)(图3e、3f)。棉花生育期内降水稀少,据统计1961—1990年棉花生育期平均降水量80.2 mm,其中4月15日—4月30日平均降水量为34.2 mm,5月平均降水量为31.8 mm,而6—8月的平均降水量分别为7.3、3.5和1.9 mm。SSP1-2.6、SSP3-7.0和SSP5-8.5排放情景下2035年降水量距平的平均值为22.8%(-16.9%~65.2%)、23.6%(-33.6%~108.7%)和25.7%(-26.5%~96.8%);2075年分别为19.5%(-15.3%~96.8%)、11.0%(1.1%~36.9%)和9.0%(-34.6%~36.8%)(图3g、3h)。
图3
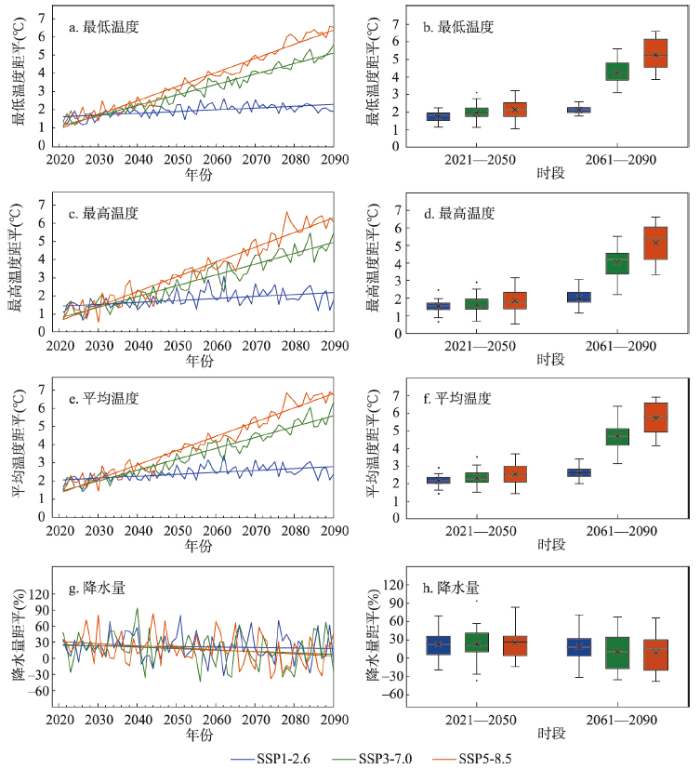
图3
1961—1990年和2021—2090年共享社会经济路径下棉花生育期最低、最高、平均温度和降水量变化
注:图中粗实线为线性趋势;盒须图为2021—2050年和2061—2090年两个时段各变量的第1/4分位数、3/4分位数、最高值、最低值、中位数(—)、平均值(×)及异常值;每个盒须图包含样本量30个。
Fig. 3
Minimum temperature, maximum temperature, mean temperature and precipitation during the cotton growing season in the historical period of 1961-1990 and shared socioeconomic pathways of 2021-2090
从SPEI-3的变化看,2021—2090年3种SSP 情景下棉花生育期内气候呈明显的干旱化趋势(图4)。其中SSP1-2.6情景下SPEI-3以0.08/10a的速率减小(通过α = 0.01显著性检验);SSP3-7.0和SSP5-8.5情景下SPEI-3下降趋势较明显,减小速率分别为0.43/10a和0.48/10a,表明干旱事件发生频率也将明显增加。在SSP1-2.6情景下,2035和2075年两个时段严重干旱事件多发,其出现概率较1961—1990年的16.7%分别升高至20.0%和46.7%;但无极端干旱事件发生。在SSP3-7.0和SSP5-8.5情景下,2035年虽未出现极端干旱事件,但严重干旱的发生概率由1961—1990年的16.7%分别升高至36.7%和40.0%;而在2075年严重干旱和极端干旱的发生概率明显增加,其中发生严重干旱的概率均升高至100%(即每年都有SPEI-3≤-1.5的值出现),发生极端干旱的概率则由从未发生过分别升高至66.7%和86.7%。
图4
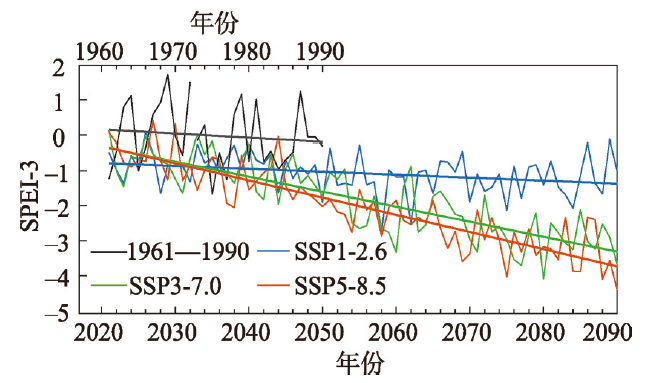
图4
1961—1990年和2021—2090年共享社会经济路径下SPEI-3的变化
注:粗实线为线性趋势。
Fig. 4
Changes in SPEI-3 in the historical period of 1961-1990 and shared socioeconomic pathways of 2021-2090
3.3 CO2对棉花产量的肥效作用
CO2浓度影响棉花的净光合速率和辐射利用效率,其与产量变化并非简单的线性关系。为了辨识CO2浓度变化对产量的贡献,设定450 µmol/mol、550 µmol/mol、650 µmol/mol、750 µmol/mol、850 µmol/mol和950 µmol/mol等6个浓度,分别模拟不同SSP情景下、不同研究时段棉花产量相对于CO2浓度停留在350 µmol/mol时的变化量,其中SSP3-7.0情景中包括了450 µmol/mol、550 µmol/mol、650 µmol/mol和750 µmol/mol等4个浓度,SSP5-8.5情景包含了全部6个浓度,SSP1-2.6情景中CO2浓度与350 µmol/mol接近,未做分析。结果表明,随着CO2浓度的增加,棉花产量不断升高;当CO2浓度持续升高至750 µmol/mol以上时,棉花产量增幅稳定,即不再随CO2浓度升高而变幅增加(图5)。在SSP3-7.0情景下,2035年和2075年棉花产量平均增幅分别为12.9%(450 µmol/mol)~31.1%(750 µmol/mol)和12.0%(450 µmol/mol)~27.2%(750 µmol/mol);在SSP5-8.5情景下,2035年和2075年棉花产量增幅分别为12.2%(450 µmol/mol)~30.1%(750 µmol/mol)和9.6%(450 µmol/mol)~20.3%(750 µmol/mol)。不同排放情景下,2035年的产量增幅均高于2075年,且不同情景间的产量增幅变化亦存在明显规律,即同一CO2浓度水平下,产量增幅随着辐射强迫的增大而减小。该结果表明不同情景下CO2的肥效作用有所差异,且在未来升温较高的情景下,棉花生育期内的高温有削弱CO2肥效作用的潜在风险。因此,在分析气候变化对棉花产量的影响时除了气候要素本身的贡献,还应充分考虑CO2的肥效作用。
图5
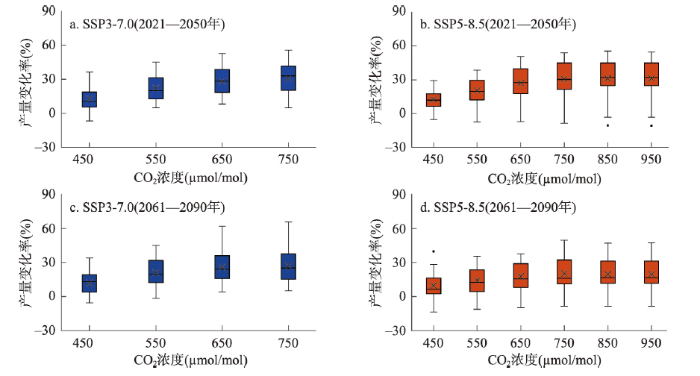
图5
未来气候情景不同CO2浓度水平下的棉花产量变化
注:盒须图(样本量30个)包含了产量变化率的第1/4分位数、第3/4分位数、最高值、最低值、中位数(–)、平均值(×)及异常值。
Fig. 5
Changes in cotton yield at different CO2 concentration levels under the future climate scenarios
本文还模拟了CO2浓度稳定在350 µmol/mol和不同情景下不同CO2浓度(表3)的产量变化,发现在2035年和2075年两个时段,气候变化将导致棉花产量下降(图6),即虽然CO2浓度升高对产量有积极影响,但仍无法抵消气候变化对产量的负面影响。若不考虑CO2的肥效作用(即所有时期CO2浓度均为350 µmol/mol)时,1961—1990年的棉花年产量为2419.9 kg/hm2,不同SSP排放情景(SSP1-2.6、SSP3-7.0和SSP5-8.5)下的产量在2035年分别下降31.4%、34.2%和36.4%,在2075年分别下降35.8%、52.2%和61.4%(图6a)。若考虑CO2的肥效作用,历史时期年均皮棉产量为2352.5 kg/hm2,棉花产量在2035年分别下降18.4%、22.2%和24.5%,较不考虑CO2肥效作用时分别增产15.6%、14.9%和15.3%;在2075年分别下降23.4%、38.6%和51.7%,较不考虑CO2肥效作用时分别增产16.0%、25.0%和21.7%(图6b)。
图6
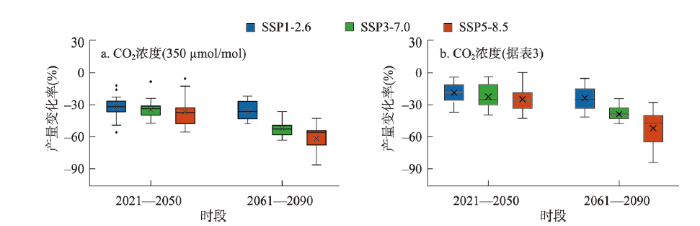
图6
未来气候情景棉花产量相比于历史时期的变化
注:盒须图(样本量30个)包含了产量变化率的第1/4分位数、第3/4分位数、最高值、最低值、中位数(–)、平均值(×)及异常值。
Fig. 6
Changes in cotton yield in future periods compared with the historical period of 1961-1990
3.4 气象干旱对棉花产量的影响
气候模拟数据显示,2035年不同SSP排放情景下发生严重干旱的概率分别为20.0%、36.7%和40.0%。严重干旱年棉花产量较历史时期分别下降28.0%、29.6%和32.1%。在SSP1-2.6情景下,2075年发生严重干旱的概率为46.7%,棉花产量下降31.5%。在SSP3-7.0和SSP5-8.5情景下,2075年发生严重干旱的概率均升高至100%,棉花产量分别下降33.1%和35.7%(图7a)。2075年发生极端干旱的概率分别为66.7%和86.7%,棉花产量分别下降41.3%和54.2%(图7b)。3.3节中已证明CO2具有明显的肥效作用,因此我们对比了棉花产量较CO2浓度稳定在350 µmol/mol之间的差异。以极端干旱年为例,当CO2浓度稳定在350 µmol/mol时,SSP3-7.0情景下的棉花产量较历史时期下降54.2%,较不固定CO2浓度模拟的棉花产量低19.9%;SSP5-8.5情景下的棉花产量较历史时期下降62.5%,较不固定CO2浓度模拟的棉花产量低16.0%(图7b)。
图7
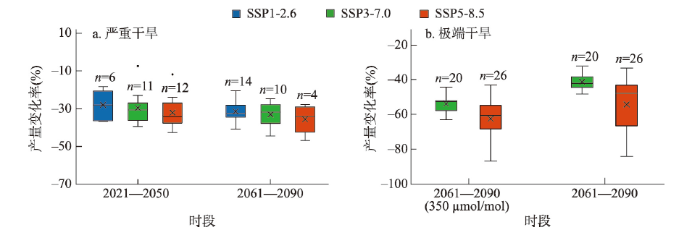
图7
未来干旱条件下棉花产量相比于历史时期的变化
注:盒须图包含了产量变化率的第1/4分位数、第3/4分位数、最高值、最低值、中位数(–)、平均值(×)及异常值。
Fig. 7
Changes in cotton yield under future droughts compared with the historical period of 1961-1990
4 讨论
农业生产一直与气候变化紧密结合,气候变化在很大程度上决定着作物生长发育进程与产量形成。相关研究表明,在550 µmol/mol的CO2水平下,C3作物的产量将增加10%~20%[53],故本文在分析气象干旱对棉花产量影响的同时,充分考虑了CO2的肥效作用。发现CO2浓度升高对棉花产量有积极影响,且当浓度达到750 µmol/mol时,对棉花的增产贡献达到最大,然而CO2仍无法抵消气候变化对产量的负面影响。由于干旱事件的频繁发生,导致未来产量严重下降,这与前人的结论一致[25]。也有研究发现在CO2的肥效作用下,澳大利亚东部棉花产量在2021—2040年将增加5.9%[54],2041—2070年美国德克萨斯高原的棉花产量将升高14%~29%[24]。这可能与上述研究区在历史时期(1961—1990年)气候条件更加湿润且升温幅度较小有关。而Adhikari在CO2浓度升高对棉花水分利用率影响的研究中提出,缺水会限制CO2浓度升高时的棉花产量[55]。因此,在中亚研究区域内,棉花生育期内降水量稀少、温度高、且升温速率高于全球平均[56],这些因素可能共同导致未来棉花产量明显下降。需要说明的是,相关研究发现温度超过38 ℃时棉花将不再积累热量,且严重影响棉花的产量形成[54]。
CO2浓度、生育期内日最高温度、日最低温度、日平均温度、降水、辐射等气候因素在作物的生长发育中起着关键作用[57],但可能对产量形成具有不同贡献。因此本文基于历史(1961—1990年)时期和共享社会经济路径下(2021—2090年)模拟的棉花产量,采用逐步回归方法分析了关键气候要素对产量的贡献(表5)。结果发现,各时段或各情景下的棉花产量虽与温度均呈显著负相关(通过α = 0.01显著性检验),但其关系并不稳定。其中历史时期与SSP1-2.6和SSP5-8.5情景下的产量均与平均温度呈负相关,SSP1-2.6情景下的产量还与CO2呈负相关(通过α = 0.05显著性检验);SSP3-7.0情景下的产量则与最高温度呈负相关。产量对降水和CO2浓度不敏感,其原因可能是由于中亚棉花生育期内降水过于稀少,导致降水对于灌溉棉田的产量贡献较低;而CO2肥效作用仅通过统计分析无法检测到其对产量形成的贡献,可能因为情景数据中温度与CO2浓度的变化具有明显的共线性关系。未来我们将增加极端高温、极端降水、极端低温等气候事件对棉花产量影响的研究,以此丰富未来中亚在棉花种植方面可采取的气候变化减缓与适应措施的相关科学数据。
表5 气候变量与棉花产量的逐步回归分析
Tab. 5
| 时段 | 1961—1990年 | 2021—2090年 | ||
|---|---|---|---|---|
| SSP1-2.6 | SSP3-7.0 | SSP5-8.5 | ||
| 回归预测方程 | Y=10820.5-351.3tas | Y=16598.5-419.7tas-8.5CO2 | Y=7392.1-166.1tasmax | Y=7972.7-231.3tas |
| 方差解释量(%) | 40.61 | 41.89 | 64.41 | 76.75 |
| 显著性 | P<0.001 | P<0.001 | P<0.001 | P<0.001 |
注:tas、tasmax分别表示棉花生育期内平均温度和最高温度,CO2表示相应年份的CO2浓度。
由于数据的不确定性和农业生产本身的复杂性,本文还存在一些局限性。模型是作物生长发育过程的简化,与自然条件下的作物生长情况不可能完全一致。例如在全球变暖背景下,棉花生产可能更易受到病虫害的间接生物影响[58],而本文没有考虑养分胁迫、病虫害、草害等限制条件,这可能导致模型高估CO2的肥效作用,致使模型模拟结果会出现偏差。其次在不同研究时段设置的棉花播种期均一致,且只对单一品种棉花进行了模拟,未能全面揭示未来中亚棉花生产的发展变化规律。而相关研究已经证明了推迟播种期、提高灌溉水平以及培育中、晚熟品种有利于提高气候变暖下的棉花产量[14,26,59]。此外,作物模型的选用也可能造成未来棉花产量的差异。DSSAT对中国[60]、美国[24]、巴基斯坦[61]等境内的干旱、半干旱地区的棉花产量的模拟能力已得到验证,相对误差一般可控制在15%以内。因此在未来的工作中,将通过调整适用于中亚的棉花生产管理策略,应用多种作物模型模拟气候变化对棉花生产的影响,并对比不同作物模型在中亚的适用性及优缺点,为合理制定农业生产适应气候变化的战略政策提供理论基础。
5 结论
本文基于气象观测资料和棉花大田试验数据,评价了APSIM-Cotton模型在乌兹别克斯坦塔什干地区的适应性,并利用气候模式模拟的SSP1-2.6、SSP3-7.0和SSP5-8.5等3种共享社会经济路径下的气候变化数据集,预估了未来2021—2050年和2061—2090年两个时段气象干旱发生特征,探讨了气象干旱对中亚棉花产量的影响。主要结论如下:
APSIM-Cotton模型具有较高的田间棉花生育模拟能力,能够准确地模拟乌兹别克斯坦塔什干地区棉花不同播种密度(9万~26万株/hm2)下的生育期天数和产量变化。相比于历史时期(1961—1990年),2021—2090年3种SSP情景下棉花生育期内气候呈暖干化特征,其中SSP1-2.6情景下SPEI-3变化较为平缓,2035和2075年两个时段发生严重干旱的概率分别为20.0%和46.7%且均无极端干旱事件发生;SSP3-7.0和SSP5-8.5情景下SPEI-3下降趋势较为明显,未来干旱发生的概率明显增加;2035年严重干旱的发生概率分别为36.7%和40.0%,2075年极端干旱的发生概率分别为66.7%和86.7%。
棉花产量在不同情景下均呈下降趋势,CO2的肥效作用可使产量提高14.9%~25.0%。2021—2050年严重干旱年棉花产量较历史时期分别下降28.0%、29.6%和32.1%;2061—2090年3种情景下,严重干旱年棉花产量下降31.5%、33.1%和35.7%。极端干旱年各情景的产量降幅差异较大,在SSP3-7.0和SSP5-8.5情景下,产量分别下降41.3%和54.2%。当CO2浓度稳定在350 µmol/mol时,SSP3-7.0情景下的极端干旱年产量较考虑CO2肥效作用模拟的棉花产量降低19.9%;SSP5-8.5情景则降低16.0%。此外,研究还发现尽管CO2浓度升高对棉花产量形成有积极作用,但当浓度达到750 µmol/mol以上时,其对提高棉花产量变幅的贡献将不再持续增加。
参考文献
Multivariate assessment and attribution of droughts in Central Asia
Impact of climate change on water resources in the Tianshan Mountains, Central Asia
DOI:10.11821/dlxb201701002
[本文引用: 1]

Changes in hydrological processes and water resources under climate change in the Tianshan Mountains of Central Asia have been investigated based on data analysis and paper review. Under the context of global warming hiatus, temperature of the Tianshan Mountains in Central Asia has been in a state of high variability, which has accelerated the melting of glacier and snow. Warming has resulted in a series of changes in water resources. Snowfall fraction decreased from 11%-24% in 1960-1998 to 9%-21% in 2000-2014, 97.25% of the glaciers retreated in the last 50 years; and water storage decreased at a rate of -3.72 mm/a during 2003-2014. Warming has led to changes in mountainous hydrological processes and water resources. The runoff in the Tianshan Mountains has increased due to the accelerated glacier/snow melt, however, the runoff will decrease in the long term under continuous warming and current precipitation conditions.
气候变化对中亚天山山区水资源影响研究
DOI:10.11821/dlxb201701002
[本文引用: 1]
本文结合资料分析和文献阅读,对全球气候变化背景下的中亚天山山区水文、水资源变化进行了讨论分析。在全球升温滞缓背景下,中亚天山山区在过去的10余年,气温却一直处于高位态波动状态;气候变暖及持续高位态波动加剧了山区冰川和积雪等固态水体的消融,导致山区降雪率降低,天山山区降雪率从1960-1998年的11%~24%降低到2000年以来的9%~21%,有97.52%的冰川表现为退缩状态,水储量呈明显减少趋势,减小幅度约为-3.72 mm/a;气候变暖直接影响区域水循环和水系统的稳定性,引起径流补给方式和水资源数量的改变,加大了水资源时空分布的不确定性。天山山区在短时期内因冰雪融水增多,会出现径流量增加现象。但在未来气候持续变暖、降水条件维持不变的条件下,河川径流量将会出现减少趋势。
The potentials of cotton cooperation between China and the five Central Asian countries
中国与中亚五国棉花合作潜力分析及模式探究
Approaches to optimize Uzbekistan's investment in irrigation technologies
Water-induced variation in yield and quality can be explained by altered yield component contributions in field-grown cotton
DOI:10.1016/j.fcr.2018.05.013 URL [本文引用: 1]
Responses of upland cotton (Gossypium hirsutum L.) lines to irrigated and rainfed conditions of texas high plains
Effect of growth regulators on photosynthesis, transpiration and related parameters in water stressed cotton
DOI:10.1023/A:1012408624665 URL [本文引用: 1]
Spatial difference of drought effect on photosynthesis of leaf subtending to cotton boll and its relationship with boll biomass
DOI:10.1111/jac.12320 URL [本文引用: 1]
Growth and photosynthesis of Upland and Pima cotton: Response to drought and heat stress
DOI:10.17221/512/2015-PSE URL [本文引用: 1]
Quantifying individual and interactive effects of elevated temperature and drought stress on cotton yield and fibre quality
DOI:10.1111/jac.12462 URL [本文引用: 1]
Drought effects on cotton yield and fiber quality on different fruiting branches
DOI:10.2135/cropsci2015.08.0477 URL [本文引用: 1]
The compensation effects of physiology and yield in cotton after drought stress
Water deficit alters cotton canopy structure and increases photosynthesis in the mid-canopy layer
DOI:10.2134/agronj14.0426 URL [本文引用: 1]
Different drip irrigation regimes affect cotton yield, water use efficiency and fiber quality in western Turkey
DOI:10.1016/j.agwat.2008.07.003 URL [本文引用: 2]
Effect of drought stress on agronomic traits, quality, and WUE in different colored upland cotton varieties (Lines)
DOI:10.3724/SP.J.1006.2013.02074
[本文引用: 1]
To explore the effect of drought stress on main colored cotton traits and the water use efficiency (WUE) mechanism, we performed the experiments with split-plot design, irrigation amounts (normal irrigation, stress irrigation, and no irrigation) were taken as the main-plots, and seven colored cotton cultivars were used as the sub-plots. The results showed that the boll number per plant, weight per boll, plant height, leaf number, number of fruiting branch, harvest index, number of fruit nodes, seed index, stem diameter, internode length of fruit branches and main stem reduced, but the lint percentage increased under drought stress. When the irrigation amount reduced by half, all cultivars yield decreased, there was significant difference between normal irrigation and no irrigation (P<0.05). There also existed significant difference in seed cotton yield among cultivars (P<0.05), the yield reduction of brown cotton cultivar was higher than that of green cotton cultivar. Under normal irrigation, the WUE of white cotton was higher than that of green cotton and brown cotton; there was no significant difference in WUE between brown cotton and green cotton. Under drought stress, the WUE of brown cotton was higher than that of green cotton. So WUE is related to leaf number, the boll number per plant, number of fruiting branches, number of fruit nodes, plant height, harvest index, weight per boll, length between fruit branches and main stem, seed index, the stem diameter, and lint percentage.
干旱胁迫对彩色棉花农艺、品质性状和水分利用效率的影响
DOI:10.3724/SP.J.1006.2013.02074
[本文引用: 1]
为了探索干旱胁迫对彩色棉花主要性状的影响及其水分利用机理,选用7个不同色彩的棉花品种(系),在常规灌溉、胁迫灌溉和生育期不灌溉3种环境条件下,调查其农艺性状、品质性状、水分利用效率(WUE)及产量。结果表明,干旱胁迫下不同色彩棉花品种的单株成铃数、单铃重、株高、花铃期叶片数、有效果枝数、收获指数、果节数、籽指、茎粗和果茎节间长度减少,衣分增加;灌水量减少一半,参试棉花品种的产量均降低,不灌溉处理的籽棉产量与常规灌溉间差异显著(P<0.05);籽棉产量的降低幅度品种间存在较大差异(P<0.05),棕色棉的减产幅度高于绿色棉。常规灌溉处理下,白色棉花水分利用效率高于棕色棉花和绿色棉花,而后二者差异不显著;干旱胁迫下,棕色棉花的水分利用效率高于绿色棉花。与水分利用效率相关的主要农艺性状、品质指标是:叶片数、单株成铃数、有效果枝数、果节数、株高、收获指数、单铃重、主茎节间长度、茎粗、籽指、衣分。
Effects of water stress and rewatering on photosynthesis, root activity, and yield of cotton with drip irrigation under mulch
DOI:10.1007/s11099-015-0165-7 URL [本文引用: 1]
Timing of episodic drought can be critical in cotton
DOI:10.2134/agronj2013.0325 URL [本文引用: 1]
The effects of flood, drought, and flood followed by drought on yield in cotton
Effectiveness of agronomic practices in dealing with climate change impacts in the Australian cotton industry: A simulation study
Impact of climate change and crop management on cotton phenology based on statistical analysis in the main-cotton-planting areas of China
Impact of climate change on cotton production and water consumption in Shiyang River Basin
气候变化对石羊河流域棉花生产和耗水的影响
Evaluation of climate change impacts on cotton yield using Cropsyst and Regression Models
DOI:10.24297/jaa.v8i1.7779 URL [本文引用: 1]
Modeling the potential impact of climate change on cotton (Gossypium hirsutum) production in northeastern semi-arid afar and western Tigray Regions of Ethiopia
Simulating future climate change impacts on seed cotton yield in the Texas High Plains using the CSM-CROPGRO-Cotton model
DOI:10.1016/j.agwat.2015.10.011 URL [本文引用: 3]
Simulating the impacts of climate change on cotton production in India
DOI:10.1007/s10584-012-0673-4 URL [本文引用: 2]
Prediction of cotton yield and water demand under climate change and future adaptation measures
DOI:10.1016/j.agwat.2014.06.001 URL [本文引用: 2]
Interactive effects of elevated CO2, temperature and extreme weather events on soil nitrogen and cotton productivity indicate increased variability of cotton production under future climate regimes
DOI:10.1016/j.agee.2017.06.004 URL [本文引用: 1]
Evaluation of the OILCROP-SUN model for sunflower hybrids under different agro-meteorological conditions of Punjab-Pakistan
DOI:10.1016/j.fcr.2016.01.011 URL [本文引用: 1]
Temperature extremes: Effect on plant growth and development
DOI:10.1016/j.wace.2015.08.001 URL [本文引用: 1]
Heat units-based potential yield assessment for cotton production in Uzbekistan
DOI:10.25165/j.ijabe.20211406.4803 URL [本文引用: 2]
Improving nutrition and water use efficiencies of pima cotton (Gossypium barbadense L.) varieties under arid conditions of Uzbekistan
DOI:10.1080/01904167.2020.1793186 URL [本文引用: 1]
Cotton irrigation scheduling improvements using wetting front detectors in Uzbekistan
Effect of water deficiency on relationships between metabolism, physiology, biomass, and yield of upland cotton (Gossypium hirsutum L.)
DOI:10.1007/s40333-018-0009-y URL [本文引用: 1]
Mulching and water quality effects on soil salinity and sodicity dynamics and cotton productivity in Central Asia
DOI:10.1016/j.agee.2010.04.005 URL [本文引用: 1]
The NCEP/NCAR 40- year reanalysis project
DOI:10.1175/1520-0477(1996)077<0437:TNYRP>2.0.CO;2 URL [本文引用: 1]
Trend-preserving bias adjustment and statistical downscaling with ISIMIP3BASD (v1.0)
DOI:10.5194/gmd-12-3055-2019 URL [本文引用: 1]
DISO: A rethink of taylor diagram
DOI:10.1002/joc.5972 URL [本文引用: 1]
Decompositions of taylor diagram and DISO performance criteria
DOI:10.1002/joc.7149 URL [本文引用: 1]
The SSP greenhouse gas concentrations and their extensions to 2500
DOI:10.5194/gmd-13-3571-2020 URL [本文引用: 1]
Spatial and temporal distribution characteristics of drought in Central Asia based on SPEI index
基于SPEI指数的中亚地区干旱时空分布特征
"Dry gets drier, wet gets wetter": A case study over the arid regions of Central Asia
DOI:10.1002/joc.5863 URL [本文引用: 1]
Reference crop evapotranspiration from temperature
DOI:10.13031/2013.26773 URL [本文引用: 1]
Standardized precipitation evapotranspiration index (SPEI) revisited: Parameter fitting, evapotranspiration models, tools, datasets and drought monitoring
DOI:10.1002/joc.3887 URL [本文引用: 1]
An overview of APSIM, a model designed for farming systems simulation
DOI:10.1016/S1161-0301(02)00108-9 URL [本文引用: 1]
Predicting crop yields and soil-plant nitrogen dynamics in the US Corn Belt
Impact of different cropping systems and irrigation schedules on evapotranspiration, grain yield and groundwater level in the North China Plain
DOI:10.1016/j.agwat.2018.09.046 URL [本文引用: 1]
Future climate change impacts on grain yield and groundwater use under different cropping systems in the North China Plain
Analysis on limiting factors of efficient utilization of winter wheat and summer maize farmland resources
冬小麦—夏玉米周年农田资源高效利用限制因素分析
Simulation of spring wheat yield response to temperature changes of different growth stages in drylands
旱地春小麦产量对不同生育阶段温度变化的响应模拟
Simulating the response of drought-tolerant maize varieties to nitrogen application in contrasting environments in the Nigeria Savannas using the APSIM model
Maize yield and profitability tradeoffs with social, human and environmental performance: Is sustainable intensification feasible?
DOI:10.1016/j.agsy.2018.01.012 URL [本文引用: 1]
OZCOT: A simulation model for cotton crop management
DOI:10.1016/0308-521X(94)90223-3 URL [本文引用: 1]
What have we learned from 15 years of free-air CO2 enrichment (FACE)? A meta-analytic review of the responses of photosynthesis, canopy properties and plant production to rising CO2
DOI:10.1111/j.1469-8137.2004.01224.x URL [本文引用: 1]
Quantifying the response of cotton production in eastern Australia to climate change
DOI:10.1007/s10584-014-1305-y URL [本文引用: 2]
Climate change and eastern Africa: A review of impact on major crops
DOI:10.1002/fes3.61 URL [本文引用: 1]
Spatiotemporal characteristics of future changes in precipitation and temperature in Central Asia
DOI:10.1002/joc.5901 URL [本文引用: 1]
Probabilistic assessment and uncertainties analysis of climate change impacts on wheat biomass
DOI:10.11821/xb201203005
[本文引用: 1]
Impacts of climate change on agriculture and adaptation are of key concern of scentific research. However, vast uncertainties exist among the global climate models (GCMs)output, emission scenarios, scale transformations, crop model parameteration-simulated outputs. In this study, a probabilistic approach is used to reduce the uncertainties, from 20 climate scenarios output (including four emissions scenarios of A1FI, A2, B1 and B2, and five GCMS of HadCM3, PCM, CGCM2, CSIRO2 and ECHAM4) from the Intergovernmental Panel on Climate Change Data Distribution Centre. We adapt the median values of projected changes in daily mean climate variables for representative stations and drive the CERES (Crop Environment Resource Synthesis)-Wheat model to simulate wheat biomass under baseline condition and global warming scenarios of global mean temperature (GMT) increase of 1 ℃ (GMT+1D), 2 ℃ (GMT+2D) and 3 ℃ (GMT+3D), with and without consideration of CO<sub>2</sub> fertilization effects, respectively. Our study results show that elevated CO<sub>2</sub> concentration generally compensate for the negative effects of warming temperatures on wheat biomass and the positive effects of elevated CO<sub>2</sub> concentration on wheat biomass increase with warming temperatures. There is a high probability of increasing wheat biomass under higher temperature scenarios in consideration for CO<sub>2</sub> fertilization effect and rain-fed wheat biomass increase are higher than rain-fed wheat biomass under the same temperature rising scenarios. Due to increase in temperature, projected wheat biomass for GMT + 1D, GMT+2D and GMT+3D would reduce without consideration of CO<sub>2</sub> fertilization effects and irrigated wheat biomass would reduce more than rain-fed wheat biomass under the same temperature rising scenarios.
气候变化对小麦生物量影响的概率预测和不确定性分析
DOI:10.11821/xb201203005
[本文引用: 1]
气候变化对农业生产的影响和适应一直是学界关注的重点。但是,由于气候模式输出、排放情景、尺度转换、模型参数化等研究过程中存在的不确定性,往往导致研究结果也存在较大的不确定性。为减少研究结果的不确定性,本研究综合了IPCC 四个排放情景(A1FI、A2、B1、B2) 以及5 个全球气候模式(HadCM3, PCM, CGCM2, CSIRO2, ECHAM4) 的输出结果,基于英国CRU 气候中心的20 个未来情景数据库,生成全球平均温度升高1℃(GMT+1D)、2℃ (GMT+2D)、3℃ (GMT+3D) 下研究站点的气候日值中值情景数据,利用过程模型CERES-Wheat 和概率预测方法研究CO<sub>2</sub>肥效作用和GMT+1D、GMT+2D、GMT+3D对我国小麦主产区小麦生物量的影响。研究结果表明:CO<sub>2</sub>肥效作用可以补偿由于温度升高而造成的小麦生物量减产且补偿作用随着温度的升高而增加。当有CO<sub>2</sub>肥效作用时,灌溉小麦和雨养小麦生物量均增加,且随着温度的升高生物量的增长程度增大,相同情景下,雨养小麦生物量的增高概率大于灌溉小麦。当不考虑CO<sub>2</sub>肥效作用时,灌溉小麦和雨养小麦生物量均降低,且灌溉小麦生物量减产的概率大于雨养小麦减产概率。
An integrated analysis of impact factors in determining China's future grain production
DOI:10.11821/xb201004002
[本文引用: 1]
An integrated simulation framework was introduced to assess China\'s future cereal production.The integrated framework includes simulations of climate change,water availability,crop yield and socio-economic characteristics,and their interactions on future cereal productions.The simulations are based on a reasonable socio-economic scenario which is consistent with China\'s mid-and long-term national development plan.Results demonstrate (1) Climate change will affect cereal yield.Excluding CO2 fertilization effects,yield drops for all cereal crops,with remarkable increases in both instability of production and possibility of lower yield.Irrigation partially offsets the damages caused by climate change.The biggest yield decrease occurs for rice with A2.Including the CO2 fertilization effects,yield increases for most crops,particularly for rainfed wheat,and rice,a small promotion occurs for maize.(2) Cereal\'s water demand will change in future,along with anticipated irrigation water supply.Interactions of climate change,water availability and socio-economic development result in an unmatched change between water demand and supply.These consequently induce obvious decreases in sown area of irrigated crops or increases in rainfed crops.(3) Interactions of climate change,CO2 effects,water availability and land use change on crop production are complicated,which highly depend on the scenarios and expected periods.The biggest harmful attribution comes from water availability,least from land use change,while the combination of climate change and CO2 may increase crop production.Regarding specific crop,production decreases for rice,but increases for wheat and maize.
中国粮食生产的综合影响因素分析
Late planting has great potential to mitigate the effects of future climate change on Australian rain-fed cotton
Sensitivity analysis of CROPGRO-cotton model to intra-seasonal climatic variability in middle Gujarat
Optimizing the phosphorus use in cotton by using CSM-CROPGRO-cotton model for semi-arid climate of Vehari-Punjab, Pakistan
DOI:10.1007/s11356-016-8311-8 URL [本文引用: 1]
