

1 引言
土壤湿度(Soil Moisture, SM)是衡量陆地土壤干湿状况的重要指标,通常用体积含水量表示,即单位土体中水的体积[1]。土壤湿度通过影响水循环中的蒸发、径流、蓄渗等环节来调节地表与大气之间的水循环和能量平衡[2-3],并且直接影响植物的可利用水分,进而影响植物的生产力和作物产量;因此土壤湿度对农业有着重要影响,常被用作农业干旱的一个重要监测指标[4⇓-6]。农田根据水分条件的差异可分为旱作农田和水田,中国水田一般具备良好的灌溉条件,土壤湿度长期处于饱和状态[7],而旱作农田由于受季风等气候因素的影响,易遭受干旱灾害[8]。且中国旱作农区的土地资源丰富,在农业生产中占重要地位[9]。自20世纪下半叶以来中国经常遭受严重的干旱,尤其是1990年之后[10]。因此,探索全球变暖背景下中国旱作农田土壤湿度时空分异规律及其驱动因素,对于理解气候变化和土壤湿度的相互作用机制,摸清中国干旱的发生发展状况至关重要。
土壤湿度驱动因素的研究表明土壤湿度变化主要受降水的影响,降水作为土壤湿度最主要的输入来源,与土壤湿度存在显著的正相关,但二者之间的耦合强度存在不确定性[17]。此外土壤湿度也受温度变化的影响,温度通过影响蒸散发过程影响土壤湿度的耗散,同时蒸散发过程也受到土壤湿度大小的影响[18]。土壤湿度还受其他环境因素(如土壤质地、植被和地形)的辅助影响[19]。当前,一方面全球温暖化导致的持续升温可能造成土壤湿度的消耗,另一方面大气环流的变化也会改变降水的时空分布,特别是近年来中国降水格局的改变可能对土壤湿度产生影响。鉴于影响土壤湿度因素的多样性和复杂性及其对农业生产的重要性,亟需理清中国土壤湿度最新的演变规律及驱动机制。
本文基于1992—2018年中国农气站土壤湿度监测数据,采用分段线性回归模型和Sen+MK趋势分析等多种统计分析方法,研究了中国旱地农田土壤湿度变化的时空模式,定量分析了关键气象因子对土壤湿度变化的贡献,识别了区域土壤湿度变化主导因子。本文将有望加深我们对干旱演变的认识,对科学应对干旱灾害,采取合理有效的措施改善生态环境,积极应对气候变化具有重要参考意义。
2 数据与方法
2.1 数据来源及处理
土壤湿度数据来自于国家气象科学数据共享服务平台(
图1
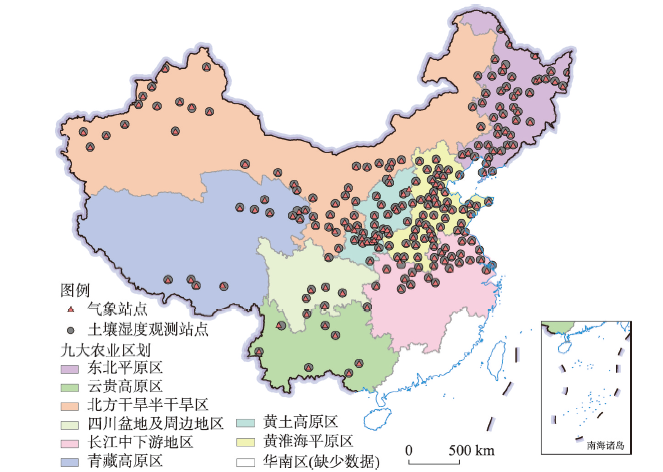
图1
中国九大农业区划及旱作农田土壤相对湿度研究站点分布
注:基于自然资源部标准地图服务网站GS(2019)1823号标准地图制作,底图边界无修改,后图同。
Fig. 1
Distributions of research sites for relative SM in dry croplands across China
气象数据来自国家气象信息中心1992—2018年全国气象观测站及自动站的日值数据(
由于连续、准确的蒸散观测数据获取困难,因此选择使用潜在蒸发量(Potential Evapotranspiration, PET)作为气象因子之一进行分析。本文使用世界粮农组织(FAO)1998年修正的彭曼—蒙蒂斯(Penman-Monteith)模型进行计算[22]。该公式从能量平衡和空气动力学理论出发,物理学意义明确,能反映气候要素的综合影响。选取219个气象站点的日最高气温、日最低气温、日均温、相对湿度、风速及日照时数6个气象要素的逐日数据,使用模型计算得到站点的每日潜在蒸发量,进而计算站点的年蒸散量。
2.2 研究方法
2.2.1 分段线性回归模型
式中:
本文首先计算全国年平均土壤湿度时间序列,并进行分段线性回归;随后为保证结果的客观性,随机采样40%的研究站点来进行分段线性回归,重复300次,基于300次随机采样结果,统计转折年份(Turning Point, TP)的概率密度分布以及由TP分割的各时段内土壤湿度趋势系数的概率密度分布。
2.2.2 Theil-Sen Median趋势分析与Mann-Kendall检验
在不同时段内,进一步利用Theil-Sen Median趋势分析与Mann-Kendall检验相结合的方法得到土壤湿度和气象因子的年际趋势。即先使用Theil-Sen Median趋势分析计算趋势值,然后使用Mann-Kendall非参数检验方法判断趋势显著性[25]。
Theil-Sen Median趋势分析是一种稳健的非参数统计的趋势计算方法,可以减少数据异常值的影响,其计算公式为:
式中:
Mann-Kendall是一种非参数统计检验方法,用来判断趋势的显著性,它无需样本服从一定的分布,也不受少数异常值的干扰。计算公式如下:
式中:
2.2.3 相关性分析
本文计算了站点尺度上的土壤湿度年均值与气象因子年均值的相关系数,来测度土壤湿度趋势变化与气候要素之间的相互关系。具体计算方法如下:
式中:
2.2.4 标准回归系数法
本文利用标准系数法计算了各站点土壤湿度对降水量、温度、风速、蒸散发4种气象因子的标准系数,来得到各个因子对土壤湿度变化的贡献性。公式如下:
式中:
3 结果分析
3.1 土壤湿度变化趋势分析
3.1.1 土壤湿度的时间变化特征
图2
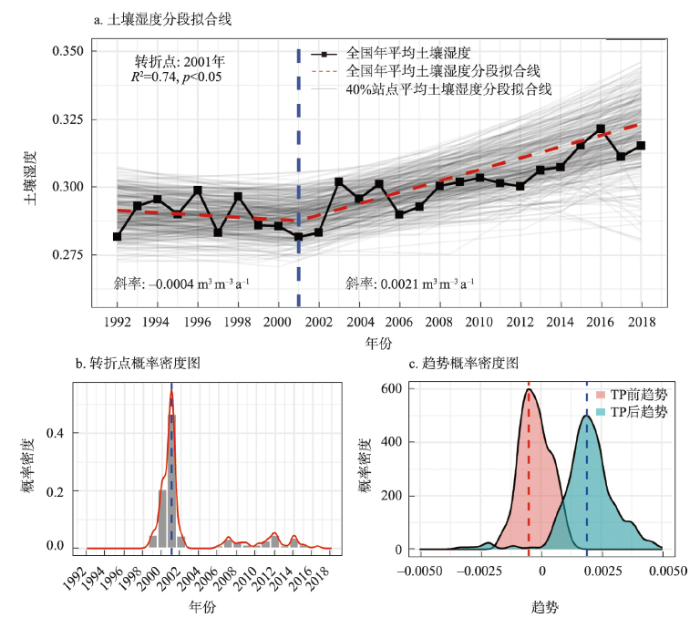
图2
1992—2018年中国旱作农田年均土壤湿度及其趋势转变特征
Fig. 2
Annual mean SM and its trend change in dry croplands across China during 1992-2018
3.1.2 土壤湿度的空间变化特征
图3
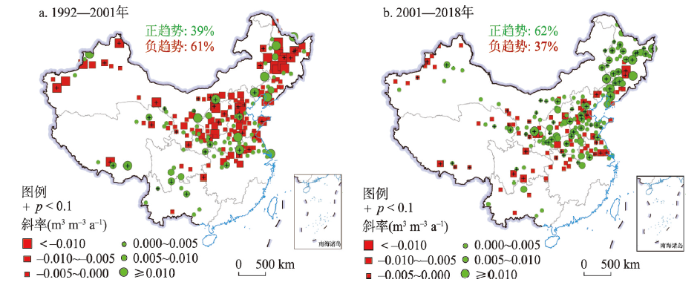
图3
1992—2018年中国旱作农田土壤湿度年际变化趋势
Fig. 3
Trend of SM in dry croplands across China during 1992-2018
表1 1992—2001年及2001—2018年中国不同区域旱地农田土壤湿度变化趋势
Tab. 1
| 时段 | 地区 | 趋势(m3 m-3 a-1) | |||||
|---|---|---|---|---|---|---|---|
| Mean | N(I) | N(D) | Mean(S) | N(SI) | N(SD) | ||
| 1992—2001年 | 东北平原区 | -0.0044 | 14 | 31 | -0.0112 | 1 | 4 |
| 北方干旱半干旱区 | -0.0022 | 15 | 28 | -0.0054 | 3 | 12 | |
| 黄淮海平原区 | -0.0016 | 17 | 32 | -0.0059 | 1 | 8 | |
| 黄土高原区 | -0.0026 | 8 | 20 | -0.0008 | 2 | 3 | |
| 青藏高原区 | 0.0004 | 7 | 6 | 0.0000 | 3 | 2 | |
| 长江中下游地区 | -0.0005 | 14 | 11 | -0.0080 | 2 | 2 | |
| 四川盆地及周边地区 | 0.0016 | 4 | 3 | -0.0002 | 1 | 1 | |
| 云贵高原区 | 0.0021 | 6 | 1 | 0.0051 | 2 | 0 | |
| 全国 | -0.0020 | 85 | 132 | -0.0046 | 15 | 32 | |
| 2001—2018年 | 东北平原区 | 0.0041 | 34 | 11 | 0.0060 | 19 | 3 |
| 北方干旱半干旱区 | 0.0013 | 24 | 20 | 0.0025 | 10 | 7 | |
| 黄淮海平原区 | 0.0016 | 34 | 15 | 0.0028 | 12 | 4 | |
| 黄土高原区 | 0.0024 | 21 | 7 | 0.0038 | 7 | 1 | |
| 青藏高原区 | 0.0000 | 6 | 7 | -0.0001 | 3 | 4 | |
| 长江中下游地区 | -0.0003 | 10 | 15 | -0.0011 | 3 | 5 | |
| 四川盆地及周边地区 | -0.0017 | 3 | 4 | -0.0033 | 1 | 2 | |
| 云贵高原区 | 0.0007 | 4 | 3 | - | 0 | 0 | |
| 全国 | 0.0017 | 136 | 82 | 0.0028 | 55 | 26 | |
注:Mean趋势均值;N(I)呈增加趋势的站点数量;N(D)呈减小趋势的站点数量;Mean(S)趋势显著站点的趋势平均值;N(SI)呈显著增加趋势的站点数量;N(SD)呈显著减小趋势的站点数量。
土壤湿度的变化趋势呈现一定的空间差异性。1991—2001年东北地区、北方干旱半干旱地区、黄淮海平原区、黄土高原区干燥趋势明显;而中国西南地区如青藏高原区、四川盆地及周边地区、云贵高原的站点呈现湿润趋势。而2001—2018年出现了几乎相反的变化模式,东北地区、北方干旱半干旱地区、黄淮海平原区、黄土高原区的站点土壤湿度呈现增加的趋势;而青藏高原区、云贵高原湿润趋势减弱,长江中下游地区、四川盆地及周边地区则变得干燥。这种明显变化主要以中国的秦岭—淮河一线为界,在2001年之后南北方的土壤湿度趋势发生逆转,北方大部分地区土壤湿度由干变湿,南方大部分地区由湿变干,该发现与已有的用SPEI等天气干旱指数分析中国干旱演变基本一致,在21世纪后中国的东北部更湿润,西南部更加干旱[26]。上述南北方土壤湿度的不同变化暗示着土壤湿度的变化可能源于区域气候的差异[27]。
3.1.3 季节土壤湿度变化趋势
土壤湿度在不同季节对气候因子有不同的响应,为探究土壤湿度年际变化趋势的主导成分,进一步分析季节平均土壤湿度的年际趋势及贡献率(表2),结果表明不同季节土壤湿度趋势有所不同。1992—2001年春季土壤湿度、夏季土壤湿度和秋季土壤湿度呈减小的趋势(-0.0017 m3 m-3 a-1、-0.0067 m3 m-3 a-1、-0.0059 m3 m-3 a-1),在2001年后呈增加的趋势(0.0038 m3 m-3 a-1、0.0046 m3 m-3 a-1、0.0039 m3 m-3 a-1)。1992—2001年冬季土壤湿度呈增加的趋势(0.0049 m3 m-3 a-1),在2001年后呈减小的趋势(-0.0042 m3 m-3 a-1)。除冬季外,各个季节土壤湿度和与年均土壤湿度的趋势表现出一致性,其中夏秋两季土壤湿度对年际变化趋势贡献较大,且夏季土壤湿度对土壤湿度的年际变化率是最高的(46.56%、37.8%)。季节土壤湿度变化趋势说明夏秋两季的土壤湿度主导了年际土壤湿度的变化,使其在2001年前后趋势发生转折。这一结果可能是因为对于农业系统影响较大的气象因子,如降水和蒸散发,在夏秋两季波动较为明显,且农作物处于生长期,需水量会对土壤湿度产生较大影响,所以这两个季节的土壤湿度对气候和农业系统的变化是最敏感的[18]。
表2 1992—2001年及2001—2018年中国旱作农田季节土壤湿度变化及其对年际土壤湿度变化的贡献
Tab. 2
| 时段 | 季节 | Mean(S)(m3 m-3 a-1) | 贡献率(%) | N(I) | N(D) | N(SI) | N(SD) |
|---|---|---|---|---|---|---|---|
| 1992—2001年 | 春 | -0.0017 | 12.05 | 105 | 108 | 8 | 14 |
| 夏 | -0.0067 | 46.56 | 83 | 109 | 7 | 18 | |
| 秋 | -0.0059 | 41.39 | 78 | 99 | 7 | 18 | |
| 冬 | 0.0049 | - | 69 | 35 | 9 | 3 | |
| 2001—2018年 | 春 | 0.0038 | 30.68 | 135 | 82 | 41 | 23 |
| 夏 | 0.0046 | 37.80 | 132 | 70 | 38 | 11 | |
| 秋 | 0.0039 | 31.52 | 126 | 67 | 26 | 11 | |
| 冬 | -0.0042 | - | 52 | 57 | 6 | 11 |
注:表中符号的意义同
3.2 气象因子时空变化特征
图4
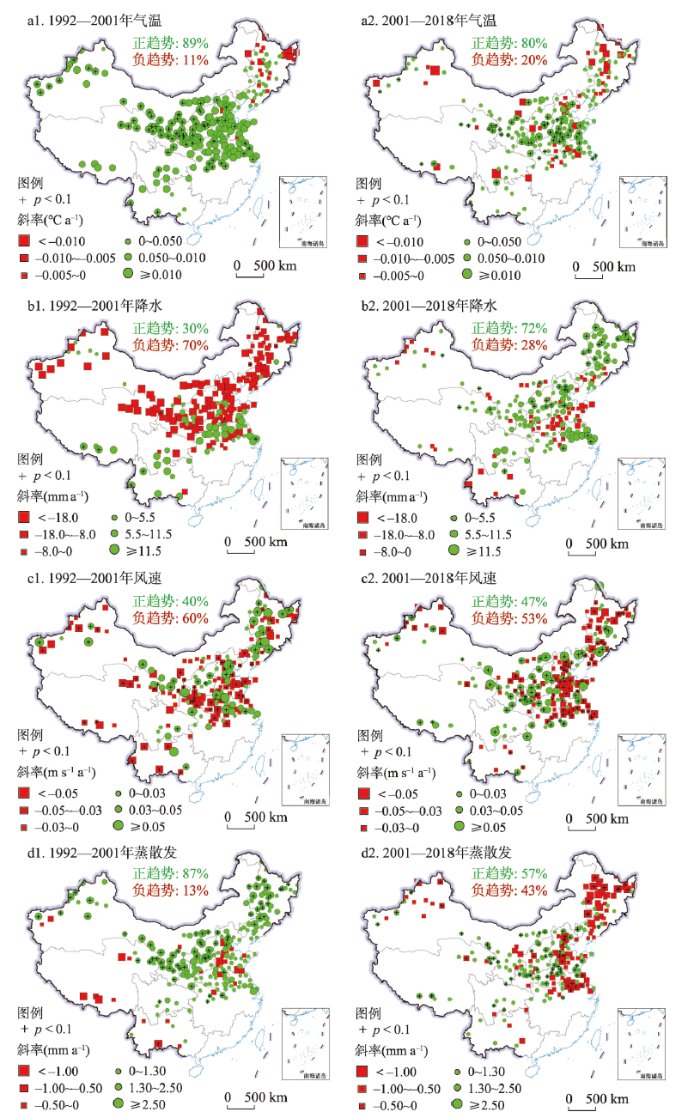
图4
1992—2018年中国不同气象因子的变化趋势
Fig. 4
Trends in climate factors (i.e., precipitation, temperature, wind and potential evapotranspiration) in China during 1992-2018
降水在2001年后发生较大的改变,在全国范围内由下降变为上升趋势,这与土壤湿度的趋势变化一致,前一时期降水减少,土壤湿度呈减小趋势;后一时期降水增多,土壤湿度呈增加趋势,这说明降水趋势可能控制着土壤湿度变化的方向[10]。具体来看,在1992—2001年东北平原区、北方干旱半干旱区、黄土高原地区、黄淮海平原的大多站点降水呈现减小的趋势,青藏高原区、四川盆地和周边地区、云贵高原区站点降水多呈上升趋势(图4b1)。但在2001—2018年降水趋势分布发生逆转,东北平原区、北方干旱半干旱区、黄土高原地区、黄淮海平原北部地区大多数站点降水呈增加趋势,而青藏高原、云贵高原、黄淮海平原南部地区大多站点降水增长趋势放缓,甚至呈减小趋势(图4b2)。降水与土壤湿度的趋势变化也表现出了较为一致的空间模式(图4b1、4b2),进一步说明降水趋势与土壤湿度的长期变化有很强的关系,土壤湿度趋势在2001年的变化可能与降水格局的改变有关[14]。
综上,各个气象因子在2001年后趋势发生一定变化,且存在空间差异,这可能造成了土壤湿度趋势的改变和空间差异的变化。在2001年后中国北部和东部地区降水增多,土壤湿度的供给增多,同时增温趋势放缓,风速下降,蒸散发减弱,利于土壤湿度的保持,在各气象因子协同作用下促进土壤湿度增多。而西南方地区由于风速增加,蒸散发加剧,且降水减弱,可能导致土壤湿度下降。
3.3 气候变化对土壤湿度变化的相对影响
3.3.1 土壤湿度与气象因子的相关性
根据相关性分析结果(表3),我们发现1992—2018年在全国范围内旱作农田土壤湿度与降水呈显著的正相关(0.54);而与蒸散发显著负相关(-0.50);与风速的相关性较低(-0.36),但与风速显著相关的站点数最多;和温度的相关性最低(-0.16)。这说明全国范围内土壤湿度趋势的变化主要受到降水、蒸散发的影响,与前文分析一致。比较前后两个阶段土壤湿度与气象因子的相关性,在前一阶段,土壤湿度与降水的显著相关的站点最多,相关性较强;在后一阶段,与降水的相关性下降,与风速的显著相关的站点明显增多,相关性增强。这说明在后一阶段随着降水的增多,蒸散发过程对土壤湿度的影响在增大。
表3 1992—2018年中国旱作农田年均土壤湿度与气象因子的相关性
Tab. 3
| 时段 | 相关性 | 显著相关站点数(个) | ||||||||
|---|---|---|---|---|---|---|---|---|---|---|
| 降水 | 气温 | 风速 | 蒸散发 | 降水 | 气温 | 风速 | 蒸散发 | |||
| 1992—2018年 | 0.54 | -0.16 | -0.36 | -0.50 | 68 | 27 | 70 | 61 | ||
| 1991—2001年 | 0.66 | -0.33 | -0.35 | -0.72 | 59 | 19 | 35 | 33 | ||
| 2001—2018年 | 0.58 | -0.15 | -0.44 | -0.65 | 45 | 24 | 47 | 37 | ||
3.3.2 土壤湿度对气象因子的敏感性
表4 1992—2018年中国不同区域旱作农田土壤湿度对气候因子的敏感度
Tab. 4
| 地区 | 因子敏感性 | |||
|---|---|---|---|---|
| 降水 | 气温 | 风速 | 蒸散发 | |
| 北方干旱半干旱区 | 0.31 | 0.22 | 0.13 | 0.34 |
| 东北平原区 | 0.40 | 0.15 | 0.19 | 0.26 |
| 黄淮海平原区 | 0.37 | 0.16 | 0.20 | 0.27 |
| 黄土高原区 | 0.40 | 0.21 | 0.14 | 0.25 |
| 青藏高原区 | 0.44 | 0.22 | 0.10 | 0.24 |
| 云贵高原区 | 0.12 | 0.01 | 0.34 | 0.53 |
| 长江中下游地区 | 0.22 | 0.28 | 0.17 | 0.32 |
图5
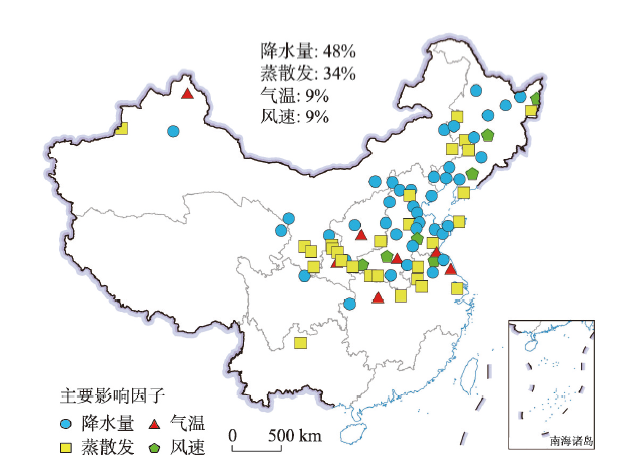
图5
1992—2018年中国旱作农田土壤湿度变化的主导因子
Fig. 5
Spatial distribution of dominant controls on SM changes in dry croplands across China during 1992-2018
在不同区域,土壤湿度对各个气象因子的敏感性有所不同。整体上北部地区对降水的变化更加敏感,而南部地区对蒸散发的变化更加敏感。具体来看,在东北地区、黄土高原、黄淮海北部平原区,降水是土壤湿度的主导因子,2001年降水由下降转为上升趋势,土壤湿度也就随之发生相似的转变,同时蒸散发在东部地区的减小起到协同作用。但在黄淮海平原区的南部,降水始终保持下降趋势,土壤湿度却转为上升趋势,这是因为南部区域主导因子较复杂,受到蒸散发降低以及人为因素,如灌溉水平提高的影响[31]。在北方干旱半干旱区,土壤湿度对蒸散发和降水量都具有较高的敏感性,2001年该地区的蒸散发和降水趋势都发生转折:蒸散发由上升变为下降趋势,降水由下降变为上升趋势,在降水和蒸散发的协同作用下,土壤湿度趋势也随之发生由下降到上升的显著转变(图3a、3b)。
而在云贵高原、长江中下游地区,相比于降水,土壤湿度对蒸散发的变化更加敏感,这可能是因为南方区域受夏季风影响,降水量通常较为充足,降水不是限制土壤水的关键因素,但由于温度较高,蒸散发过程活跃,导致土壤水的耗散,因此蒸散发强度可能成为影响土壤湿度的主要因素。2001年云贵高原区由于蒸散发的增加,土壤湿度转为下降趋势,降水在西南地区增势的减缓或下降起到辅助作用;长江中下游地区蒸散发则明显减弱,土壤湿度的下降趋势有所减缓。
4 结论与讨论
土壤湿度的变化是陆气系统长期相互作用的结果。本文基于1992—2018年中国219个旱地农田农气站的土壤湿度观测数据,分析了1992—2018年中国旱地农田土壤湿度的长期趋势,揭示了土壤湿度变化的时空特征,并进一步探究土壤湿度演变的驱动机制,结果表明:
(1)在时间格局上,1992—2018年中国旱地农田土壤湿度在2001年发生了转折,在1992—2001年土壤湿度基本呈下降趋势,在2001—2018年则呈显著上升趋势。该趋势主要由夏季和秋季土壤湿度主导。
(2)在空间格局上,不同地区的土壤湿度演变模式有所不同。中国北部、东部地区土壤湿度由下降变为上升趋势;而西南部地区土壤湿度由上升变为下降趋势。
(3)降水和蒸散发的变化是土壤湿度趋势发生时空变化的主要原因,2001年后增温的减缓,降水的增多和蒸散发的减小,使得土壤湿度的补给增多,损失减小,从而有利于土壤湿度整体的增多。在大部分地区二者起到协同作用,但主导因子存在区域差异:北方地区由降水主导,南方地区由蒸散发主导。
2001年后中国气候的改变可能与全球气候变暖的中断以及大气环流导致的中亚地区湿润区的形成有关[32]。在前一时段东亚经历了加速变暖,气候变暖最快的地区位于东亚东北地区,导致蒸汽压不足和蒸发需求增加,增强了地区的干燥[33-34]。然而,后一时间段东亚地区的变暖速度出现放缓[28]。气候的改变,带来了土壤湿度的变化,土壤湿度通过影响地表能量、水分的再分配,对气候系统产生反馈作用,例如土壤湿度的增加,可以促进蒸散发过程,使得降水进一步增多,形成正向循环,从而有效缓解干旱[18,35]。此外,从1999年以来中国开展了大规模的退耕还林、还草工程,大量研究表明这些工程加速了全国绿化的趋势,促进了植被的恢复[36]。恢复的植被能够通过提高水分利用效率和改善局地小气候调节地表水平衡[37],从而发挥土壤保持、水源涵养等生态效益[38],这也可能促进了中国土壤湿度长期趋势的转折。
参考文献
Soil moisture: A central and unifying theme in physical geography
Investigating soil moisture-climate interactions in a changing climate: A review
DOI:10.1016/j.earscirev.2010.02.004 URL [本文引用: 1]
The global distribution and dynamics of surface soil moisture
DOI:10.1038/NGEO2868
[本文引用: 1]

Surface soil moisture has a direct impact on food security, human health and ecosystem function. It also plays a key role in the climate system, and the development and persistence of extreme weather events such as droughts, floods and heatwaves. However, sparse and uneven observations have made it difficult to quantify the global distribution and dynamics of surface soil moisture. Here we introduce a metric of soil moisture memory and use a full year of global observations from NASA's Soil Moisture Active Passive mission to show that surface soil moisture-a storage believed to make up less than 0.001% of the global freshwater budget by volume, and equivalent to an, on average, 8-mm thin layer of water covering all land surfaces-plays a significant role in the water cycle. Specifically, we find that surface soil moisture retains a median 14% of precipitation falling on land after three days. Furthermore, the retained fraction of the surface soil moisture storage after three days is highest over arid regions, and in regions where drainage to groundwater storage is lowest. We conclude that lower groundwater storage in these regions is due not only to lower precipitation, but also to the complex partitioning of the water cycle by the surface soil moisture storage layer at the land surface.
Satellite soil moisture for agricultural drought monitoring: Assessment of SMAP-derived soil water deficit index in Xiang River Basin, China
Satellite soil moisture for agricultural drought monitoring: Assessment of the SMOS derived Soil Water Deficit Index
DOI:10.1016/j.rse.2016.02.064 URL [本文引用: 1]
Nonparametric integrated agro-meteorological drought monitoring in China: New monitoring technique and applicability
DOI:10.11821/dlxb201801006
[本文引用: 1]
Drought is one of the most catastrophic natural hazards which have severe impacts on human society and yet it is the least understood hazard. Monitoring drought in a reliable way plays a critical role in the early warning as well as the mitigation of drought hazard. Generally, the integrated agro-meteorological drought monitoring is one of the most popular drought monitoring methods and it is the key step to mitigate droughts effectively. However, the originally developed integrated drought monitoring index included nothing about evapotranspiration, and it does perform not well in reflecting impacts of evapotranspiration on occurrence of droughts. In this case, this study attempted to propose an improved version of the multivariate standardized drought index (MSDI) using standardized precipitation evapotranspiration index (SPEI) and standardized soil moisture index (SSI), i.e. modified multivariate standardized drought index (MMSDI). Based on the statistical records of drought-affected crop area in 7 geographical zones across China, this study tests the applicability of MMSDI in drought monitoring across China in 3-month and 6-month time scales, with comparison to the meteorological drought monitored by SPEI, agricultural drought monitored by SSI and integrated agro-meteorological drought monitored by MSDI. The result indicates that MMSDI can monitor meteorological drought and agricultural drought simultaneously. Furthermore, MMSDI has greater superiority than SPEI, SSI and MSDI in the veracity of drought monitoring. Besides, MMSDI can monitor droughts in bad conditions where meteorological drought and agricultural drought monitoring technique cannot be applied. Moreover, MSDI tends to overestimate the drought intensity and the size of drought-affected regions across China. In sum, MMSDI proposed in this study can be used to monitor and detect drought conditions in a more accurate way from perspectives of meteorological drought and agricultural drought. Meanwhile, drought conditions monitored by MMSDI are very close to in-situ observations and to the real-world observations of droughts in terms of drought-affected regions and related losses. In this sense, this study provides a theoretical foundation for large-scale drought monitoring across China, and provides practical regional case studies for related research in other regions of the world.
中国气象农业非参数化综合干旱监测及其适用性
DOI:10.11821/dlxb201801006
[本文引用: 1]
旱灾是对人类社会影响以及致损最大的灾种之一,如何进行可靠的旱灾监测是旱灾预警与旱灾防灾减灾的关键。气象干旱与农业干旱的综合干旱方法是目前干旱监测的主要方法之一。本文对多变量标准化干旱指数(MSDI)方法进行改进,以非参数化的方法计算标准化降水蒸散指数(SPEI)、标准化土壤湿度指数(SSI),提出改进的MSDI,即气象农业综合干旱指标(MMSDI)。在此基础上,用1979-2015年中国降水资料、蒸散发资料以及土壤湿度数据对不同时间尺度(3月尺度与6月尺度)分别研究气象干旱、农业干旱、气象农业综合干旱,用气象农业综合干旱分别与气象干旱、农业干旱和改进之前的气象农业综合干旱对比,并结合实际记录的干旱事件时空特征验证,结果证实MMSDI指数可以同时监测气象与农业干旱,且其监测结果准确度高于单一变量的气象(SPEI)或农业(SSI)干旱监测,MMSDI指数对气象农业综合干旱具有更好的监测效果,可考虑作为中国气象农业综合干旱监测及旱灾预警的重要理论依据。
Global warming over 1960-2009 did increase heat stress and reduce cold stress in the major rice-planting areas across China
DOI:10.1016/j.eja.2014.05.008 URL [本文引用: 1]
Improving regional wheat drought risk assessment for insurance application by integrating scenario-driven crop model, machine learning, and satellite data
Optimizing genotype-environment-management interactions for maize farmers to adapt to climate change in different agro-ecological zones across China
Long-term trend and variability of soil moisture over East Asia
DOI:10.1002/2015JD023206 URL [本文引用: 3]
Spatio-temporal variation of drought in China during 1961-2012: A climatic perspective
DOI:10.1016/j.jhydrol.2014.09.047 URL [本文引用: 1]
Drought evolution, severity and trends in mainland of China over 1961-2013
DOI:10.1016/j.scitotenv.2017.10.327 URL [本文引用: 1]
Spatial and temporal variations of relative soil moisture in China's farmland
DOI:10.11821/dlxb201901009
[本文引用: 2]
Based on the data of relative soil moisture obtained from 653 agricultural meteorological stations in China during the period of 1993-2013, the spatial and temporal differentiations of relative soil moisture in China's farmland were analyzed and discussed by using geostatistical methods. The results show that the relative soil moisture of China's farmland has fluctuated and increased since 1993, exceeding 60% in general. The distribution area has been expanding to the north and west with the summer monsoon since mid-April, and in late October, the region began to shrink to the east and south. The value of relative soil moisture increases with the increase of soil depth, and the distribution of farmland in high-value area increases with the increase of soil depth. The relative soil moisture of farmland increases fastest in summer and autumn, and the range of change decreases with the increase of soil depth. There is a strong positive correlation between relative soil moisture and precipitation. Relative soil moisture has a strong negative correlation with potential evaporation and temperature. The annual mean value of relative soil moisture in paddy field is higher than that in dry land, and the difference between the annual mean values of relative soil moisture of two types of farmland increases with the increase of soil depth.
中国耕地土壤相对湿度时空分异
DOI:10.11821/dlxb201901009
[本文引用: 2]
以全国653个农业气象站1993-2013年耕地的土壤相对湿度数据为基础,运用地统计方法,分析中国耕地土壤相对湿度时空分异特征与规律。结果表明:自1993年以来全国耕地的土壤相对湿度呈现波动上升趋势。全国耕地的土壤相对湿度普遍大于60%,分布区域自4月中旬开始随夏季风推移不断向北向西扩大,自10月下旬开始向东、南方向缩小。耕地土壤相对湿度值随土壤深度的增加而增加。年际尺度上,耕地的土壤相对湿度在夏秋季上升速度最快,变化幅度随土层深度增加而变小。土壤相对湿度与降水量存在较强的正相关关系,与潜在蒸发量、气温普遍存在较强的负相关关系。土壤相对湿度与各气象要素的相关性随深度加深而减弱。春、夏、秋季气象因素对旱地土壤相对湿度影响较大,冬季气象因素对水田影响更大。
Decadal change in soil moisture over East Asia in response to a decade-long warming hiatus
DOI:10.1029/2019JD030294 URL [本文引用: 3]
An improved global remote-sensing-based surface soil moisture (RSSSM) dataset covering 2003-2018
DOI:10.5194/essd-13-1-2021 URL [本文引用: 1]
Downscaling SMAP soil moisture estimation with gradient boosting decision tree regression over the Tibetan Plateau
DOI:10.1016/j.rse.2019.02.022 URL [本文引用: 1]
Regions of strong coupling between soil moisture and precipitation
Previous estimates of land-atmosphere interaction (the impact of soil moisture on precipitation) have been limited by a lack of observational data and by the model dependence of computational estimates. To counter the second limitation, a dozen climate-modeling groups have recently performed the same highly controlled numerical experiment as part of a coordinated comparison project. This allows a multimodel estimation of the regions on Earth where precipitation is affected by soil moisture anomalies during Northern Hemisphere summer. Potential benefits of this estimation may include improved seasonal rainfall forecasts.
Relationship between soil moisture and climate and its memory in Southwest China
西南地区土壤湿度与气候之间的互馈效应
Spatio-temporal variations of the ratio of transpiration to evapotranspiration in forest ecosystems along the North-South Transect of Eastern China
DOI:10.11821/dlxb201901005
[本文引用: 1]
<p>The ratio of transpiration to evapotranspiration (T/ET) is a key parameter for quantifying water use efficiency of ecosystems and understanding the interaction between ecosystem carbon uptake and water cycling in the context of global change. The estimation of T/ET has been paid increasing attention from the scientific community in recent years globally. In this paper, we used the Priestly-Taylor Jet Propulsion Laboratory Model (PT-JPL) driven by regional remote sensing data and gridded meteorological data, to simulate the T/ET in forest ecosystems along the North-South Transect of Eastern China (NSTEC) during 2001-2010, and to analyze the spatial distribution and temporal variation of T/ET, as well as the factors influencing the variation in T/ET. The results show that: (1) The PT-JPL model is suitable for the simulation of evapotranspiration and its components of forest ecosystems in Eastern China, and has relatively good stability and reliability. (2) Spatial distribution of T/ET in forest ecosystems along NSTEC was heterogeneous, i.e., T/ET was higher in the north and lower in the south, with an averaged value of 0.69; and the inter-annual variation of T/ET showed a significantly increasing trend, with an increment of 0.007/yr (<i>p </i>< 0.01). (3) Seasonal and inter-annual variations of T/ET had different dominant factors. Temperature and EVI can explain around 90% (<i>p </i>< 0.01) of the seasonal variation in T/ET, while the inter-annual variation in T/ET was mainly controlled by EVI (53%, <i>p </i>< 0.05).</p>
中国东部南北样带森林生态系统蒸腾与蒸散比值(T/ET)时空变化
DOI:10.11821/dlxb201901005
[本文引用: 1]
植被蒸腾与蒸散的比值(transpiration/evapotranspiration, T/ET)表征了植被蒸腾对生态系统蒸散的贡献率,是准确量化生态系统水分利用效率的关键参数,对研究植被水分运移的生理生态机理以及碳水循环关系具有重要意义。基于站点数据验证PT-JPL模型(Priestly-Taylor Jet Propulsion Laboratory Model)模拟精度,集成遥感数据和气象栅格数据模拟中国东部南北样带森林生态系统2001-2010年T/ET,并分析其时空变化及影响因子。结果表明:① PT-JPL模型适用于中国东部森林生态系统蒸散及其组分模拟,具有较高的稳定性和可靠性;② 中国东部南北样带森林生态系统T/ET空间差异显著,整体呈南部低、北部高,主要由夏季T/ET空间格局主导;样带整体T/ET均值为0.69,2001-2010年呈显著缓慢上升趋势,增幅为0.007/yr(p p p
Spatial-temporal characteristics of soil moisture in China
DOI:10.11821/dlxb201609003
[本文引用: 1]
Using actual observed soil moisture data of 155 agro-meteorological stations across China, at dekadal scale from 1981 to 2010, this paper examined the spatial and temporal characteristics of soil moisture at each 10 cm depth from 0 to 50 cm, at regional and national scales. Annual trend and significant change point were detected through tendency analysis and Cramér-von Mises test methods. Since soil texture and crop types were approximately homogeneous in each climatic region, regional average variation of soil moisture could be observed in the analysis. Mean soil moisture was between 15% and 25% in most regions while it was above 25% in the northern part of Northeast China and southern part of Southwest China. At each depth, larger soil moisture was detected in Southwest China, Jianghuai, Northeast China, Jiangnan, Jianghan, Huanghuai and South China, while the smallest value was observed in Inner Mongolia. As soil deepening, except in Tibetan Plateau, increases in soil moisture were apparent, being a maximal magnitude in Southwest China. Obviously, as well as periodical characteristics, annual and seasonal difference of soil moisture emerged at each depth, corresponding well to regional precipitation, temperature, and water demand for planting crops. An obvious freezing-increasing-deceasing-increasing trend existed in Northeast China, Inner Mongolia and Xinjiang, a variation of deceasing-increasing-fluctuating in North China, Huanghuai, and eastern Northwest China, a multiple fluctuation in Jianghuai, Jianghan and Jiangnan, and a deceasing-increasing-deceasing trend in South China and Southwest China, while an increasing-deceasing trend was found in the Tibetan Plateau. Soil moisture at a greater depth was higher than that at superficial layers. Annual soil moisture varied at each depth, but the mean value decreased from 1981 to 2010. Such annual variation could be well explained by corresponding temperature and precipitation. Consequently, soil moisture tended to decrease in response to temperature increase, following climate change. Apart from climatic factors, soil texture and crop type, as well as human activity, can have influence on soil moisture, which is needed to be studied further. Soil moisture decreased in Xinjiang, South China, North China, Tibetan Plateau, Northeast China and Huanghuai among which Xinjiang was most remarkable with a velocity above -2.3%?(10a)-1. Except in Jianghuai, a significant change of soil moisture was detected, mainly during two periods, i.e. from the late 1980s to early 1990s, and late 1990s.
中国土壤湿度的时空变化特征
DOI:10.11821/dlxb201609003
[本文引用: 1]
基于中国155个农业气象观测站1981-2010年逐旬土壤湿度资料,分析了全国和12个气候区域0~50 cm逐层的土壤湿度时空分布规律,采用趋势分析和Cramér-von Mises(CVM)方法探究了土壤湿度的变化趋势及突变性。结果表明:西南、江淮、东北、江南、江汉、黄淮和华南地区各层土壤湿度均高于全国平均值,内蒙古地区最低;随着深度增加,西南地区土壤湿度增加最明显,仅青藏高原地区土壤湿度减小。不同区域0~50 cm各层土壤湿度年变化和季节变化差异明显,并具有阶段性特征,大部地区深层土壤湿度高于浅层;总体上,新疆、华南、华北、青藏高原、东北、黄淮地区1981-2010年土壤湿度减小趋势显著,其中新疆地区减小最为明显。除江淮地区外,各区域土壤湿度均存在较为明显的年际差异,突变时段主要集中在20世纪80年代后期至90年代初期、90年代后期两个时间段。
A recommendation on standardized surface resistance for hourly calculation of reference ET0 by the FAO 56 Penman-Monteith method
DOI:10.1016/j.agwat.2005.03.007 URL [本文引用: 1]
Piecewise regression: A tool for identifying ecological thresholds
DOI:10.1890/02-0472 URL [本文引用: 1]
A reversal in global terrestrial stilling and its implications for wind energy production
DOI:10.1038/s41558-019-0622-6 URL [本文引用: 1]
Limits to detectability of land degradation by trend analysis of vegetation index data
DOI:10.1016/j.rse.2012.06.022 URL [本文引用: 2]
Use of the standardized precipitation evapotranspiration index (SPEI) to characterize the drying trend in Southwest China from 1982-2012
DOI:10.3390/rs70810917 URL [本文引用: 1]
Ground observation-based analysis of soil moisture spatiotemporal variability across a humid to semi-humid transitional zone in China
DOI:10.1016/j.jhydrol.2019.04.087
[本文引用: 1]
Little measurement-based soil moisture information is available for the humid to semi-humid transitional zones in China. Anhui Province is a representative area of these zones and spans several hydroclimatic and geomorphological zones. To overcome shortage of observational soil moisture information in this area, we collected and compiled a multi-layer daily soil moisture record from 2012 to 2016 across Anhui Province based on the observations of a soil moisture-observing network composed of 85 sites. We then analyzed the vertical and spatiotemporal variability of soil moisture across this region. Primary findings are: (a) soil moisture in this region has apparent vertical gradients and increases with soil depth; (b) substantial soil moisture spatial variability appears in the shallow soil layers (depth <= 40 cm) with the highest values in the middle part of this region, but soil moisture in the deep layers (depth > 40 cm) shows low spatial variability; (c) seasonality of soil moisture across this region is complicated and has fluctuations with July as the wettest month in most of the province; (d) inter-monthly fluctuation of soil moisture is larger in the upper soil layers than in the lower layers; and (e) antecedent accumulated rainfall is a major factor influencing soil moisture throughout this region with soil moisture in the upper layers more sensitive to immediate weather conditions and soil moisture in the lower layers showing lagged responses to the weather conditions. This study can not only reveal the spatiotemporal and vertical characteristics of soil moisture across this region, but also provide a useful reference dataset for the other soil moisture modeling and retrieval studies.
Recent intensification of wind-driven circulation in the Pacific and the ongoing warming hiatus
DOI:10.1038/nclimate2106 URL [本文引用: 2]
Spatiotemporal characteristics of wind energy resources from 1960 to 2016 over China
DOI:10.1080/16742834.2019.1705753 URL [本文引用: 1]
Are surface wind speeds still weakening in China?
DOI:10.1360/SSTe-2020-0228 URL [本文引用: 1]
中国区域的地表风速还在减弱吗?
Modified palmer drought severity index: Model improvement and application
Changes in aridity in response to the global warming hiatus
DOI:10.1007/s13351-017-6038-1 URL [本文引用: 1]
Enhanced soil moisture drying in transitional regions under a warming climate
DOI:10.1002/2015JD024559 URL [本文引用: 1]
Global trends and variability in soil moisture and drought characteristics, 1950-2000, from observation-driven simulations of the terrestrial hydrologic cycle
DOI:10.1175/2007JCLI1822.1 URL [本文引用: 1]
Temporal and spatial variation of soil moisture and its possible impact on regional air temperature in China
Detection and attribution of vegetation greening trend in China over the last 30 years
DOI:10.1111/gcb.12795 URL [本文引用: 1]
Vegetation dynamics and their effects on surface water-energy balance over the Three-North Region of China
DOI:10.1016/j.agrformet.2019.05.012 URL [本文引用: 1]
Evaluating changes in ecological land and effect of protecting important ecological spaces in China
DOI:10.11821/dlxb202107010
[本文引用: 1]
It is important to quantitatively analyze the effects of protecting important ecological spaces in China to ensure national ecological security. By considering changes in the ecological land, this study examines the effects of protecting three types of important natural ecological spaces in China. The results show that: (1) In 2018, the ratio of ecological land to important natural ecological spaces accounted for 92.64%. This land had a good ecological background that reflects the developmental orientation of important ecological spaces. (2) From 1980 to 2018, the area of ecological land in important ecological spaces shrank but the rate of reduction was lower than the national average, which shows the positive effect of regulating construction in natural ecological spaces. The restorative effects of ecological projects to convert farmland into forests and grasslands have been prominent. The expanded ecological land is mainly distributed in areas where such projects have been implemented, and the reduced area is concentrated in grain-producing regions of the Northeast China Plain and agricultural oases of Xinjiang. In the future, the government should focus on strengthening the management and control of these areas. (3) The area ratio of ecological land was the highest in national nature reserves. The rate of reduction in its area was the lowest and the trend of reduction was the smallest in national nature reserves, which reflects differences in the status of ecological protection among different spaces. (4) The ratio of ecological land to important ecological spaces was higher than that in the surrounding external space, and the rate of reduction in it was lower. Thus, the effects of internal and external protection had clear differences in terms of gradient.
中国重要生态空间生态用地变化与保护成效评估
DOI:10.11821/dlxb202107010
[本文引用: 1]
定量分析重要生态空间建立前后的生态保护成效,对于保障国家生态安全具有重要意义。本文以生态用地为切入点,从时间和空间双重角度,评估了中国重要生态空间构建的生态保护效果,以期能为国土空间分类分区管控提供科学依据。结果表明:① 2018年重要生态空间以生态用地为主导,具有良好的生态本底,体现了重要生态空间的发展定位和重要地位; ② 1980—2018年,重要生态空间内生态用地呈收缩趋势,但面积减少率低于全国平均水平,定量反映了重要生态空间的构建对生态的积极保护成效,总体来说生态用地变化基本处于稳定状态,扩大区域主要分布在退耕还林还草生态保护工程实施区,缩小区域集中在东北平原的粮食主产区和新疆绿洲农业地区,今后要重点加强管控;③ 3类重要生态空间内部生态保护成效有差异,国家级自然保护区生态用地面积比例最高,生态用地面积减少率最小、减少趋势最不明显、变化最为稳定,生态保护效果最好;④ 重要生态空间内生态用地面积比例高于周边外部区域,面积减少率低于外部区域,内、外保护成效具有明显梯度差异,说明重要生态空间的构建对生态保护的意义重大。
Attribution of global soil moisture drying to human activities: A quantitative viewpoint
DOI:10.1029/2018GL080768 URL [本文引用: 1]
Changes in agricultural water demands and soil moisture in China over the last half-century and their effects on agricultural production
DOI:10.1016/S0168-1923(03)00107-2 URL [本文引用: 1]
