

1 引言
与陆地相比,湖泊的反照率更低、比热容更大、粗糙度更小[1-2],且以湍流在水体中传递热量[3]。湖泊的这些动力和热力特性影响局地辐射收支和能量平衡[4⇓⇓⇓⇓-9],改变流域天气和区域气候[3-4,7,10],在湖泊密集区域和大湖周边尤其明显[11⇓-13]。首先,湖泊对区域气温变化具有缓冲作用[14]。其次,湖泊与邻近陆地之间的热力差异会激发湖陆风环流[15],影响流域内污染物的扩散和传输。再次,气候变暖加速湖面蒸发[16-17],为大气提供充足的水汽来源,使得湖泊效应降水频率增加、强度增大[18⇓⇓-21]。研究湖泊的气候效应,不仅有利于评估湖泊在流域天气预报和区域气候预测中的价值,还可为保护湖泊生态系统和合理利用淡水资源提供科学参考。
湖泊对气温的影响是湖泊气候效应研究的重点,目前针对湖泊温度效应的研究主要存在两种不同的观点。第一种观点认为湖泊会使气温上升[4⇓⇓-7,22⇓ -24]。温带和高纬度湖泊在夏季吸收更多太阳辐射,在秋冬季释放热量,使湖泊表面气温可比周围陆地高17 K[4]。第二种观点认为湖泊会降低气温[4,11,12,25⇓⇓ -28]。湖泊蒸发消耗潜热,降低周围环境温度[29],且水体对热量的储存也会降低感热,减弱对大气的加热作用[1]。非洲中部一些大湖可使湖表年平均气温降低0.6~0.9 K[26],而在夏初,一些温带和高海拔的湖泊表面气温可比周围陆地低5 K[4]。产生上述两种不同观点的主要原因有:其一,受观测和模拟的时空代表性限制,当前研究多聚焦于单个湖泊或同一个流域内几个湖泊的短期温度效应[7,22⇓ -24,26 -27,30 -31],缺乏跨气候区的多时间尺度的对比研究;其二,当前湖泊温度效应的影响因子研究多以统计分析为主[29,32⇓ -34],缺乏从物理角度认知各因子对湖泊温度的影响过程,难以拆分各因子对湖泊温度效应的贡献。
表面温度(即地表温度)是地表与大气之间辐射和能量交换的综合结果[35],随土地覆盖类型改变较气温更敏感[36],适用于研究湖泊温度效应[37]。陆面过程模型的发展使湖泊温度效应研究突破了时空尺度限制,且能从物理角度阐述不同下垫面温度的形成过程。耦合CLM(Community Land Model)的CESM(Community Earth System Model)模式可以模拟气候变化背景下全球湖泊的物理过程[16],是研究跨气候区尺度湖泊温度效应的重要工具。湖泊温度效应的影响因子众多、过程复杂,寻找合适的方法定量拆分各因子对湖泊温度效应的贡献至关重要。Lee[38]提出的表面温度变化影响因子拆分理论IBPM(Intrinsic Biophysical Mechanism),最初用于研究北美森林砍伐的气候效应,后由Zhao等[39]引入人为热,分析了北美城镇化引起的地表温度变化,并成功量化了气溶胶对中国城市热岛强度的贡献[40]。Wang等[16]用该理论阐明了湖泊蒸发对气候变暖的响应机制,成功量化了人造林对表面温度的影响[41]。发展至今的IBPM理论综合考虑了大气强迫、长波辐射反馈和能量再分配等物理过程对表面温度的影响,可基于陆面过程模型输出结果拆分湖泊温度效应的影响因子。
本文基于耦合CLM4.5的CESM的1991—2010年全球气候数据,分析了全球湖泊表面温度效应的时空变化特征,利用IBPM因子拆分理论量化了反照率、对流效率、蒸发和热储量对湖泊和邻近陆地表面温度差异的贡献。旨在回答两个科学问题:① 全球湖泊表面温度效应的时空变化特征如何?② 湖泊与邻近陆地表面温度差异的主控因子是什么?是否随气候区发生变化?
2 研究方法与数据来源
2.1 CLM4.5
CLM4.5是由美国国家大气研究中心NCAR(National Center for Atmospheric Research)研发的地球系统模式CESM的陆面模块[42-43]。CLM4.5使用层次结构表征下垫面的异质性。第一层次为网格点,每个网格最多由5种土地单元(冰川、城市、农业、植被和湖泊)组成[44]。本文使用的湖泊模型是CLM4.5中的湖泊模块CLM-LISSS(CLM-Lake, Ice, Snow, and Sediment Simulator)[2],该湖泊模型采用物质传输方程在次网格上计算湖泊表面与其上方大气之间的感热和潜热通量[2]。网格中湖泊面积占比数据来自于全球湖泊和湿地数据库[45],湖泊深度信息来源于为数值天气和气候模式设计的湖泊深度网格数据[46]。
本文所使用的数据是采用CRUNCEP(Climatic Research Unit National Centers for Environmental Prediction)气象场驱动CLM4.5得到的1991—2010年逐月的全球模拟结果,空间分辨率为0.94°×1.25°。该数据经Wang等[16]使用全球27个湖泊实测的潜热通量数据验证,模拟结果可靠(R = 0.82、p < 0.01、RMSE = 21.27 W m-2)。
2.2 配对站点及气候区分布
本文湖泊表面温度效应是指在月或年尺度上湖泊与邻近陆地表面温度的差值。当湖泊表面温度高于邻近陆地表面温度时,湖泊对局地有增温效应,反之为降温效应。为了量化湖泊表面温度效应及其影响因子,在同一个网格内提取湖泊和邻近陆地(郊区)的与表面能量平衡相关的次网格变量,邻近陆地次网格变量数值是植被和农田两种土地单元结果的面积加权平均值。CLM4.5中共有4643个网格点含有湖泊,在配对邻近陆地时,分布在南极的27个网格内无陆地单元,本文以除这27个格点之外的4616个含有湖泊的网格点为研究对象。根据Köppen-Geiger气候区划分标准[47](图1a),属于热带、干旱区、温带、寒带和极地的湖泊—陆地配对站点个数分别为666个、299个、682个、2211个和690个(图1b)。本文基于面积加权平均值分析5个气候区和全球湖泊温度效应的时间变化特征。
图1
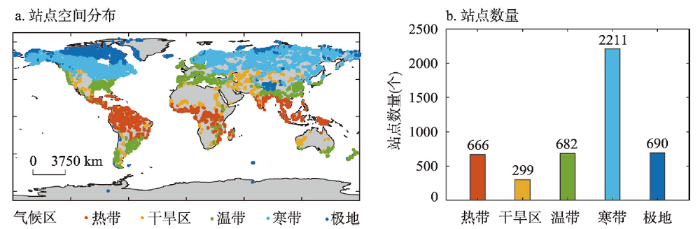
图1
CLM4.5中湖泊—陆地配对站点的空间分布及所属气候区数量
Fig. 1
Information on lake-land pairs in CLM4.5: Map of climate zones and number of lake-land pairs in each climate zone
2.3 表面温度影响因子拆分理论
根据IBPM理论[38],表面温度计算式为:
式中:Ts为表面温度(K);Tb为掺混高度处气温(K);
式中:
式中:K↓为向下短波辐射(W m-2);
式中:
感热较小时,由式(5)计算得到的rt异常偏大,为此剔除了年平均感热通量处于-5 ~5 W m-2之间的数据[41]。
湖泊与邻近陆地同属一个网格点,K↓和L↓相同。湖泊与邻近陆地的表面温度差异(ΔTs)通过公式(1)求导得到。
式中:Δ表示湖泊与邻近陆地之间的物理量的差值,如
本文在线模拟指CLM4.5模拟的同一网格点内湖泊与邻近陆地表面温度的差值,离线拆分指基于CLM4.5输出数据通过公式(6)计算得到的4个生物物理因子贡献项的总和。湖泊表面温度效应时空特征分析及利用公式(6)拆分其影响因子所使用的变量均来自2.1节CLM4.5的模拟输出数据。为了验证式(6)拆分湖泊表面温度效应的有效性,本研究在全球和不同气候区尺度上对CLM4.5在线模拟和IBPM离线拆分得到的ΔTs进行比较。
3 结果分析
3.1 全球湖泊表面温度效应的时间变化特征
3.1.1 季节变化
以北半球为例,5个气候区和半球平均的湖泊表面温度效应的季节变化特征如图2所示。除热带外,其他气候区湖泊与邻近陆地表面温度均呈夏高冬低的单峰型季节变化特征。热带表面温度双峰型季节变化主要与太阳在二分日直射赤道有关。干旱区(图2b)和温带(图2c)湖泊表面温度效应季节变化特征类似,但量值差异明显。在干旱区,湖泊呈现暖季降温、冷季增温的季节特征,在6月降温效应最强(ΔTs = -4.04 K),在11月增温效应明显(ΔTs = 3.20 K)。温带湖泊在3月降温效应最强(ΔTs = -0.38 K),在11月增温效应最强(ΔTs = 3.80 K)。在暖季干旱区和温带湖泊比陆地蒸发强是降温效应的主要原因[1]。寒带(图2d)和北半球(图2f)湖泊表面温度效应均呈单峰型季节变化,在9月增温效应最强(寒带ΔTs = 5.41 K,北半球ΔTs = 4.37 K),最强降温效应分别出现在3月(寒带ΔTs = -1.57 K)和4月(北半球ΔTs = -0.99 K)。寒带湖泊反照率明显低于陆地可能是9月增温效应强的主要原因。热带(图2a)和极地(图2e)湖泊表面温度效应的季节变化与其他气候区明显不同。热带湖泊全年为增温效应,在3月增温效应最弱(ΔTs = 0.25 K),在10月(ΔTs = 3.22 K)增温效应最强。极地湖泊在4月由增温效应转变为降温效应,降温效应在6月最强(ΔTs = -1.62 K),之后迅速转变为增温效应,增温效应在9月最强(ΔTs = 5.03 K),此后维持在1 K左右。
图2
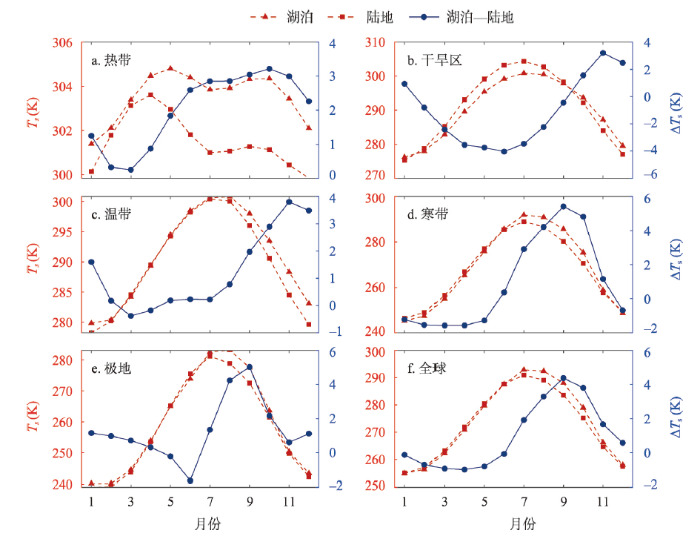
图2
不同气候区和北半球湖泊表面温度、邻近陆地表面温度及两者差异的季节变化
Fig. 2
Seasonal variations in lake and land surface temperature and their difference in different climate zone and in the northern hemisphere
3.1.2 年际变化
图3
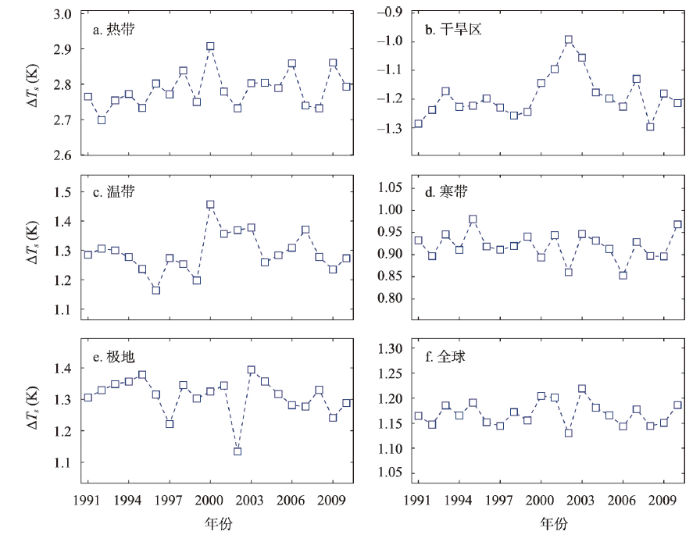
图3
不同气候区和全球湖泊表面温度与邻近陆地表面温度的差异的年际变化
Fig. 3
Interannual variations in lake-land surface temperature difference in different climate zone and in the whole world
3.2 湖泊表面温度效应的空间变化特征
湖泊表面温度效应具有显著的空间变化特征(图4a)。湖泊与邻近陆地的表面温度差值ΔTs在赤道附近最大(ΔTs = 6.0 K),在撒哈拉沙漠周边的干旱区最小(ΔTs = -5.2 K)。温带湖泊表面温度高于邻近陆地数值,但两者差值小于热带结果。寒带部分湖泊表面温度与邻近陆地表面温度接近,两者差值在-0.6~0.6 K之间。高纬度极地湖泊表面温度高于邻近陆地数值,部分地区的ΔTs与温带结果接近。青藏高原湖泊呈现增温和降温效应同在的现象,该现象也出现印度部分地区。从纬向平均(图4c)来看,湖泊与邻近陆地的表面温度差值随纬度增加而降低(图4b)。低纬度湖泊表面温度明显高于邻近陆地,两者差值在赤道附近达到最大(ΔTs = 4.7 K)。在南北纬15°~20°,ΔTs明显下降,甚至出现ΔTs < 0。在南北纬40°附近,ΔTs出现高值,尤其在40°S附近,ΔTs超过2.5 K。综上,绝大部分干旱区湖泊、部分热带湖泊、少数寒带和极地湖泊呈降温效应,其他湖泊以增温效应为主,以热带湖泊的增温效应最为显著。
图4
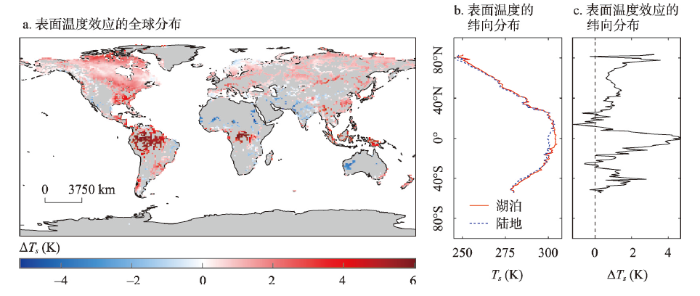
图4
1991—2010年平均的湖泊表面温度与邻近陆地表面温度的差异的全球分布及湖泊和邻近陆地表面温度及两者差值的纬向分布
Fig. 4
Spatial distribution of mean lake-land surface temperature difference, zonal mean of lake and land surface temperature, and their difference in 1991-2010
3.3 全球湖泊表面温度效应的影响因子拆分
3.3.1 IBPM理论拆分结果评估
经感热阈值剔除样本后,针对全球1818个湖泊,逐个计算1991—2010年平均的物理量,依据公式(6)逐个湖泊进行ΔTs的影响因子拆分,5个气候区和全球的CLM4.5在线模拟和IBPM离线拆分得到的ΔTs的对比结果如图5所示。在全球尺度上,IBPM离线拆分值与CLM4.5在线模拟值的散点分布在1∶1线附近,相关系数R = 0.92。分气候区来看,除寒带(R = 0.8)和极地(R = 0.78)外,其他气候区的IBPM离线拆分值与CLM4.5在线模拟值之间的R > 0.9。
图5
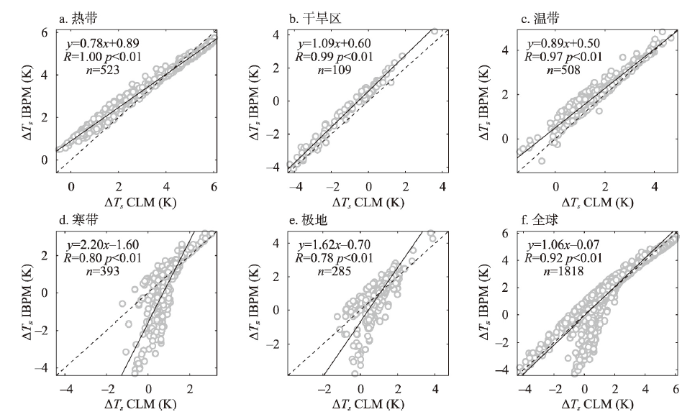
图5
CLM4.5在线模拟与IBPM离线拆分得到的全球湖泊表面温度效应的散点图
Fig. 5
Comparison between ΔTs calculated offline with the Intrinsic Biophysical Mechanism (IBPM) theory and ΔTs simulated online with CLM4.5
3.3.2 生物物理因子对湖泊表面温度效应的贡献
除干旱区(图6b)和寒带(图6d)外,其他气候区的离线计算结果与在线模拟结果之间的绝对误差和相对误差均分别小于0.29 K和20%,拆分效果与城市热岛[39-40]研究相当。湖泊表面温度效应是湖泊与邻近陆地反照率、对流效率、蒸发和热储量差异的综合结果(公式(6)),这些因子对湖面表面温度效应的贡献(面积加权平均值)随气候区而改变(图6)。在热带(图6a)和温带(图6c),对流效率变化为湖泊增温效应的主要正贡献项(热带:ΔT = 6.68±0.07 K,温带:ΔT = 3.61±0.09 K),蒸发变化为主要的负贡献项(热带:ΔT = -3.41±0.04 K,温带:ΔT = -1.91±0.06 K),反照率变化的贡献虽然为正,但量级较小(热带:ΔT = 0.42±0.01 K;温带:ΔT = 0.33±0.01 K),热储量变化的贡献接近于0。对于寒带(图6d)和极地(图6e)湖泊,反照率变化项的正贡献(寒带:ΔT = 2.82±0.18 K;极地:ΔT = 3.91±0.31 K)和热储量变化项的负贡献(寒带:ΔT = -2.71±0.15 K;极地:ΔT = -3.34±0.28 K)量级相当,对流效率变化项和蒸发变化项的贡献较小,且符号相反,量级相当(约为±0.5 K左右)。对于干旱区湖泊,蒸发变化(ΔT = -1.19±0.2 K)为主要的负贡献项,反照率变化(ΔT = 0.46±0.05 K)和对流效率变化(ΔT = 0.27±0.41 K)为主要的正贡献项。在全球尺度上,反照率变化(ΔT = 1.24±0.09 K)和对流效率变化(ΔT = 3.77±0.13 K)为主要的正贡献项,蒸发变化(ΔT = -2.01±0.1 K)和热储量变化(ΔT = -0.89±0.09 K)为主要的负贡献项。
图6
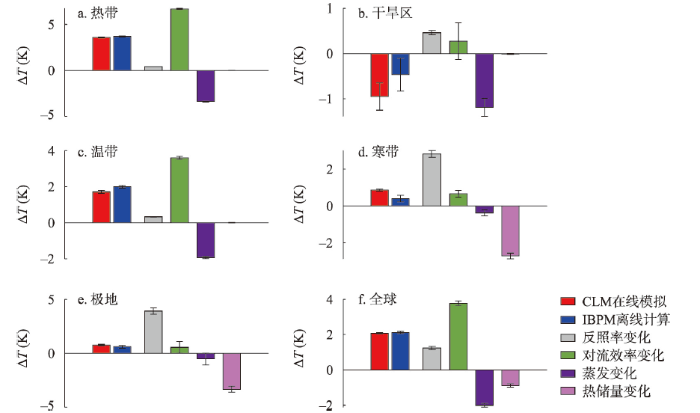
图6
生物物理因子对湖泊表面温度效应的贡献
Fig. 6
Biophysical attributions of lake-land surface temperature difference
4 讨论与结论
4.1 讨论
本文研究发现除干旱区湖泊呈降温效应外,其他气候区的湖泊以增温效应为主,以热带湖泊增温效应最强,这与1997年傅抱璞[1]基于观测数据得到的中国水域温度效应空间格局一致。本文得到的湖泊表面温度效应的季节变化特征与已有的观测和模拟结果类似。1997年傅抱璞[1]发现温带水域冬季的增温效应(0.4~0.8 K)强于夏季(0.3~0.5 K),干旱区水域夏季降温效应可达4.0 K,与本文研究结果接近。2020年陆芊芊等[28]在衡水湖的观测结果证明温带湖泊在春季降温最强(0.7 K),与本文温带湖泊在3月降温效应最强的结果一致(0.4 K)。2015年Thiery等[26]模拟结果显示东非干旱区湖泊最高可使年平均温度降低0.9 K,和本文结果(1.2 K)非常接近。2010年Samuelsson等[7]基于模拟对照实验发现芬兰南部和俄罗斯西部湖泊在秋冬季的增温效应最高可超过1 K,与本文寒带和极地的结果类似。
当前对湖泊温度效应的归因多以统计分析为主,如分析湖泊温度效应与湖泊形态特征(大小、深度)[33]或气象条件[28]之间的相关性,鲜有研究从生物物理角度拆分湖泊温度效应。本文从生物物理过程对湖泊表面温度效应的拆分结果显示,与邻近陆地相比,较低的反照率使湖泊吸收更多的短波辐射[1],引起表面温度升高。在寒带和极地,湖面反照率明显低于被冰雪覆盖的邻近陆地,反照率差异对湖泊表面温度效应的正贡献更明显(图6d、6e)。热带和温带湖泊周围多为茂密的植被,湖泊表面粗糙度明显小于邻近陆地[1],即湖泊表面的对流散热效率较陆地更低[39],不利于湖面与大气之间的感热交换[48],使湖泊表面温度较邻近陆地更高(图6a、6c)。寒带和极地湖泊周边植被较少,粗糙度差异引起的对流散热效率差别对湖泊表面温度效应的贡献小于1 K。除寒带和极地外,其他气候区湖泊较陆地更强的蒸发能消耗更多潜热,降低湖面温度,其量级与对流贡献项相当。在寒带和极地,湖泊冰雪融化消耗潜热[16],使得用于加热湖泊的能量减少,降低了湖面温度,成为该气候区湖泊表面温度效应最主要的负贡献项。热储量变化贡献在热带、干旱区和温带几乎为0,说明在年尺度上,这3个气候区的湖泊和陆地的热储量量级小且无明显年际变化。
湖泊的温度效应与湖泊面积和深度有关[1]。本文研究结果显示面积越大,寒带湖泊增温效应越强(图7d、R = 0.15、p < 0.01),极地湖泊增温效应越弱(图7e、R = -0.12、p < 0.01)。此外热带湖泊(图8a)越深,增温效应越弱(R = -0.14、p < 0.01)。但干旱区(图8b、R = 0.12、p < 0.05)、温带(图8c、R = 0.13、p < 0.01)和寒带(图8d、R = 0.26、p < 0.01)湖泊越深增温效应越强。同样,在全球尺度上,越深的湖泊增温效应越强(图8f、R = 0.05、p < 0.01)。同一气候区内,咸水湖与淡水湖因比热容和蒸发不同,会存在表面温度效应的差异。
图7
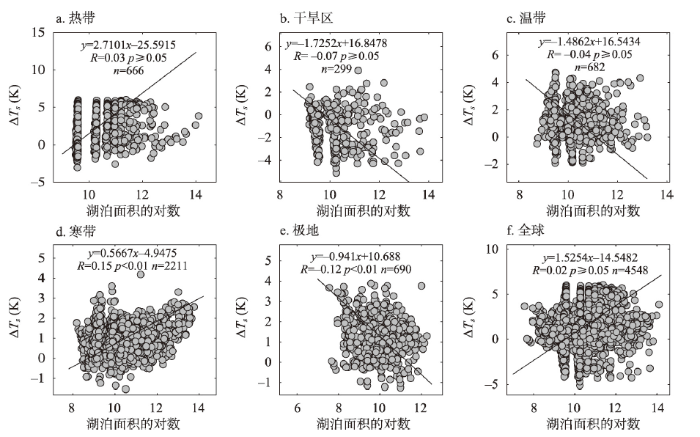
图7
湖泊表面温度效应与湖面面积对数的关系
Fig. 7
Relationships between lake-land surface temperature difference and logarithm of lake area
图8
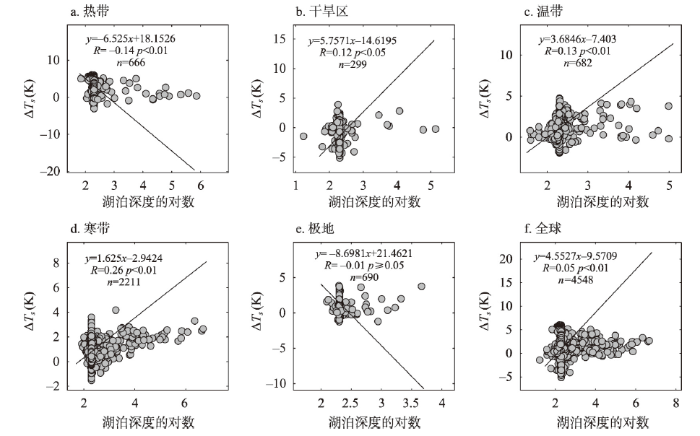
图8
湖泊表面温度效应与湖面深度对数的关系
Fig. 8
Relationships between lake-land surface temperature difference and logarithm of lake depth
与湖泊表面温度效应相比,以湖泊与邻近陆地气温差异表征的湖泊气温效应与人类生活更为密切相关[49]。比如,在城市内建设人工湖或者将城市建在湖泊周边能够有效缓解城市热岛效应[29,37,50 -51]。CLM4.5模拟的湖泊气温效应空间格局(图9)与表面温度效应(图4)相似,但量值更小,尤其是热带和高纬度湖泊,这说明湖泊表面温度效应的生物物理主控因子可能无法直接解释湖泊气温效应。虽然表面温度效应的拆分理论和方法较为成熟[38⇓-40,52],若基于这些方法拆分湖泊气温效应的生物物理因子,需要基于常通量层的假设[53],该假设仅在大气不稳定条件下成立。因此,发展一套适用于湖泊气温效应的生物物理因子拆分方法,将是未来研究的重点。
图9
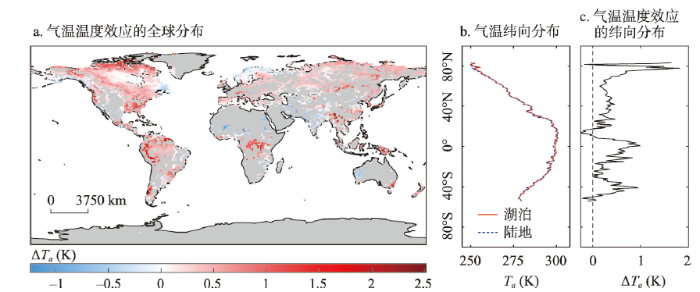
图9
1991—2010年湖泊表面温度与邻近陆地2 m气温的差异的全球分布及湖泊和邻近陆地2 m气温及两者差值的纬向分布
Fig. 9
Spatial distribution of mean lake-land 2 m air temperature difference, zonal mean of lake-land 2 m air temperature and their difference in 1991-2010
4.2 结论
基于耦合CLM4.5的CESM模式模拟的1991—2010年全球气候数据,分析了全球湖泊表面温度效应的时空变化特征,基于IBPM因子拆分理论,量化了反照率、对流效率、蒸发和热储量对其贡献。主要结论如下:
(1)各气候区湖泊表面温度效应的季节变化明显,寒带和北半球均为单峰型季节变化,均在9月出现最强增温效应(寒带ΔTs = 5.41 K,北半球ΔTs = 4.37 K),分别在3月(寒带ΔTs = -1.57 K)和4月(北半球ΔTs = -0.99 K)出现最强降温效应。1991—2010年除干旱区外,其他气候区和全球尺度的湖泊均为增温效应,年际变化都不显著。
(2)湖泊表面温度效应具有显著的空间变化特征,除干旱区湖泊呈降温效应外,其他气候区的湖泊以增温效应为主,其中热带湖泊增温效应最强,单个湖泊和纬向平均的增温效应分别可达6.0 K和4.7 K。
(3)湖泊较邻近陆地更强的蒸发是干旱区湖泊降温效应的主控因子,湖泊较邻近陆地更低的对流散热效率是热带和温带湖泊增温效应的主控因子,反照率差异和冰雪融化消耗潜热是寒带和极地湖泊表面温度效应最主要的正贡献和负贡献。在全球尺度上,反照率变化(ΔT = 1.24±0.09 K)和对流效率变化(ΔT = 3.77±0.13 K)为湖泊增温效应主要的正贡献,蒸发变化(ΔT = -2.01±0.1 K)和热储量变化(ΔT = -0.89±0.09 K)为主要的负贡献。
参考文献
The climatic effects of waters in different natural conditions
DOI:10.11821/xb199703006
[本文引用: 9]

In this paper the climatic effects of waters in different natural conditions are studied according to the theoretical analysis and the observational results of twenty six waters located in various regions in China, the main conclusions are as follows: 1. Deep water has temperature increasing effect in winter and temperature decreasing effect in summer. Shallow water has temperature increasing effect all the year in general, but has temperature decreasing effect in summer in arid regions. 2. In arid regions, the misture of air over water is obviously greater than that over land. In humid regions, the air moisture above waters is generally higher than that above land, but in the rice area the mean relative humidity in all seasons and the mean vapour pressure in summer above water are probably lower than that above rice field. 3. The wind velocity at the height of 2m above water may increase by 20%~100% compared to that over land. On an average it may increase by 50%. The weaker the wind, the larger the increased percentage of the wind speed over water. 4. In the Chinese monsoon region, in general, the summer and annual precipitations in water area and off shore decrease obviously, and the winter precipitation increases somewhat, while it is exactly the reverse at the sites which are far away from waters. In the arid region, however, the precipitations on water and its neighboring area increase all the year. 5. The climatic effects of waters is more obvious when the waters are larger and deeper and the climate is dry.
我国不同自然条件下的水域气候效应
DOI:10.11821/xb199703006
[本文引用: 9]
本文根据我国分布在全国各地的26个湖泊、水库和河流的实际观测资料,结合理论分析,探讨了在不同自然条件下各种水域气候效应的特点和规律,并给出了其对温度、湿度、风速和降水正负影响的大致数值范围。
An improved lake model for climate simulations: Model structure, evaluation, and sensitivity analyses in CESM1
Northern lake impacts on local seasonal climate
DOI:10.1175/JHM591.1 URL [本文引用: 3]
Simulated effects of idealized Laurentian Great Lakes on regional and large-scale climate
DOI:10.1175/1520-0442(1997)010<2847:SEOILG>2.0.CO;2 URL [本文引用: 7]
Estimating late-winter heat flow to the atmosphere from the lake-dominated Alaskan North Slope
DOI:10.1017/S0022143000001817 URL [本文引用: 2]
The role of northern lakes in a regional energy balance
DOI:10.1175/JHM421.1 URL [本文引用: 2]
The impact of lakes on the European climate as simulated by a regional climate model
Radiative forcing over China due to albedo change caused by land cover change during 1990-2010
Land cover change affects surface radiation budget and energy balance by changing surface albedo, and further impact the regional and global climate. In this paper, the high spatial and temporal resolution remote sensing data were used to analyze the driving mechanism for surface albedo change caused by land cover change during 1990-2010. In addition, the annual scale radiative forcing caused by surface albedo changes in national 50 ecological regions were calculated to reveal the biophysical mechanisms of land cover change affecting climate change at regional scale. Results showed that during 1990-2010, the national land cover change were mainly caused by land reclamation, grassland desertification and urbanization, which were all induced by human land-use activities. Grassland and forest area decreased by 0.60% and 0.11%, respectively; while construction land and farmland area increased by 0.60% and 0.19%, respectively. The mean radiative forcing caused by land cover change during 1990-2010 was 0.062 W/m<sup>2</sup> in China, indicating a warming climate effect. However, its spatial heterogeneity was very huge in different ecological regions. Conversion of farmland to construction land, as the main type of land cover change in the Beijing-Tianjin-Tangshan urban and agricultural suburban agro-ecological region, caused an albedo reduction of 0.00456, and the maximum positive radiative forcing was 0.863 W/m<sup>2</sup> with warming climate effect. Conversion of grassland and forest to farmland, as the main type of land cover change for the Sanjiang plain temperate-humid agriculture and wetland ecological region, caused an albedo increase of 0.00152 and the maximum negative radiative forcing was 0.184 W/m<sup>2</sup> with cooling climate effect.
1990—2010年中国土地覆被变化引起反照率改变的辐射强迫
土地覆被变化通过改变地表反照率而影响地表辐射收支与能量平衡,从而对区域和全球气候产生影响。本文利用高时空分辨率遥感数据分析1990-2010 年中国土地覆被变化改变地表反照率的时空驱动机制,并计算全国50 个生态区地表反照率变化导致的年际尺度辐射强迫,揭示土地覆被变化在生态区尺度上影响气候变化的生物地球物理机制。结果表明:1990-2010 年全国土地覆被变化以耕地开垦、草地沙化、城市化等人类土地利用活动导致的土地覆被变化最为明显,全国草地与林地面积分别减少了0.60%和0.11%;建设用地和耕地面积分别增加了0.60%和0.19%。全国土地覆被变化通过改变地表反照率引起的平均辐射强迫为0.062 W/m<sup>2</sup>,表现为增温的气候效应,但在生态区尺度辐射强迫空间差异很大。京津唐城镇与农城郊农业生态区主要土地覆被变化为耕地转为建设用地,引起地表反照率降低了0.00456,产生0.863 W/m<sup>2</sup>的辐射强迫,表现为增温的气候效应;而三江平原温带湿润农业与湿地生态区主要的土地覆被变化为林草地转为耕地,引起地表反照率升高了0.00152,产生-0.184 W/m<sup>2</sup>的辐射强迫,表现为降温的气候效应。
Impact of lake/reservoir expansion and shrinkage on energy and water vapor fluxes in the surrounding area
Response of Tibetan Plateau lakes to climate change: Trends, patterns, and mechanisms
Impact of lakes and wetlands on boreal climate
The response of lake-glacier area change to climate variations in Nam Co basin, central Tibetan plateau, during the last three decades
纳木错流域近30年来湖泊—冰川变化对气候的响应
An offline study of the impact of lakes on the performance of the ECMWF surface scheme
The impact of lake effects on the temporal and spatial distribution of precipitation in the Nam Co basin, Tibetan Plateau
DOI:10.1016/j.quaint.2016.01.075 URL [本文引用: 1]
Lake breezes in the southern Great Lakes region and their influence during BAQS-Met 2007
Global lake evaporation accelerated by changes in surface energy allocation in a warmer climate
DOI:10.1038/s41561-018-0114-8 URL [本文引用: 5]
Variation characteristics of actual evapotranspiration and meteorological elements in the Ebinur Lake basin from 1960 to 2017
DOI:10.11821/dlxb202105010
[本文引用: 1]
Traditional methods for estimating evapotranspiration are mostly based on local scales. For data-scarce basins where ecological hydrology has undergone dramatic changes, a land surface process model that fully considers the spatial variability of the underlying surface of the watershed provides a new method of performing continuous actual evapotranspiration simulations over a long time series and at a large scale. Taking the Ebinur Lake basin as the research area, the variable infiltration capacity (VIC-3L) model was used to simulate the hydrological processes from 1960 to 2017 and explore the spatial and temporal variations in actual evapotranspiration in the study area. Additionally, the wavelet analysis method was used to analyze the multiscale characteristics of the five meteorological elements and the simulated values of actual evapotranspiration in the study area. The following results were obtained: (1) The runoff Nash-Sutcliffe efficiency (NSE) coefficients of the VIC at the Wenquan and Bole stations were 0.09 and 0.23, respectively, and the simulation results were satisfactory. Specifically, the simulated value and theoretical calculated value of the actual evapotranspiration of the VIC had an R2 value of 0.80, an RMSE of 31.76 mm a-1, an NSE of 0.32, and a relatively good simulation effect. (2) Regarding the time scale, the interannual actual evapotranspiration has presented an upward trend over the past 58 years, with the annual average actual evapotranspiration increasing at a rate of 1.03 mm a-1. Furthermore, both monthly and daily evapotranspiration showed a single peak trend. Regarding the interdecadal changes, the actual evapotranspiration from May to July showed a downward trend in the 1990s and in the early 21st century, and an upward trend in the 1970s, while no significant change in tother months. (3) In terms of spatial distribution, the actual evapotranspiration generally showed strong evapotranspiration in high altitude areas and their surroundings. From spring to summer, the area with strong evapotranspiration shifted from the northwest to southeast. The spatial distribution of annual actual evapotranspiration is consistent with that in spring and summer. (4) A wavelet analysis identified 1 to 4 significant periods in the time-frequency domain for the actual evapotranspiration and meteorological elements in the study basin. Over a certain period, the average wind speed, average temperature, and sunshine hours changed ahead of the actual evapotranspiration while the annual precipitation and relative temperature lagged behind the actual evapotranspiration changes. Affected by precipitation, the actual evapotranspiration had a "strong-weak" transition in 1965 and 2003 with a period of 1 a; and affected by relative humidity, the actual evapotranspiration had a "strong-weak" transition in 1965 and 2008 with a period of 2-4.5 a.
1960—2017年艾比湖流域实际蒸散量与气象要素的变化特征
DOI:10.11821/dlxb202105010
[本文引用: 1]
传统估算蒸散发的方法大都基于局地尺度,而在生态水文发生剧烈变化的资料稀缺流域背景下,充分考虑流域下垫面的空间变异性的陆面过程模型为流域长时序、大尺度及连续模拟实际蒸散量提供了新途径。以艾比湖流域为研究区,应用可变下渗能力模型(VIC)模拟1960—2017年艾比湖流域的水文过程,探讨研究区值实际蒸散发量的年、月、日时空变化规律,并运用小波分析方法对5个气象要素及研究区实际蒸散发量的模拟值进行多尺度特征分析,结果表明:① VIC在温泉和博乐的径流纳什效率系数(NSE)分别为0.09和0.23,模拟效果较为满意;VIC实际蒸散量的模拟值与理论计算值,R<sup>2</sup>达0.80,均方根误差(RMSE)为31.76 mm a<sup>-1</sup>,NSE为0.32,模拟效果相对较好;② 时间尺度上,艾比湖流域58 a来年际实际蒸散量呈上升趋势,年均实际蒸散量以1.03 mm a<sup>-1</sup>的速率递增;月值和日值蒸散量均呈单峰趋势;且年代际变化中5—7月的实际蒸散量在20世纪90年代和21世纪呈现下降趋势,20世纪70年呈现上升趋势,而其余月份无明显变化;③ 空间分布上,艾比湖流域内实际蒸散发量总体上呈现高海拔及其附近地区蒸散强烈,从春季到夏季,强蒸散区由西北向东南转移,年实际蒸散量空间分布与春夏季分布一致;④ 艾比湖流域实际蒸散发量与各气象要素在时频域中均存在1~4个显著性周期,且在一定尺度的周期上,平均风速、平均温度以及日照时数超前于实际蒸散量变化,而年降水量和相对湿度滞后于实际蒸散量变化,受降水影响实际蒸散发1965年和2003年发生1 a周期的“强—弱”转换,受相对湿度影响实际蒸散量在1965年和2008年发生2~4.5 a周期的“强—弱”转换。
Simulation of heavy lake-effect snowstorms across the Great Lakes basin by RegCM4: Synoptic climatology and variability
DOI:10.1175/MWR-D-11-00369.1 URL [本文引用: 1]
Coupling of a physically based lake model into the climate forecast system to improve winter climate forecasts for the Great Lakes region
DOI:10.1007/s00382-019-04939-2 URL [本文引用: 1]
On thinning ice: Effects of atmospheric warming, changes in wind speed and rainfall on ice conditions in temperate lakes (Northern Poland)
Impacts of climate and land use/cover changes on runoff in the Hanjiang River basin
DOI:10.11821/dlxb202011003
[本文引用: 1]
As a link between the atmosphere and the geosphere, the hydrological cycle is affected by both climate change and Land Use/Cover Change (LUCC). However, most existing research on runoff response focused mainly on the impact of the projected climate variation, neglecting the influence of future LUCC variability. Therefore, the objective of this study is to examine the co-impacts of both projected climate change and LUCC on runoff generation. Firstly, the future climate scenarios under BCC-CSM1.1 and BNU-ESM are both downscaled and corrected by the Daily Bias Correction (DBC) model. Secondly, the LUCC scenarios are predicted based on the Cellular Automaton-Markov (CA-Markov) model. Finally, the Soil and Water Assessment Tool (SWAT) model is used to simulate the hydrological process under different combinations of climate and LUCC scenarios, with the attempt to quantitatively evaluate the impacts of climate change and LUCC on runoff generation. In this study, the Hanjiang River basin is used as the case study area. The results show that: (1) compared with the base period (1966-2005), the annual rainfall, daily maximum and minimum air temperatures during 2021-2060 will have an increase of 4.0%, 1.8 ℃, 1.6 ℃ in RCP4.5 scenario, respectively, while 3.7%, 2.5 ℃, 2.3 ℃ in RCP8.5 scenario, respectively. (2) During 2010-2050, the area proportions of forest land and construction land in the study area will increase by 2.8% and 1.2%, respectively, while those of farmland and grassland will decrease by 1.5% and 2.5%, respectively. (3) Compared with the single climate change or LUCC scenario, the variation range of future runoff under both climate and LUCC is the largest, and the influence of climate change on future runoff is significantly greater than that of LUCC. This study is helpful to maintain the future water resources planning and management of the Hanjiang River basin under future climate and LUCC scenarios.
气候与土地利用变化对汉江流域径流的影响
DOI:10.11821/dlxb202011003
[本文引用: 1]
作为联结大气圈和地圈的纽带,水文循环同时承受气候变化和土地利用/覆被变化(LUCC)的双重影响,然而大多数的水文响应研究主要关注未来气候变化对径流的影响,忽略了未来LUCC的作用。因此,本文的研究目的是评估未来气候变化和LUCC对径流的共同影响。首先采用2种全球气候模式(BCC-CSM1.1和BNU-ESM)输出,基于DBC降尺度模型得到未来气候变化情景;然后,利用CA-Markov模型预测未来LUCC情景;最后,通过设置不同的气候和LUCC情景组合,采用SWAT模型模拟汉江流域的未来径流过程,定量评估气候变化和LUCC对径流的影响。结果表明:① 未来时期汉江流域的年降水量、日最高、最低气温相较于基准期(1966—2005年),在RCP 4.5和RCP 8.5浓度路径下,分别增加4.0%、1.8 ℃、1.6 ℃和3.7%、2.5 ℃、2.3 ℃;② 2010—2050年间,流域内林地和建设用地的面积占比将分别增加2.8%和1.2%,而耕地和草地面积占比将分别减少1.5%和2.5%;③ 与单一气候变化或LUCC情景相比,气候变化和LUCC共同影响下的径流变化幅度最大,在RCP 4.5和RCP 8.5浓度路径下未来时期年平均径流分别增加5.10%、2.67%,且气候变化对径流的影响显著大于LUCC。本文的研究结果将有助于维护未来气候变化和LUCC共同影响下汉江流域的水资源规划与管理。
Spatial and temporal aspects of the lake effect on the southern shore of Lake Superior
DOI:10.1007/s00704-012-0585-2 URL [本文引用: 2]
Simulations of the influence of lake area on local temperature with the COSMO NWP model
DOI:10.1016/j.atmosres.2014.05.003 URL [本文引用: 2]
Numerical study on the climatic effect of the lake clusters over Tibetan Plateau in summer
DOI:10.1007/s00382-019-04856-4
[本文引用: 2]
The weather research and forecasting model including a one-dimensional thermal diffusion lake model is adopted to investigate the summer climatic effect of the lake clusters over Tibetan Plateau (TP) during 2008-2014 based on two experiments with and without the lakes. Overall, the model can reasonably reproduce the daily variations of lake surface temperature and the spatial patterns of 2 m air temperature (T-2m) and precipitation over TP during summer. Sensitivity results show that the effects of TP lakes on the over-lake T-2m and precipitation exhibit distinctive seasonal and diurnal features and strong space dependence. Generally, the TP lakes tend to cool the local T-2m and enhance the precipitation over the lake and surrounding areas. With the summer advances, the cooling effect of TP lakes weakens while the lake-induced enhancement of precipitation becomes more evident. During daytime, the TP lakes decrease the T-2m and suppress the short-duration (<= 6 h) rainfall in afternoon. However, the TP lakes increase the T-2m and strengthen the convective rainfall over the lake and surrounding areas by simultaneously enhancing both short and long-duration (>6 h) precipitation during nighttime. The lakes over the southeastern central TP (CTP) lead to slight warming and pronounced precipitation increases, while the other lakes in CTP mainly cause significant cooling and suppressed precipitation. Such opposite effects are mainly because the lakes over the western and northeastern CTP hardly produce nighttime warming and the associated circulation changes favorable for the convective precipitation as found over the southeastern CTP, suggesting that the climate effects of TP lakes may be modulated by the lake intrinsic features, local terrain distributions, and background atmospheric circulations.
An investigation of the thermal and energy balance regimes of Great Slave and Great Bear Lakes
DOI:10.1175/2008JHM977.1 URL [本文引用: 1]
The impact of the African Great Lakes on the regional climate
DOI:10.1175/JCLI-D-14-00565.1 URL [本文引用: 4]
Improving the lake scheme within a coupled WRF-lake model in the Laurentian Great Lakes
DOI:10.1002/2016MS000717 URL [本文引用: 2]
Characteristics of micro climate effects of wetlands
湿地小气候效应特征研究
Analysis of cooling effect of water bodies on land surface temperature in nearby region: A case study of Ahmedabad and Chandigarh cities in India
DOI:10.1016/j.ejrs.2018.03.007 URL [本文引用: 3]
Great Salt Lake-effect precipitation: Observed frequency, characteristics, and associated environmental factors
DOI:10.1175/WAF-D-12-00016.1 URL [本文引用: 1]
Thermal environment effect of land surface water bodies in Beijing based on satellite data
DOI:10.18307/2013.0110 URL [本文引用: 1]
基于卫星资料的北京陆表水体的热环境效应分析
Observational study on climate effect of large artificial lake: Taking Miyun Reservoir as an example
DOI:10.13249/j.cnki.sgs.2017.12.018
[本文引用: 1]
There exists lake-land breeze that wind blowing onshore from lake to land during the day and offshore in the evening around lake area, due to differences in air pressure mainly caused by different heat capacities between lake and land. Generally speaking, the closer to the lake, the more remarkable the lake climate effects. For studying the lake climate effects, it is not only important for understanding the characteristics of local climate and atmospheric circulation, but also helpful for analyzing and forecasting meso-and micro-scale weather processes. Miyun Reservoir (MYR), which located at 15 km north of Miyun District of Beijing city, is the largest artificial lake in North China. Up to now, there are seldom reports on the influence of MYR on local weather and climate. Based on hourly observation data obtained by 77 automatic weather stations surrounding MYR from 2011 to 2015, local climate effects of MYR were explored and discussed in the present work. The results showed that: 1) comparing with peripheral plains, climate effects of MYR were characterized by the facts that lower air temperature, higher humidity, slightly weaker wind speed and larger rainfall. As far as regional climate was concerned, the MYR had a modulate effect on the local climate and the spatial extent of the effect is about 10 km. The closer to the MYR, the more notable the MYR climate effects. 2) The MYR climate effects were mainly occurred in the summer, especially for temperature and rainfall. In detail, averaged air temperature was lower of 0.96℃ and averaged rainfall amount was higher of 13.3% in MYR than in the adjacent plains, where has the same elevation with MYR away from 10km. In addition, there were significant differences in diurnal variations of meteorological factors between the south and north regions of the MYR. 3) Excluding the impact of the large-scale background wind field, local wind presented the characteristics of monthly variation, i.e., mountain breeze was dominant from April to September, especially in summer; while in other months, valley breeze was more prevailing, especially in the wintertime. In general, annual averaged local wind speed was about 0.14 m/s in the east-west direction, which was slightly larger than that of 0.10 m/s in the north-south direction around the MYR. 4) In summer, there existed significant differences in wind vectors at the south and north regions of the MYR, due to the influence of local circulation. In most time of the whole day, component anomalies were usually in the same phase, while component anomalies presented out of phase at the south and north regions of the MYR. Lake-land breeze and mountain-valley breeze had the same/opposite directions at the north/south regions of the MYR, and thus these correspondingly formed the overlaying/counteractive effects. Due to lake-land differences in heat capacities and topography effects, lake-land breeze and mountain-valley breeze in the areas around MYR usually existed at the same time, which mainly caused the differences in seasonal and diurnal variations of meteorological elements at different locations around the MYR region.
大型人工湖气候效应观测研究: 以密云水库为例
DOI:10.13249/j.cnki.sgs.2017.12.018
[本文引用: 1]
应用近5 a自动气象站观测资料,分析了华北地区最大人工湖——密云水库的局地气候效应。结果表明:① 密云水库库区相比于附近平原地带具有气温偏低、湿度偏高、风速偏弱、降水量偏大等特点。水库对区域气候的影响范围约在10 km内,离水库越近的地方,受影响越大。② 密云水库的气候效应主要体现在夏半年,尤以气温和降水最为明显。③ 水库南、北两侧受到的局地环流的影响具有明显的差异,库区东西方向的年平均局地风速约为0.14 m/s,南北方向约为 0.10 m/s。下垫面属性的热力差异及特殊地形条件使得密云水库附近同时存在山谷风和湖陆风现象,其叠加效应是导致区域内不同位置间气象要素出现季节性及日变化差异的主要原因。
Lake dynamics and its relationship to climate change on the Tibetan Plateau over the last four decades
DOI:10.1007/s10113-017-1211-8 URL [本文引用: 2]
Diurnal and intra-season variation of warm-season temperature in coastal zone of Qinghai Lake
DOI:10.1007/s00704-019-02893-x URL [本文引用: 1]
Calculating the surface energy balance for lake and reservoir modeling: A review
DOI:10.1029/RG024i003p00625 URL [本文引用: 1]
Different response of surface temperature and air temperature to deforestation in climate models
DOI:10.5194/esd-10-473-2019 URL [本文引用: 1]
Exploratory analysis of the influence of landscape patterns on lake cooling effect in Wuhan, China
Observed increase in local cooling effect of deforestation at higher latitudes
DOI:10.1038/nature10588 URL [本文引用: 3]
Strong contributions of local background climate to urban heat islands
DOI:10.1038/nature13462 URL [本文引用: 5]
Urban heat islands in China enhanced by haze pollution
The urban heat island (UHI), the phenomenon of higher temperatures in urban land than the surrounding rural land, is commonly attributed to changes in biophysical properties of the land surface associated with urbanization. Here we provide evidence for a long-held hypothesis that the biogeochemical effect of urban aerosol or haze pollution is also a contributor to the UHI. Our results are based on satellite observations and urban climate model calculations. We find that a significant factor controlling the nighttime surface UHI across China is the urban-rural difference in the haze pollution level. The average haze contribution to the nighttime surface UHI is 0.7 +/- 0.3 K (mean +/- 1 s.e.) for semi-arid cities, which is stronger than that in the humid climate due to a stronger longwave radiative forcing of coarser aerosols. Mitigation of haze pollution therefore provides a co-benefit of reducing heat stress on urban residents.
Response of surface temperature to afforestation in the Kubuqi Desert, Inner Mongolia
DOI:10.1002/2017JD027522 URL [本文引用: 2]
The community earth system model: A framework for collaborative research
DOI:10.1175/BAMS-D-12-00121.1 URL [本文引用: 1]
The community earth system model version 2 (CESM2)
Technical Description of Version 4.5 of the Community Land Model (CLM)
Development and validation of a global database of lakes, reservoirs and wetlands
DOI:10.1016/j.jhydrol.2004.03.028 URL [本文引用: 1]
Global gridded dataset of lake coverage and lake depth for use in numerical weather prediction and climate modelling
Updated world map of the Köppen-Geiger climate classification
DOI:10.5194/hess-11-1633-2007 URL [本文引用: 1]
Methods to calculate the heat index as an exposure metric in environmental health research
DOI:10.1289/ehp.1206273
PMID:23934704
[本文引用: 1]
Environmental health research employs a variety of metrics to measure heat exposure, both to directly study the health effects of outdoor temperature and to control for temperature in studies of other environmental exposures, including air pollution. To measure heat exposure, environmental health studies often use heat index, which incorporates both air temperature and moisture. However, the method of calculating heat index varies across environmental studies, which could mean that studies using different algorithms to calculate heat index may not be comparable.We investigated 21 separate heat index algorithms found in the literature to determine a) whether different algorithms generate heat index values that are consistent with the theoretical concepts of apparent temperature and b) whether different algorithms generate similar heat index values.Although environmental studies differ in how they calculate heat index values, most studies' heat index algorithms generate values consistent with apparent temperature. Additionally, most different algorithms generate closely correlated heat index values. However, a few algorithms are potentially problematic, especially in certain weather conditions (e.g., very low relative humidity, cold weather). To aid environmental health researchers, we have created open-source software in R to calculate the heat index using the U.S. National Weather Service's algorithm.We identified 21 separate heat index algorithms used in environmental research. Our analysis demonstrated that methods to calculate heat index are inconsistent across studies. Careful choice of a heat index algorithm can help ensure reproducible and consistent environmental health research.
Analysis of microclimate effects of water body in a city
城市中水体的微气候效应研究
Urban heat island (UHI) mitigating strategies: A case-based comparative analysis
DOI:10.1016/j.scs.2015.05.009 URL [本文引用: 1]
Attribution of surface temperature anomalies induced by land use and land cover changes
DOI:10.1002/2017GL073811 URL [本文引用: 1]
Urban heat islands during heat waves: A comparative study between Boston and Phoenix
DOI:10.1175/JAMC-D-20-0132.1 URL [本文引用: 1]
