

1 引言
城市地区多样的经济活动和较高的社会活力使城市极具吸引力,进而驱动了从乡村向城市转型的城市化进程。基于此转型视角,城市化是一个复杂的社会经济过程:表现在土地利用类型上,将原本的裸土、植被、乡村住宅转变为高密度的城市建筑,城市化由此成为地球系统最显著的土地利用变化形式与驱动力;进一步作用在人口分布上,城市化使大量农村人口转移到城市地区,带来显著的人口增长和聚集。据联合国报告,2018年全球已有55%的人口居住在城市地区,与1950年30%的城市人口相比增长显著,且预计在2050年城市人口会达到68%[1]。同时,城市面积仅占全球陆地总面积的3%,却占据了全球60%~80%的能源消耗和75%的碳排放[2],这使得城市化极易导致一系列与人类活动相关的生态环境问题。已有大量研究证明城市发展所引起的物理环境变化与气候变化之间存在不可否认的联系[3-4]。其中,城市热岛(Urban Heat Island, UHI)效应便是城市化导致的最明显的气候变化之一,也是自20世纪以来被广泛调查并记录在案的局地气候变化现象[5-6]。
1833年Luke Howard在伦敦首次观察到了“城市热岛”的气候特征,即城区温度高于周围郊区的现象[7]。UHI效应的产生一方面可归因于城区内密集的人类活动释放了大量人为热,另一方面的原因在于城市的不透水面替代了原有的可渗透裸土、植被、水体等,吸收了更多的太阳辐射、减少了蒸散发、限制了空气流动等[8]。尽管UHI效应不会像台风、暴雨、干旱等气象灾害那样带来强烈的破坏,但其不利影响会长期作用于城市,包括增加能源消耗、降低空气质量、引发物候异常等[9];而当UHI效应与极端高温事件相结合时,将极大地影响城市居民的热舒适度,甚至增大与高温相关的心脑血管疾病、呼吸道感染等疾病发病率和死亡率[10-11]。UHI现象在几乎所有气候类型下各种规模的城市中均有发生,且由于它直接与全球资源环境问题的两大驱动因素(人口增长和气候变化)相关联,近几十年来其研究数量增长十分显著[12],至今已是研究最多的城市气候效应[5]。
目前,UHI效应的监测途径主要包括实地观测、数值模拟和遥感反演。其中,实地观测是最早用于观测UHI现象的途径,包括固定站点上的观测和移动车载装备的观测,也是最传统的研究手段。数值模拟是在实测数据的基础上,以热力学和动力学为理论基础,通过数学物理建模来模拟UHI效应,其优势在于能够在虚拟条件下模拟更复杂多样的情景,不受实测研究中规模和范围的约束;常用的模型包括中尺度天气预报模型(Weather Research and Forecasting Model, WRF)、城市冠层模型(Urban Canopy Model, UCM)和第五代中尺度模型(The Fifth-generation Penn State/NCAR Mesoscale Model, MM5)等大气模型,以及常与中尺度模型结合使用的计算流体力学(Computational Fluid Dynamics, CFD)模型等[10,13 -14]。遥感反演则指基于航空、航天、近地遥感提取地表温度信息的方法,其原理是地物对太阳辐射的不同吸收特征会形成不同波段辐射值,而热红外传感器能够捕捉该辐射特征,进而反演地物温度[15];近年来,由于遥感数据较广的覆盖范围和易获取性,采用遥感反演地表城市热岛(Surface Urban Heat Island, SUHI)的研究数量急剧增长[13,16]。不断发展和完善的监测途径使UHI效应成为城市生态学中最受欢迎的话题之一[16],研究数量的迅速增长不断扩展着UHI效应概念内涵。
当前以UHI效应为研究主题的高引用量综述中,UHI效应的影响因素与缓解措施是受关注最多的话题,既有对具体因素(如路面结构[17]、树木特性[18])影响机理的聚焦分析,也有对UHI效应与多种影响因素关系特征的系统归纳[19-20]。作为关系特征分析的前提,UHI效应的定量刻画却未能成为重点关注内容,仅在少数综述中有所简述。具体而言,Rasul等概述了SUHI量化研究的三大数据源Landsat、MODIS和AVHRR的优缺点,并指出现有研究中用于量化SUHI的城乡温度采用了均值、最值等多种统计方式计算[21]。Kotharkar等统计了所筛选文献中使用的UHI观测和建模方法,包括气象建模法、能量平衡研究法、固定站点观测法等,而使用卫星观测法的研究占比最高[22]。Zhou等将当前量化SUHI的方法分为了以地表温度(Land Surface Temperature, LST)为代理、城市与参考区域温度差值、非参数统计模型3类,并强调了参考区域的不同定义为SUHI的量化结果带来了极大的不确定性[23],促进了研究者对SUHI量化方法的关注;但由于量化方法并非其主要论述内容,该综述未对城市与参考区域温度差值、非参数统计模型大类下的不同方法进一步归纳和详述,也未区分SUHI范围和强度这两种不同量化对象。
同时,Heaviside等强调应对健康风险对UHI效应空间信息提出需求,以准确识别高风险区域[24]。Mohajerani等指出,尽管UHI研究范围越发广泛,但存在实验和分析方法不一致的问题,UHI强度量化方法尚未统一[17]。Li等[25]和Giridharan等[26]也阐明,不同的UHI定义和计算方法给研究结果的准确性带来质疑,使不同研究之间的比较变得困难。除高引用量综述外,新近综述研究对UHI效应定量刻画给予了更多关注:Kim等总结了不同类型UHI对应的数据收集方法、平台或仪器,并指出现有UHI时空变化研究存在测量标准不明确的局限性[10,27];局地气候分区(Local Climate Zones, LCZ)的提出[12],使UHI强度量化更为规范,但江斯达等通过Meta分析指出,即使在LCZ框架下也存在不同的UHI强度计算方法[28]。总体而言,现有综述对UHI量化分析的数据基础和工具进行了较为全面的归纳整理,在UHI相关文献数量激增且研究方法不断更新、研究范围不断扩大的背景下极具价值。然而,尽管多项综述研究均指出不统一的UHI定量刻画方法给UHI量化结果带来了很大不确定性,却尚无综述研究聚焦于UHI效应定量刻画,当前仍缺乏从范围识别和强度表征的角度对UHI定量刻画方法的系统梳理。
UHI范围识别和强度表征方法作为UHI定量刻画的重要步骤,在近年的应用型研究中不断被丰富。例如,Zhou等分别尝试采用与城区相邻[29]和相隔[30]的区域作为乡村背景区域,通过指数衰减模型分析SUHI效应影响范围[31],构建平面模型计算城市群的乡村背景温度[32]。为避免城乡划分的局限性,LST与不透水面面积的线性函数斜率被用于衡量SUHI强度[33]。此外,无需定义缓冲区的简化SUHI算法[34]、用于长时序SUHI量化的动态算法[35]、避开强烈人类活动区的改进等面积算法[36]相继出现。可见,为满足不同研究需求,多种SUHI定量刻画方法已在诸多应用型研究中被提出。鉴于此,本文在厘清UHI效应的相关概念和类型的基础上,针对定量刻画研究中最受关注的SUHI,从范围识别方法和强度表征指标两方面梳理SUHI定量刻画方法体系及其近今进展。基于SUHI效应范围识别和强度表征方法的系统理解,有助于明确SUHI效应研究中不确定性的可能来源,从而为SUHI效应研究领域的进一步丰富与深入奠定坚实基础。
2 城市热岛效应概念内涵
2.1 城市热岛与城市热岛效应
尽管大多数研究并未对“城市热岛”和“城市热岛效应”加以刻意区分,两者的表述重点实则存在差别。为区分二者差异,首先需要回顾城市热岛这一概念的起源。19世纪初,英国化学家、气候学家Howard在对伦敦的气象观察中,首次发现并记录了伦敦市中心气温比周围郊区高的现象,但他当时并未对其命名。“热岛”(Heat Island)一词最早出现在1947年Balchin等的研究中,他们在对英国巴斯(Bath)及其周边区域的气候调查中发现海拔对温度有重要影响,但即使在相近海拔高度下,中心城区的温度也比周边农村地区高;他们将其描述为一个建成区内特有的“热岛”[37]。由于当时UHI现象尚不普遍,其现象和名称在提出后并未受到重视,以至于学术界通常认为“城市热岛”这一术语是1958年由Manley提出。后者在分析伦敦的“人造变暖”是否会影响雪花下落频率时指出,“‘热岛’不可能很深,且大部分降雪可能会在刮风的天气下进行,而那时‘热岛效应’(Heat Island Effect)将会减弱”[38]。因此,可以认为“城市热岛”这一名称最早是在1947年由Balchin等使用;而“城市热岛效应”这一术语才是由Manley在1958年最早提出。二者对比来看,“城市热岛”描述的是城区内因高温呈现的虚拟岛屿,“城市热岛”关注的对象因此更指向城市区域,强调“岛”的存在和形态特征;而“效应”一词原本是指由某种原因所产生的现象、作用或结果,“城市热岛效应”描述的是因城区内高温而呈现的城市与农村的温差现象,关注的是由城市与农村共同构成的整个区域,强调城乡温差所带来的影响或后果。
尽管城市热岛效应这一概念强调了热岛带来的影响,但由于技术条件的限制,早期研究主要关注对城乡热异常的简单观测,即UHI的实证性研究[39]。1969年Oke在研究中强调需要理解UHI形成过程、驱动因素,并指出城市结构、人为热、空气污染等因素可能导致UHI[40]。相近时期,Rao首次在UHI研究中使用了卫星遥感数据[41]。这使得UHI研究数量快速增长,研究内容越发丰富,涵盖了空气温度和地表温度两类观测数据[13]。至今,UHI研究已基本形成了“定量刻画—驱动因素—缓解措施”的研究体系。定量刻画作为UHI效应的分析基础,是UHI效应研究中受关注最久的热点主题。为发展科学普适的UHI效应量化方法,Steward在前人研究基础上提出的LCZ框架克服了城乡二分描述的不足[12],在全球范围得到广泛应用。然而,LCZ框架并不能满足所有UHI效应研究的目的,定量刻画随UHI效应研究主题的逐步丰富而不断面向新挑战。
2.2 地表温度、城市热环境与城市热岛效应
LST是UHI效应和城市热环境研究的重要数据来源。美国国家航空航天局(National Aeronautics and Space Administration, NASA)将LST定义为在地球“表面”某一具体位置上触摸所感受到的温度,这里的“表面”是指从卫星角度透过大气看到的地面,包括冰雪、草地、建筑屋顶等[42]。LST随地表能量平衡的变化而变化,其值是地表辐射和热力学特性的综合结果,整合了地表水分、热导率、地表发射率、来自太阳和大气的辐射、近地表大气等因素的共同影响[43]。作为地表—大气交界面长波辐射、湍流热通量交换的直接驱动力[44],LST反演受到遥感学者的重点关注。同时,LST数据对城市气候的研究也至关重要,可直接用于反映城市热环境特征,如UHI强度。因此,有不少研究直接使用LST代替UHI,分析与其他驱动因素的关联特征,以此研究UHI的时空动态影响机理[19,45 -46]。但必须指出的是,LST与UHI的影响因素并不能完全对等;对LST有负向作用的因素的确具有缓解UHI效应的潜力,但UHI效应强调的是城乡之间温度的差值,从某因素能降低LST到判断该因素是否也能减弱UHI效应,这有赖于该因素是否在城乡之间存在显著差异。
城市热环境是在UHI效应的基础上发展起来的概念,是指与热有关的、能够影响人体热舒适度的物理环境[47],常用于描述城市热环境的基本物理参数包括温度、热辐射、风速及湿度等[48],是气候科学的重要研究领域。城市热环境的核心组成是城市下垫面的地表温度和空气温度,同时受到太阳辐射、大气状况、下垫面状况和人类活动的影响[49]。城市热环境可以是多尺度的,包括城市尺度、街区尺度、建筑尺度、房间尺度及人体尺度,不同尺度上有不同的关注对象[47]。目前,城市尺度上开展的城市热环境研究较多,并以UHI效应为主要关注对象,二者既有联系又有区别。相较而言,城市热环境和UHI效应均可用LST和空气温度来衡量,UHI的产生是城市化过程改变城市热环境的体现[50];但城市热环境关注的是整个研究区温度的高低程度及其影响因素,而UHI效应强调的是研究区域内城市与农村的温度差异。而从相互联系来看,LST、城市热环境和UHI效应的时空演变都受到太阳辐射、大气状况、下垫面状况、人类活动等因素的影响;城市热环境、UHI效应都可以LST为表征指标,UHI效应是城市热环境的一种特征表现[51],城市热环境则是UHI效应的研究载体(图1)。
图1
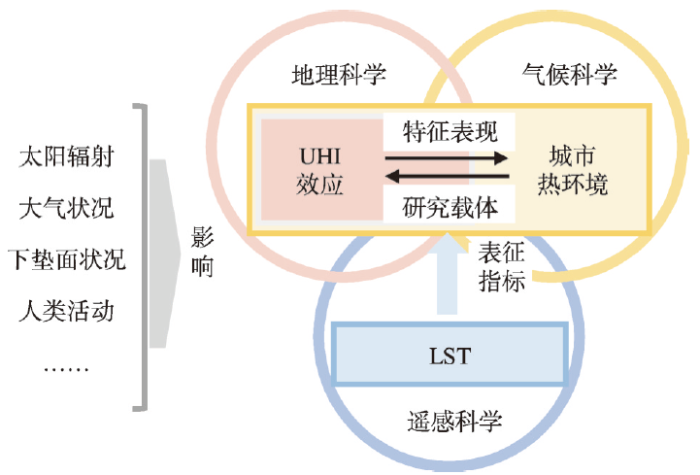
图1
地表温度、城市热环境与城市热岛效应的逻辑关联
Fig. 1
The relationship between land surface temperature, urban thermal environment and urban heat island effect
2.3 城市热岛类型
图2
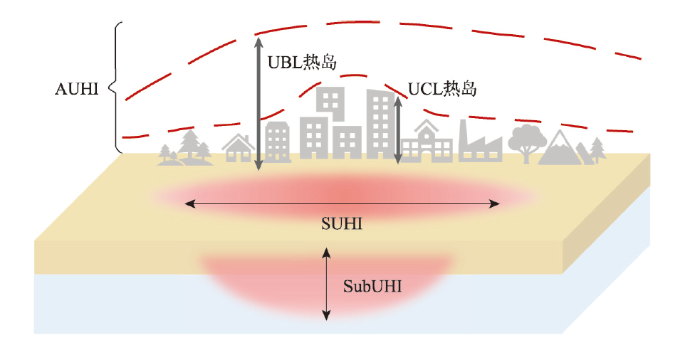
AUHI是以大气温度为数据源测得的热岛,实地观测和数值模拟是其主要研究方法。按城市大气的分层结构,AUHI又可进一步分为城市冠层(Urban Canopy Layer, UCL)热岛和城市边界层(Urban Boundary Layer, UBL)热岛[52](图2)。其中,UCL是指城市地表到建筑屋顶之间的空气层,通常根据连接建筑物屋顶线计算的平均高度来定义。UCL会受到城市内部形态特征的直接影响,适用于研究城区建筑物高度、街区密度等特征对UHI效应的影响。因此,UCL热岛是最常观测到的热岛类型[53],相关研究一般在以建筑、街道为单元的微观、局地尺度上开展,所用气象观测数据多来自固定气象站点、安装在路灯或建筑屋顶但达到标准气象高度的传感器以及移动的车载传感器。UBL是城市冠层之上、行星边界层下层且受城市下垫面影响的大气层,其高度从屋顶一直向上延伸几公里,主要用于解释以单个城市为单元的中尺度或以区域多个城市为单元的宏观尺度UHI[54]。UBL热岛的观测数据一般来自更专业的观测平台,如高塔、无线电探空仪等固定设备或系留气球、飞机装载仪器等移动设备[43]。总体而言,UCL和UBL之间有很强的相互作用,UCL通过加热、冷却和蒸发的方式影响UBL,而UBL又从更大的中尺度气象条件来调控UCL。
相比于AUHI,基于热遥感观测的SUHI研究起步较晚,遥感数据于1972年才被首次应用于UHI研究[13,23]。遥感数据实现了从局地到全球的多空间尺度和昼夜、季节、年际等多时间尺度的SUHI观测,弥补了AUHI观测站点有限、易忽略空间细节的不足。因此,SUHI研究数量在过去30年间增长迅速[23]。与AUHI不同,SUHI不具有实际高度范围,其水平范围则由地表高温区域决定。由于所处海拔高度不同,SUHI和AUHI在观测原理上差异较大,两者不可直接比较。总体来看,SUHI和AUHI的差异及其峰值时间取决于湿度、空气动力学粗糙度、反照率、发射率等城乡地表特性,这些因素会随不同城乡背景而变化,因此很难在SUHI和AUHI之间建立一个简单、普遍的关联关系,现有研究多以经验性关系构建为主[23,55]。
UHI效应主要起源于地表附近,其所产生的城市热通量不仅向上传播到大气中,也会向下传递到地下[56]。若对地下温度进行测量,当靠近居民地或进入到城市,会发现地下热环境将发生显著改变。这种由于人类活动及其引起的城市土地利用变化导致地下出现的大规模热异常,被称为地下城市热岛[57]。地下温度主要由地球内部的热流和地表温度共同驱动,因此理论上SubUHI和SUHI有着紧密联系,但SubUHI的热量是通过地下传导的方式产生,对SUHI和AUHI有重要影响的对流和辐射可能对SubUHI的影响并不显著。相较于SUHI与AUHI,由于缺乏合适的观测传感器网络提供稳定的测量数据,目前SubUHI研究相对较少[23]。
此外,城市群的发展使UHI突破了原有的以单一城市为对象的空间范围,为描述由于城市群的发展而形成的大尺度热岛现象,区域热岛(Regional Heat Island, RHI)这一新概念被提出[58-59]。城市群是高度发达且聚集的城市空间形态,通常由一个以上的特大城市为核心,3个以上的大城市为构成单元在特定区域内共同组成[60]。已有研究证明,UHI效应并不会禁锢于城市的物理边界,即使是郊区或农村地区也可能受到UHI效应的影响[60]。在城市群地区的城市化过程中,大城市间距离越来越小,处于它们之间的农村地区更容易受到城区高温的影响,且相邻城市间热岛的相互作用可能增大热岛强度[61⇓-63]。这种情况下,整个城市群已构成一个紧密相连的热环境。因此,按单一城市的视角来分析城市群的UHI效应已不适用,可能造成对UHI强度的低估。相比于传统的城市热岛研究关注单一城市的局部现象,由相互连接的多个UHI构成的RHI[58],更关注城市群内部城市间UHI效应的交互影响,强调以整体视角来看待城市群产生的UHI聚合效应。
3 地表城市热岛效应定量刻画
3.1 热岛范围识别:影响规模认知
SUHI产生于城区,但其影响范围并不局限于城区的物理边界,识别SUHI实际影响范围是SUHI效应研究中一个重要而基础的问题[62]。SUHI范围识别不仅是测度其面积规模、反映其影响大小、认知其空间形态的基础,而且有利于准确计算SUHI强度,也便于为SUHI效应缓解措施提供空间落位依据。SUHI范围和SUHI强度都是定量刻画SUHI效应的重要参数,但现有研究中前者受到的关注远远少于后者[68],以致较多研究中SUHI只是一个抽象概念,而未能呈现出实际SUHI的空间覆盖范围,忽视了SUHI作为“岛”或“群岛”的空间形态特征[61,69]。SUHI范围识别方法的不统一,必然会影响SUHI效应研究结果间的可比性。此外,缺乏对SUHI范围识别方法的重视,会削弱对SUHI效应影响面积规模、空间形态特征及其对城市发展模式响应方式的深入认知[70]。现有SUHI范围识别研究多以影响规模认知为导向,识别思路大致有两种:一种是在界定城乡范围的基础上,提取一定温度差作为SUHI范围的识别阈值,该思路下的SUHI范围识别方法称为城乡温度阈值法;另一种思路是无需提前区分城乡范围,直接以温度分布特征为基础提取SUHI范围,该思路下的方法包括温度等级阈值法、高斯拟合参数法和温度衰减突变法(图3)。
图3
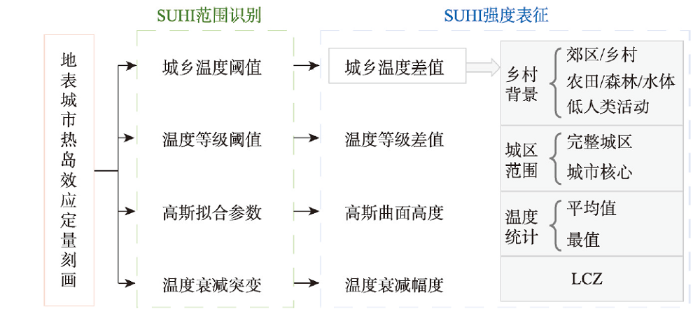
图3
地表城市热岛范围识别方法与强度表征指标
Fig. 3
Range identification methods and intensity indicators of surface urban heat island
城乡温度阈值法是使用最为普遍的热岛范围识别方法。该方法依据SUHI的定义,将城区温度与乡村温度作差,提取差值大于一定阈值的区域识别为SUHI影响范围[58]。例如,Chen等在长三角城市群中选取与市区海拔高度差低于50 m、夜间灯光小于等于15、NDVI大于0.7的所有农田像元,并认为这些像元是受周围城市干扰最小的像元,将这些像元的LST平均值作为乡村背景温度值,高于该背景值2 ℃的区域均认为属于热岛范围[59]。总体而言,城乡温度阈值法简单快捷、便于理解,但存在两个缺点。一是该方法依赖于城乡二分法;在城市扩张迅速的时代,难以准确界定城乡边界,从而不易找到代表乡村的背景温度值;即使采用选取乡村代表性像元的方式替代对整个乡村范围的识别,也存在代表性像元对应土地覆盖类型难以抉择的问题。二是该方法的阈值设定较为主观;对于不同城市或同一城市不同年份,提取阈值是否应当有所差异,如何确保不同阈值下识别的SUHI具有可比性,仍需慎重考量。
相比于城乡温度阈值,温度等级阈值法的优势在于摆脱了城乡用地区分的难题,该方法根据研究区温度的不同等级来识别高温区域,进而将达到一定阈值的高温区域定义为SUHI影响范围。最常见的等级划分是通过对绝对温度或相对温度进行等分,也有研究结合用地类型占比对温度的等级区间进行调整[71]。不过,等级区间间隔和SUHI判定阈值的设定都存在一定主观性。张伟等为避免这一主观性,基于地表温度的空间统计特征,通过热点分析识别高温空间聚集区和低温空间聚集区,并将其分别判定为研究区的热岛和冷岛[62]。该方法的确较为客观,但识别的SUHI可能过于破碎,且未能考虑土地覆被类型和地形条件等因素的影响。Zhang等则以研究区LST的标准差为等级区间间隔,以均值加减若干倍标准差的方法将研究区LST划分为11个等级,并考虑统计稳健性,将LST高于均值加一倍标准差的区域识别为热岛范围,低于均值减一倍标准差的区域识别为冷岛范围[72]。该方法也减少了等级划分和阈值选取的主观性,但对于城乡温差两极分化大的区域,基于标准差的统计方法可能会低估热岛、冷岛范围。
2002年Streutker提出高斯拟合参数法,其原理是在乡村背景平面上将SUHI建模为一个二维高斯曲面,得出曲面的拟合参数以描述SUHI的空间特征。具体而言,首先对典型乡村温度数据进行最小二乘平面拟合,获取高斯拟合方程的常数和线性分量;然后,在研究区温度图像中减去乡村拟合平面,通过最小二乘将剩余温度的自然对数拟合为一个高斯曲面;最后,高斯曲面部分在平面上的投影范围即为SUHI范围,它近似于一个椭圆,从拟合的高斯方程中可提取出椭圆的长、短半轴参数,以反映SUHI的范围特征,也被称为SUHI足迹[73]。Huang等使用高斯拟合参数法计算了亚洲8个特大城市的SUHI空间范围,发现SUHI空间范围与人口规模高度正相关[74]。Quan等进一步在高斯曲面的基础上,将高斯曲面及其对应的椭圆底所构成的高斯体积的几何质心定义为SUHI质心,以综合反映SUHI的强度和空间范围[75]。高斯拟合的方法将整个SUHI量化为一个连续变化的表面,使SUHI的整体空间范围能够被测量,但该方法的缺点在于仅适合单中心城市的SUHI拟合,且拟合得到的椭圆只能反映SUHI的大致范围,不能界定SUHI的准确边界。
温度衰减突变法本质上和温度等级阈值法相似,均根据研究区温度本身的变化特征来划定SUHI范围,但温度衰减突变法更强调寻找城市向乡村过渡中温度衰减的突变点,以反映UHI的温度显著高于周边区域的特征。Zhou等以中国32个主要城市为研究对象,发现绝大多数城市的温度均呈现出随距城区距离增长而衰减的特征,且在这个衰减过程中存在一个“陡崖”,即城乡之间的温度会出现突变点[31]。突变点的发现为UHI范围的识别奠定了基础。Peng等以北京核心城区的质心为起点建立多个同心缓冲区,使用分段线性回归的方法寻找温度衰减过程中的突变点,以区分受SUHI影响显著和不显著的区域,并以该突变点为阈值,识别SUHI的空间范围[69]。Qiao等通过曲线变化率的计算从衰减曲线中识别出一个突变点,该点之后温度不再继续下降,而开始保持平稳态势;将该突变点对应的缓冲区平均温度作为乡村背景参考值,凡是温度大于该值的像元均识别为SUHI影响范围[76]。相较而言,温度衰减突变法根据数据特征获取SUHI的识别阈值,相对更为客观;但缓冲区面积的设定是否会影响提取的阈值结果还有待探讨;此外,在考虑城市是单中心还是多中心的背景下建立若干等面积缓冲区的过程较为繁琐,可能会限制该方法在涉及多城市的大尺度SUHI研究中的适用性。
3.2 热岛强度表征:本质内涵理解
SUHI强度是定量刻画SUHI效应的另一个重要指标。SUHI强度一直是人们关注的焦点,相关研究最早可追溯到20世纪70年代,近年来更为活跃,是目前评估SUHI效应最常用的指标[10]。关注SUHI强度既是对区域高温热浪潜在风险的认知,也是定量分析SUHI效应缓解措施有效性的研究前提。然而,现有研究所采用的SUHI强度表征指标并不相同,多样的表征指标给不同研究或不同城市的SUHI强度对比带来困难。Schwarz等比较了11个最常用的SUHI强度量化指标,尽管这些指标理论上应当量化同一现象,但指标间仅显示出很弱的相关性[77]。Zhou等也发现忽略SUHI足迹的情况下计算的SUHI强度指标可能会造成对SUHI强度的低估[32]。为掌握各指标所衡量的SUHI强度的可能差异,有必要理解不同表征指标的本质内涵[31]。与SUHI范围识别方法相对应,SUHI强度的表征指标也可分为四大类(图3)。
对应于城乡温度阈值的范围识别方法,UHI强度最常用、最普遍的表征指标即为城乡温度差值。早在1973年,Oke即将UHI强度定义为城市最高温度与乡村背景温度的差值[78]。但这使得SUHI强度的计算也面临和SUHI范围识别同样的难题,即如何界定乡村背景。Yao等以中国31个城市为研究对象,对比不同乡村背景的定义方法下SUHI强度差异,指出不同界定方法下计算的SUHI强度会在季节特征、年际变化和空间分异方面带来明确影响[79]。较多研究选取城区外围缓冲区的平均温度作为乡村背景温度,缓冲区以与城区等面积为标准划定[29,80 -81],或以人为设定宽度划定[82]。Zhou等指出选取城市周边郊区而不是距离较远的乡村作为参考位置,能减少各城市特定乡村条件带来的不确定性,如地形、用地类型、水体的存在等[29]。但也有研究认为与城区相邻的缓冲区属于郊区范围,不是真正的乡村地区,因为郊区很可能也在SUHI影响范围之内,使得以郊区为背景温度的方法会低估SUHI强度[30,79]。因此,Peng等对城市建立两大缓冲区,一个代表郊区,另一个离城区更远的缓冲区作为选取背景温度的乡村地区[83];Zhou等在距城区40~45 km远的地方建立缓冲区以供乡村背景温度的计算[30]。对于所选乡村背景的用地类型在不同研究中也有所差异,乡村地区的农田[84-85]、森林[77,84]、水体[85]对应的温度分别都被作为背景参考温度。有研究认为乡村地区不仅可能受其所对应城区的影响,还可能受到相邻城市的影响,这种现象在城市群地区更为突出;尤其是对于经济水平较高的城市群而言,其周边的农村地区可能也存在较为集中的人类活动,从而会产生小范围的UHI;因此,低夜间灯光强度和高植被覆盖度被作为背景像元的选取标准,以尽可能排除人类活动的影响[58-59]。
除了乡村背景选取,城区范围选取和温度统计方式在城乡温度差值这一指标的计算过程中也带来不确定性。在城区范围选取方面,较多研究使用所识别的整个城区范围的温度来计算SUHI强度[29,80 -81],也有研究仅选取城市核心区的若干像素作为城区温度的代表[86-87]。在温度统计方式上,温度的平均值和最大值被用于计算平均SUHI强度和最大SUHI强度[88-89]。此外,与热岛范围识别不同,评估热岛强度无需很多空间细节信息,因此热岛强度研究并不局限于SUHI,也常用于AUHI研究,且AUHI强度评估也多以城乡温度差值为表征指标。计算AUHI强度的基础数据一般是气象站点监测数据,而气象站点所处位置的景观往往难以简单地用“城市”和“乡村”来区分,因为从城市到乡村实则是一个连续、动态的景观变化过程[12]。Stewart对190项UHI研究进行了方法质量评估,指出3/4的研究未能描述监测站点实地特征[90]。Ramakreshnan等也指出许多研究所计算的UHI强度是源自模糊分类的站点,严重影响了UHI强度的准确评估[65]。为解决这一问题,Stewart等开发的LCZ分类系统,根据地表覆盖、地表结构、地表材质和人类活动等方面的差异,将城乡下垫面划分为了17种类型,使UHI强度可表征为两个LCZ间的温差[12]。尽管LCZ源起于AUHI研究,但目前使用LCZ的SUHI研究也迅速增长[28]。
温度等级差值是对基于温度等级阈值提取的SUHI的强度表征指标,其计算不完全依赖于城乡温度的区分,而是根据研究区温度的相对大小、等级来计算。例如,Ramakreshnan等使用研究区最高温度与平均温度的差值表征SUHI强度[88];Xu等将研究区温度划分为5个等级,计算各温度等级与郊区平均温度的差值,并乘以各温度等级面积占比,作为面积加权的SUHI强度[91]。用于拟合SUHI的高斯曲面的高度也被用于表征SUHI强度[73⇓-75,92],该高度代表曲面最高点到乡村背景平面的距离,本质上也是最高温度与乡村平均温度的差值。在使用温度衰减突变方法识别SUHI范围的过程中,所找到的突变点对应温度不仅是SUHI范围的提取阈值,也是计算SUHI强度的背景参考值,衰减曲线的最大值与该背景值的差值被用于反映最大SUHI强度[76],其本质是温度衰减的幅度。
4 地表城市热岛效应定量刻画研究展望
本文辨析了UHI效应及其相关易混淆概念,从范围识别和强度表征两个方面梳理了SUHI效应的定量刻画方法,分析了各方法的优点和缺点。定量刻画作为SUHI效应研究的重要基础,未来研究应进一步整合多源SUHI监测途径、发展大尺度SUHI定量刻画方法、认知趋于连通化的SUHI空间形态,拓展SUHI效应定量刻画研究的维度、广度和深度(图4)。
图4
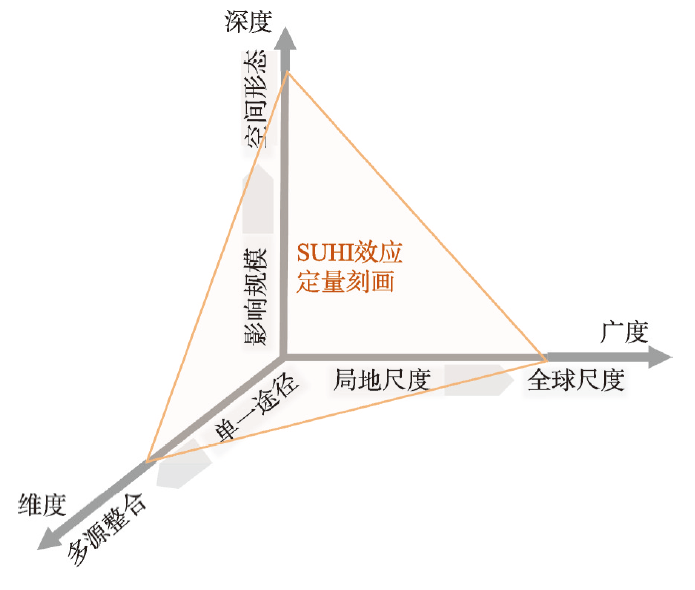
图4
地表城市热岛效应定量刻画未来研究方向
Fig. 4
Research prospects of the quantitative characterization of surface urban heat island effect
4.1 整合维度:突破单一SUHI监测途径
实地观测、数值模拟、遥感反演共同构成UHI效应的多源监测途径,但各途径均存在一定局限性。具体而言,实地观测数据可信度高,但有限的观测站点使其无法捕捉精细的空间信息,难以全面描述城市地域的热环境特征。数值模拟方法可高效获得高空间分辨率结果,且能反映UHI环流的动力学特征,但模型模拟一般基于一系列理想假设条件,可能会忽略实际应用中的复杂场景,不能完全替代现实的观测过程。遥感反演数据覆盖范围广,但由于城市内部密集立体建筑的遮挡[93],部分城市表面无法被卫星传感器探测,且云层覆盖[36]以及当前LST遥感数据的时空权衡[94]也构成了监测限制。因此,实地观测数据、数值模拟结果、遥感反演图像都只提供了对实际UHI效应的片面描述[13]。遥感数据的易获取性使SUHI效应研究越发受青睐,而实地观测与数值模拟依然主要应用于AUHI研究,造成SUHI研究对另两种监测途径以及对多源监测途径整合研究的关注相对不足,使源于不同监测途径的研究结果间形成无形壁垒。突破这一壁垒,整合多维度监测途径,集成多源数据,既有利于提高SUHI效应监测数据精度,也便于获取更多互补性数据信息以实现研究的进一步完善与深化(图5)。
图5

图5
地表城市热岛效应多源监测途径整合
Fig. 5
Integration of multi-source monitoring methods for surface urban heat island effect
具体而言,近年来SUHI效应量化研究对遥感技术的需求不断增加,但实地观测作为研究基础同样重要,遥感反演结果和数值模拟结果都依赖于实地观测数据验证其结果有效性,且实地观测还为数值模拟提供模型输入参数[88,95]。同时,实地观测与数值模拟或遥感反演整合,既能呈现SUHI效应大范围的空间特征,也能更可靠地解析重点区域精细尺度的细节变化。遥感反演结果和实地观测数据也有助于参数化、改进和评估数值模拟结果,而数值模拟具有为遥感反演结果提供热力学机理解释的潜力。如,Zhao等将MODIS遥感数据结合气候模型CESM(Community Earth System Model)模拟结果,计算SUHI强度的同时进行地表能量平衡分析,实现对SUHI效应的热力学定量归因[87];Li等通过耦合的城市冠层模型UCM和土地模型LM3(Land Model),分析了不同归因方法下SUHI效应主导因素的差异[96]。数值模拟与遥感反演相结合的热力学过程解析正在成为SUHI效应研究的新趋势[97-98],因此两种监测途径的整合在SUHI效应定量刻画中将越发普遍。
4.2 拓宽广度:发展大尺度SUHI定量刻画
SUHI效应存在于多个尺度,但现有研究对不同尺度的关注并不均衡。Zhou等通过文献计量发现局地尺度UHI效应受到的关注最多,相比之下区域和全球尺度UHI效应的相关研究较少[23];Yu等也指出大多数研究都集中在单个城市或大城市内的局地尺度上,对大尺度UHI效应的时空模式和特征知之甚少[58]。一些关于大尺度UHI效应的关键问题仍未解决,例如,局地、区域、全球尺度UHI效应的主导因素有何差异[23]?全球气候变化与不同城市UHI效应之间是否具有协同效应,潜在协同效应的驱动机制是什么[10]?UHI效应在大尺度上的分异规律尚未厘清,不利于相同缓解策略在不同城市背景下的有效外推。鉴于遥感数据广泛的空间覆盖范围,在3种UHI类型中,SUHI无疑最适于开展大尺度分析。
探究SUHI大尺度分异规律的关键基础是准确的定量刻画方法,以控制方法学上的系统误差,关注内部因素带来的分异规律。城乡温度差值作为SUHI强度的核心表征指标,是目前在大尺度SUHI效应研究中使用最多的定量刻画方法。已有大尺度研究多基于建立缓冲区的方式提取乡村或郊区温度,但缓冲区位置的选择和宽度的设置应当根据城市环境特征确定。首先,缓冲区不应离城市核心建成区过近,以避免处于SUHI效应实际影响范围;其次,缓冲区若离城市核心建成区过远,气象条件的差异、邻近大型水体与否等环境条件也会给SUHI效应定量刻画结果带来干扰[34];此外,缓冲区内还需考虑地形条件、土地覆被类型等因素的影响;同时,城市群的发展所带来的相邻城市的影响则进一步增加了环境复杂性。因此,在大尺度SUHI效应的定量刻画中,很难确定一个对大尺度下所有城市都合理的固定缓冲区位置和宽度。不同缓冲区范围给SUHI效应量化带来的不可比性和不确定性已被频频指出[36,99],而将固定缓冲区简单应用于具有不同地理和社会经济特征的城市也被认为有失公允[100-101],两者的权衡对发展合理的大尺度SUHI定量刻画方法提出迫切需求。未来研究中,探索如何在综合考虑城市SUHI实际影响范围、城乡气象差异、地形差异等环境特征条件的情况下优选缓冲区位置和宽度,并开发根据城市环境特征自动确立缓冲区位置和宽度的新算法,是完善大尺度SUHI定量刻画方法的重要途径。
4.3 挖掘深度:认知连通化SUHI空间形态
SUHI的强度和范围作为定量刻画SUHI效应的两个主要因素,范围特征受到的关注远不及强度特征;而现有的SUHI范围识别研究,也多以认知SUHI影响规模为导向,使用SUHI面积来衡量SUHI影响规模,缺乏对SUHI空间形态的定量识别,忽视SUHI空间形态变化及其可能带来的影响。已有研究发现SUHI强度会被城市要素(如不透水面)的空间连续性所放大,即城市要素发展的空间连通性是影响SUHI效应大小的关键因素[102],但该研究未能直接对SUHI的形态特征进行量化,也未能直接关注SUHI的空间连通性。也有研究将SUHI视为一种热力景观,一系列景观指标被用来表征SUHI的空间属性,但多个SUHI间的连通性等空间特征往往被忽视[69,103]。
城市扩张过程中SUHI的空间形态必然会发生变化[70],尤其是在城市群地区,城市间联系日益紧密,相邻城市的SUHI会随之连通化[63]。SUHI在空间形态上的连通会影响热量流动路径的改变,空间连通的SUHI之间,热量流动会更为容易。因此,SUHI空间连通性增强,会扩大SUHI影响范围;在SUHI强度方面,对原本较大的SUHI而言可能会疏散热压力,但对原本小型SUHI而言会增强SUHI强度。总之,SUHI的空间连通性是影响区域内部温度空间分布规律、区域平均温度变化的重要因素。基于SUHI的连通化空间特征,寻找缓解SUHI效应的关键节点,是应对城市化增强SUHI效应的有效策略[104-105]。未来研究应重视SUHI范围识别,关注SUHI空间形态的定量刻画;从过去关注局地SUHI强度的斑块视角向关注区域SUHI群岛的景观视角转换,强调SUHI群岛空间演化过程中连通性变化,挖掘SUHI间的交互影响。此外,通过数值建模方法模拟SUHI连通性变化所引起的热量流动、扩散、聚集过程,为深入解析连通化SUHI空间形态对SUHI强度的影响提供了可行途径,进而为城市SUHI效应的监测、预测与防范提供科学依据。
5 结论
理解SUHI效应定量刻画的主要方法与核心指标是准确、深入研究SUHI效应的前提条件。SUHI效应越发多样的研究需求,促使多种SUHI定量刻画方法在应用型研究中被提出,有必要开展综述研究对其系统梳理。已有综述指出了基础数据与采集方法给SUHI量化结果带来的不确定性,但对SUHI范围识别和强度表征方法关注不足。本文在梳理UHI效应概念内涵的基础上,总结SUHI范围识别方法的优缺点,认知强度表征指标的本质内涵,并指出定量刻画研究的维度、广度和深度三维发展方向。本文致力于弥补SUHI效应综述研究中对定量刻画方法缺乏系统梳理的不足,有助于未来在热岛效应的适应与缓解研究中选择更为合适的量化方法。但需要指出的是,SUHI概念本身是一个不断演化的过程,随着气候、地理、遥感科学的快速发展,SUHI从最初的城乡观测温度的简单差值,发展为具有时空属性的复杂抽象对象,既存在昼夜循环、季节演替等时间序列演变,又含有形态范围、内部异质性等空间位置特征;同时,SUHI效应研究主题也在不断丰富,从理解和量化SUHI向寻找驱动归因和缓解措施扩展,近年来更转向关注公共健康影响;在这一背景下,对SUHI的理解和定义随之不断更新和发展,需要综合考虑时空属性、更新概念内涵、紧跟目标需求,探讨SUHI效应的精细刻画。
参考文献
Goal 11: Make cities inclusive, safe, resilient and sustainable
Urbanization and the thermal environment of Chinese and US-American cities
DOI:10.1016/j.scitotenv.2017.02.148 URL [本文引用: 1]
Projecting population growth as a dynamic measure of regional urban warming
DOI:10.1016/j.scs.2017.04.010 URL [本文引用: 1]
An evidence-based review of impacts, strategies and tools to mitigate urban heat islands
Facing the urban overheating: Recent developments. Mitigation potential and sensitivity of the main technologies
Urban heat island research in Phoenix, Arizona: Theoretical contributions and policy applications
DOI:10.1175/BAMS-D-11-00011.1 URL [本文引用: 1]
Simulation of surface urban heat islands under "ideal" conditions at night part 2: Diagnosis of causation
DOI:10.1007/BF00119211 URL [本文引用: 1]
A review of the eco-environmental consequences of urban heat islands
城市热岛的生态环境效应
Urban heat island (UHI) intensity and magnitude estimations: A systematic literature review
Climate change impacts on extreme temperature mortality in select metropolitan areas in the United States
DOI:10.1007/s10584-014-1154-8 URL [本文引用: 1]
Local climate zones for urban temperature studies
DOI:10.1175/BAMS-D-11-00019.1 URL [本文引用: 5]
A bibliometric review of past trends and future prospects in urban heat island research from 1990 to 2017
DOI:10.1139/er-2018-0029 URL [本文引用: 6]
Recent advances in understanding urban heat island effects with some future prospects
城市热岛效应的研究进展与展望
Progress of urban heat island effect
城市热岛效应研究进展
Using big data analytics to synthesize research domains and identify emerging fields in urban climatology
The urban heat island effect, its causes, and mitigation, with reference to the thermal properties of asphalt concrete
DOI:S0301-4797(17)30320-1
PMID:28412623
[本文引用: 2]

The Urban Heat Island (UHI) is a phenomenon that affects many millions of people worldwide. The higher temperatures experienced in urban areas compared to the surrounding countryside has enormous consequences for the health and wellbeing of people living in cities. The increased use of manmade materials and increased anthropogenic heat production are the main causes of the UHI. This has led to the understanding that increased urbanisation is the primary cause of the urban heat island. The UHI effect also leads to increased energy needs that further contribute to the heating of our urban landscape, and the associated environmental and public health consequences. Pavements and roofs dominate the urban surface exposed to solar irradiation. This review article outlines the contribution that pavements make to the UHI effect and analyses localized and citywide mitigation strategies against the UHI. Asphalt Concrete (AC) is one of the most common pavement surfacing materials and is a significant contributor to the UHI. Densely graded AC has low albedo and high volumetric heat capacity, which results in surface temperatures reaching upwards of 60 °C on hot summer days. Cooling the surface of a pavement by utilizing cool pavements has been a consistent theme in recent literature. Cool pavements can be reflective or evaporative. However, the urban geometry and local atmospheric conditions should dictate whether or not these mitigation strategies should be used. Otherwise both of these pavements can actually increase the UHI effect. Increasing the prevalence of green spaces through the installation of street trees, city parks and rooftop gardens has consistently demonstrated a reduction in the UHI effect. Green spaces also increase the cooling effect derived from water and wind sources. This literature review demonstrates that UHI mitigation techniques are best used in combination with each other. As a result of the study, it was concluded that the current mitigation measures need development to make them relevant to various climates and throughout the year. There are also many possible sources of future study, and alternative measures for mitigation have been described, thereby providing scope for future research and development following this review.Copyright © 2017 Elsevier Ltd. All rights reserved.
Traits of trees for cooling urban heat islands: A meta-analysis
Urban heat island effect: A systematic review of spatio-temporal factors, data, methods, and mitigation measures
DOI:10.1016/j.jag.2017.12.009 URL [本文引用: 2]
Relationship between urban heat island and landscape patterns: From city size and landscape composition to spatial configuration
城市热岛效应与景观格局的关联: 从城市规模、景观组分到空间构型
A review on remote sensing of urban heat and cool islands
Urban heat island studies in South Asia: A critical review
DOI:10.1016/j.uclim.2017.12.006 URL [本文引用: 1]
Satellite remote sensing of surface urban heat islands: Progress, challenges, and perspectives
The urban heat island: Implications for health in a changing environment
DOI:10.1007/s40572-017-0150-3
PMID:28695487
[本文引用: 1]
The Urban Heat Island (UHI) is a well-studied phenomenon, whereby urban areas are generally warmer than surrounding suburban and rural areas. The most direct effect on health from the UHI is due to heat risk, which is exacerbated in urban areas, particularly during heat waves. However, there may be health benefits from warming during colder months. This review highlights recent attempts to quantitatively estimate the health impacts of the UHI and estimations of the health benefits of UHI mitigation measures.Climate change, increasing urbanisation and an ageing population in much of the world, is likely to increase the risks to health from the UHI, particularly from heat exposure. Studies have shown increased health risks in urban populations compared with rural or suburban populations in hot weather and a disproportionate impact on more vulnerable social groups. Estimations of the impacts of various mitigation techniques suggest that a range of measures could reduce health impacts from heat and bring other benefits to health and wellbeing. The impact of the UHI on heat-related health is significant, although often overlooked, particularly when considering future impacts associated with climate change. Multiple factors should be considered when designing mitigation measures in urban environments in order to maximise health benefits and avoid unintended negative effects.
Urban heat island impacts on building energy consumption: A review of approaches and findings
DOI:10.1016/j.energy.2019.02.183 URL [本文引用: 1]
The impact of urban compactness, comfort strategies and energy consumption on tropical urban heat island intensity: A review
DOI:10.1016/j.scs.2018.01.024 URL [本文引用: 1]
Urban heat island (UHI) variations within a city boundary: A systematic literature review
Urban heat island studies based on local climate zones: A systematic overview
DOI:10.11821/dlxb202009004
[本文引用: 2]
Since 2012, urban heat islands (UHIs) over various cities have been re-investigated under the local climate zones (LCZ) concept. However, a systematic overview of the recent progress in terms of the LCZ-based UHI studies remains lacking. This status quo has considerably restrained the UHI studies across global cities in a more standard manner. Here we comprehensively reviewed the preceding LCZ-based UHI studies with statistical- and meta-analysis. The literature review indicates that LCZ-based UHIs have been conducted over more than 130 cities globally, mostly located in the middle latitudes (35°N-55°N) within Asia and Europe. These investigations focus either on the canopy layer UHI (represented by surface air temperature, SAT) or on the surface layer UHI (denoted by land surface temperature, LST) or both. The overview was conducted mainly from three aspects including the "data acquisition", "spatiotemporal pattern", and "associated control". Our further findings show that: (1) On "data acquisition", satellite thermal remote sensing is the most important technique for retrieving LST, with the percentage of studies that employ this technique accounting for 86.5%. But for SAT, the main approaches include measurements by fixed stations (42.5%) and mobile vehicles (19.2%) as well as simulations by models (38.3%), among which the approach by model simulation has received more attention; (2) On "spatiotemporal pattern", the mean difference between the maximum and minimum temperatures among various LCZs for SAT (3.1 K) is significantly lower than that for LST (9.8 K), with relatively high magnitudes in summer and winter compared with the other seasons for these two types of temperatures.Prominent "intra-LCZ heat islands" were observed for both the canopy and surface UHIs; (3) On "associated controls", most studies are still qualitative on the analysis of the relationships between LCZ-based UHIs and their controls (e.g., surface structure and fabric, land cover type, and human activity). Other potential controls such as building typology and adjacency among LCZ types remain less considered. We finally provided several prospects for the LCZ-based UHI studies. We hope this overview would be helpful for improving the understanding of the current progress and upcoming prospects for the LCZ-based UHI studies.
局地气候分区框架下城市热岛时空分异特征研究进展
DOI:10.11821/dlxb202009004
[本文引用: 2]
局地气候分区(LCZ)框架自2012年提出以来,在城市热岛研究领域备受重视,但目前对LCZ框架下城市热岛(简称LCZ城市热岛)时空分异特征仍缺乏系统性总结。本文以统计和“荟萃分析”为手段,系统梳理了2012—2019年LCZ城市热岛研究在数据获取手段、时空格局和影响因素3个方面的进展,并对今后研究进行了初步展望。结果表明,迄今为止全球范围内已在超过130座城市开展了LCZ城市热岛研究,这些城市主要集中于中纬度(35°N~55°N)的亚洲和欧洲地区,且主要聚焦于以近地表气温表征的“冠层热岛”和以地表温度表征的“地表热岛”。具体而言:① 在温度数据获取方面,站点观测(文献数量占比42.5%)、模型模拟(38.3%)与移动测量(19.2%)是获取气温的主要方法,其中模型模拟方法占比逐年升高。而卫星热红外遥感是获取地表温度的主要手段(86.5%)。② 在时空格局方面,就全球而言,LCZ气温的类间极值差(均值为3.1 K)显著低于地表温度的类间极值差(9.8 K),且该极值差通常在夏季或冬季较大;冠层热岛与地表热岛均存在显著的“LCZ类内热岛”现象。③ 在影响因素方面,多数研究局限于定性分析地表结构、覆盖、材质和人类活动的影响,而普遍忽略了建筑布局与邻近LCZ类型等潜在因素的作用。本文将有利于从整体上更好地把握LCZ城市热岛的研究进展与今后的发展趋势。
Surface urban heat island in China's 32 major cities: Spatial patterns and drivers
DOI:10.1016/j.rse.2014.05.017 URL [本文引用: 5]
Climate-vegetation control on the diurnal and seasonal variations of surface urban heat islands in China
The footprint of urban heat island effect in China
Remote sensing of the urban heat island effect in a highly populated urban agglomeration area in East China
A new method to quantify surface urban heat island intensity
DOI:10.1016/j.scitotenv.2017.11.360 URL [本文引用: 1]
A simplified urban-extent algorithm to characterize surface urban heat islands on a global scale and examine vegetation control on their spatiotemporal variability
DOI:10.1016/j.jag.2018.09.015 URL [本文引用: 2]
Spatiotemporal pattern and long-term trend of global surface urban heat islands characterized by dynamic urban-extent method and MODIS data
DOI:10.1016/j.isprsjprs.2021.11.017 URL [本文引用: 1]
Uncertainty of city-based urban heat island intensity across 1112 global cities: Background reference and cloud coverage
A micro-climatological investigation of bath and the surrounding district
DOI:10.1002/qj.49707331706 URL [本文引用: 1]
On the frequency of snowfall in metropolitan England
DOI:10.1002/qj.49708435910 URL [本文引用: 1]
Urbanization impact on regional climate and extreme weather: Current understanding, uncertainties, and future research directions
DOI:10.1007/s00376-021-1371-9 URL [本文引用: 1]
Towards a more rational understanding of the urban heat island
Remote sensing of urban heat islands from an environmental satellite
Thermal remote sensing of urban climates
DOI:10.1016/S0034-4257(03)00079-8 URL [本文引用: 3]
Satellite-derived land surface temperature: Current status and perspectives
DOI:10.1016/j.rse.2012.12.008 URL [本文引用: 1]
Effects of landscape composition and pattern on land surface temperature: An urban heat island study in the megacities of Southeast Asia
DOI:10.1016/j.scitotenv.2016.10.195 URL [本文引用: 1]
Urban heat islands and landscape heterogeneity: Linking spatiotemporal variations in surface temperatures to land-cover and socioeconomic patterns
DOI:10.1007/s10980-009-9402-4 URL [本文引用: 1]
Research progress and development trend of quantitative assessment techniques for urban thermal environment
城市热环境定量评价技术研究进展及发展趋势
A review of mitigating strategies to improve the thermal environment and thermal comfort in urban outdoor spaces
DOI:10.1016/j.scitotenv.2019.01.062 URL [本文引用: 1]
Research progress on the thermal environment of the urban surfaces
城市地表热环境研究进展
Urban thermal environment dynamics and associated landscape pattern factors: A case study in the Beijing metropolitan region
DOI:10.1016/j.rse.2015.11.027 URL [本文引用: 1]
Thermal environment of urban area and the improvement of its micro-thermal environment
城市热环境及其微热环境的改善
The heat island of the urban boundary layer: Characteristics, causes and effects
//Jack E C, Alan G D, Erich J P, et al. Wind Climate in Cities.
Addressing the urban heat islands effect: A cross-country assessment of the role of green infrastructure
The impact of urban areas on weather
DOI:10.1256/qj.05.199 URL [本文引用: 1]
Satellite air temperature estimation for monitoring the canopy layer heat island of Milan
DOI:10.1016/j.rse.2012.08.025 URL [本文引用: 1]
Urban heat island in the subsurface
The geothermal potential of cities
DOI:10.1016/j.rser.2019.02.019
[本文引用: 1]
What is the heat beneath our feet? There is a growing interest in the geothermal resources available at shallow depth beneath cities. However, there exists no general procedure for quantifying the low-temperature geothermal potential in urban ground and groundwater. This review categorizes previous work based on different definitions of the geothermal potential and compares the different assessment methods used. It is demonstrated that the theoretical potential of the available heat at a shallow depth is enormous, especially when not only the heat in place, but also compensating heat fluxes are considered. The technical potential describes the extractable heat by a specific technology. The methods to evaluate the extractable heat are manifold, including the use of technical performance standards, analytical and numerical simulation tools and mathematical regression procedures. These are different for groundwater well based open-loop systems and heat-exchanger-based closed loop systems, and the results depend on variable local factors, the density of systems applied and whether heat and/or cold is utilized. We contrast the published findings based on the power density and the relative contribution to the demand of a city. The broad span of the results highlights the need for a more consistent framework that distinguishes between the conceptual assumptions for calculating the technical geothermal potential and the local city-specific factors. This will be the basis for a reliable analysis of the economic geothermal potential of low-temperature geothermal applications on a local, district or city scale. This will also enhance the reliability and the trust in these technologies, and thus the public acceptance reflected in the acceptable geothermal potential.
Spatiotemporal patterns and characteristics of remotely sensed region heat islands during the rapid urbanization (1995-2015) of Southern China
DOI:10.1016/j.scitotenv.2019.04.088 URL [本文引用: 5]
Trends of the contributions of biophysical (climate) and socioeconomic elements to regional heat islands
A proposal for the theoretical analysis of the interactive coupled effects between urbanization and the eco-environment in mega-urban agglomerations
DOI:10.1007/s11442-017-1445-x
[本文引用: 2]
Mega-urban agglomerations are strategic core areas for national economic development and the main regions of new urbanization. They also have important roles in shifting the global economic center of gravity to China. However, the development of mega-urban agglomerations has triggered the interactive coercion between resources and the eco-environment. The interactive coupled effects between urbanization and the eco-environment in mega-urban agglomerations represent frontier and high-priority research topics in the field of Earth system science over the next decade. In this paper, we carried out systematic theoretical analysis of the interactive coupling mechanisms and coercing effects between urbanization and the eco-environment in mega-urban agglomerations. In detail, we analyzed the nonlinear-coupled relationships and the coupling characteristics between natural and human elements in mega-urban agglomerations. We also investigated the interactive coercion intensities between internal and external elements, and the mechanisms and patterns of local couplings and telecouplings in mega-urban agglomeration systems, which are affected by key internal and external control elements. In addition, we proposed the interactive coupling theory on urbanization and the eco-environment in mega-urban agglomerations. Furthermore, we established a spatiotemporal dynamic coupling model with multi-element, multi-scale, multi-scenario, multi-module and multi-agent integrations, which can be used to develop an intelligent decision support system for sustainable development of mega-urban agglomerations. In general, our research may provide theoretical guidance and method support to solve problems related to mega-urban agglomerations and maintain their sustainable development.
Scale-dependent interactions between tree canopy cover and impervious surfaces reduce daytime urban heat during summer
DOI:10.1073/pnas.1817561116
PMID:30910972
[本文引用: 2]
As cities warm and the need for climate adaptation strategies increases, a more detailed understanding of the cooling effects of land cover across a continuum of spatial scales will be necessary to guide management decisions. We asked how tree canopy cover and impervious surface cover interact to influence daytime and nighttime summer air temperature, and how effects vary with the spatial scale at which land-cover data are analyzed (10-, 30-, 60-, and 90-m radii). A bicycle-mounted measurement system was used to sample air temperature every 5 m along 10 transects (∼7 km length, sampled 3-12 times each) spanning a range of impervious and tree canopy cover (0-100%, each) in a midsized city in the Upper Midwest United States. Variability in daytime air temperature within the urban landscape averaged 3.5 °C (range, 1.1-5.7 °C). Temperature decreased nonlinearly with increasing canopy cover, with the greatest cooling when canopy cover exceeded 40%. The magnitude of daytime cooling also increased with spatial scale and was greatest at the size of a typical city block (60-90 m). Daytime air temperature increased linearly with increasing impervious cover, but the magnitude of warming was less than the cooling associated with increased canopy cover. Variation in nighttime air temperature averaged 2.1 °C (range, 1.2-3.0 °C), and temperature increased with impervious surface. Effects of canopy were limited at night; thus, reduction of impervious surfaces remains critical for reducing nighttime urban heat. Results suggest strategies for managing urban land-cover patterns to enhance resilience of cities to climate warming.
Spatial-temporal evolution of urban thermal environment based on spatial statistical features
A new method which aims to determine the area of urban heat island (UHI) was proposed in this paper based on spatial statistical features by means of remote sensing and GIS spatial analysis tools, and was applied in the spatial-temporal evolution analysis of UHI in Hangzhou, China. The results showed that the area of UHI in Hangzhou increased 8.66 times from 1984 to 2010. During the 26 years, the spatial structure of UHI in Hangzhou had become more and more complex, and its spatial distribution changed from single-center to multi-center. Generally speaking, the change trend of thermal environment in Hangzhou was turning from low-temperature spatial equilibrium to high-temperature spatial equilibrium. The major cause for the development of UHI in Hangzhou was urban expansion as it showed in the results of dynamic change detection. This new method considered the spatial correlation of urban land surface temperature (LST), and reflected the global statistical features of LST. It was more objective and accurate than the conventional methods, and could provide more information, which would help us to resolve the problem of being lack of generality and comparability in the current research.
基于空间统计特征的城市热环境时空演化
利用遥感反演和GIS空间分析等工具,提出了一种基于空间统计特征的城市热岛范围界定方法,并应用该方法分析了1984—2010年杭州市城市热环境的时空演化规律.结果表明: 1984—2010年间,杭州市的城市热岛面积增加了8.66倍;杭州城市热岛的空间形态日趋复杂,空间分布由单中心的聚集状态逐渐向多中心的扩散状态发展;杭州城市热环境呈现出由区域低温均衡向区域高温均衡发展的态势.城市热岛的动态变化检测表明,城市扩张是杭州城市热岛发育的主要原因.本文所提方法考虑了城市地表温度的空间相关关系,反映了城市地表温度的全局统计特征,提供的信息更多,也更为客观和准确.通过该方法的推广,有助于解决当前城市热岛研究中研究样本之间缺乏通用性和可比性的问题.
Impact of urbanization on regional temperature change in the Yangtze River Delta
长江三角洲城市带扩展对区域温度变化的影响
Seasonal hysteresis of surface urban heat islands
DOI:10.1073/pnas.1917554117
PMID:32184330
[本文引用: 1]
Temporal dynamics of urban warming have been extensively studied at the diurnal scale, but the impact of background climate on the observed seasonality of surface urban heat islands (SUHIs) remains largely unexplored. On seasonal time scales, the intensity of urban-rural surface temperature differences ([Formula: see text]) exhibits distinctive hysteretic cycles whose shape and looping direction vary across climatic zones. These observations highlight possible delays underlying the dynamics of the coupled urban-biosphere system. However, a general argument explaining the observed hysteretic patterns remains elusive. A coarse-grained model of SUHI coupled with a stochastic soil water balance is developed to demonstrate that the time lags between radiation forcing, air temperature, and rainfall generate a rate-dependent hysteresis, explaining the observed seasonal variations of [Formula: see text] If solar radiation is in phase with water availability, summer conditions cause strong SUHI intensities due to high rural evaporative cooling. Conversely, cities in seasonally dry regions where evapotranspiration is out of phase with radiation show a summertime oasis effect controlled by background climate and vegetation properties. These seasonal patterns of warming and cooling have significant implications for heat mitigation strategies as urban green spaces can reduce [Formula: see text] during summertime, while potentially negative effects of albedo management during winter are mitigated by the seasonality of solar radiation.
The surface urban heat island response to urban expansion: A panel analysis for the conterminous United States
Urban heat islands in China enhanced by haze pollution
Comparison of surface and canopy urban heat islands within megacities of eastern China
DOI:10.1016/j.isprsjprs.2019.08.012 URL [本文引用: 1]
Impacts of urban landscape patterns on urban thermal variations in Guangzhou, China
DOI:10.1016/j.jag.2016.09.007 URL [本文引用: 1]
Quantifying spatial morphology and connectivity of urban heat islands in a megacity: A radius approach
Influence of Beijing spatial morphology on the distribution of urban heat island
DOI:10.11821/dlxb202107007
[本文引用: 2]
Exploring the influence of urban spatial morphology layout on the urban heat island (UHI) at the urban scale is of great significance for the improvement of ventilation environment and the ecological and livable urban planning. Taking Beijing, China as an example, this study analyzed the UHI spatial characteristics using the hourly temperature data of high-density automatic weather stations in 2009-2018 and the 2018 NPP/VIRRS night-light satellite data. Using 1:2000 basic geographic information data and Landsat8 satellite remote sensing data in 2017, based on remote sensing and GIS technology and morphological models, we extracted eight morphological parameters in the main urban area of Beijing, namely, building height (BH), building density (BD), building standard deviation (BSD), floor area ratio (FAR), frontal area index (FAI), roughness length (RL), sky view factor (SVF), fractal dimension (FD) and three land surface parameters consisting of vegetation coverage (VC), impervious cover (IC), albedo (AB). The relationship between these morphological parameters and UHI was further examined at the urban scale using the spatial statistical method. Results show that the downtown area of central Beijing has presented a relatively fixed distribution pattern of UHI at annual scale, four seasons, and 02:00 at nighttime in the past 10 years. The UHI of the annual, spring, summer, autumn, winter, 14:00, and 02:00 are 1.81℃, 1.50℃, 1.43℃, 2.16℃, 2.17℃, 0.48℃, and 2.77℃, respectively. The eight spatial morphological parameters have obvious spatial correlations with UHIs for most of the year, and the correlations are stronger in winter than in other seasons, and stronger at 02:00 am than at 14:00 pm. The top three parameters are SVF, FAR, and BD. There are spatiotemporal changes in the impact of different spatial morphological parameters and land surface parameters on UHI. Spatial morphological parameters have become important drivers of UHI change and the individual contributions of the eleven parameters to UHI changes are 13.7% to 62.2%. The spatial morphological parameters that contribute the most in summer, winter, and the whole year are BD (43.7%), SVF (62.2%), and SVF (43.0%), respectively; and the corresponding largest land surface parameters are VC (42.6%), AB (57.1%), and VC (45.4%), respectively. The comprehensive contribution of multiple parameters to UHI changes in summer, winter, and the whole year are 51.4%, 69.1%, and 55.3%, respectively; and the dominant influencing factors are BD, SVF, and BD.
北京城市空间形态对热岛分布影响研究
DOI:10.11821/dlxb202107007
[本文引用: 2]
在城市尺度上探究城市空间形态布局对城市热岛(UHI)影响研究,对于城市规划中通风环境改善、生态宜居城市建设具有重要意义。以北京为例,利用2009—2018年高密度自动气象站逐小时气温资料和2018年NPP/VIIRS夜光卫星资料,分析了UHI时空分布特征;利用2017年1∶2000基础地理信息和Landsat8卫星资料,开展了北京主城区建筑高度(BH)、建筑密度(BD)、建筑高度标准差(BSD)、容积率(FAR)、迎风截面积指数(FAI)、粗糙度长度(RL)、天空开阔度(SVF)、城市分数维(FD)等8个空间形态参数和植被覆盖度(VC)、不透水盖度(IC)、反照率(AB)等3个陆表参数的提取,并在城市尺度上开展了这些参数与UHI之间空间相关性及对UHI变化影响研究。结果显示:2009—2018年北京主城区年均、四季以及夜晚02时UHI均存在一个较为固定的形态,年均、春、夏、秋、冬、白天14时和夜晚02时UHI分别为1.81 ℃、1.50 ℃、1.43 ℃、2.16 ℃、2.17 ℃、0.48 ℃和2.77 ℃;8个空间形态参数在一年中大部分时段与UHI存在明显空间相关性,这种相关性在冬季强于其他季节,在夜晚02时强于白天14时,排名前三的分别为SVF、FAR和BD。空间形态参数已超越陆表参数成为UHI变化的重要驱动因子,11种参数对UHI变化的单独贡献为13.7%~63.7%,其中夏季、冬季和全年时段贡献最大的空间形态参数分别是BD(43.7%)、SVF(63.7%)和SVF(45.4%),贡献最大的陆表参数分别是VC(42.6%)、AB(57.1%)和VC(45.3%);夏季、冬季和全年时段多个参数对UHI变化的综合贡献分别为51.4%、69.1%和55.3%,主导要素分别为BD、SVF和BD。
Long-term and fine-scale satellite monitoring of the urban heat island effect by the fusion of multi-temporal and multi-sensor remote sensed data: A 26-year case study of the city of Wuhan in China
DOI:10.1016/j.rse.2015.11.005 URL [本文引用: 1]
Study of the relationships between the spatial extent of surface urban heat islands and urban characteristic factors based on Landsat ETM+ data
Ten cities with different population and urban sizes located in the Pearl River Delta, Guangdong Province, P.R. China were selected to study the relationships between the spatial extent of surface urban heat islands (SUHI) and five urban characteristic factors such as urban size, development area, water proportion, mean NDVI (Normalized Vegetation Index) and population density, etc. The spatial extent of SUHI was quantified by using the hot island area (HIA). All the cities are almost at the same latitude, showing similar climate and solar radiation, the influence of which could thus be eliminated during our computation and comparative study. The land surface temperatures (LST) were retrieved from the data of Landsat 7 Enhanced Thematic Mapper Plus (ETM+) band 6 using a mono-window algorithm. A variance-segmenting method was proposed to compute HIA for each city from the retrieved LST. Factors like urban size, development area and water proportion were extracted directly from the classification images of the same ETM+ data and the population density factor is from the official census. Correlation and regression analyses were performed to study the relationships between the HIA and the related factors, and the results show that HIA is highly correlated to urban size (r=0.95), population density (r=0.97) and development area (r=0.83) in this area. It was also proved that a weak negative correlation existed between HIA and both mean NDVI and water proportion for each city. Linear functions between HIA and its related factors were established, respectively. The HIA can reflect the spatial extent and magnitude of the surface urban heat island effect, and can be used as reference in the urban planning.
Satellite-measured growth of the urban heat island of Houston, Texas
DOI:10.1016/S0034-4257(03)00007-5 URL [本文引用: 2]
Assessment with satellite data of the urban heat island effects in Asian mega cities
DOI:10.1016/j.jag.2005.05.003 URL [本文引用: 2]
Multi-temporal trajectory of the urban heat island centroid in Beijing, China based on a Gaussian volume model
DOI:10.1016/j.rse.2014.03.037 URL [本文引用: 2]
Determining the boundary and probability of surface urban heat island footprint based on a logistic model
Exploring indicators for quantifying surface urban heat islands of European cities with MODIS land surface temperatures
DOI:10.1016/j.rse.2011.07.003 URL [本文引用: 2]
Critical review on the cooling effect of urban blue-green space: A threshold-size perspective
The influence of different data and method on estimating the surface urban heat island intensity
DOI:10.1016/j.ecolind.2018.01.044 URL [本文引用: 2]
Spatial patterns and driving factors of surface urban heat island intensity: A comparative study for two agriculture-dominated regions in China and the USA
Surface urban heat island across 419 global big cities
DOI:10.1021/es2030438 URL [本文引用: 2]
Magnitude of urban heat islands largely explained by climate and population
DOI:10.1038/s41586-019-1512-9 URL [本文引用: 1]
Spatial-temporal change of land surface temperature across 285 cities in China: An urban-rural contrast perspective
DOI:10.1016/j.scitotenv.2018.04.105 URL [本文引用: 1]
The footprint of urban areas on global climate as characterized by MODIS
DOI:10.1175/JCLI3334.1 URL [本文引用: 2]
Seasonal variations of the surface urban heat island in a semi-arid city
Remote sensing of the urban heat island effect across biomes in the continental USA
DOI:10.1016/j.rse.2009.10.008 URL [本文引用: 1]
Strong contributions of local background climate to urban heat islands
DOI:10.1038/nature13462 URL [本文引用: 2]
A critical review of urban heat island phenomenon in the context of greater Kuala Lumpur, Malaysia
DOI:10.1016/j.scs.2018.02.005 URL [本文引用: 3]
A review on the generation, determination and mitigation of Urban Heat Island
DOI:10.1016/S1001-0742(08)60019-4 URL [本文引用: 1]
A systematic review and scientific critique of methodology in modern urban heat island literature
DOI:10.1002/joc.2141 URL [本文引用: 1]
Dynamical monitoring and evaluation methods to urban heat island effects based on RS & GIS
DOI:10.1016/j.proenv.2011.09.197 URL [本文引用: 1]
A remote sensing study of the urban heat island of Houston, Texas
DOI:10.1080/01431160110115023 URL [本文引用: 1]
Study of the seasonal effect of building shadows on urban land surface temperatures based on remote sensing data
Analysis of surface urban heat islands based on local climate zones via spatiotemporally enhanced land surface temperature
A review of the impact of blue space on the urban microclimate
Urban heat island: Aerodynamics or imperviousness?
The interactive impact of building diversity on the thermal balance and micro-climate change under the influence of rapid urbanization
Simulating the impact of urban surface evapotranspiration on the urban heat island effect using the modified RS-PM model: A case study of Xuzhou, China
MODIS detected surface urban heat islands and sinks: Global locations and controls
DOI:10.1016/j.rse.2013.03.008 URL [本文引用: 1]
Identification of typical diurnal patterns for clear-sky climatology of surface urban heat islands
DOI:10.1016/j.rse.2018.08.021 URL [本文引用: 1]
Spatial-temporal variations of surface urban heat island intensity induced by different definitions of rural extents in China
DOI:10.1016/j.scitotenv.2019.03.100 URL [本文引用: 1]
The urban heat island effect and city contiguity
DOI:10.1016/j.compenvurbsys.2015.08.002 URL [本文引用: 1]
Analysis of factors influencing the "source-sink" landscape contribution of land surface temperature
DOI:10.11821/dlxb202201004
[本文引用: 1]
Urban heat island aroused by urbanization has become one of the most serious environmental problems in China. To solve such an "urban disease" and achieve sustainable development, the relationships between urban heat and natural, socio-economic, and landscape pattern factors need to be explored. Firstly, this study identified the "source-sink" landscape of urban heat islands based on the identification of Heat Source and Sink Landscapes (HSI). Secondly, the contribution index (CI) of the "source-sink" landscape and its ratio was calculated to analyze spatial and temporal evolution. The spatial Durbin model was used to analyze the influence of natural, socio-economic, and landscape morphology factors on the CI of "source-sink" landscapes. The results are as follows: (1) During 2005-2015, more provinces could alleviate the heat island effect in winter than they could in summer. In winter, the "strong" and "weak" Landscape Index regions were concentrated in northern and southern China, whereas in summer, the "strong" Landscape Index areas were concentrated in the northern region. (2) Considering local factors, the landscape shape had a great impact on the contribution of the "source" or "sink" landscape. Therefore, to reduce the heat island effect, adjacent small "sink" patches can be combined to lessen the dispersion of the surface temperature of "sink" landscapes. In addition, to achieve the best cooling effect during the summer, the relative humidity and vegetation coverage needs to increase in the "source" landscape, and the building density and height of the "source" landscape and "sink" landscape need to be strictly controlled. (3) The relative humidity and building density of neighbourhoods showed significant impact on the local heat island. Thus, by increasing the dispersion of "source" landscapes and their edge density, or by increasing the concentration of "sink" landscapes and simplifying their shape, it is possible to alleviate the heat island effect in neighborhoods.
地表温度“源—汇”景观贡献度的影响因素分析
DOI:10.11821/dlxb202201004
[本文引用: 1]
在中国快速城市化进程中,城市热岛是严重的环境问题之一。探究城市热岛的影响因素,建立与自然因子、社会经济因子、景观形态因子的关联,对解决中国“城市病”,实现可持续发展具有重要的意义。本文首先在全国尺度上基于地表温度“源—汇”景观指数识别地表温度的“源”景观/“汇”景观,在此基础上计算“源—汇”景观贡献度及其效应,分析其时空演变规律;其次,基于空间杜宾模型分析自然因子、社会经济因子和景观形态因子对“源—汇”景观贡献度的影响,结果发现:① 2005—2015年间,可缓解热岛效应的省份冬季较夏季多,冬季“强”和“较弱”景观贡献度比值区域集中分布在中国北部和南部;夏季“强”的“汇”与“源”景观贡献度比值区域集中分布在中国北部地区。② 对于本地因子,景观形态对“源”或“汇”景观贡献度的影响较大,缓解热岛效应将附近小“汇”斑块结合来降低地表温度“汇”景观的离散度;其次,夏季适当在“源”景观里增加相对湿度、并增加其植被覆盖率,严格控制“源”景观和“汇”景观的建筑密度及建筑高度,可达到最佳降温效果。③ 邻域因子中相对湿度和建筑密度的影响更大,景观形态中增加“源”景观的离散度及其边缘密度,或增加“汇”景观集聚度,简化其形状均有利于缓解邻域的热岛效应。
A landscape connectivity approach to mitigating the urban heat island effect
DOI:10.1007/s10980-022-01439-3 URL [本文引用: 1]
How to build a heat network to alleviate surface heat island effect?
