

1 引言
2000年以来中国经济增速逐渐由高速向中高速转变,产业结构也在不断调整中,至2012年第三产业占比超过第二产业。2000—2018年工业增加值占GDP的比由40.15%降至33.90%,工业污染排放量也呈下降趋势,其中工业废水排放量和工业二氧化硫排放量分别下降9.89%和72.30%。长期以来,中国出口导向型经济模式过度依赖资源消耗,造成严重的环境污染。过分依赖国际市场,阻碍了“绿水青山”向“金山银山”的转化,成为经济绿色发展的瓶颈。在此背景下,党中央提出“逐步形成以国内大循环为主体、国内国际双循环相互促进的新发展格局”,以推动中国开放型经济向更高层次发展,促进经济与生态的和谐绿色发展。在快速城镇化进程中,中国经济发展与生态环境关系虽有所改善,但环境问题依然严峻,因此生态城镇化应运而生,生态文明建设也成为中国特色社会主义事业“五位一体”总体布局的重要组成部分。当前中国生态文明建设正处于压力叠加、负重前行的关键期,已进入提供更多优质生态产品以满足人民日益增长的优美生态环境需要的攻坚期,也到了有条件有能力解决生态环境突出问题的窗口期。城市群作为城镇化和工业化发展到高级阶段的产物[1],也是中国推进新型城镇化和新型工业化的主要载体,城市群城镇化水平提高和工业集聚在促进地区经济社会繁荣进步的同时,也导致城镇污染和工业污染排放量的增长。在中国经济进入高质量发展阶段,城市群工业经济规模与工业污染排放量间的矛盾仍然尖锐,且可能影响到中国“十四五”期间乃至更长时期经济社会的可持续发展。因此,厘清城市群工业经济规模与工业污染排放量间的关系,不仅满足人民日益增长的优美生态环境需求,也有利于探索城市群绿色发展路径,促进区域持续健康发展和社会全面进步。
经济增长与环境污染关系的问题是经济地理学、区域经济学和环境经济学研究的重要内容[2⇓-4]。国际上关于经济增长与环境污染关系的研究始于20世纪90年代,美国经济学家Grossman等通过对空间污染物与地区收入水平的研究,发现经济增长与污染水平呈倒“U”型关系[5-6]。Panayotou将经济发展与环境污染间的倒“U”型关系定义为“环境库兹涅茨曲线(Environmental Kuznets Curve, EKC)”[7],此后EKC逐渐成为研究经济水平与环境质量关系的经典理论,引发众多学者的大量实证研究。国内对经济与环境关系的研究开始于20世纪90年代末期,多借助EKC理论进行相关研究。21世纪以来国内外对经济与环境关系的研究增多,研究重点主要集中在经济发展水平与污染物排放量关系[8⇓-10],如工业废水排放与经济增长关系[11⇓-13]、大气污染与经济发展关系[14⇓-16]、外商投资与环境污染的关系[17-18]等,此外还拓展到环境污染的空间格局及驱动因素[19⇓-21]、工业化进程中环境污染响应[2,22]、工业污染集聚的空间效应[10,23]等方面。研究方法上,主要运用EKC模型[11,14,18]、LMDI指数分解模型[22,24]、脱钩指数模型[8,25]、耦合协调度模型[4,9]及空间计量模型[12,16,21,23]等方法,分析污染物排放强度与经济发展的关系及影响机制。研究尺度上,以全国层面省级尺度和地级市尺度研究居多[20-21,26],省域层面的研究主要集中在工业经济较为发达的地区,如广东、江苏和山东等省份[11,27 -28];城市层面主要以东部经济发展水平较高的直辖市或省会为例。随着城市群在引领带动经济发展作用的日益凸显,城市群已成为经济发展与环境污染关系研究的新热点区域,其中京津冀、长三角和粤港澳大湾区三大城市群为学者关注的焦点[4,8]。可见,已有研究主要存在以下不足:① 相关研究只是通过建立模型分析经济发展与环境污染间的关系,忽略了经济规模增长速度与环境污染速度间的关系;② EKC、LMDI等模型主要探究经济发展对环境污染的单向作用,环境污染对经济发展的影响考虑不足;③ 相关研究偏向于省域层面或全国层面的面板数据,忽视了城市群这一重要功能区的空间作用。
鉴于已有研究的不足,本文以中国综合实力最强的长三角城市群为例,构建工业经济规模与污染排放指数的异速增长模型,探究经济发展与环境污染的相对增长关系。在此基础上,引入机器学习(Machine Learning)这一由数据驱动的智能化探索型数据分析技术[29],挖掘异速增长的影响机制,以期扩展经济发展与环境污染关系的研究,实现“绿水青山”向“金山银山”的转化,为长三角更高质量一体化发展提供理论指导与实践依据,更好支撑城市群“双循环”新发展格局及区域可持续发展。
2 研究方法与数据来源
2.1 研究区域与数据来源
根据2019年12月印发的《长江三角洲区域一体化发展规划纲要》,长三角地区包括上海市、江苏省、浙江省和安徽省全域,区域面积35.67万km2,是中国经济最具活力、开放程度最高、创新能力最强的区域之一。长三角城市群处于“一带一路”和长江经济带的交汇地带,对长江经济带乃至中国经济发展起到重要的引领作用。
本文以长三角为研究区域,根据2018年行政区划,研究区域内41个地级以上城市为研究的基本单元。以行政区工业增加值表示城市工业经济规模,行政区工业废水排放量、工业二氧化硫排放量和工业烟(粉)尘排放量的综合指数表示城市工业污染排放程度,相关数据来自2001—2019年的各省市统计年鉴、《中国城市统计年鉴》及《中国城市建设统计年鉴》。
2.2 研究方法
2.2.1 工业污染指数计算
式中:Pi为i城市的工业污染综合指数;Zij为i城市j变量的标准化值;wj为j变量的权重。
2.2.2 异速增长模型
对式(2)两边同时取对数,可得:
表1 工业经济规模—污染排放异速关系的协调性分级表
Tab. 1
| 异速增长类型 | 异速级别 | 划分标准 | 异速关系类型 | 异速关系特征 |
|---|---|---|---|---|
| 正异速生长 | 正异速3级 | 3 ≤ b | 污染扩张强型 | 污染排放相对增长速度远远高于工业经济规模相对增长速度 |
| 正异速2级 | 1 ≤ b<3 | 污染扩张弱型 | 污染排放相对增长速度高于工业经济规模相对增长速度 | |
| 正异速1级 | 0.85 ≤ b<1 | 经济环境基本协调 | 污染排放相对增长速度稍高于工业经济规模相对增长速度 | |
| 负异速生长 | 负异速1级 | 0.5 ≤ b<0.85 | 经济扩张弱型 | 污染排放相对增长速度低于工业经济规模相对增长速度 |
| 负异速2级 | 0 ≤ b<0.5 | 经济扩张强型 | 污染排放相对增长速度远远低于工业经济规模相对增长速度 | |
| 负异速3级 | b<0 | 经济环境有所收缩 | 污染排放和工业经济规模其中一个减少或同时减少 |
2.2.3 增强回归树
增强回归树(Boosted Regression Tree, BRT)是基于分类回归树(Classification And Regression Tree, CART)算法的一种自学习方法,该方法结合回归树(Regression Tree)模型与提升(Boosting)算法,通过多次随机选择和自学习建立多重回归树,进而提高回归树模型的稳定性和预测精度[40-41]。BRT模型在运算过程中多次随机抽取一定量的数据,分析自变量对因变量的影响程度,剩余数据用于拟合结果的检验,最后对生成的多重回归树取均值并输出。BRT模型在处理不同数据格式时具有较强的灵活性,对预测变量的独立性无需作出事先假设,能够适应复杂的非线性关系,目前该模型已广泛运用到生态学、地理学和环境科学等领域[42]。
以长三角地区各城市工业经济规模—污染排放异速增长系数为因变量,建立异速增长的影响因素体系,利用BRT模型对各影响因素与异速增长的关系进行拟合,探测各因素在其他因素取均值时,该因素与工业经济规模—污染排放异速增长系数之间的数量关系,并计算各因素对城市间异速增长系数差异的贡献率。BRT模型使用R语言的Dismo包构建,其参数设置如下:树的复杂程度(Tree Complexity)为3,学习速率(Learning Rate)为0.01,其他参数使用默认设置。
3 长三角地区工业经济规模—污染排放异速增长特征
3.1 工业经济规模与污染排放的空间分布格局
计算2000—2018年长三角地区工业污染指数,利用ArcGIS软件自然间断点分级法对2000年和2018年长三角地区工业增加值和工业污染指数进行空间可视化(图1)。
图1
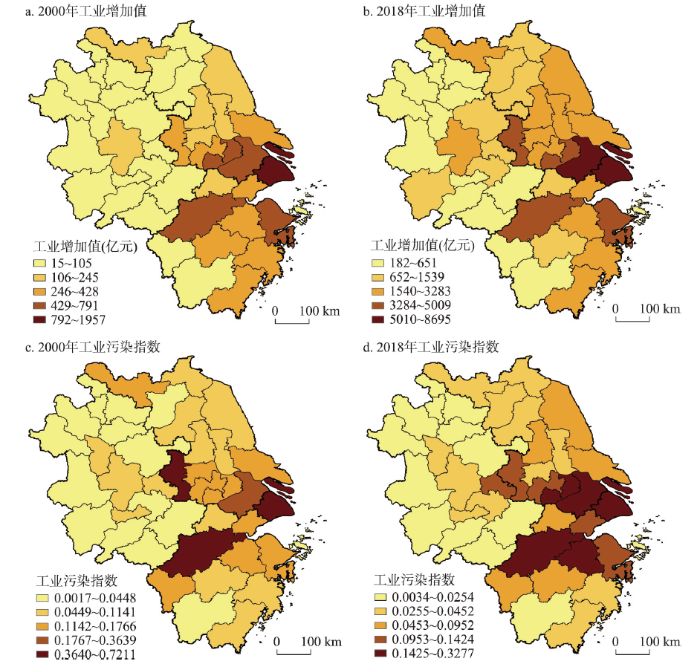
图1
2000年和2018年长三角城市工业经济规模与工业污染指数的空间分布
Fig. 1
Spatial distribution of the size of industrial economies and industrial pollution indexin the Yangtze River Delta in 2000 and 2018
在工业增加值方面,2000年和2018年空间格局较为稳定,均呈自东向西递减的空间态势,上海、苏州、无锡、杭州、宁波长期居于前列,浙江西南部、安徽北部和南部等城市群外围一直处于较低水平。各城市工业增加值均有所增加,其中江苏、安徽中部和东部工业增加值增长较快,城市群平均值由2000年的240亿元上升至2018年的1947亿元。
在工业污染指数方面,工业污染格局也具有较强的稳定性,上海、杭州、苏州、南京等核心城市工业污染排放较高,安徽北部和南部工业污染排放较低。2000—2018年长三角工业污染排放总体呈下降趋势,城市群工业污染指数均值由2000年的0.1218下降至2018年的0.0678,其中上海、南京、杭州、镇江、徐州等城市工业污染排放下降较多,少数城市工业污染排放有所增加,如绍兴、宿迁、无锡、芜湖、马鞍山、嘉兴等城市。
比较工业增加值与工业污染指数的分布特点可以发现,工业增加值与工业污染排放空间格局具有较高的相似性,均呈城市群东部至西部递减的总体趋势,随着工业增加值的增加,工业污染排放呈现出下降态势,即长三角工业污染治理水平不断提高。
3.2 工业经济规模—污染排放的纵向异速关系
建立工业经济规模与污染排放指数的异速增长模型,对其进行双对数线性拟合,得到长三角地区工业经济规模—污染排放异速增长的拟合模型(表2)。
表2 2000—2018年长三角工业经济规模—污染排放异速增长拟合模型
Tab. 2
| 年份 | 拟合方程 | 标度指数 | 拟合优度 | 异速级别 |
|---|---|---|---|---|
| 2000 | lnD=-3.3321+0.8611lnE | 0.8611 | 0.7067 | 正异速1级 |
| 2001 | lnD=-3.6933+0.8869lnE | 0.8869 | 0.7248 | 正异速1级 |
| 2002 | lnD=-3.4535+0.8654lnE | 0.8654 | 0.7365 | 正异速1级 |
| 2003 | lnD=-3.7496+0.8735lnE | 0.8735 | 0.7623 | 正异速1级 |
| 2004 | lnD=-3.1888+0.8250lnE | 0.8250 | 0.7630 | 负异速1级 |
| 2005 | lnD=-3.2923+0.8289lnE | 0.8289 | 0.7738 | 负异速1级 |
| 2006 | lnD=-2.9271+0.7977lnE | 0.7977 | 0.7584 | 负异速1级 |
| 2007 | lnD=-3.1206+0.8008lnE | 0.8008 | 0.7731 | 负异速1级 |
| 2008 | lnD=-3.8566+0.7956lnE | 0.7956 | 0.7379 | 负异速1级 |
| 2009 | lnD=-3.2194+0.7903lnE | 0.7903 | 0.6744 | 负异速1级 |
| 2010 | lnD=-4.4946+0.8627lnE | 0.8627 | 0.7312 | 正异速1级 |
| 2011 | lnD=-4.3899+0.8462lnE | 0.8462 | 0.7423 | 负异速1级 |
| 2012 | lnD=-5.5241+0.9085lnE | 0.9085 | 0.7561 | 正异速1级 |
| 2013 | lnD=-5.2054+0.8835lnE | 0.8835 | 0.7597 | 正异速1级 |
| 2014 | lnD=-4.6676+0.8434lnE | 0.8434 | 0.7230 | 负异速1级 |
| 2015 | lnD=-4.3140+0.8216lnE | 0.8216 | 0.7210 | 负异速1级 |
| 2016 | lnD=-6.7816+0.9558lnE | 0.9558 | 0.7716 | 正异速1级 |
| 2017 | lnD=-6.9398+0.9497lnE | 0.9497 | 0.7297 | 正异速1级 |
| 2018 | lnD=-7.6318+0.9852lnE | 0.9852 | 0.7368 | 正异速1级 |
2000—2018年标度指数在0.7903~0.9852范围内波动变化,各年份拟合优度均超过0.67,拟合效果较好。由标度指数的变化特点,将长三角地区工业经济规模—污染排放的纵向异速划分为2000—2009年和2010—2018年两个阶段。2000—2009年标度指数总体呈波动下降趋势,由2000年的0.8611变动至2009年的0.7903,其中2000—2003年标度指数超过0.85,处于污染排放增速稍高于工业经济规模相对增速的经济环境基本协调阶段,2004—2009年标度指数均低于0.85,处于污染排放增速低于工业经济规模相对增速的经济扩张弱型阶段。2010—2018年标度指数表现出波动上升态势,由2010年的0.8627变动至2018年的0.9852,其中2010年、2012—2013年和2016—2018年标度指数高于0.85,2011年和2014—2015年标度指数低于0.85,且均高于0.82,反映出此阶段多处于污染排放增速稍高于工业经济规模相对增速的经济环境基本协调阶段。
总体来看,长三角地区工业经济规模—污染排放异速增长的标度指数呈先降后升的变化趋势,即研究初期和末期标度指数相对较高,多处于经济环境基本协调阶段,研究中期标度指数相对较低,多处于经济扩张弱型阶段。随着工业在国民经济中比重下降,工业经济规模的增速也有所减缓[43],工业污染排放治理面临着巨大挑战。
3.3 工业经济规模—污染排放的横向异速关系
由纵向异速增长对标度指数划分的两个阶段,利用工业经济规模与污染排放的异速增长模型,计算2000—2009年、2010—2018年各城市工业经济规模—污染排放异速增长的拟合模型,并对拟合方程的标度指数类型及其变化进行可视化表达(图2)。
图2
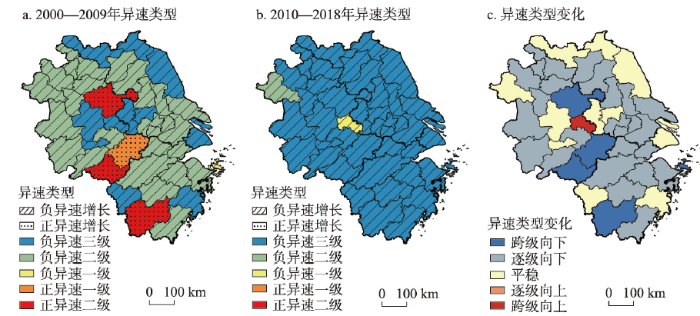
图2
2000—2018年长三角城市异速类型及其变化分布
Fig. 2
The types of allometric growth and their spatial distribution in the Yangtze River Delta during 2008-2018
2000—2009年长三角地区工业经济规模—污染排放异速类型以负异速为主,负异速增长型城市37个,占所有城市的90.24%,地域分布较为广泛。负异速城市中,负异速一级城市仅舟山,负异速二级城市25个,占负异速城市的67.57%,主要分布在江苏中部和南部、浙江中部和北部、安徽北部和西部等地区。负异速三级城市11个,占负异速城市的29.73%,主要分布在上海、江苏北部和西南部、安徽中东部等地区。正异速增长型城市4个,占所有城市的9.76%,其中正异速一级城市仅宣城,正异速二级城市为丽水、黄山和滁州3个。2010—2018年长三角地区工业经济规模—污染排放异速类型均为负异速,其中负异速一级城市仅马鞍山,负异速二级城市仅阜阳,负异速三级城市39个,占长三角的95.12%,广泛分布在各地区。
比较2000—2009年和2010—2018年两个阶段异速类型的变化(图2c),向下变动型(跨级向下和逐级向下)城市29个,占研究区的70.73%。跨级向下型城市5个,其中2000—2009年4个正异速增长城市均跨级向下转变为负异速城市,即丽水、黄山和滁州均由正异速二级降至负异速二级,宣城由正异速一级降至负异速二级,而舟山则由负异速一级降至负异速三级,表明这些城市工业污染排放下降较快,城市环境质量明显提升。逐级向下型城市24个,主要分布在江苏中部和南部、浙江中部和北部、安徽的北部和西部,且这些城市均为负异速二级降至负异速三级,说明这些地区工业污染排放增速有所降低,地区环境水平有所提高。平稳型城市11个,占研究区的26.83%,主要分布在上海、江苏北部和西南部、安徽中部等地区,这些地区工业污染排放增速一直保持在较低水平,城市环境质量稳步改善。向上变动型城市仅马鞍山,且由负异速三级跨级向上转变为负异速一级,反映出马鞍山工业污染排放增速虽仍低于工业经济规模相对增速,但工业污染排放增速有所上升。
总体来看,长三角地区多数城市工业污染排放相对增速低于工业经济规模相对增速,且多数城市工业经济规模—污染排放异速增长类型发生了向下变化,即工业污染排放增速与工业经济规模增速的差距逐渐扩大。
4 长三角地区工业经济规模—污染排放异速增长影响因素分析
4.1 影响因素选取
表3 异速增长的影响因素
Tab. 3
| 影响因素 | 具体指标 | 计算方法 | 单位 |
|---|---|---|---|
| 经济发展水平 | 人均GDP | 地区生产总值/常住人口 | 元/人 |
| 工业发展水平 | 工业增加值占GDP比重 | 工业增加值/地区生产总值 | % |
| 科技发展水平 | R&D经费支出占GDP比重 | R&D经费支出/地区生产总值 | % |
| 城镇发展水平 | 常住人口城镇化率 | 城镇人口/常住人口 | % |
| 对外开放水平 | 地均使用外资金额 | 实际使用外资金额/行政区面积 | 万美元/km2 |
| 城市生态基础 | 水面率 | 城市水域面积/行政区面积 | % |
| 设施供给水平 | 市政公用设施建设投资比重 | 市政公用设施建设投资/社会固定资产投资 | % |
| 财政投入水平 | 人均财政支出 | 地方财政支出/常住人口 | 元/人 |
| 能源利用效率 | 单位GDP用电量 | 全社会用电量/地区生产总值 | kW·h/万元 |
| 地理区位条件 | 地理相对位置 | 核心区①、中心区②和非中心区③分别赋值1、2、3 | - |
注:① 2010年颁布的《长江三角洲地区区域规划》指出,长三角核心区为上海、南京、苏州、无锡、常州、镇江、扬州、泰州、南通、杭州、宁波、湖州、嘉兴、绍兴、舟山、台州16个城市;② 2019年印发的《长江三角洲区域一体化发展规划纲要》指出,长三角中心区为上海、南京、无锡、常州、苏州、南通、扬州、镇江、盐城、泰州、杭州、宁波、温州、湖州、嘉兴、绍兴、金华、舟山、台州、合肥、芜湖、马鞍山、铜陵、安庆、滁州、池州、宣城27个城市,本文中心区(不含核心区)为27个城市除核心区外的11个城市;③ 非中心区为三省一市除核心区、中心区(不含核心区)外剩余的14个城市。
为消除多重共线性影响,对10项指标进行共线性诊断,利用SPSS软件计算各因素的方差膨胀因子(Variance Inflation Factor, VIF),发现各因素VIF均低于10,即各因素间不存在显著的多重共线性,故将10项指标全部纳入BRT模型。
4.2 因子贡献率及稳健性检验
运用BRT模型分析各因素对2000—2009年和2010—2018年长三角地区工业经济规模—污染排放异速增长的影响,并利用2000—2018年长三角各城市异速增长系数检验BRT模型的稳健性(表4)。
表4 各因素对异速增长的贡献率及其排名
Tab. 4
| 影响因素 | 2000—2009年 | 2010—2018年 | 2000—2018年 | |||||
|---|---|---|---|---|---|---|---|---|
| 贡献率(%) | 贡献率排名 | 贡献率(%) | 贡献率排名 | 贡献率(%) | 贡献率排名 | |||
| 经济发展水平 | 1.69 | 9 | 1.57 | 7 | 1.49 | 9 | ||
| 工业发展水平 | 15.81 | 3 | 16.33 | 2 | 15.76 | 3 | ||
| 科技发展水平 | 6.37 | 4 | 6.82 | 4 | 5.86 | 5 | ||
| 城镇发展水平 | 2.99 | 7 | 2.62 | 6 | 3.72 | 6 | ||
| 对外开放水平 | 5.91 | 5 | 6.01 | 5 | 6.14 | 4 | ||
| 城市生态基础 | 42.56 | 1 | 47.72 | 1 | 44.36 | 1 | ||
| 设施供给水平 | 2.19 | 8 | 0.95 | 9 | 1.58 | 8 | ||
| 财政投入水平 | 5.22 | 6 | 1.39 | 8 | 3.66 | 7 | ||
| 能源利用效率 | 16.70 | 2 | 16.07 | 3 | 16.75 | 2 | ||
| 地理区位条件 | 0.56 | 10 | 0.52 | 10 | 0.68 | 10 | ||
2000—2009年城市生态基础对异速增长的影响最大,贡献率高达42.56%,其次是能源利用效率和工业发展水平,两者贡献率均超过15%,科技发展水平、对外开放水平和财政投入水平贡献率在5%~10%之间,影响处于中等水平,城镇发展水平、设施供给水平、经济发展水平和地理区位条件影响较小,贡献率不足5%。2010—2018年城市生态基础对异速增长的影响依然最大,贡献率升至47.72%,工业发展水平和能源利用效率的影响次之,贡献率均在16%附近,科技发展水平和对外开放水平贡献率超过5%,城镇发展水平、经济发展水平、财政投入水平、设施供给水平和地理区位条件影响较小,贡献率低于5%。
比较2000—2009年和2010—2018年两个时间段各因素贡献率的差异发现,工业发展水平、科技发展水平、对外开放水平和城市生态基础对异速增长的贡献率呈增加势头,其中城市生态基础贡献率增加最多,达到5.16%,对两个阶段异速增长的影响均保持在第一位。工业发展水平、科技发展水平和对外开放水平贡献率增加均低于1%,其中工业发展水平影响程度由第三位上升至第二位。经济发展水平、城镇发展水平、设施供给水平、财政投入水平、能源利用效率和地理区位条件对异速增长的贡献率呈减少趋势,其中财政投入水平和设施供给水平分别下降3.83%和1.24%,对异速增长的影响也分别由第六位和第八位下降至第八位和第九位,经济发展水平、城镇化发展水平、能源利用效率和地理区位条件贡献率下降均不超过1%。
由表4知,3个时段城市生态基础、能源利用效率和工业发展水平对异速增长的影响均居前3位,其中城市生态基础贡献率超过40%,能源利用效率和工业发展水平贡献率均高于15%,且2000—2018年贡献率与另两个阶段相差不足1%。3个时段对外开放水平和科技发展水平的贡献率均在5%以上,且相差较小,贡献率排名相近,城镇化发展水平、财政投入水平、设施供给水平、经济发展水平和地理区位条件的影响均保持在较低水平。总体来看,2000—2018年各因素贡献率与2000—2009年和2010—2018年相差较小,各因素贡献率排名基本相同或相近,进而验证了BRT模型的稳健性与可靠性。
4.3 主导因子影响规律
图3
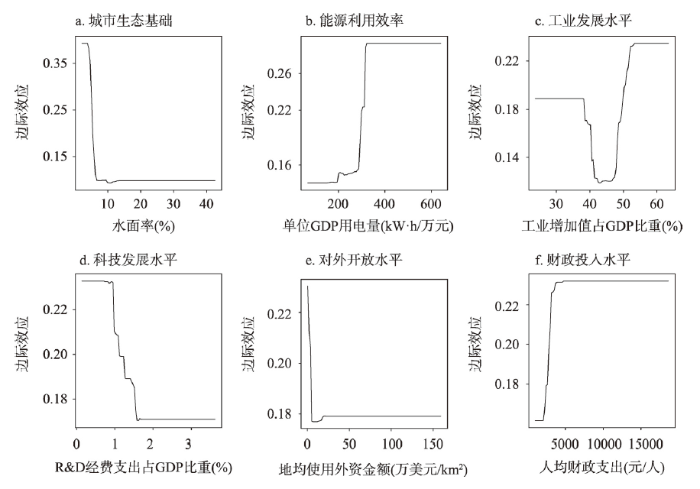
图3
2000—2009年主导因子对异速增长的边际效应
Fig. 3
Marginal effect of dominant factors on allometric growth during 2000-2009
图4
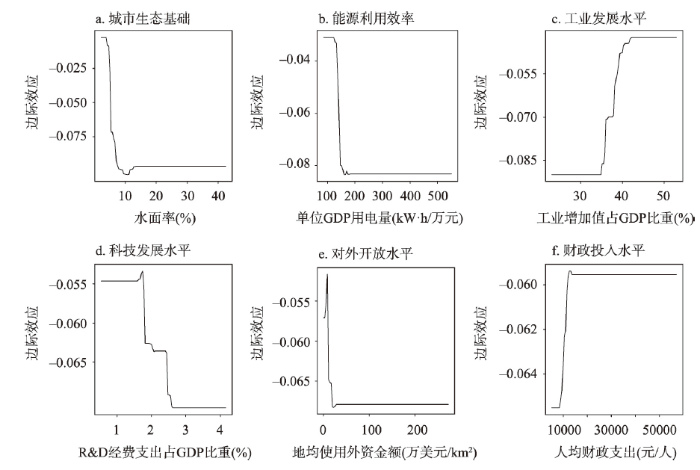
图4
2010—2018年主导因子对异速增长的边际效应
Fig. 4
Marginal effect of dominant factors on allometric growth during 2010-2018
(1)经济因素主导的影响。经济发展水平、城镇发展水平、对外开放水平和财政投入水平等因素主要表现为对工业经济规模的影响,其中对外开放水平和财政投入水平为主导驱动因子。地均使用外资金额对工业经济规模—污染排放异速增长的影响由正向转变为负向,且呈负相关关系,主要因为研究前期对外开放水平较低,引入的外企包含众多污染性行业,但随着对外水平的提高及工业污染防治的加强,工业污染在一定程度上得到了遏制。地方财政支出推动社会生产力发展和维持社会稳定,为经济发展营造良好的社会环境,财政投入水平对异速增长的影响也逐渐由正向转为负向,且呈正相关关系。
(2)环境因素主导的影响。城市生态基础和能源利用效率主要表现为对环境污染的影响,且均为主导驱动因子,平均贡献率分别居第一位和第二位。水面率可以反映城市的水环境容量,水体既具有较大的纳污能力和净污功能,还能改善城市小气候,使城市生态环境得到改善,因此,城市生态基础对异速增长的影响最大,对异速增长的边际效应也逐渐由正向转为负向,且呈负相关关系。目前中国工业的发展需要消耗大量的电力等能源[45],随之带来较为严重的环境污染(如水、大气、土壤等污染),故研究前期能源效率较低,对异速增长的边际效应为正。随着生态文明建设纳入到中国特设社会主义事业“五位一体”总体布局中,各级政府对生态环境的重视程度日益增加,能源利用效率得到较大提高,研究后期能源利用效率对异速增长的边际效应多为负向,且呈负相关关系。
(3)经济和环境双重作用的影响。工业发展水平、科技发展水平、设施供给水平、地理区位条件对工业经济规模与环境污染均会产生一定的影响,其中工业发展水平和科技发展水平为主导驱动因子。2000—2018年长三角工业增加值占GDP比重呈先增加后减少的变化趋势,至2014年长三角第三产业增加值占GDP比重超过第二产业,即城市经济规模增加对第二产业(主要为工业)的依赖性逐渐降低,转而越来越依靠第三产业,故前期工业增加值占GDP比重较高时对异速增长影响为正,后期工业增加值占GDP比重逐渐降低时对异速增长的影响转变为负向。科技发展水平增强为经济发展注入新动力,促进经济发展方式转变、增长动力转换和产业结构优化,推动城市绿色发展,打赢污染防治攻坚战,保护和修复生态系统,建设天蓝、地绿、水清的美丽中国,从而加快推进生态文明建设,故研究后期科技发展水平越高对异速增长的负向影响也就越大。
综上分析,长三角地区工业经济规模—污染排放异速增长是多种因素综合作用的结果,其中经济发展水平、城镇发展水平、对外开放水平和财政投入水平主要表现为对工业经济规模的影响,城市生态基础和能源利用效率主要表现为对工业污染排放的影响,工业发展水平、科技发展水平、设施供给水平和地理区位条件则表现为对工业经济规模和污染排放的双重影响(图5)。
图5
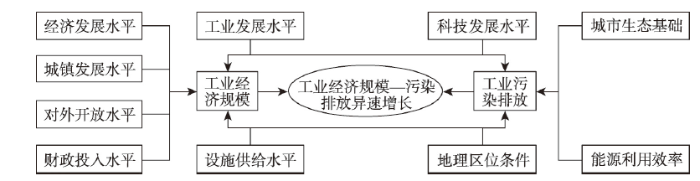
图5
工业经济规模—污染排放异速增长驱动机制
Fig. 5
Driving mechanism of allometric growth between the size of industrial economies and the emissions of industrial pollution
5 长三角一体化与经济环境异速增长的互动机制
5.1 区域一体化对经济环境异速增长的影响
一体化是区域发展的显著特征,也是区域增强竞争力的必由手段与务实选择[46]。长三角作为中国区域一体化程度最高的城市群之一,区域经济虽然仍保持较快的增长趋势,具有较强的经济活力,但也面临着环境污染和生态破坏等问题。区域一体化进程中,长三角地区经济环境异速增长既有挑战也有机遇。
1997年长三角城市经济协调会的成立大大推进了长三角区域经济一体化进程,至2019年10月蚌埠、黄山、六安、淮北、宿州、亳州和阜阳7个城市加入协调会,沪苏浙皖41个城市全部纳入长三角一体化范畴,即长三角一体化是一个不断推进的过程。2010年前,由于长三角一体化程度相对较低,城市间的人口、产业、资金、技术等要素流动较慢,不同城市在经济发展和环境治理中各自为政,城市的“空间一体化(Spatial Integration)”,即单个城市的独自发展影响了区域一体化进程,城市间缺乏有效的统筹协调,区域环境污染的防治进度较慢。在此背景下,长三角经济环境异速增长关系也发生相应的变化,2000—2009年长三角各城市工业经济规模—污染排放横向异速增长类型多样,且异速增长系数相对较高,2000—2003年纵向异速也出现了工业污染排放相对增速稍高于工业经济规模增速的情况。2010年后长三角地区一系列区域融合发展政策的推行与实施,城市的“空间非一体化(Spatial Non-Integration)”,即城市间联系的强化促进了区域一体化进程,尤其长三角区域一体化发展上升为国家战略,区域经济和生态环境一体化程度不断提高。在区域一体化进一步加强的背景下,2010—2018年长三角各城市工业经济规模—污染排放横向异速增长类型趋于同质化,且均为负异速增长,经济环境异速增长关系逐渐改善。
5.2 经济环境异速增长对区域一体化的影响
经济增长与环境污染的关系是区域发展需要迫切解决的现实问题,亦是各国政府、社会和学者普遍关注的热点问题。长三角工业经济规模与污染排放的纵向异速增长关系总体上由正异速转变为负异速,之后又转变为正异速,异速增长系数呈先下降后上升趋势。研究前期,长三角地区经济环境异速增长关系趋于改善,区域整体处于由经济环境基本协调向经济扩张的转变阶段,为区域一体化的推进提供了一定的契机。在此背景下,上海等核心城市着重发挥辐射带动作用,加强与周边地区的经济联系,扩大合作领域和丰富合作形式,并通过协调机制建设保障城市合作,如长三角城市经济协调会的成立并不断扩容,反映出经济环境异速增长状况的优化为区域一体化的加深提供了有利条件,经济和生态环境一体化推动了区域一体化进程。
在产业转移初期,区域经济发展水平较高的城市往往将产业技术含量较低、环境污染较重企业转移至经济欠发达地区,从而使本地区经济环境异速关系有所改善,产业转入地区经济环境异速状况有所恶化。2000—2009年滁州、黄山、宣城和丽水为污染排放相对增速高于工业经济规模相对增速的正异速增长类型,这些城市自身经济发展水平相对较低,且靠近长三角经济发达的城市,受周边发达地区产业转移的影响,城市工业污染排放呈快速增长趋势,经济环境异速关系逐渐突出,但经济联系的加强在一定程度上也促进了区域一体化。
随着经济发展质量提高和生态文明理念的逐渐重视,及国内国际双循环互促新发展格局的逐步形成,城市和区域的发展更加注重质量与效益的提升。上海、南京和杭州等城市率先举起高质量发展大旗,进行产业结构优化与调整,一方面增强自身经济发展的实力,提高城市生态环境品质,使得2010—2018年长三角多数城市工业经济规模—污染排放异速增长关系有所改善,另一方面通过区域间相互联系,加深区域一体化进程。在区域经济由高速增长转向高质量发展的关键阶段,长三角地区工业增加值比重逐渐降低[47],工业规模增速有所减缓,工业经济规模—污染排放纵向异速增长问题又逐渐显现。
5.3 区域一体化与经济环境异速增长的互动机制
在长三角更高质量一体化发展的进程中,政府和市场的力量均需要合理使用,使市场在资源配置中起决定性作用和更好发挥政府作用。市场一体化作为长三角区域高质量一体化发展的基础和关键[48],只有市场机制才能自动协调一体化发展的经济共享效应,调节和解决一体化进程中的各方利益冲突。区域一体化也需要政府的强力推动,政府对生态环境强有力且长期的监管、治理与保护,为城市发展营造良好环境,弥补市场机制的缺陷与不足,优化资源配置。经济增长的市场主导性与环境保护的政府主导性,两者主导力的错位最终形成了长三角经济环境异速增长的空间格局。
长三角纵向异速与横向异速的差异表明,即使各城市污染排放相对增速低于工业经济规模增速,但由于区域生态环境一体化进程较慢,环境污染的跨区域协同治理有待于进一步完善,故仍存在少数城市工业污染排放有所增加的现象,导致区域整体污染排放相对增速稍高于工业经济规模增速。在影响因素上,各主导因子对异速增长的影响由前期的正向转变为后期的负向,反映出在一体化初期,区域对资金、人口、技术等诸多要素的资源配置能力较差,环境治理水平较弱,从而在经济发展中产生一系列的环境问题,在一体化程度加深后,区域协同利用要素的能力不断增强,环境协同治理水平也逐渐提高,经济发展与环境污染的异速关系也随之改善。随着长三角地区的不断扩容,区域各城市在加强经济联系的同时,还应在生态环境方面进一步加强协同治理,使城市既实现自身的绿色发展,更能共同打造“绿色长三角”,推动长三角经济与环境的协调发展。
经济环境异速增长问题催生了区域一体化,区域一体化的推进也有利于经济环境异速增长问题的改善,经济环境异速增长关系的缓和又促进了区域一体化进程,区域一体化与经济环境异速增长相互促进、相互影响(图6)。在长三角一体化不断深化的过程中,区域经济环境异速增长关系不断变化,反映出行政力量与市场力量、经济动力与环境动力的博弈。因此,协调行政与市场的关系,平衡经济发展与环境保护的关系成为区域高质量发展迫切需要解决的重要问题。
图6
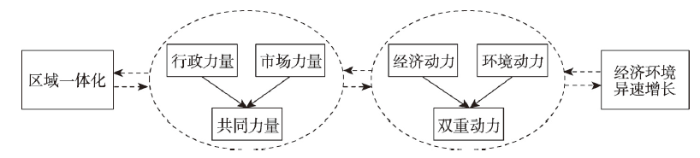
图6
一体化与异速增长的双向关系
Fig. 6
Bilateral relationships between regional integration and allometric growth
6 结论与讨论
本文以长三角地区三省一市的41个城市为研究对象,探究2000—2018年城市工业经济规模与工业污染指数间的异速增长规律,借助机器学习中的BRT模型分析异速增长的影响机制,得到以下结论:
(1)长三角地区工业经济规模与工业污染排放空间格局具有较强的稳定性和较高的相似性,呈现出由东向西递减的空间态势。工业经济规模—污染排放纵向异速增长系数呈先下降后上升趋势,其发展特征由经济环境基本协调转变为经济扩张弱型,又转变为经济环境基本协调。在横向异速上,长三角大多数城市工业污染排放相对增速低于工业经济规模增速,且70%以上的城市异速增长类型向下变动。
(2)城市生态基础、能源利用效率、工业发展水平、科技发展水平、对外开放水平和财政投入水平是影响异速增长的主导因子。经济发展水平、城镇发展水平、对外开放水平和财政投入水平主要表现为对工业经济规模的影响,城市生态基础和能源利用效率反映出对工业污染排放的影响,工业发展水平、科技发展水平、设施供给水平和地理区位条件呈现出对工业经济规模和污染排放的双重影响,长三角地区工业经济规模—污染排放异速增长是这些因素综合作用结果。
(3)经济增长的市场主导性与环境保护的政府主导性间的错位关系产生了经济环境异速增长问题,经济环境异速增长使区域一体化的出现成为可能,区域一体化的加深更有利于经济环境异速增长问题的缓和及解决,区域一体化与经济环境异速增长之间相互促进、相互影响。随着长三角区域一体化发展持续深入推进,区域工业经济规模—污染排放异速增长关系或将有所改善,从而促进一体化质量的加速提升。
随着“双循环”新发展格局逐渐形成,中国经济增长也由高增速向高质量转变,虽然经济增长与污染排放“脱钩”的绿色发展理念深入人心,但工业经济规模与污染排放的矛盾仍然存在并影响到区域经济社会的可持续发展。长三角地区作为拉动中国经济增长的重要引擎和参与国际竞争的重要平台,对长三角工业经济规模—污染排放异速增长规律的研究,可以促进区域转变经济发展方式,实现绿色创新发展,推动长三角更高质量一体化发展,带动长江经济带和中国经济社会持续发展繁荣,对其他城市群和地区的经济环境协调发展提供实践经验。伴随着长三角区域一体化发展上升为国家战略,长三角地区已从城市异速增长的空间博弈转向协调发展的关键阶段,此时更应协调经济发展与生态环境保护间的关系,通过增加科技投入、提高能源利用效率、加大生态环保领域基础设施建设,推动地区经济稳步增长,提升生态环境治理水平。此外,还应深入推进长三角区域一体化进程,积极探索跨区域生态补偿机制,加强区域生态环境联防联控联治,更好满足人民日益增长的优美生态环境需要,促进地区经济社会持续健康发展。结合本文的研究发现,下一步可分区探测异速增长影响因素的空间异质性,或探析正负异速影响因素区别及其差异机理,以期揭示不同区域不同类型异速增长驱动力的区域差异,还可以借助系统动力学模型、人工神经网络模型等预测工业经济规模与污染排放异速增长的发展趋势,为地区经济环境协调发展提供更具针对性的意见和建议,实现“绿水青山”与“金山银山”的有机统一。
参考文献
Progress and the future direction of research into urban agglomeration in China
DOI:10.11821/dlxb201408009
[本文引用: 1]

Urban agglomeration has been the inevitable result of China's rapid industrialization and urbanization over the last 30 years. Since the early 2000s, urban agglomeration has become the new regional unit participating in international competition and the division of labor. China has declared urban agglomeration the main spatial component of new types of urbanization over the next decade as clarified at the first Central Urbanization Working Conference and in the National New-type Urbanization Plan (2014?2020). However, research on urban agglomeration remains weak and needs to be strengthened. From 1934 to 2013, only 19 papers published in Acta Geographica Sinica contained the theme of urban agglomeration (0.55% of the total number of articles published) and the first paper on urban agglomeration appeared less than 10 years ago. Despite a small number of divergent studies, this work has contributed to and guided the formation of the overall pattern of urban agglomeration in China. For example, spatial analyses have promoted the formation of the fundamental framework of China's urban agglomeration spatial structure and guided the National New-type Urbanization Plan; spatial identification standards and technical processes have played an important role in identifying the scope and extent of urban agglomeration; serial studies have facilitated pragmatic research; and problems with the formation and development of urban agglomeration have provided a warning for future choices and Chinese development. Future research into urban agglomeration in China should (1) review and examine new problems in China's urban agglomeration options and cultivation; (2) critically consider urban agglomeration when promoting the formation of the 5+9+6 spatial pattern; (3) rely on urban agglomeration to construct new urbanization patterns such as 'stringing the agglomerations with the axis, supporting the axis with the agglomerations'; and (4) deepen national awareness about resources, environment effects and environmental carrying capacity in high density urban agglomerations, management and government coordination innovation, the construction of public finance and fiscal reserve mechanisms, the technical regulation of urban agglomeration planning, and standards for identifying the scope and extent of urban agglomeration.
中国城市群研究取得的重要进展与未来发展方向
DOI:10.11821/dlxb201408009
[本文引用: 1]
中国的城市群是近30年来伴随国家新型工业化和新型城镇化发展到较高阶段的必然产物,自21世纪初期城市群成为国家参与全球竞争与国际分工的全新地域单元之后,中国连续10年把城市群提升为推进国家新型城镇化的空间主体,首次召开的中央城镇化工作会议和《国家新型城镇化规划 (2014-2020年)》进一步明确了城市群作为推进国家新型城镇化的主体地位。然而,城市群在中国的研究目前尚处在亟待加强的薄弱环节。系统总结从1934-2013年的80年间发表在地理学报的城市群主题论文,只有不到19篇,仅占总篇数的0.55%,不仅发表篇数少,而且发表时间短,首次发表城市群研究成果不到10年,研究单位和作者群体集中,研究内容瞄准国家需求但比较发散。即便如此,仅有的城市群研究成果还是对国家城市群总体格局的形成起到了引领作用,做出了重要贡献。具体体现在,提出的城市群空间格局推动国家形成了中国城市群空间结构的基本框架,引导国家新型城镇化规划把城市群作为推进新型城镇化的主体形态,提出的城市群空间范围识别标准与技术流程对界定国家城市群范围起到了重要作用,提出的城市群系列研究领域带动城市群的研究向着纵深与实用方向拓展,提出的中国城市群形成发育中存在的问题对未来城市群的选择与发展起到了警示作用。以这些研究进展和成果为基础,未来中国城市群选择与培育的重点方向为:以问题为导向,深刻反思检讨中国城市群选择与发育中暴露出的新问题;以城市群为主体,重点推动形成“5+9+6”的中国城市群空间结构新格局;以城市群为依托,重点推动形成“以轴串群、以群托轴”的国家城镇化新格局;以国家战略需求为导向,继续深化对城市群形成发育中重大科学问题的新认知,包括深入研究城市群高密度集聚的资源环境效应,科学求解城市群高密度集聚的资源环境承载力,创新城市群形成发育的管理体制和政府协调机制,研究建立城市群公共财政制度与公共财政储备机制,研究制定城市群规划编制技术规程与城市群空间范围界定标准等。
An empirical study on the nonlinear effects of industrial economic structure and economic growth on environmental pollution
工业经济结构、经济增长对环境污染的非线性影响
Research trends in environmental and resource economics: Insights from four decades of JEEM
DOI:10.1016/j.jeem.2018.08.001 URL [本文引用: 1]
Spatial-temporal characteristics and influencing factors of coordination between economic and environmental development of three major urban agglomerations in China
DOI:10.11821/dlyj020181241
[本文引用: 3]
This paper analyzed the spatial-temporal pattern of the degree of coordination between economic and environmental development in Beijing-Tianjin-Hebei region, Yangtze River Delta and Pearl River Delta from 2006 to 2016 by means of entropy method, Theil index, Markov chain and spatial autocorrelation, and then explored the influencing factors with Tobit model. The results showed that: (1) The degree of coordination between economic and environmental development of the three major urban agglomerations grew continuously from 2006 to 2016. In addition, the differences between the cities gradually narrowed. (2) Path dependence played a role in the evolution of the level of economic and environmental coordination. However, the degree of coordination between economic and environmental development tended to reach a higher level with the passage of time. (3) Cities with higher administrative levels and some developed cities along rivers or the sea continued to be at a higher level of degree of coordination between economic and environmental development. (4) The spatial characteristics of the degree of coordination between economic and environmental development of the three major urban agglomerations had changed from decentralization to agglomeration. (5) Regarding the type of development, the economically developed cities tended to develop simultaneously with the environment. (6) Energy consumption, progress in science and technology, investment in fixed assets, dependence on foreign investment and ownership structure have impacts on the degree of coordination between economic and environmental development of the three urban agglomerations as a whole and each urban agglomeration, but the significant degree of the influence of each factor is different.
中国三大城市群经济与环境协调度时空特征及影响因素
DOI:10.11821/dlyj020181241
[本文引用: 3]
采用熵值法、泰尔指数、空间自相关、马尔科夫链等方法,分析2006—2016年中国京津冀、长江三角洲、珠江三角洲三大城市群经济与环境协调度的时空格局特征,并运用Tobit模型探讨其影响因素。结果表明:① 研究期内三大城市群经济与环境协调度持续增长,珠三角协调度最高,长三角协调度增速最快;② 三大城市群内部城市之间的差异波动减小,珠三角城市群的减小幅度最小;③ 三大城市群经济与环境协调等级演化具有一定的路径依赖,但随时间推移有向高一级状态转移趋势;④ 行政级别较高的城市及部分沿海沿江发达城市的经济与环境协调度持续处于较高水平;⑤ 三大城市群经济与环境协调度空间特征由分散走向集聚;⑥ 经济发达的城市经济与环境趋向于“同步发展”;⑦ 能源消耗水平、科学技术水平、固定资产投资强度、外资依存度和所有制结构对三大城市群的经济与环境协调度具有影响,但各因素影响的显著程度有差异。
Environmental Impacts of a North American Free Trade Agreement
Economic growth and the environment
DOI:10.2307/2118443 URL [本文引用: 1]
Empirical tests and policy analysis of environmental degradation at different stages of economic development
Decoupling analysis between economic development and resources and environment of the Yangtze River Delta
长江三角洲地区资源环境与经济增长脱钩分析
Pattern evolution of economy-environment coordinated development in the Changjiang River Economic Belt
DOI:10.13249/j.cnki.sgs.2016.09.014
[本文引用: 2]
Resources and environment are material conditions of economic development and foundation of human survival, which can promote economy development, both hinder economy development sometimes. In the long-term practice and study, people gradually realize the importance of coordinated development relationship between economy and environment. In recent years, the Changjiang River Economic Belt (CREB) becomes national development strategy, which ought to take task of driving economic development and shoulder responsibility of ecological environment protection. In this article, we firstly evaluate space and time patterns of economic-environmental coordinated development in CREB, and then analyze industrial pollution emissions and environmental quality situation of CREB. Results show below. Economic-environmental coordinated development degree reveals spatial differences that degree of the eastern CREB is bigger than central and eastern regions, and regions along the Changjiang River is higher than other regions. Regions with high coordinated development degree are mainly located in the Changjiang River Delta and parts in the capital cities of central and eastern CREB. Otherwise, regions with low coordinated development degree mainly are located in Chongqing, central Hubei Province, the northern Anhui Province and the southwestern Yunnan Province. Industrial wastewater discharges mostly in Chongqing, Suzhou and Hangzhou. Cities with coordinated development degree declined mainly are located in Jiangxi Province and Sichuan Province. Economic status of cities in the core of Changjiang River Delta is still prominent, but that of peripheral cities in the Changjiang River Delta is in a downward trend; and economy level rank of some cities in the central and western CREB rises significantly. Chongqing, Suzhou and Hangzhou are the regions which discharge industrial wastewater emissions mostly. Regions with most industrial SO2 emissions reveal three concentrated areas where are “Z” glyph area in the Changjiang River Delta, southwest area and central area. Shanghai, Hangzhou, Nanjing, Nantong, Xuzhou discharge industrial fumes emissions mostly. Cities with poor air quality are located in peripheral Changjiang River Delta and central and eastern CREB along the Changjiang River. Section water quality of Changjiang River upstream and downstream is poorer; nevertheless that in middle is better. Three suggestions put forward for CREB development: 1) To shoulder the dual responsibility of economic development and environmental protection and innovate system and mechanism of CREB development (e.g. green GDP). 2) To promote downstream urban economic transformation and upgrading and foster new economic growth poles in the upstream and midstream of the Changjiang River. At the same time, cities in the upstream and midstream should transfer concept of economic development from “race to bottom” to “race to up” and avoid serious pollution transfer in the industry transfer process. 3) To implement the most strict management and legal system and build demonstration belt of ecological civilization.
长江经济带经济—环境协调发展格局及演变
DOI:10.13249/j.cnki.sgs.2016.09.014
[本文引用: 2]
通过经济与环境系统的协调发展度评估,分析了长江经济带经济环境协调发展的时空演变格局,并对经济带经济发展、环境污染与环境质量的格局与态势展开探讨。研究表明:经济带协调发展度空间差异显著,东部地区明显大于中西部地区,沿江地区高于非沿江地区。高度协调型主要分布在长三角地区及少数中西部省会城市;高度失调型主要分布在重庆、皖北、滇西南、鄂中等地区;江西与四川是协调型转为失调型的集中地区。长三角核心城市经济地位依然凸显,但长三角边缘地区城市经济位序呈下降趋势,中西部地区部分城市经济位序上升明显。工业废水排放以重庆、苏州、杭州为最多,工业SO<sub>2</sub>排放呈现3大集中地带。城市空气质量较差的是长三角边缘地区以及中西部沿江地区,城市空气质量总体上与工业SO<sub>2</sub>排放、工业烟尘排放在空间格局上较为吻合。长江干流断面水质上游(川滇渝)与下游(苏沪)较差,一定程度上反映了沿江地区工业废水排放对长江水质的影响。最后,从树立发展与保护双重使命,创新经济带开发体制机制;推进下游城市经济转型升级,培育中上游新的经济增长极;落实最严格的管理制度,共建生态文明示范带等方面提出发展建议。
Spatial effects of economic growth, energy consumption and environmental pollution in the provinces of China: An empirical study of a spatial econometrics model
DOI:10.1002/sd.2042 URL [本文引用: 2]
Study on the evolvement of the relationship between industrial wastewater discharge and economic growth in Jiangsu Province
DOI:10.11821/yj2007050009
[本文引用: 3]
Industrial wastewater discharge is the most important source of water pollution in China, and the water environment in humid regions has burdened heavily in the process of industrialization. This paper analyzed the discharge characteristics of industrial wastewater from 1980 to 2004 in Jiangsu Province, which is located in the eastern developed area of China, the relationship between the discharge amount and the economic growth, and the factors influencing discharge change. The result showed that because of the steady development of economic growth, the amount of industrial wastewater has increased slowly with some fluctuations since 1980, while the discharge intensity decreased. Compared to the increase rate of GDP in Jiangsu during the same period, the growth rate of wastewater was much slower. The source of industrial wastewater came mainly from both manufacturing sector and energy producing sector. Nanjing city, three cities in southern Jiangsu, and nine cities in cemtral-northery Jiangsu possessed about 1/3 of the total annual wastewater discharge of the province each.The relationship between industrial wastewater and economic growth was also simulated adopting the Environmental Kuznets Curve model. The studies argued the relationship between industrial wastewater discharge and GDP per capita was an inverted U-shaped+U-shaped model in 1980-1996, while inverted U-shaped model in 1997-2004. Simulation reveals that the discharge amount tends to climb up in a short period and then declines with the economic development. Applying decomposition analysis, factors influencing industrial wastewater discharge in the periods of 1997-2000 and 2001-2004 were decomposed into generalized technical effect (GTE), scale effect and structure effect. The result showed that GTE and scale effect were the most important factors determining discharge change, while GTE had crucial function on pollution control.Stimulation of the enterprises-induced pollution suggests that the environmental policy should place emphasis on enhancing the contribution of GTE in Jiangsu province in the future.
江苏省工业废水排放与经济增长的动态关系
The relationship between industrial waste discharge and economic growth in Shanxi, China
山西省工业废弃物排放与经济增长之间的关系分析
Towards greater socio-economic equality in allocation of wastewater discharge permits in China based on the weighted Gini coefficient
DOI:10.1016/j.resconrec.2017.08.023 URL [本文引用: 1]
On the relationship between the atmospheric pollutant emission and industrial development based on EKC in Hangzhou
城市大气污染物排放与产业发展关系研究: 基于杭州市EKC曲线的实证分析
The relationship between GDP per capita and atmospheric pollution in Harbin
哈尔滨市人均GDP和大气污染的关系研究
Atmospheric consequences of trade and human development: A case of BRIC countries
DOI:10.1016/j.apr.2016.06.003 URL [本文引用: 2]
Do export and FDI aggravate environmental pollution in resources-based cities? An empirical analysis based on panel data of 285 prefecture cities in China
出口贸易和FDI加剧了资源型城市的环境污染吗? 基于中国285个地级城市面板数据的经验研究
FDI and environmental degradation: The role of political institutions in South Asian countries
DOI:10.1007/s11356-020-09464-y URL [本文引用: 2]
Spatio-temporal modelling of residential exposure to particulate matter and gaseous pollutants for the Heinz Nixdorf Recall Cohort
DOI:10.1016/j.atmosenv.2014.03.052 URL [本文引用: 1]
Regional disparity of environmental pollution source and its socio-economic influencing factors: Based on the cross-section data of 339 cities at prefecture level or above in China
DOI:10.11821/dlxb201611004
[本文引用: 2]
Based on the cross-section data of pollutant discharge and socio-economic development in 2012, by using the indicators of total discharge of COD and SO2 and various sources, the spatial differentiation and agglomeration effects of pollutant discharge are measured quantitatively in 339 cities at prefecture level or above in China. Meanwhile, the socio-economic drivers of environmental pollution are estimated through the econometric model, and some suggestions are put forward to reduce and control pollutant discharge. The results show that: (1) The regional differences of the structure of pollutant source are of great significance in China. Specifically, the types of water pollutant sources are mainly included in the region dominated by agricultural source, the region dominated by urban domestic source, and in the region jointly dominated by agricultural and urban domestic source, with the proportions of these regions being 35.40%, 33.92% and 25.66%, respectively. Among them, the discharge intensity of water pollutant is the highest in the region dominated by agricultural source, which are mainly located in North and Northeast China. Meanwhile, the types of air pollutant sources in China are mostly involved in the region absolutely dominated by industrial source, which accounts for 74.63% and is distributed in the vast area of China in addition to the Qinghai-Tibet Plateau. (2) Single and bivariate LISA cluster maps of total discharge and various sources indicate that the agricultural source makes contribution to the spatial agglomeration of high intensity discharge of water pollutants, while the industrial source leads to the concentrated discharge of air pollutants. Especially, in the Bohai Rim region and its economic hinterland, the structure of pollutant sources strengthens the agglomeration effects of pollutant discharge intensity. (3) By means of OLS estimation for nationwide regression model, it is demonstrated that population size, urbanization rate and economic growth are the main driving factors of environmental pollution, and population size is the key factor in China. Moreover, in terms of regression models of regional types, the economic development level makes different contributions to pollutant discharge in various regions, which shows a positive effect on the air pollutant discharge in the region dominated by industrial source, while shows a negative effect on the water pollutant discharge in the region dominated by urban domestic source. In addition, the degree of industrialization has positive influence on the air pollutant discharge in the region absolutely dominated by industrial source.
中国环境污染源的区域差异及其社会经济影响因素: 基于339个地级行政单元截面数据的实证分析
DOI:10.11821/dlxb201611004
[本文引用: 2]
基于2012年环境污染物排放和社会经济截面数据,选取化学需氧量、二氧化硫及污染源结构指标,定量研究中国339个地级行政单元环境污染源的空间分异和集聚效应,解析环境污染源及排放空间格局的影响因素,并提出污染防控措施与综合治理建议。结果表明:① 环境污染源结构区域差异显著,水环境污染源以农业源主导型、城镇生活源主导型、城镇生活和农业源复合型为主,三者比重分别为35.40%、33.92%和25.66%,农业源主导型排放强度最高,主要分布于华北和东北地区;大气环境污染源以工业源绝对主导型为主,其比重为74.63%,分布于除青藏高原区的广大区域。② 农业源主导使水污染物集聚式排放加剧,工业源主导则促进了大气污染物集聚式排放,特别在环渤海及其经济腹地区域,污染源结构强化了污染物排放的空间集聚效应。③ 人口规模、城镇化水平和经济增长速度是污染物排放的主要驱动因素,其中以人口规模影响最为显著;经济发展水平在区域模型中呈现不同的影响效应,对工业源主导型区域的大气污染物排放呈正向影响,而对城镇生活源主导型区域的水体污染物排放具有抑制作用;工业化程度对工业源绝对主导型区域的大气污染物排放正向影响显著。
Spatio-temporal differentiation and influencing factors of urban industrial pollution in China based on multi-scales: 2005-2015
DOI:10.11821/dlyj020180480
[本文引用: 4]
Industrial pollution, as one of the major issues closely related to human health, social progress and sustainable development, has drawn a great concern for global vision. This paper uses the methods of coefficient of variation, Theil index, EDSA and SDM model to analyze the spatio-temporal differentiation and the influencing factors of urban industrial pollution (UIP) in China from region-urban agglomeration-urban scales, aiming to provide reference for formulating environmental policies and promoting the development of ecological civilization. The results show that: (1) China's UIP index was declining in fluctuations in 2005-2015, but the overall inequality presented an expanding trend. The industrial pollution index respectively presented the features of "high in the east and low in the west, clustering, and grade-difference" at the regional, urban agglomeration, and urban scales, and the pollution difference of each scale was significant. The gravity center curve of UIP was biased towards the east and showed a southward shift. (2) China's UIP types had transferred from simple shift to complex shift. The pollution pattern of "Eastern>Central>Northeast>West" remained unchanged at regional scale. Urban agglomeration-scale pollution exhibited a pattern of transition from north to south and from inside to outside. Urban-scale pollution presented an evolutionary pattern of shrinking from the center to the periphery and fragmentation to concentration distribution, and it had a certain spatial dependence. (3) There were differences in the influencing factors of industrial pollution at multi-scales. Urbanization rate and industrial structure had significant effects on industrial pollution at the three scales, population density, energy intensity and environmental regulatory intensity, which all had significant impact on industrial pollution at regional and urban scales, the level of industrial development and foreign capital only had significant influence on industrial pollution at regional scale, while the level of science and technology had no significant impact on industrial pollution at the three scales. Finally, we put forward some countermeasures and suggestions to reduce the UIP emissions.
基于多尺度的中国城市工业污染时空分异及影响因素
DOI:10.11821/dlyj020180480
[本文引用: 4]
工业污染作为影响人类健康、社会进步以及可持续发展的热点问题,已引起全球视野的高度关注。采用变异系数、泰勒指数、EDSA及SDM模型等方法,从大区-城市群-城市尺度探析了中国城市工业污染的时空分异特征及影响因素,旨在为政府制定环境政策及推动生态文明建设提供参考。结果发现:① 2005—2015年中国城市工业污染指数总体呈波动下降趋势,但污染差异逐趋增大;大区、城市群、城市尺度的工业污染指数分别呈现“东高西低、集群化、级差化”特征,且各尺度污染差异显著;工业污染重心偏向东部并呈现南移态势。② 中国城市工业污染类型转移由简单转移过渡为复杂转移;大区保持“东部>中部>东北>西部”的污染格局不变;城市群污染呈现由北向南、由内向外跃迁格局;城市污染呈现由中心向外围缩减、碎片化向集中分布格局,且存在一定的空间依赖性。③ 各尺度工业污染的影响因素存在差异,城市化率与产业结构对3个尺度工业污染均有显著影响,人口密度、能源强度和环境管制强度对大区和城市尺度工业污染影响显著,工业发展水平和外资水平仅对大区尺度工业污染产生显著影响,而科技水平对3个尺度的工业污染均未产生显著影响。最后,提出了降低城市工业污染排放的对策建议。
Decomposition analysis of air pollution abatement in China: Empirical study for ten industrial sectors from 1998 to 2009
DOI:10.1016/j.jclepro.2013.06.059 URL [本文引用: 2]
The spatial characteristics and spatial effect of industrial pollution agglomeration in Lanzhou-Xining urban agglomeration
兰州—西宁城市群工业污染集聚格局及其空间效应
Intrinsic correlation among economic structure, growth mode and environmental pollution: Empirical analysis based on the TVP-VAR model
增长方式与环境污染的内在关联研究: 基于时变参数向量自回归模型的实证分析
Is decoupling GDP growth from environmental impact possible?
Study on the effect of decomposition factors of industrial wastewater discharge in China based on LMDI method
基于LMDI方法我国工业废水排放分解因素效应考察
The relationship between pollutant emission and economic development in Shandong province
DOI:10.11820/dlkxjz.2010.03.013
[本文引用: 1]
<p>With the Environmental Kuznets Curve(EKC), the relationship between environmental pollutant emission and economic development in Shandong Province was studied in this paper. The environmental pollution indexes included the effective emissions of industrial wastewater, SO2, smokes, and industrial total solid wastes. Based on the cubic polynomial regression analysis with GDP per capita as independent variable, EKC model was established to describe the changing trend of environmental pollution indexes from 1981 to 2006. The main results are as follows: (1)The Environmental Kuznets Curves of all of the four environmental pollution indexes present an N-shaped pattern. (2) Emissions of industrial wastes have passed through the peak turning points of Environmental Kuznets Curves, which means environmental pollution has been improved in recent years. During the period from 2004 to 2006, the environmental pollution is situated at the valley turning point, which means the emissions of industrial waste may rebound in the future. (3) The complex interactions are determined by such two characteristics as industrial structure and environmental protection policy. For sustainable development, industrial structure should be optimized to reduce the proportion of pollution industries, meanwhile, policies in finance, taxation, and environmental protection should be improved and investment for pollution prevention should be increased.</p>
山东省污染物排放与经济发展水平的关系
Exploring the source of economic growth under energy conservation and emission reduction constrain: An empirical study based on BDDFM
节能减排约束下经济增长动力探究: 基于BDDFM的实证研究
Urban tourism destination personality and its cultural landscape representation via machine learning: A case study of Nanjing
DOI:10.11821/dlxb201710012
[本文引用: 1]
Tourism destination has both material and spiritual attributes. Compared to the material attributes of place, the spiritual attributes are more abstract, which leads to the difficulty in description and measurement for scholars. This may be the main reason for the scarcity of research in this direction. Ekinci and Hosany proposed the concept of 'tourism destination personality' and used Aaker's brand personality scale to measure destination personalities that can be viewed as a pioneering work for investigating spiritual aspects of tourism destination. However, as a new direction, most research on tourism destination personality has followed the way of brand personality research, and moreover, it has not touched some in-depth questions such as the representation and its mechanism referring to tourism destination personality. In view of this, taking urban tourism destination as an example, this paper aims to design a personality scale for urban tourism destination, and to find urban tourism destination personality traits and their landscape representation mechanism. Nanjing is selected as the case in this study. A questionnaire survey was conducted in 2015, and 789 valid questionnaires were finally collected. Machine learning, as an intelligent data analysis tool, is used in this study. By analyzing the collected data, it can be concluded that: (1) Urban tourism destination personalities can be divided into four dimensions, such as 'attitude', 'glamour', 'disposition' and 'capability'. (2) Urban cultural landscapes are important in representing urban destination personalities, and can be divided into five dimensions, i.e., 'modern space landscape', 'traditional space landscape', 'ecological landscape', 'social landscape' and 'landscape for living'. (3) The effects of urban cultural landscapes in representing urban tourism personalities are quite different. This study provides a conceptual framework and method for tourism destination personality research. The findings provide new insights for human-environment interaction from the spiritual perspectives.
基于机器学习的南京市旅游地个性及其文化景观表征
DOI:10.11821/dlxb201710012
[本文引用: 1]
旅游地具有物质和精神双重属性。鉴于旅游地精神属性在量化表达和测量方面的困难,以往旅游地研究较少涉及。旅游地个性概念的提出为旅游地精神属性研究打开了思路。由于开展时间不长,当前旅游地个性研究大多基于营销学中的品牌个性研究思路展开,缺乏对地方适用性的考量,且尚未深入到对个性表征形式及表征机制的探讨。基于此,从地理学视角出发,选取城市旅游地作为研究对象,着眼地方特性,系统构建城市旅游地个性量表,在此基础上,开展针对案例地城市南京的个性测量和分析,并以城市文化景观作为表征媒介,深入探究城市旅游地个性的景观表征形式及表征机制。研究发现:城市旅游地个性主要包含态度、气质、性格、能力四大特征;城市文化景观是城市旅游地个性的重要表征媒介,包含现代空间景观、传统空间景观、生态景观、生活景观、社会景观五大维度;以上景观维度及其所辖景观元素在表征城市旅游地个性方面发挥不同作用。研究过程及结论为包括旅游地在内的地方精神属性研究提供了一种概念框架和方法体系,是对精神层面人地关系认识上的丰富。机器学习这一智能化探索型数据分析手段的运用为处理地理学中普遍存在的高维非线性噪声数据提供了有力的方法支撑。
Impact of industrial pollution on labor agglomeration in China
DOI:10.13249/j.cnki.sgs.2019.10.014
[本文引用: 1]
Based on the data of 286 cities at or above the prefecture level in China from 2003 to 2016, the evolutionary characteristics and internal relations of industrial pollution and spatial distribution of labor force were studied, and then the regional income level and industrial agglomeration were taken as threshold variables to study the impact of industrial pollution on labor force agglomeration. The results show that: 1) The center of gravity of industrial pollution and labor force moves backwards in the direction of movement, the center of gravity of industrial pollution moves northward as a whole, and the center of gravity of labor force moves southward as a whole. 2) Industrial pollution emissions will lead to the reduction of labor concentration level, with the increase of regional income level, high pollution level leads to the decline of labor concentration level is more obvious. 3) When industrial agglomeration is taken as the threshold variable, the impact of industrial pollution on labor agglomeration has obvious regional differences. The labor agglomeration level in China and the eastern region first decreases and then increases. The central region has a positive effect of gradual increase, while the western region has a negative effect of gradual decrease.
中国市域工业污染对劳动力集聚的影响研究
DOI:10.13249/j.cnki.sgs.2019.10.014
[本文引用: 1]
基于2003~2016年中国286个地级及以上城市数据,研究工业污染和劳动力空间分布的演化特征及内在联系,继而将地区收入水平和工业集聚作为门槛变量研究工业污染对劳动力集聚影响。结果表明:①工业污染和劳动力的重心在移动方向上背向而驰,工业污染重心整体向北移动,劳动力重心整体向南移动,工业污染与劳动力的空间分布演化特征与二者相应的重心移动轨迹相契合。②工业污染会造成劳动力集聚水平降低,且随着地区收入水平的提高,高污染水平导致劳动力集聚水平下降的现象愈发明显。③以工业集聚作为门槛变量时,工业污染对劳动力集聚的影响存在明显的区域差异性,全国和东部地区劳动力集聚水平呈现出先降低后升高特征,中部地区为逐步升高的正向效应,西部地区则是逐步降低的负向效应。
Changing distribution of industrial pollution and its driving forces in the context of economic transition: A case study of the Yangtze River Delta, China
经济转型背景下工业污染时空格局演变及其驱动因素研究: 以长江三角洲地区为例
Quantitative investigation of the coordinated development of ecology-economy-society in forest resource-based city: A case study of Yichun, Heilongjiang province
林业资源型城市生态—经济—社会协调发展的定量测度: 以黑龙江省伊春市为例
City hierarchies and the distribution of city size
DOI:10.1086/449769 URL [本文引用: 1]
The rise, fall, and revival process of allometric scaling analysis in urban studies
DOI:10.11821/yj2013060007
[本文引用: 1]
The allometric scaling analysis in urban studies originated from biology and general system theory.At first,it was employed to analyze the allometric relation between urban and rural population associated with urbanization.Before long,the studies on the scaling relation between urban area and population became the mainstream of the allometric analysis.The chief aim is to reveal the relationship between size and shape of cities.But a dimension conundrum arose.Urban area can be regarded as a 2-D measurement,and urban population used to be treated as a 3-D measurement.Thus,according to the principle of dimensional consistency,the scaling exponent of urban area and population should be 2/3. However,it does not conform to reality.Then,urban population was treated as a 2-D measurement.If this was true,the allometric scaling exponent should equal 1.However,this does not yet tally with the actual situation.Geographers and city scientists were placed in a dilemma whether to treat urban population size as a 2-D or a 3-D measurement because the observed scaling exponent values always come between 2/3 and 1.The geographical students failed to extricate themselves from the theoretical predicament before the introduction of the concept of fractional dimension.The rapid rise of fractal geometry and complexity theory results in the rejuvenation of alloemetric analysis of cities associated with scaling law.Now, allometry has been applied to urban form,urban ecology,urbanism,urban dynamics,and urban systems.All of the applications are the bases of studies on urbanization.One of the most significant research directions of allometry in urban studies in future may be the allometric scaling analysis in urbanization.
城市异速标度研究的起源、困境和复兴
Urban land area and population growth: A new scaling relationship for metropolitan expansion
DOI:10.1080/00420980701471943 URL [本文引用: 1]
Allometric relationship and development potential comparison of ports in a regional cluster: A case study of ports in the Pearl River Delta in China
DOI:10.1016/j.tranpol.2019.10.018 URL [本文引用: 1]
Urban allometric growth in China: Theory and facts
DOI:10.11821/xb200904002
[本文引用: 1]
Based on a review on urban allometric equation, this paper analyzes the allometric growth relationship between urban area and urban population in China by using the data of the urban built-up area and the total population of cities and towns in 1990, 2000 and 2005. After an in-depth discussion of the standard value of the scaling factor, the paper concludes that urban growth in China is negative allometry in 1990 and positive one in 2000 and 2005. Sample cities in the eastern and western China also show the same law. In contrast to this, cities in central China maintain the original proportion of built-up land growth with population growth; however, they show positive allometry in 2005 because of the promotion policy for central China. The conclusion is closely related to the changes in migrant population, housing system reform and the rapid expansion of development zones.
中国城市异速增长分析
Research on city-size distribution and allometric growth in Jiangsu province based on fractal theory
DOI:10.11821/yj2011120004
[本文引用: 1]
With the acceleration of urbanization,the evolution of the urban systems tends to be more complicated.Working on a major database of regional non-agricultural population,built-up land acreage of cities and counties in Jiangsu over 1996-2008,the study uses methods of rank-size rule,law of allometric growth and its multi-fractal property to analyze the fractal feature of city-size distribution,structural capacity,index scale and degeneration of population-area allometric growth.The results indicate that urban system of Jiangsu Province is now in good gear,its rank-size structure is experiencing a mutation from centralization to decentralization,large and medium-sized cities are the main supporting space for urbanization process.The allometric growth relationship between land and population is in trends of degeneration at provincial level,which turns negative to positive after 2001.Scale factors of allometric growth of Nanjing,Suzhou and Xuzhou have a mark significantly higher than those of other cities,indicating a faster spatial expansion compared with population growth in these cities.In the meantime,relationship between land and population needs further discussion.Complex patterns resulting from evolution of the urban system make higher demands for developing a new-type urbanization with its own characteristics in Jiangsu.
基于分形理论的江苏省城市规模分布与异速生长特征
City-size distribution and allometric growth in Xinjiang based on fractal theory
基于分形理论的新疆城市规模分布及异速生长特征研究
A working guide to boosted regression trees
DOI:10.1111/j.1365-2656.2008.01390.x
PMID:18397250
[本文引用: 1]
1. Ecologists use statistical models for both explanation and prediction, and need techniques that are flexible enough to express typical features of their data, such as nonlinearities and interactions. 2. This study provides a working guide to boosted regression trees (BRT), an ensemble method for fitting statistical models that differs fundamentally from conventional techniques that aim to fit a single parsimonious model. Boosted regression trees combine the strengths of two algorithms: regression trees (models that relate a response to their predictors by recursive binary splits) and boosting (an adaptive method for combining many simple models to give improved predictive performance). The final BRT model can be understood as an additive regression model in which individual terms are simple trees, fitted in a forward, stagewise fashion. 3. Boosted regression trees incorporate important advantages of tree-based methods, handling different types of predictor variables and accommodating missing data. They have no need for prior data transformation or elimination of outliers, can fit complex nonlinear relationships, and automatically handle interaction effects between predictors. Fitting multiple trees in BRT overcomes the biggest drawback of single tree models: their relatively poor predictive performance. Although BRT models are complex, they can be summarized in ways that give powerful ecological insight, and their predictive performance is superior to most traditional modelling methods. 4. The unique features of BRT raise a number of practical issues in model fitting. We demonstrate the practicalities and advantages of using BRT through a distributional analysis of the short-finned eel (Anguilla australis Richardson), a native freshwater fish of New Zealand. We use a data set of over 13 000 sites to illustrate effects of several settings, and then fit and interpret a model using a subset of the data. We provide code and a tutorial to enable the wider use of BRT by ecologists.
Driving forces analysis of urban expansion based on boosted regression trees and Logistic regression
基于增强回归树和Logistic回归的城市扩展驱动力分析
Variation analysis of daily PM2.5 concentrations based on boosted regression tree: A case study in Changzhou
基于增强回归树的城市PM2.5日均值变化分析: 以常州为例
Phenomenon analysis and theoretical reflection of China's "over de-industrialization"
中国“过度去工业化”现象剖析与理论反思
Evolution characteristics and driving factors of China's urban human land allometric coefficient
中国城市人地异速关系演变特征及其驱动因素
Empirical decomposition and peaking pathway of carbon dioxide emissions of China's manufacturing sector: Generalized divisia index method and dynamic scenario analysis
中国制造业碳排放的经验分解与达峰路径: 广义迪氏指数分解和动态情景分析
Spatial-temporal evolution patterns and convergence analysis housing price-to-income ratio in Yangtze River Delta
DOI:10.11821/dlyj020190603
[本文引用: 1]
The housing price-to-income ratio is an important index to measure the health status of real estate and to evaluate residents' housing affordability. Taking 307 districts and counties in the Yangtze River Delta from 2008 to 2018 as research units, this paper explores the overall distribution characteristics of the housing price-to-income ratio by using the numerical-rank rule and trend surface analysis, and uses LISA time path to analyze the spatial and temporal dynamic characteristics of the housing price-to-income ratio, and tests the convergence of the regional housing price-to-income ratio. The results show that: (1) The housing price-to-income ratio in the study area is on the rise in general, that is, the growth rate of urban residents’ income level is much lower than that of residential prices, and the housing price-to-income ratio is spatially high in the east and low in the west, and high in the south and low in the north, while Shanghai, Zhejiang, Jiangsu and Anhui are decreasing in turn. (2) The spatial structure of housing price-to-income ratio in Shanghai and southern Zhejiang is more dynamic, while that in Jiangsu and Anhui is more stable; the spatial evolution of housing price-to-income ratio has a strong spatial locking effect and spatial integration as a whole. (3) There is no σ convergence in the housing price-to-income ratio, but there is a significant absolute β convergence in each time period, and there is also a club convergence phenomenon in all the provinces in the study delta. The rate of convergence slows down over time, and the regional difference in the rate of convergence is positively correlated with the level of housing price-to-income ratio. The change of housing price-to-income ratio in urban agglomerations plays an important indicative role in the flow of residents, and has diffusion effect and siphon effect. The government should guide the reasonable housing demand and consumption mode, improve the income distribution system and narrow the income gap among residents, so as to realize the goal of "the residents have their own homes, and the residents can live in peace". Strengthening the integration of real estate market in urban agglomerations will help promote the process of regional economic integration, and it is an effective way to promote the development of regional integration of urban agglomerations.
长三角房价收入比时空演变格局及收敛性研究
DOI:10.11821/dlyj020190603
[本文引用: 1]
房价收入比是衡量房地产健康状况和探测居民住房支付能力的重要指标。以2008—2018年长三角307个区县为研究单元,运用数值-位序法则和趋势面分析对房价收入比的总体分布特征进行探究,利用LISA时间路径分析房价收入比的时空动态性特征,并检验区域房价收入比的收敛性。结果表明: ① 长三角房价收入比总体上呈上升趋势,空间上表现为东高西低、南高北低的格局,上海、浙江、江苏和安徽依次降低。② 上海和浙江南部房价收入比的空间结构更具动态性,而江苏和安徽更加稳定;长三角房价收入比的空间演化整体上具有较强的空间锁定效应和空间整合性。③ 长三角区县房价收入比整体上不存在σ收敛,但各时间段上均存在显著的绝对β收敛,且各省份内部也均存在着俱乐部收敛现象。城市群房价收入比的变动对居民的流动有着重要的指示作用,并具有扩散效应和虹吸效应。加强城市群房地产市场一体化建设,是促进城市群区域一体化发展的有效途径。
Evolution of Chinese industrial geography since reform and opening-up
DOI:10.11821/dlxb201910002
[本文引用: 1]
Looking back on the 40 years of reform and opening-up, Chinese industry has achieved rapid growth and development, and Chinese industrial geography has been profoundly reshaped under the profound institutional evolution environment. Chinese industry has undergone a process of spreading in the inland to agglomeration in the coastal areas and then dispersion towards the inland again. However, the geographical pattern of different types of industries is influenced by different forces, leading to differences in the spatial restructuring process. Since the beginning of reform and opening-up in 1978, Chinese industries have been increasingly more agglomerated at different geographical scales, but still much lower than the European Union and the United States. Industrial agglomeration and decentralization drive industrial migration at different scales. In spite of the heterogeneity of industries, industrial migration has generally changed from a scattered layout to an agglomeration pattern in coastal areas; and in recent years, industrial migration has gradually shifted from developed eastern provinces to central provinces, indicating a new round of industrial migration. Remarkable regional industrial entries and exits have promoted the evolution and diversification of local industries. Overall, Chinese industrial space tends to be more complex and concentrated, the links between industries are further strengthened with a more obvious "path dependence" characteristics of industrial evolution in coastal areas. Theoretically, Chinese economic reform is not only the reform of development mode, but also the reform of institutions in essence. The fundamental triple process of marketization, globalization and decentralization has introduced market forces, local forces, and global forces to reshape Chinese industrial geography. And for the study of Chinese industrial geography, besides continuing to summarize patterns and dynamics from multiple perspectives, it is necessary to reveal the deep-level mechanism of the evolution of industrial geography pattern through phenomena, and evaluate the multiple effects of the reshaping of industrial geographical pattern systematically.
1978年改革开放以来中国工业地理格局演变
DOI:10.11821/dlxb201910002
[本文引用: 1]
回顾改革开放40年,在深刻的制度变革环境下,中国工业实现快速发展,中国工业地理格局也在经济转型中得到重塑。中国工业总体上经历了从内陆扩散到沿海地区集聚,再向内陆转移的过程。但不同类型产业地理格局及变化受制于不同力量,显现出一定的行业差异性。与改革开放之初相比,中国工业在不同地理尺度上呈现出明显的集聚趋势,但集聚程度较欧盟和美国低。产业的聚集与分散驱动不同尺度下的产业迁移,导致区域产业频繁进入和退出,促使地方产业呈现多样化态势,推动中国工业地理格局演变。从经济转型的视角出发,改革开放可概括为市场化、全球化和分权化三个过程,这些过程创造市场力量,激活地方力量,引入全球力量,共同重塑了中国工业地理格局。
Regional market integration and governance mechanism innovation in the Yangtze River Delta
长三角区域市场一体化与治理机制创新
Implication of regionalism and regional integration under the global shift
DOI:10.11820/dlkxjz.2013.07.011
[本文引用: 1]
As one of the important paradigms for regional cooperation, regional integration has been receiving extensive attention from scholars, especially in the field of geography. In today’s globalizing world, regional integration is one of the driving forces that reshape the world’s politics and economies. Especially, a considerable amount of research interest has been focused on how the emergence of regional integration after the World War Ⅱ has affected, and will continue to affect, the global economy. However, it is widely accepted that regionalism is not just a recent phenomenon. There have arisen at least four waves of regionalism since the 19th century, along with the trend of globalization. The first wave occurred during the second half of the 19th century and was characterized by colonization. After World War Ⅱ, regionalism demonstrated some new traits and began to pave a peaceful path. Soon after that, a plethora of regional trade blocs formed against the backdrop of the Cold War. With the advent of the 21th century, the most recent wave of regionalism has arisen in a more globalized context than the earlier ones. Because the current regionalism creates the new forms of regional organization, co-existing with traditional forms of state-led governance at the national level, not only the forces driving the current regionalism but also the context and features of the new regional integration are radically different. Consequently, with the“new regionalism”wave, regional integration has become a multidimensional process with implications for bilateral/multilateral trade liberalization as well as the dimensions of politics, security, culture and institutions. In the meantime, theoretical framework used to analyze the political and economic impact of the implementation of regional integration have been systematically improved; new regionalism, new economic geographies and new institutional economics have been introduced to the analysis of regional governance, spatial equilibrium and institutional construction of regional cooperation. This transformation greatly contributes to diversification of the implications of regional integration, including its agents, content of cooperation and organizational mechanism. Nevertheless, there are some issues to be further studied in future. Based on the development process of regional integration, this paper first differentiates regional integration from other related concepts, and then reviews the developmental path of regionalism in the context of globalization in which regionalism has gone through four stages. At last, by summarizing important economic and political theories about regional integration in the literature, which provide reference and inspiration for the regional study, this paper makes a brief comment on the strengths or weaknesses of those established theories, and raises several questions for the current research on regional integration.
全球化视角的区域主义与区域一体化理论阐释
DOI:10.11820/dlkxjz.2013.07.011
[本文引用: 1]
区域一体化作为重要的区域发展模式, 历来是地理学者关注的焦点。本文通过对区域一体化相关概念的辨析, 回顾区域主义发展历程, 并概括全球化赋予区域一体化的新内涵, 提出目前区域一体化研究的不足之处, 以期为区域经济发展研究提供有益的启示。区域主义与全球化是塑造当今世界经济格局的两种重要的力量, 自19世纪以来, 区域主义就伴随着全球化的趋势产生了4 次思想浪潮的变革;与此同时, 区域一体化的理论趋于系统化, 从早期的关税同盟理论、自由区贸易理论、大市场理论等以国际贸易为重点, 转而向空间、制度等方面扩展, 引入了新区域主义、新经济地理理论和新制度经济学等研究视角。随着区域行为主体的多元化、合作领域的深化、组织机制的复杂化, 形成了全球化背景下区域一体化新的内涵。根据国外的研究进展和国内区域一体化的现实需求, 未来应该对主权国家内部跨界一体化理论、内涵等方面加强研究。
Spatial differentiation of urban housing prices in integrated region of Yangtze River Delta
DOI:10.11821/dlxb202010006
[本文引用: 1]
Since the market-oriented reform of the housing system, China's urban housing prices have risen rapidly, and regional differentiation intensifies. Although the Chinese government has repeatedly emphasized that "housing is for living, not for speculation" the trend of rising prices in cities has not been suppressed, and the spatial differentiation of regional urban housing prices has become highlighted. Spatial differentiation of housing prices is a comprehensive reflection of the urban development gap, or a materialized expression of the differences in urban resource allocation abilities. Taking the integrated region of the Yangtze River Delta as an example, and based on the average urban housing price data of prefecture-level cities, districts, and counties between 2008 and 2018 provided by China Housing Prices, we found that the housing prices experienced three stages, namely, "fast growth", "relatively stable", and "faster growth". When the prices grew, the gap of prices between cities, especially between districts and counties, also grew, that is, integrated development did not bring about the convergence of regional housing prices. The housing prices in core and central cities, like Shanghai, Nanjing, and Hangzhou, grew more quickly, and the gaps between Zhejiang/Southern Jiangsu and Anhui/Northern Jiangsu became more obvious. Similarly, there was a huge gap in the housing prices of different districts and counties in a city. Out of consideration for reducing data error and raising analytical accuracy, and based on clarifying the pattern of spatial differentiation of urban housing prices, this paper mainly takes district and county as analysis units, and discusses the growth of housing prices in different types of districts and counties. According to the characteristics of housing price growth, city level, and location, this paper divides the 327 districts and counties of the Yangtze River Delta into six types: urban areas of core cities, urban areas of central cities, urban areas of developed cities, urban areas of other cities, counties and cities in the core circle, and counties and cities in the peripheral regions. It also discovers that, in the process of regional integration, resources flow more quickly, and high-end elements gather towards a small number of superstar cities. This means that the integrated region presents a faster price growth, a larger gap between core-edge housing prices, and the stronger convergence of similar city clubs. On this basis, we identify the mutual feedback effect of the urban economic and social differences in the integrated region, the flow of resource elements like industry and population, and the spatial differentiation of urban housing prices. The increased difference in regional housing prices will result in the forced upgrade of industries in cities with high housing prices, the loss of low-end manufacturing posts, and the concentration of social wealth to "superstar cities". Finally, in combination with the requirement for high-quality integrated development of the Yangtze River Delta, and the judgment on the rationality of regional urban housing price differentiation, this paper proposes pertinent suggestions to the adjustment and control of urban housing prices.
长三角一体化区域城市房价空间分异的模式与效应
DOI:10.11821/dlxb202010006
[本文引用: 1]
城市住房制度市场化改革以来,中国城市房价整体快速上涨,区域房价分异加剧。区域内部房价空间分异是城市发展差距的综合反映,即城市资源要素综合配置能力差异的物化表达。基于中国房价行情平台提供的2008—2018年地级城市和区县尺度城市房价数据,分析长三角一体化区域房价增长与分异过程,发现区域整体房价呈现快速上涨、相对平稳和再度快速上涨3个阶段,区域房价差异随房价上涨而扩大,上海、杭州和南京等城市房价增长更快,浙江、苏南地区与安徽、苏北地区的房价差距拉大。根据房价增长、城市等级与区位特征,将长三角327个区县划分为核心城市城区、中心城市城区、发达城市城区、其他城市城区、核心圈层县市和外围地区县市6种类型,提出一体化区域城市房价表现为整体上涨相对更快、不同类型区县间差异拉大、同类区县间存在“俱乐部收敛”等增长与分异模式。区域城市房价快速上涨与过度分异,驱使高端产业、人口等资源要素向少数“超级明星城市”集聚,加剧区域不平衡,不利于长三角地区实现更高质量一体化发展。
