

1 引言
生态系统为人类提供的所有惠益称为生态系统服务[1]。作为将自然生态系统和人类社会系统连接在一起的桥梁,生态系统服务在形成和发展过程中受自然环境、社会经济、人类需求等多种因子的影响[2]。同时,生态系统服务之间也存在着复杂的非线性变化,一种生态系统服务的增减会影响另一种服务供给能力的高低,由此产生生态系统服务间此消彼长的权衡关系或相互增益的协同关系[3]。然而,影响因子与权衡/协同关系两个维度对生态系统服务的影响并不是相互独立的,权衡/协同关系同时也受影响因子所驱动[4]。Bennett等[5]将该驱动总结为两种类型:一是驱动因子单独影响某一服务;二是生态系统服务受共同驱动的影响。厘清影响因子与权衡/协同关系对生态系统服务的驱动机制,有助于消除权衡关系的负面影响,实现社会—生态系统的协调可持续发展[6-7]。
生态系统服务及其权衡关系的驱动力分析是当前生态系统服务研究的主要挑战[8]。相关研究主要聚焦于分析环境变量对生态系统服务及其权衡/协同的影响[9],如侯文娟等[10]研究表明地形因子决定了喀斯特地区产流服务的空间异质性;Feng等[11]发现植被类型、海拔、泥沙组成对黄土高原土壤侵蚀控制服务和土壤湿度之间的权衡具有主导影响,坡度和坡位次之;Chen等[12]分析了北京及其周边地区生态系统服务簇的空间分布,表明海拔与物种丰富度直接相关。生态保护红线作为必须强制性严格保护的空间边界[13],其内部生态环境受社会经济、人类需求等因素的影响相对较少,自然环境是该区域生态系统服务变化的核心影响变量。如Gao等[14]研究结果表明植被覆盖度、土地利用分别是北京生态保护红线区土壤流失、产水量的主导因子;降水显著影响北京生态保护红线区土壤保持与植被固碳之间权衡关系的空间分布[15]。上述研究细致分析了生态系统服务或是权衡/协同关系对环境变量时空变化的响应,但是环境变量与服务间关系的交叉联系未能充分考虑,且两个维度的分离研究尚显缺乏。如何精准识别权衡/协同关系的影响变量并予以剔除是定量分离驱动力的关键所在。受环境变量与生态系统服务时空变化的影响,权衡/协同关系的空间异质性突出[16]。地理探测器正是利用空间数据的分层异质性揭示其背后的驱动机制,广泛应用于社会科学、自然科学、环境健康等领域[17],如城市化空间变异的驱动力解析[18],生态环境影响因子定量辨识[19],人类健康风险因子与风险区探测[20]等。本文综合了地理探测器的两大特点:一是定量识别影响权衡/协同关系的环境变量,二是证明环境变量与服务间关系两个维度之间存在交互作用,为后续定量分离两个维度对生态系统服务变化的贡献率奠定基础。
作为国家和区域生态安全的底线和生命线,生态保护红线旨在维护中国重要生态系统的主导功能,增强中国社会经济发展的生态支撑能力[21]。2018年北京市正式发布的生态保护红线包括水源涵养、水土保持等生态功能重要区、水土流失生态敏感区以及市级饮用水源地、森林公园、国家级重点生态公益林等保护地[22]。围绕水土保持、森林固碳等典型服务的研究可为北京生态保护红线不同区域的管理提供针对性建议。北京生态保护红线区分布于北部燕山和西部太行山,山高坡陡的系统不稳定性以及破碎生境的易损性和低恢复性[23]使得红线区生态脆弱性突出,生态环境对气候变化和土地利用变化的响应敏感[24]。同时,山区自然地理环境的巨大空间差异以及环境条件的剧烈变化影响生态过程的形成与发展,进而导致生态系统服务的供给能力和权衡/协同关系呈现显著的变异性[25]:如海拔的梯度变化显著影响产水量和土壤保持的格局分布[26];随海拔和植被覆盖度的升高,产水量和NPP(Net Primary Production)之间的权衡系数显著增大[27]。因此,生态红线区异质景观条件下生态系统服务驱动机制的定量阐释仍是研究的关键[15]。集成分析环境变量和权衡关系两个维度对生态系统服务变化的影响可为严守红线提供针对性科学参考[13]。
基于此,本文选择与北京生态保护红线区主导功能密切相关的土壤保持、产水量、植被固碳3项生态系统服务,综合考虑各项生态系统服务的影响因素,选择海拔、坡度、降水、土地利用强度和植被覆盖度等重要环境因子。首先,基于地理探测器定量识别3项生态系统服务权衡关系的重要影响因子,证明权衡关系和环境变量两个维度之间交互作用的存在性。进而,借助偏相关分析计算剔除极重要因子后生态系统服务之间的净相关关系,比较权衡关系和环境变量两个维度对生态系统服务时空变化的影响程度,为生态系统服务驱动力的定量分离提供科学的研究框架。
2 研究区概况与研究方法
2.1 研究区概况
北京位于华北平原北部(39°28′N~41°05′N, 115°25′E~117°30′E),西部、北部和东北部三面环山,山区面积约占市域总面积的62%,平原、浅山、深山地貌由东南向西北方向过渡分布。北京生态保护红线呈现为“两屏两带”的生态格局。“两屏”指北部燕山生态屏障和西部太行山生态屏障;“两带”为永定河沿线生态防护带、潮白河—古运河沿线生态保护带。北京生态保护红线区的面积为4290 km2,占市域总面积的26.1%,海拔介于-5~2223 m之间(图1)。气候属暖温带半湿润半干旱季风气候,四季分明,年平均气温9.98 ℃,年平均降水量594.24 mm,全年降水的80%集中于6—8月。北京生态保护红线区以林地生态系统为主导,林地分布面积占红线区总面积的75.03%,为山区及平原的居民提供多种服务。根据主导生态功能,北京生态保护红线区可以划分为水源涵养、水土保持、生物多样性维护以及重要河流湿地4种类型[22]。
图1
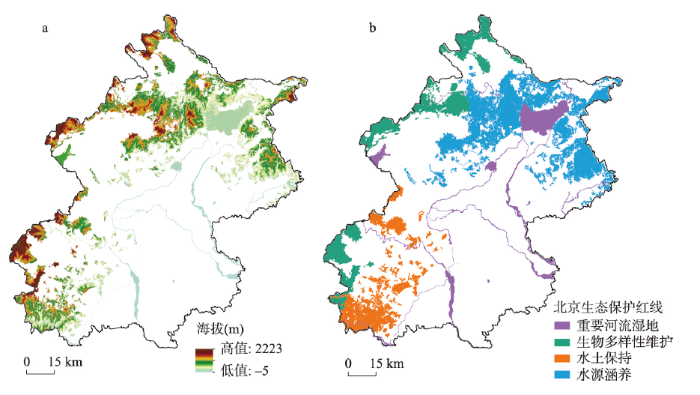
图1
研究区地形和生态保护红线类型
Fig. 1
Terrain and types of Beijing's conservation red line area
2.2 数据来源与处理
DEM(Digital Elevation Model)高程数据来源于Google Earth v6.0.3,空间分辨率为9 m。气象数据来源于国家气候中心(
2.3 研究方法
生态系统服务受环境变量与服务间关系的共同驱动,同时,服务间关系也受环境变量所影响。定量分离驱动力的先决条件在于准确识别权衡/协同关系的影响变量并予以剔除。本文首先利用因子探测器定量识别各服务的影响因子,根据影响程度大小确定主导环境变量;进而考虑主导环境变量对服务间关系的影响:若环境变量同时影响某一对生态系统服务,则该环境变量为该对生态系统服务关系的极重要影响因子;若只影响一种服务则为一般重要因子;均不影响则属于不重要因子。交互作用探测器应用于证明服务间关系与环境变量之间交互作用的存在性。基于此,本文采用偏相关方法剔除极重要影响因子,分析生态系统服务之间的净相关关系并与环境变量的贡献率进行对比。本文的研究思路及技术框架如图2所示。
图2
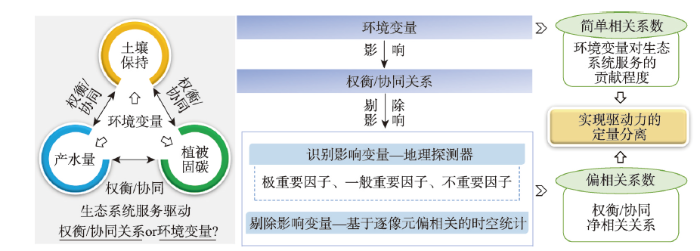
图2
生态系统服务驱动力定量分离的研究框架
Fig. 2
Framework for quantitative separation of ecosystem service drivers
2.3.1 生态系统服务评估方法
本文运用RUSLE模型、InVEST模型和CASA模型分别定量评估研究区的土壤保持、产水量和植被固碳3项生态系统服务的空间格局。为消除气候年际差异和极端气候事件(如“7·21”北京特大暴雨)对环境变量判定的影响,本文模拟并分析了研究区2015—2018年生态系统服务的数值大小与空间分布。模型所需参数和计算过程如表1所示:
表1 生态系统服务模型
Tab. 1
| 生态系统服务 | 模型 | 计算公式 |
|---|---|---|
| 土壤保持 | RUSLE模型[28] | A为土壤保持量(t hm-2 a-1);R为降水侵蚀力因子(MJ mm hm-2 h-1 a-1),考虑到研究区降水的季节性差异,本文采用月降水数据计算R因子,进而得到年尺度数据[29];K为土壤侵蚀力因子(t hm2 h hm-2 MJ-1 mm-1),本文基于土壤属性数据,运用侵蚀力影响计算器(EPIC)计算获得[30];LS为坡长坡度因子,为充分表达研究区山地海拔的复杂性特征[31],本文选取空间分辨率为9 m的DEM计算LS因子;C是植被覆盖与管理因子,本文以NDVI为基础数据进行计算[32];P是水土保持措施因子,本文参考华北平原的研究,根据土地利用类型进行赋值[33];LS、C、P为无量纲。 |
| 产水量 | InVEST模型 产水量模块[34] | Y(x)为研究区栅格单元x的年产水量(mm);AET(x)为栅格单元x的年实际蒸散发量(mm);P(x)为栅格单元x的年降水量。 |
| 植被固碳 | CASA模型[35] | NPP(x, t)为空间位置x在时间t内积累的植被净初级生产力(g C m-2);APAR(x, t)和ε(x, t)分别为空间位置x在时间t内植被吸收的光合有效辐射(MJ m-2)和实际光能利用率(g C MJ-1)。 |
2.3.2 地理探测器
式中:h = 1, 2, …, L为自变量X或因变量Y的分层;Nh和N分别为层h和全区的单元数;
表2 两个自变量对因变量的交互作用类型
Tab. 2
| 判据 | 交互作用 |
|---|---|
| q(X1∩X2) < Min[q(X1), q(X2)] | 非线性减弱 |
| Min[q(X1), q(X2)] < q(X1∩X2) < Max[q(X1), q(X2)] | 单因子非线性减弱 |
| q(X1∩X2) > Max[q(X1), q(X2)] | 双因子增强 |
| q(X1∩X2) = q(X1) + q(X2) | 独立 |
| q(X1∩X2) > q(X1) + q(X2) | 非线性增强 |
2.3.3 基于逐像元偏相关的时空统计
本文在定量筛选生态系统服务重要影响因子的基础上,采用基于逐像元偏相关的时空统计方法计算3项生态系统服务两两之间的偏相关系数。该方法的优势在于可以分析生态系统服务时间序列的变化,也可明晰生态系统服务的空间关系和变化特征[36]。系数为正,两项生态系统服务表现为协同关系,系数为负,则为权衡关系。生态系统服务之间的相关系数与偏相关系数计算公式如下:
简单相关系数:
一阶偏相关系数:
二阶偏相关系数:
式中:ES1与ES2代表两种生态系统服务;r为ES1与ES2之间的相关系数,i、j分别代表栅格数据像元的行、列号,n为栅格数据的时间序列。r12(ij)表示在所有环境变量均发生变化的情况下,ES1与ES2在像元ij上的简单相关系数,同理可求得r13(ij)、r23(ij)等。r12·3(ij)表示在某一环境变量不变的情况下,ES1与ES2在像元ij上的一阶偏相关系数,同理可求得r14·3(ij)、r24·3(ij)等。r12·34(ij)表示某两个环境变量保持不变,ES1与ES2在像元ij上的二阶偏相关系数。
3 结果分析
3.1 生态系统服务的空间分布格局
本文模拟了2015—2018年北京市生态保护红线区的土壤保持、产水量和植被固碳3项生态系统服务(图3),并对其空间分布和动态变化进行分析。从空间分布来看,土壤保持量的高值主要集中在研究区东北部和西南部的高海拔山区。山地地区林地和草地大面积分布,其植被根系与凋落物的抗侵蚀性使得山区的土壤保持能力较强[37]。2015—2018年,土壤保持量的数值范围在0~1700 t hm-2 a-1之间,随时间变化较小,但各年份均值差异较大。对比各红线类型区,水土保持红线类型区内各年份土壤保持量均值均为最高,印证了该红线类型区主导功能的合理性。北京市5条一级河道及“三库一渠”等河湖湿地分布于重要河流湿地红线类型区,该红线类型区受径流侵蚀力的影响,土壤保持量为最低。
图3
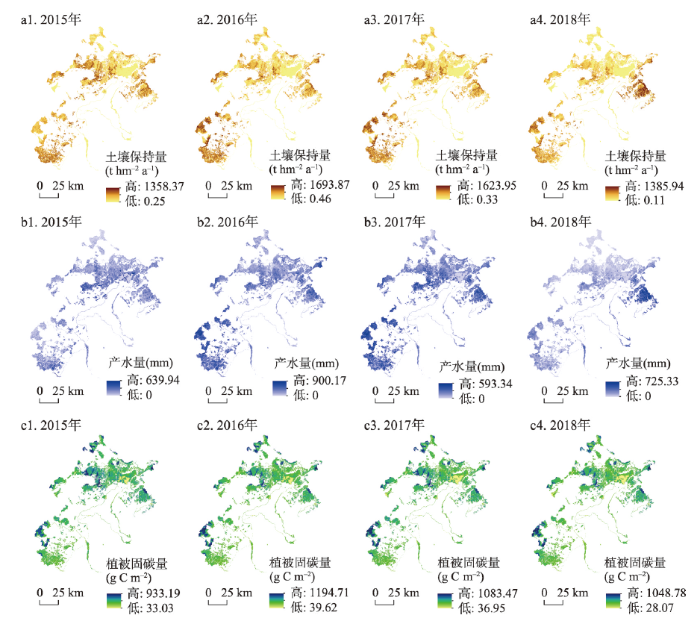
图3
北京生态保护红线生态系统服务空间格局
Fig. 3
Spatial pattern of ecosystem services in Beijing's ecological conservation red line
表3 北京生态保护红线区生态系统服务均值统计
Tab. 3
| 生态系统服务 | 年份 | 北京生态保护红线区 | 水源涵养 红线类型区 | 水土保持 红线类型区 | 生物多样性维护 红线类型区 | 重要河流湿地 红线类型区 |
|---|---|---|---|---|---|---|
| 土壤保持 (t ha-1 a-1) | 2015 | 345.27 | 379.34 | 510.74 | 357.53 | 42.74 |
| 2016 | 542.72 | 487.59 | 878.95 | 713.40 | 50.46 | |
| 2017 | 438.77 | 411.77 | 677.98 | 566.56 | 43.49 | |
| 2018 | 298.54 | 351.53 | 394.99 | 302.66 | 32.68 | |
| 产水量 (mm) | 2015 | 131.92 | 157.08 | 153.93 | 75.57 | 124.24 |
| 2016 | 330.21 | 330.62 | 423.48 | 336.18 | 212.62 | |
| 2017 | 246.92 | 256.64 | 311.55 | 250.39 | 138.20 | |
| 2018 | 143.28 | 184.97 | 135.16 | 89.99 | 114.69 | |
| 植被固碳 (g C m-2) | 2015 | 452.95 | 479.10 | 392.44 | 513.27 | 349.34 |
| 2016 | 516.91 | 532.89 | 451.76 | 618.76 | 379.72 | |
| 2017 | 480.61 | 498.50 | 436.29 | 580.33 | 316.44 | |
| 2018 | 419.44 | 445.56 | 374.40 | 493.48 | 275.07 |
3.2 生态系统服务空间关系的重要因子定量识别
通过比较各环境变量的q值大小确定3项生态系统服务的主导环境变量:海拔、土地利用强度、降水、坡度是土壤保持的主导环境变量;产水量受植被覆盖度、土地利用强度、降水的空间分布所主导;海拔、植被覆盖度、土地利用强度、坡度是植被固碳的主导环境变量(表4)。其中,土地利用强度和降水共同影响土壤保持和产水量的空间分布,是该对生态系统服务空间变化的极重要因子。植被覆盖度可以解释产水量空间分异的19.4%,产水量对土壤保持的空间异质性存在影响,植被覆盖度可通过影响产水量进而影响土壤保持的空间异质性,为一般重要因子。海拔和坡度仅影响土壤保持的空间分布,属于一般重要因子。植被覆盖度和土地利用强度是产水量和植被固碳的主导控制因素,q值达0.4以上,是该对生态系统服务的极重要因子。降水可解释产水量空间分异的28.3%,产水量作为自变量时可解释植被固碳空间分布的22.4%,降水对植被固碳的直接影响较小,但可通过影响产水量间接影响植被固碳,为一般重要因子。海拔和坡度对植被固碳的空间分布具有主导作用,对产水量的影响不显著,属于一般重要因子。海拔、土地利用强度和坡度均显著影响土壤保持和植被固碳的空间分布,是该对生态系统服务的主导控制因素,为极重要因子。降水可通过影响土壤保持而对植被固碳施加影响,属一般重要因子。植被覆盖度对植被固碳空间分异的决定力较强,q值达0.424,而对土壤保持的解释力不显著,属一般重要因子。
表4 生态系统服务的影响变量q值统计
Tab. 4
| 环境变量 | 生态系统服务变量 | ||||||||
|---|---|---|---|---|---|---|---|---|---|
| 海拔 | 植被覆盖度 | 土地利用强度 | 降水 | 坡度 | 土壤保持 | 产水量 | 植被固碳 | ||
| 土壤保持 | 0.233 | 0.074 | 0.133 | 0.116 | 0.530 | - | 0.115 | 0.116 | |
| 产水量 | 0.062 | 0.194 | 0.443 | 0.283 | 0.099 | 0.139 | - | 0.173 | |
| 植被固碳 | 0.318 | 0.424 | 0.289 | 0.053 | 0.192 | 0.149 | 0.224 | - | |
注:q值的显著性检验结果均为p < 0.001。
表5 生态系统服务与环境变量间的交互作用
Tab. 5
| 因变量 | 产水量 | 土壤保持 | 植被固碳 | ||||||
|---|---|---|---|---|---|---|---|---|---|
| 自变量 | 土壤保持∩ | 海拔 | 0.172 | 产水量∩ | 海拔 | 0.318 | 产水量∩ | 海拔 | 0.466 |
| 植被覆盖度 | 0.273 | 植被覆盖度 | 0.164 | 植被覆盖度 | 0.441 | ||||
| 土地利用强度 | 0.502 | 土地利用强度 | 0.220 | 土地利用强度 | 0.332 | ||||
| 降水 | 0.353 | 降水 | 0.206 | 降水 | 0.306* | ||||
| 坡度 | 0.165 | 坡度 | 0.579 | 坡度 | 0.309 | ||||
| 植被固碳∩ | 海拔 | 0.217 | 植被固碳∩ | 海拔 | 0.267 | 土壤保持∩ | 海拔 | 0.363 | |
| 植被覆盖度 | 0.233 | 植被覆盖度 | 0.145 | 植被覆盖度 | 0.464 | ||||
| 土地利用强度 | 0.485 | 土地利用强度 | 0.194 | 土地利用强度 | 0.335 | ||||
| 降水 | 0.459* | 降水 | 0.242* | 降水 | 0.232* | ||||
| 坡度 | 0.218 | 坡度 | 0.566 | 坡度 | 0.233 | ||||
注:*表示因子间的交互作用属于非线性增强类型,其他属于双因子增强类型。
3.3 生态系统服务偏相关系数计算与权衡/协同关系分析
表6统计了生态系统服务之间的简单相关系数和净相关系数的空间均值,结果表明:产水量和土壤保持之间的简单相关系数均值为0.319,剔除降水的一阶偏相关结果以及剔除降水与土地利用强度的二阶偏相关结果显示,产水量与土壤保持之间的相关系数均值显著减小,且减小幅度相同,表明产水量与土壤保持之间的相关关系由降水主导。当剔除土地利用强度只考虑降水的影响时,产水量与土壤保持之间的相关系数均值显著增大且权衡比例明显下降。分别剔除植被覆盖度、土地利用强度以及植被覆盖度和土地利用强度之后,产水量与植被固碳之间的相关关系明显增强,相关系数均值由0.189增长到0.528。同时,产水量与植被固碳之间协同关系的面积比例显著增加,表明植被覆盖度和土地利用强度会抑制产水量与植被固碳之间协同关系的表达。由于海拔和坡度不随时间变化,土壤保持与植被固碳之间的二阶、三阶偏相关系数无法计算,此处只分析3个环境因子的一阶偏相关系数。结果表明,当控制海拔、坡度、土地利用强度任意两个因子不变时,土壤保持与植被固碳之间的权衡关系会受另外一个因子的影响,且权衡面积减小,表明海拔、坡度、土地利用的合理规划有利于土壤保持与植被固碳之间的空间关系向协同优化的方向发展。
表6 生态系统服务空间相关系数均值与权衡/协同面积比例统计
Tab. 6
| 生态系统服务组合 | 剔除因子 | 相关系数 | 权衡比例(%) | 协同比例(%) |
|---|---|---|---|---|
| 产水量—土壤保持 | - | 0.319 | 32.21 | 67.79 |
| 降水 | 0.070 | 46.26 | 53.74 | |
| 土地利用强度 | 0.545 | 16.94 | 83.06 | |
| 降水与土地利用强度 | 0.080 | 46.65 | 53.35 | |
| 产水量—植被固碳 | - | 0.189 | 37.81 | 62.19 |
| 植被覆盖度 | 0.286 | 32.26 | 67.74 | |
| 土地利用强度 | 0.381 | 25.02 | 74.98 | |
| 植被覆盖度与土地利用强度 | 0.528 | 19.69 | 80.31 | |
| 土壤保持—植被固碳 | - | 0.246 | 37.06 | 62.94 |
| 海拔 | 0.379 | 24.37 | 75.63 | |
| 坡度 | 0.369 | 25.15 | 74.85 | |
| 土地利用强度 | 0.413 | 21.68 | 78.32 |
注:相关系数显著性检验结果为p < 0.05。
对比生态系统服务之间的简单相关以及剔除极重要因子后二者净相关情况下的权衡/协同空间分布。结果表明,北京生态保护红线区内产水量与土壤保持之间存在由权衡向协同转变的区域,呈零星分布(图4)。同时,北京生态保护红线区27.86%的面积由协同转变为权衡,主要分布于东北部的水源涵养红线类型区和西南部的土壤保持红线类型区。产水量与植被固碳之间的协同关系较为稳定,剔除极重要因子后协同保持不变的区域占红线区的53.07%,协同转变为权衡的区域较少,集中分布于红线区北部。剔除极重要因子的影响后,产水量与植被固碳之间由权衡转变为协同的区域明显增加,主要分布于水源涵养红线类型区和生物多样性维护红线类型区,占市红线区面积的27.24%。
图4
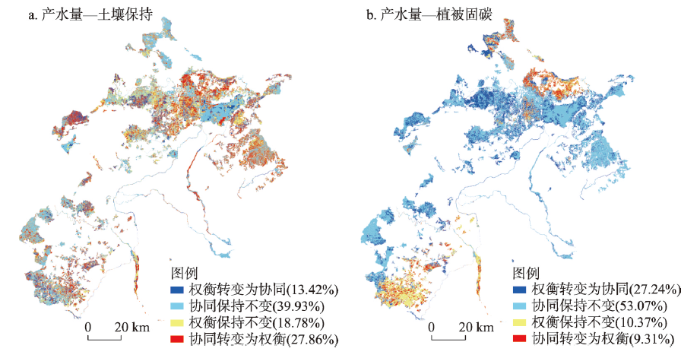
图4
对比简单相关与净相关情况下生态系统服务权衡/协同关系变化
Fig. 4
Comparing changes in ecosystem service trade-off/synergy relationship between simple and net correlations
3.4 环境变量与生态系统服务变量驱动力对比
表7比较了环境变量与生态系统服务变量两个维度对生态系统服务变化的影响。环境变量相比较,坡度、降水与土壤保持之间的相关系数均值最高,其次是海拔。剔除降水和土地利用强度的影响后,产水量与土壤保持之间的净相关系数均值不足0.1,表明环境变量对土壤保持的驱动力强于产水量。剔除土地利用强度的影响后,土壤保持与植被固碳之间的一阶偏相关系数略小于坡度与降水,表明土壤保持的空间变化与植被固碳的关系较为密切,但仍由环境变量所主导。产水量的时空变化受环境变量与服务变量两个维度的共同影响且相关系数相近。降水作为北方地区产水服务的重要补给,是影响产水量时空分布的主导环境变量。相关性分析的结果显示,降水与产水量之间的空间相关系数均值为0.599,且正相关面积占研究区总面积的90.99%。与其他环境变量相比,植被固碳服务与产水量之间的时空关系更为密切。表7显示,环境变量与植被固碳之间的相关性较强,空间相关系数均值由大到小排序为植被覆盖度>海拔>降水>坡度>土地利用强度。剔除极重要因子后,植被固碳与产水量之间的净相关系数均值为0.528,植被固碳与土壤保持之间的一阶偏相关系数(剔除土地利用强度后)均值为0.413,显著高于环境变量的影响,表明植被固碳的空间变化与其他两项服务变量密切相关。
表7 生态系统服务与影响变量的空间相关系数均值统计
Tab. 7
| 环境变量(p < 0.05) | 生态系统服务变量(净相关)(p < 0.05) | ||||||||
|---|---|---|---|---|---|---|---|---|---|
| 海拔 | 植被覆盖度 | 土地利用强度 | 降水 | 坡度 | 土壤保持 | 产水量 | 植被固碳 | ||
| 土壤保持 | 0.257 | 0.006 | 0.095 | 0.435 | 0.436 | - | 0.080 | 0.413* | |
| 产水量 | 0.014 | 0.048 | 0.129 | 0.599 | 0.090 | 0.080 | - | 0.528 | |
| 植被固碳 | 0.269 | 0.361 | 0.074 | 0.245 | 0.130 | 0.413* | 0.528 | - | |
注:由于海拔与坡度不随时间变化,土壤保持与植被固碳之间只计算一阶偏相关,*表示剔除土地利用强度后的一阶偏相关系数。
4 讨论
作为生态环境安全的底线,生态保护红线的划定是一项增强国家中心城市发展与生态保护良性互馈的宏观政策,是实现生态文明建设的重要举措[39]。生态保护红线在划定过程中需考虑土地利用现状和土地利用规划,同样,红线划定区域内生态系统服务的管理也需重视土地利用方式与程度。本文的研究结果表明,土地利用强度对土壤保持、产水量、植被固碳3项生态系统服务的空间分异具有主导决定力,同时也是3项服务两两之间空间关系的极重要因子。这一结果与Gao等[14]研究结果相一致:土地利用是北京生态保护红线区内产水量空间分布的主导因子。地理探测器中的风险探测器结果显示,林地类型区内3种生态系统服务的供给水平显著高于其他土地利用类型,印证了北京市“百万亩平原造林工程”的重要性。与此同时,耕地类型区内土壤保持量均值最低(39.16 t hm-2 a-1),仅为林地类型均值的1/12,表明北京生态保护红线区需重点关注耕地区域土壤保持功能的优化。
生态系统服务的时空变化具有复杂性和多样性且受多重变量的影响,Bennett等[5]将其总结为6种基本形式:环境变量驱动单一服务且服务之间不存在/存在单项作用/存在相互作用的3种情况,以及服务受共同驱动的影响且服务间不存在/存在单项作用/存在相互作用的3种情况。已有研究表明,山地地区的土壤保持、产水量、植被固碳之间的权衡关系对降水、植被覆盖度和海拔的梯度变化敏感[27];3项服务的空间权衡/协同关系在林地、湿地、耕地等土地利用类型中差异显著[43]。上述结论与本文中地理探测器识别出的极重要因子结果一致,印证了本文得出的3项生态系统服务属于服务之间存在相互作用且受共同驱动影响的结果。定量分离并对比两个维度的驱动力,结果表明,不同生态系统服务对于环境变量和服务间关系的响应程度有所差异[44-45]。土壤保持受环境变量的驱动更强,海拔和坡度与土壤保持呈正相关的区域占研究区总面积的64%以上,与前人的研究结果相似:随海拔和坡度的升高,北京市森林生态系统的土壤保持能力增加[46]。由于降水对产水服务的决定性影响以及水热资源分配对植被空间分布的显著控制作用[47-48],降水和植被固碳与产水量的时空变化密切相关,且两个维度的影响大致相当。研究表明,植被覆盖度与植被固碳量呈显著的正相关关系[49],本文相关性分析的结果也表明植被覆盖度与植被固碳之间的空间相关系数均值最大,且正相关的面积占红线区总面积的68.8%。与环境变量相比,两项服务变量与植被固碳之间的相关性更强,主要原因为土壤保持与产水服务可为植被生长与固碳提供养分、水分等决定性控制条件[50]。
本文考虑了北京市生态保护红线区3项典型生态系统服务,剔除了环境变量对服务间关系的影响,采用偏相关分析法定量分离并比较两个维度驱动力对生态系统服务的影响程度。偏相关分析的前提条件是两个变量同时与第三个变量相关时,将第三个变量的影响剔除,进而分析另外两个变量之间的净相关关系。本文限制于这一前提条件,仅分离了极重要因子对生态系统服务间关系的影响,一般重要因子对某一服务的影响施加在另一服务上的传递效应可待继续研究。同时,生态系统服务之间也会存在某一服务作为中介变量进而影响其他服务的情况,该链式传递效应也值得深入探究。
5 结论
本文从地理数据的空间异质性和空间相关性角度出发,定量识别北京生态保护红线区内土壤保持、产水量、植被固碳3项典型生态系统服务的影响因子,剔除极重要因子后分析服务间净相关关系的空间变化特征并与环境变量的影响进行对比,定量分离两个维度对生态系统服务的影响。主要结论如下:
(1)生态系统服务的空间变化受其他服务变量和环境变量的共同影响,且两类变量的交互作用强于单一变量的解释力。降水和土地利用强度是土壤保持与产水量空间分异性的极重要因子;植被覆盖度和土地利用强度的变化对产水量与植被固碳空间异质性的影响最大;地形因子(坡度、海拔)和土地利用强度是土壤保持与植被固碳空间异质性的极重要因子。
(2)降水在土壤保持与产水量的时空变化中发挥主导作用,剔除降水的影响后,权衡关系面积比例升高,协同转变为权衡的区域出现在北京东北部的水源涵养红线类型区和西南部的土壤保持红线类型区。产水量与植被固碳之间的净相关系数是二者简单相关系数的近3倍,且受植被覆盖度和土地利用的影响,产水量与植被固碳之间的权衡关系区域明显增多。控制海拔、坡度、土地利用强度任一因子均会抑制土壤保持与植被固碳之间权衡关系的产生。
(3)土壤保持的时空变化主要受环境变量(坡度和降水)所驱动。产水量与降水、植被固碳之间的相关性最强,且两个维度的影响大致相当。植被固碳的变化与其他两项服务的变化密切相关,而环境变量的影响相对较小。
参考文献
Assessing ecosystem service trade-offs and synergies: The need for a more mechanistic approach
DOI:10.1007/s13280-018-1127-7 URL [本文引用: 1]
Towards systematic analyses of ecosystem service trade-offs and synergies: Main concepts, methods and the road ahead
DOI:10.1016/j.ecoser.2017.07.012 URL [本文引用: 1]
The relevance of ecosystem services to land reform policies: Insights from South Africa
Understanding relationships among multiple ecosystem services
DOI:10.1111/j.1461-0248.2009.01387.x
PMID:19845725
[本文引用: 2]

Ecosystem management that attempts to maximize the production of one ecosystem service often results in substantial declines in the provision of other ecosystem services. For this reason, recent studies have called for increased attention to development of a theoretical understanding behind the relationships among ecosystem services. Here, we review the literature on ecosystem services and propose a typology of relationships between ecosystem services based on the role of drivers and the interactions between services. We use this typology to develop three propositions to help drive ecological science towards a better understanding of the relationships among multiple ecosystem services. Research which aims to understand the relationships among multiple ecosystem services and the mechanisms behind these relationships will improve our ability to sustainably manage landscapes to provide multiple ecosystem services.
Ecosystem service bundles for analyzing tradeoffs in diverse landscapes
DOI:10.1073/pnas.0907284107
PMID:20194739
[本文引用: 1]
A key challenge of ecosystem management is determining how to manage multiple ecosystem services across landscapes. Enhancing important provisioning ecosystem services, such as food and timber, often leads to tradeoffs between regulating and cultural ecosystem services, such as nutrient cycling, flood protection, and tourism. We developed a framework for analyzing the provision of multiple ecosystem services across landscapes and present an empirical demonstration of ecosystem service bundles, sets of services that appear together repeatedly. Ecosystem service bundles were identified by analyzing the spatial patterns of 12 ecosystem services in a mixed-use landscape consisting of 137 municipalities in Quebec, Canada. We identified six types of ecosystem service bundles and were able to link these bundles to areas on the landscape characterized by distinct social-ecological dynamics. Our results show landscape-scale tradeoffs between provisioning and almost all regulating and cultural ecosystem services, and they show that a greater diversity of ecosystem services is positively correlated with the provision of regulating ecosystem services. Ecosystem service-bundle analysis can identify areas on a landscape where ecosystem management has produced exceptionally desirable or undesirable sets of ecosystem services.
Ecosystem service synergies/trade-offs informing the supply-demand match of ecosystem services: Framework and application
Research progress and perspective on ecosystem services trade-offs
生态系统服务权衡研究进展
What factors affect the synergy and tradeoff between ecosystem services, and how, from a geospatial perspective?
The runoff generation simulation and its spatial variation analysis in Sanchahe basin as the south source of Wujiang
DOI:10.11821/dlxb201807007
[本文引用: 1]
Runoff generation is an important part of water conservation service, and also plays a critical role in soil and water retention. Under the background of the ecosystem degradation, which was caused by the vulnerable karst ecosystem combined with human activity, it is necessary to understand the spatial pattern and impact factors of runoff services in the karst region. The typical karst peak-cluster depression was selected as the study area. And the calibrated and verified Soil and Water Assessment Tool (SWAT) was one of the main techniques to simulate the runoff services of typical karst basin. Further, the spatial variability of different services were analyzed with the assistance of the methods of gradient analysis and local regression. Results indicated that the law of spatial difference was obvious. And the surface runoff was at a low level, but the groundwater runoff was rich (about 2-3 times the surface runoff). The runoff coefficients of total and groundwater were 70.0% and 23.9%, respectively. Terrain is a significant factor contributing to macroscopic control effect on the runoff service in the Sanchahe River Basin, where the total and groundwater runoff increased significantly with the rising elevation and slope. Then, the distribution of vegetation has great effects on surface runoff. There were spatial differences between the forest land in the upstream and orchard land in the downstream, in turn the surface runoff presented a turning point due to the influence of vegetation. Moreover, the results of spatial overlay analysis showed that the highest value of total and groundwater runoff was observed in the forest land. It is not only owing to the stronger capacity of soil water conservation of forest ecosystem, and geologic feature of rapid infiltration in this region, but also reflected the combined effects on the land cover types and topographical features, that is, forest land was mostly distributed in the area with relatively great elevation and slope. Overall, this study will promote the development and innovation of ecosystem services fields in the karst region, and further provide a theoretical foundation for ecosystem restoration and reconstruction.
基于SWAT模型模拟乌江三岔河生态系统产流服务及其空间变异
DOI:10.11821/dlxb201807007
[本文引用: 1]
产流是生态系统水源涵养服务的重要内容,也是保水固土等服务的关键驱动。脆弱的喀斯特生态系统叠加人类活动的影响引起生态退化,在此背景下亟需深刻理解喀斯特地区产流服务空间格局及其影响因子。选择典型的喀斯特峰丛洼地流域,基于率定校准的SWAT水文模型,对喀斯特流域产流服务(包括地表、地下以及总径流量)进行模拟,并结合空间梯度分析和局部回归模型,剖析不同服务变量的空间变异特征。结果表明:研究区产流量空间分异规律明显,总径流系数约为70.0%;地表径流整体处于较低水平,地下径流量丰富(约为地表径流量的2~3倍)。地形因子对喀斯特流域产流服务具有宏观控制作用,随海拔和坡度升高,总径流量、地下径流量显著增加;植被分布特征对地表径流有重要影响,在上游林地和下游园地分布区存在空间差异,在植被因素的影响下随坡度的增加呈现转折性的变化趋势。此外,空间叠加分析表明林地总径流及地下径流最大:一方面是由于森林生态系统更强的土壤水分涵养能力以及水分快速入渗的地质背景特征;另一方面反映了地表覆盖与地形特征的复合效应,即林地大多分布在相对海拔和坡度较大之处。本文有助于推进喀斯特生态系统服务研究领域的发展与创新,并为生态恢复建设提供科技支撑。
Ecosystem service trade-offs and their influencing factors: A case study in the Loess Plateau of China
DOI:10.1016/j.scitotenv.2017.07.079 URL [本文引用: 1]
Identification of ecosystem service bundles and driving factors in Beijing and its surrounding areas
Identification of dominant factors affecting soil erosion and water yield within ecological red line areas
Investigating the compounding effects of environmental factors on ecosystem services relationships for the ecological conservation red line areas
DOI:10.1002/ldr.4059 URL [本文引用: 2]
Spatial interactions among ecosystem services in an urbanizing agricultural watershed
DOI:10.1073/pnas.1310539110
PMID:23818612
[本文引用: 1]
Understanding spatial distributions, synergies, and tradeoffs of multiple ecosystem services (benefits people derive from ecosystems) remains challenging. We analyzed the supply of 10 ecosystem services for 2006 across a large urbanizing agricultural watershed in the Upper Midwest of the United States, and asked the following: (i) Where are areas of high and low supply of individual ecosystem services, and are these areas spatially concordant across services? (ii) Where on the landscape are the strongest tradeoffs and synergies among ecosystem services located? (iii) For ecosystem service pairs that experience tradeoffs, what distinguishes locations that are "win-win" exceptions from other locations? Spatial patterns of high supply for multiple ecosystem services often were not coincident; locations where six or more services were produced at high levels (upper 20th percentile) occupied only 3.3% of the landscape. Most relationships among ecosystem services were synergies, but tradeoffs occurred between crop production and water quality. Ecosystem services related to water quality and quantity separated into three different groups, indicating that management to sustain freshwater services along with other ecosystem services will not be simple. Despite overall tradeoffs between crop production and water quality, some locations were positive for both, suggesting that tradeoffs are not inevitable everywhere and might be ameliorated in some locations. Overall, we found that different areas of the landscape supplied different suites of ecosystem services, and their lack of spatial concordance suggests the importance of managing over large areas to sustain multiple ecosystem services.
Geodetector: Principle and prospective
DOI:10.11821/dlxb201701010
[本文引用: 2]
Spatial stratified heterogeneity is the spatial expression of natural and socio-economic process, which is an important approach for human to recognize nature since Aristotle. Geodetector is a new statistical method to detect spatial stratified heterogeneity and reveal the driving factors behind it. This method with no linear hypothesis has elegant form and definite physical meaning. Here is the basic idea behind Geodetector: assuming that the study area is divided into several subareas. The study area is characterized by spatial stratified heterogeneity if the sum of the variance of subareas is less than the regional total variance; and if the spatial distribution of the two variables tends to be consistent, there is statistical correlation between them. Q-statistic in Geodetector has already been applied in many fields of natural and social sciences which can be used to measure spatial stratified heterogeneity, detect explanatory factors and analyze the interactive relationship between variables. In this paper, the authors will illustrate the principle of Geodetector and summarize the characteristics and applications in order to facilitate the using of Geodetector and help readers to recognize, mine and utilize spatial stratified heterogeneity.
地理探测器: 原理与展望
DOI:10.11821/dlxb201701010
[本文引用: 2]
空间分异是自然和社会经济过程的空间表现,也是自亚里士多德以来人类认识自然的重要途径。地理探测器是探测空间分异性,以及揭示其背后驱动因子的一种新的统计学方法,此方法无线性假设,具有优雅的形式和明确的物理含义。基本思想是:假设研究区分为若干子区域,如果子区域的方差之和小于区域总方差,则存在空间分异性;如果两变量的空间分布趋于一致,则两者存在统计关联性。地理探测器q统计量,可用以度量空间分异性、探测解释因子、分析变量之间交互关系,已经在自然和社会科学多领域应用。本文阐述地理探测器的原理,并对其特点及应用进行了归纳总结,以利于读者方便灵活地使用地理探测器来认识、挖掘和利用空间分异性。
Spatial heterogeneity and its changes of population on the two sides of Hu Line
DOI:10.11821/dlxb201701012
[本文引用: 1]
Hu Line uncovers one of China's most important characteristics of population paper distribution: East is dense, while west is sparse. Different from most previous research, this paper examined the differentiation and changes of population distribution on both sides of Hu Line from a perspective of spatial stratified heterogeneity instead. Geodetector was employed based on the spatial database of China's census data of 1953, 1982, 1990, 2000 and 2010 to reconfirm spatial position of Hu Line and analyzed changes of spatial stratified heterogeneity of population between southeast and northwest sides of Hu Line in different periods. Changes of population distribution since the founding of New China were found and the reasons for these changes were discussed. Major findings include: (1) From the spatial stratified heterogeneity perspective, Hu Line could be improved and optimized, at least, in some periods. Although the ratio of total population on both sides of Hu Line has roughly been kept at 94:6 since 1953, spatial stratified heterogeneity of population between the two sides (the southeastern side: the northwestern side) increased when Hu Line moves to south slightly in 1953, 2000 and 2010, which means population distribution was more homogeneous within either southeastern or northwestern region and heterogeneity was more remarkable between the two regions. (2) Heterogeneity decreased gradually since the reform and opening up. We found characteristics of population distribution converged on the two sides, especially since the 1990s when convergence between the two sides became apparent. This finding is significantly different from the conclusion of "remain unchanged" from most literatures. The reasons why heterogeneity reduced were: pattern of population distribution on the southeastern side changed from relatively even distribution among cities before 1990 to agglomeration in a few huge cities after 2000, while the degree of spatial agglomeration of population decreased slightly after the reform on the northwestern side. These changes have been confirmed by the analysis from cumulative distribution function and Gini coefficient. (3) On the whole, the effect of economic factors on population distribution has become more and more important, while the effect of natural environment and institution reduced. Combined effect from economic development, natural environment and institution resulted in two opposite directions of changes of population spatial distribution on the two sides. It should be emphasized that although general effect of natural environment has decreased, some natural factors, such as Three Gradient Terrains, still have significantly influence on population distribution in China.
胡焕庸线两侧人口的空间分异性及其变化
DOI:10.11821/dlxb201701012
[本文引用: 1]
胡焕庸线作为人地关系的重要地理大发现之一,揭示了中国人口分布东密西疏的重要特征,是人文与经济地理学对社会的重要贡献之一。本文采用地理探测器等定量方法,以人口普查数据为基础,对胡焕庸线两侧人口分布的分异性特征进行了深入讨论,并尝试解释中国人口分布特征变化的原因及其机制。结果表明:① 胡焕庸线作为中国最重要的人口分界线仍基本保持稳定,但从空间统计学分异特征来看该分界线仍可进一步优化调整;② 胡焕庸线两侧内部人口集聚模式发生着明显变化,东南半壁人口分布由改革开放之前和初期的相对均衡状态,转变为以长三角、珠三角等少数区域为中心的集聚模式;而西北半壁人口分布的集聚程度则趋于下降;③ 从人口空间分布的影响因素看,尽管总体上,经济发展类因素对于人口空间分布影响不断增强,但三大阶梯等自然地理本底条件依然对中国人口分布有着重要影响。
Environmental determinants impacting the spatial heterogeneity of karst ecosystem services in southwest China
DOI:10.1002/ldr.3815 URL [本文引用: 1]
Geographical detectors-based health risk assessment and its application in the neural tube defects study of the Heshun region, China
DOI:10.1080/13658810802443457 URL [本文引用: 1]
Fragility of mountain ecosystem and desertification
山地生态系统的脆弱性与荒漠化
China's ecological civilization program: Implementing ecological redline policy
DOI:10.1016/j.landusepol.2018.10.031
[本文引用: 1]
China is one of the first countries to explicitly attempt to institute coordinated, ecosystem-based management across local, regional, and national scales. Chinese scientists have been urging policymakers to manage landscapes using the ecosystem services (ESs) approach. However, substantive progress remains elusive due to lack of coordination, weak monitoring, and poor enforcement. China's new ecological redline policy (ERP) requires policymakers and scientists to address urgent challenges in China that have global implications. This work can advance international understanding of the institutional reforms and scientific capacities needed to move from theory to practice on sustainable development. We begin this paper by providing an overview of the concepts, major reforms, timeline, and guidelines on drawing ecological conservation redlines (ECRs) and ERP processes in China. We then summarize and comment on the scientific challenges in ESs assessments for spatial land planning and discuss the need for a framework grounded in a policy context that relates ecosystem area to ESs, stressors, and biodiversity indicators. Based on this, we draw insights into creating such a framework to offer strategic support for scientists and policymakers in improving the measurement and valuation of ESs for effective implementation of ERP for sustainable development. We also identify a need for more studies on ecological production functions to provide relevant information for managers and economists in evaluating ERP efforts and tracking ESs trends.
Trade-offs between ecosystem services in a mountain region
Ecological and land use studies along elevational gradients
DOI:10.1659/0276-4741(2007)27[58:EALUSA]2.0.CO;2 URL [本文引用: 1]
Trade-off analyses of multiple mountain ecosystem services along elevation, vegetation cover and precipitation gradients: A case study in the Taihang Mountains
DOI:10.1016/j.ecolind.2019.03.034 URL [本文引用: 2]
A review of the (Revised) Universal Soil Loss Equation ((R)USLE): With a view to increasing its global applicability and improving soil loss estimates
DOI:10.5194/hess-22-6059-2018 URL [本文引用: 1]
An approximation of the rainfall factor in the universal soil loss equation//De Boodt M, Gabriels D. Assessment of Erosion
The EPIC crop growth-model
DOI:10.13031/2013.31032 URL [本文引用: 1]
Improving the global applicability of the RUSLE model-adjustment of the topographical and rainfall erosivity factors
DOI:10.5194/gmd-8-2893-2015 URL [本文引用: 1]
Study of applying USLE and geographical information system IDRISI to predict soil erosion in small watershed
应用USLE模型与地理信息系统IDRISI预测小流域土壤侵蚀量的研究
Estimating soil erosion in North China Plain based on RS/GIS and RUSLE
基于RS/GIS和RUSLE的华北平原土壤侵蚀现状分析
InVEST+VERSION+User's Guide
Simulation of maximum light use efficiency for some typical vegetation types in China
中国典型植被最大光利用率模拟
Spatio-temporal characteristics of the trade-off and synergy relationships among multiple ecosystem services in the upper reaches of Hanjiang River Basin
DOI:10.11821/dlxb201711011
[本文引用: 1]
The research on the interactions among multiple ecosystem services (ES) is a hotspot. Most of the previous studies focused on the qualitative description of ES interactions, however, there have been relatively few studies on spatially explicit and quantitative assessment of ES interactions. In this paper, we mapped the ecosystem service of soil conservation (SC), net primary production (NPP) and water yield (WY) in the upper reaches of Hanjiang River Basin (URHR) based on the land use and land cover (LULC), NDVI, soil properties and observed climate data covering 2000-2013. Moreover, we quantitatively assessed the variation characteristics of interactions among different ES with a spatio-temporal statistical framework by applying the partial correlation analysis at a pixel scale. The results are shown as follows: (1) From 2000 to 2013, the mean annual SC was 434.20 t·hm-2·yr-1, and the mean annual WY was 250.34 mm. They also presented a rising tendency at the rate of 16.10 t·hm-2·yr-1 and 3.79 mm·yr-1, respectively. However, the mean annual NPP was 854.11 gC·m-2·yr-1, and presented a decreasing tendency at the rate of 8.54 gC·m-2·yr-1. (2) Spatially, SC was high in the North-South mountain area, while it was low in the Middle valley region. Similarly, the NPP in the Middle valley region was lower than that of other regions. However, the WY increased from north to south. (3) The three pairwise ES presented different interactions. Both the interaction between SC and NPP and that between SC and WY presented as trade-off, accounting for 62.77% and 71.60% of the total area, respectively. On the contrary, the interaction between NPP and WY was prone to synergies, accounting for 62.89% of the total area. (4) Pairwise ES in different land cover types also presented a different interaction. As for woodland, wetland, cropland, artificial land and bare land, SC and NPP, as well as SC and WY both presented trade-off, while WY and NPP presented synergy. Specially, in grassland, all the three pairwise ES presented a trade-off relationship. Therefore, spatially explicit and quantitative assessment of ES interactions are more helpful for revealing the temporal non-linear evolution, and the spatial heterogeneity of ES interactions. This analysis framework also contributes to the regional sustainable land management and the optimization of multiple ES conservation.
汉江上游生态系统服务权衡与协同关系时空特征
DOI:10.11821/dlxb201711011
[本文引用: 1]
多种生态系统服务之间的相互关系研究是生态系统服务研究的热点问题。目前,有关多种生态系统服务权衡与协同的研究多停留在定性描述阶段,缺乏具备空间位置信息的定量研究。综合土地利用、NDVI、土壤类型、气象等多源数据,对汉江上游流域2000-2013年的土壤保持服务、产水服务、植被碳固定(NPP)服务进行空间制图,并基于逐像元偏相关的时空统计制图方法,对三种生态系统服务之间的权衡与协同关系时空变化进行分析。结果表明:① 2000-2013年,汉江上游多年平均土壤保持量为434.20 t·hm<sup>-2</sup>·yr<sup>-1</sup>,且多年来以16.10 t·hm<sup>-2</sup>·yr<sup>-1</sup>速率递增。多年平均产水量为250.34 mm,多年递增速率为3.79 mm·yr<sup>-1</sup>。NPP多年平均值为854.11 gC·m<sup>-2</sup>·yr<sup>-1</sup>,多年递减速率为8.54 gC·m<sup>-2</sup>·yr<sup>-1</sup>。② 汉江上游土壤保持量在空间上呈现出“南北山地高,河谷盆地低”的分布格局;植被NPP在空间上表现为汉江河谷地带低,其余地方高的态势;产水服务在空间上呈现由北向南递增的分布规律。③ 整个汉江上游流域土壤保持与NPP、土壤保持与产水服务均以权衡关系为主,权衡关系区域的面积占比分别达到62.77%和71.60%;NPP与产水服务以协同关系为主,协同关系的面积占比达到62.89%。④ 林地、湿地、耕地、人工表面及裸地中,土壤保持与NPP服务、土壤保持与产水服务在空间上以权衡关系为主,产水与NPP服务在空间上以协同关系为主;而草地表现为三种服务两两之间均以权衡关系为主。定量评估生态系统服务相互关系的时空特征,有利于研究生态系统服务之间相互关系在时间上的非线性变化以及空间上的分布异质性,对区域土地管理与生态系统服务优化具有重要的指导意义。
Effects and mechanisms of plant roots on slope reinforcement and soil erosion resistance: A research review
Plant roots play an important role in resisting the shallow landslip and topsoil erosion of slopes by raising soil shear strength. Among the models in interpreting the mechanisms of slope reinforcement by plant roots, Wu-Waldron model is a widely accepted one. In this model, the reinforced soil strength by plant roots is positively proportional to average root tensile strength and root area ratio, the two most important factors in evaluating slope reinforcement effect of plant roots. It was found that soil erosion resistance increased with the number of plant roots, though no consistent quantitative functional relationship was observed between them. The increase of soil erosion resistance by plant roots was mainly through the actions of fiber roots less than 1 mm in diameter, while fiber roots enhanced the soil stability to resist water dispersion via increasing the number and diameter of soil water-stable aggregates. Fine roots could also improve soil permeability effectively to decrease runoff and weaken soil erosion.
植物根系固坡抗蚀的效应与机理研究进展
NPP spatial and temporal pattern of vegetation in Beijing and its factor explanation based on CASA model
基于CASA模型的北京植被NPP时空格局及其因子解释
Effects of land use, land cover and rainfall regimes on the surface runoff and soil loss on karst slopes in southwest China
DOI:10.1016/j.catena.2011.11.001 URL [本文引用: 1]
Spatial-temporal changes in ecosystem services and the trade-off relationship in mountain regions: A case study of Hengduan Mountain region in Southwest China
Impacts of forest cover change on ecosystem services in high Andean mountains
DOI:10.1016/j.ecolind.2014.07.043 URL [本文引用: 1]
Trade-offs among ecosystem services in a typical Karst watershed, SW China
Creating win-wins from trade-offs? Ecosystem services for human well-being: A meta-analysis of ecosystem service trade-offs and synergies in the real world
DOI:10.1016/j.gloenvcha.2014.07.005 URL [本文引用: 1]
A quantitative review of relationships between ecosystem services
DOI:10.1016/j.ecolind.2016.02.004 URL [本文引用: 1]
Comprehensive assessment of soil conservation capacity of forest ecosystems in Beijing
北京市森林生态系统土壤保持能力的综合评价
Analyzing spatio-temporal changes and trade-offs to support the supply of multiple ecosystem services in Beijing, China
DOI:10.1016/j.ecolind.2018.06.049 URL [本文引用: 1]
Revealing the climatic impacts on spatial heterogeneity of NDVI in China during 1982-2013
DOI:10.11821/dlxb201903010
[本文引用: 1]
Climate change is a major driver of vegetation activity, and thus its complex processes become a frontier and difficulty in global change research. To understand the complex relationship between climate change and vegetation activity, the spatial distribution and dynamic characteristics of the response of NDVI to climate change from 1982 to 2013 in China were investigated by the geographically weighted regression (GWR) model. The GWR was run based on the combined datasets of satellite vegetation index (GIMMS NDVI) and climate observation (temperature and moisture) from meteorological stations nationwide. The results noted that the spatial non-stationary relationship between NDVI and surface temperature has appeared in China. The significant negative temperature-vegetation relationship was distributed in northeast, northwest and southeast parts of the country, while the positive correlation was more concentrated from southwest to northeast. And then, by comparing the normalized regression coefficients for different climate factors, regions with moisture dominants for NDVI were observed in North China and the Tibetan Plateau, and regions with temperature dominants for NDVI were distributed in the East, Central and Southwest China, where the annual mean maximum temperature accounts for the largest areas. In addition, regression coefficients between NDVI dynamics and climate variability indicated that the higher warming rate could result in the weakened vegetation activity through some mechanisms such as enhanced drought, while the moisture variability could mediate the hydrothermal conditions for the variation of vegetation activity. When the increasing rate of photosynthesis exceeded that of respiration, there was a positive correlation between vegetation dynamics and climate variability. However, the continuous and dynamic responding process of vegetation activity to climate change will be determined by spatially heterogeneous conditions in climate change and vegetation cover. Furthermore, the description of climate-induced vegetation activity from its rise to decline in different regions is expected to provide a scientific basis for initiating ecosystem-based adaptation strategies in response to global climate change.
1982—2013年中国植被NDVI空间异质性的气候影响分析
DOI:10.11821/dlxb201903010
[本文引用: 1]
为研究气候变化与植被活动之间的复杂关系,采用1982-2013年GIMMS NDVI与气象站点温度与水分的监测资料,应用基于像元的地理加权回归方法,探究了中国植被NDVI及其动态特征对气候变化响应的空间格局。中国植被NDVI与地表温度呈空间非平稳关系,在空间上的负相关关系主要集中在东北、西北及东南部分地区,空间正相关则更为集中和连片;针对不同气候指标的标准化系数对比可知,植被NDVI受水分控制作用较为显著的区域主要集中在北方地区以及青藏高原,温度的主导作用区域则分布在华东、华中及西南地区,其中年均最高气温对NDVI的主导区域范围最广;植被NDVI动态与气候变率的回归结果表明,增温速率的升高会通过加剧干旱等机制对植被活动产生抑制作用,水分变率对植被活动的强弱起到了重要的调节作用。
GIS-based analysis for hotspot identification of tradeoff between ecosystem services: A case study in Yanhe Basin, China
DOI:10.1007/s11769-016-0816-z URL [本文引用: 1]
Revealing ecosystem services relationships and their driving factors for five basins of Beijing
DOI:10.1007/s11442-021-1835-y
[本文引用: 1]
A clear understanding of the relationships among multiple ecosystem services (ESs) is the foundation for sustainable urban ecosystem management. Quantitatively identifying the factors that influence ES trade-offs and synergies can contribute to deepening ES research, from knowledge building to decision making. This study simulated soil conservation, water yield and carbon sequestration in Beijing, China, from 2015-2018. The spatial trade-offs and synergies of these three ESs within the five major river basins in Beijing were explored using geographically weighted regression. Furthermore, geographical detector was applied to quantitatively identify the driving mechanism of the environmental factors for the ES trade-offs and synergies. The results show the following: (1) the spatial relationships between soil conservation and water yield, as well as between water yield and carbon sequestration, were mainly trade-offs. There was a spatial synergy between soil conservation and carbon sequestration. (2) Regarding the spatial trade-off/synergy between soil conservation and water yield in Beijing, the dominant influencing factor was temperature/elevation, and the dominant interactions of the spatial trade-off and synergy between these two ESs in Beijing and the Chaobai River Basin are all manifested in the superposition of precipitation and potential evapotranspiration, temperature, and elevation. (3) Topographic factors were the dominant factors influencing the spatial relationship between soil conservation and carbon sequestration in Beijing and its five major river basins. As a result of the distribution of water systems and hydrological characteristics of the basins, differences were observed in the effects of different combinations of interaction factors on the spatial relationship between these two ESs in different basins. (4) Temperature had the strongest explanatory power in terms of the spatial trade-offs and synergies between water yield and carbon sequestration. The interactions between precipitation and temperature and between precipitation and elevation were the dominant interactions affecting the spatial relationship between water yield and carbon sequestration in Beijing. Overall, the explanatory power of influencing factors on the trade-offs and synergies and the degree of interaction between factors coexist in different basins with consistency and differences. Therefore, understanding the quantitative characteristics of basin-scale spatial trade-offs and synergies between ESs is important for ecosystem management and the promotion of synergy in different basins.
